

Analyses of three-dimensional (3D) data are increasingly widespread in paleoanthropology, bioanthropology, bioarchaeology, and archaeology (Adams et al. Reference Adams, James Rohlf and Slice2013; Friess Reference Friess2012; Shott Reference Shott2014; Slice Reference Slice2007; Tocheri Reference Tocheri, Sensen and Hallgrímsson2009). With advances in virtual anthropology (for a review, see Weber Reference Weber2015), studies have begun to stray from traditional linear methods (e.g., caliper distances), and 3D data collection methods are regularly employed to include surface scanning (laser, structured light, etc.), computed tomographic (CT) imaging (Franklin et al. Reference Franklin, Swift and Flavel2016), and MicroScribe data (Menéndez Reference Menéndez2017). The fusion of traditional and geometric morphometrics is similarly a topic of considerable interest (Robinson and Terhune Reference Robinson and Terhune2017).
Three-dimensional data exhibit several advantages over traditional caliper measurements. For instance, CT imaging captures data associated with internal structures (e.g., paranasal sinuses; Butaric Reference Butaric2015; Rae and Koppe Reference Rae, Koppe, Marfart and Delingette2002) or diploë/trabecular bone patterning (e.g., Chirchir et al. Reference Chirchir, Ruff, Junno and Potts2017; Copes and Kimbel Reference Copes and Kimbel2016). Advanced geometric morphometric methods can be applied to any 3D mesh, in some cases capturing more variation with shape data compared to linear measures (Bookstein et al. Reference Bookstein, Slice, Gunz and Mitteroecker2004; Gunz and Mitteroecker Reference Gunz and Mitteroecker2013). Distorted and/or fragmentary fossils and cultural materials can be virtually reconstructed prior to analysis (Balzeau et al. Reference Balzeau, Crevecoeur, Rougier, Froment, Gilissen, Grimaud-Hervé, Mennecier and Semal2010; Godinho and O'Higgins Reference Godinho, O'Higgins, Errickson and Thompson2017; Gunz et al. Reference Gunz, Mitteroecker, Neubauer, Weber and Bookstein2009; White Reference White2015; Zollikofer and Ponce de Leon Reference Zollikofer and de Leon2005). Those data associated with scanned objects can be digitally curated for future use and shared through digital repositories (e.g., MorphoSource, Open Science Framework [OSF], GitHub, Figshare, Zenodo, the Open Research Scan Archive [ORSA], Open Context, the Digital Archaeological Record [tDAR], or virtual museum collections; Bruno et al. Reference Bruno, Bruno, De Sensi, Luchi, Mancuso and Muzzupappa2010; Isler et al. Reference Isler, Wilson and Bajcsy2006; Kuzminsky and Gardiner Reference Kuzminsky and Gardiner2012; Selden et al. Reference Selden, Dockall and Dubied2020, Reference Selden and Jones2021; Selden, Perttula et al. Reference Selden, Means, Lohse, Koenig and Black2014; Shearer et al. Reference Shearer, Cooke, Halenar, Reber, Plummer, Delson and Tallman2017).
The latter point is of particular interest because it minimizes the need to handle fragile specimens, saves time and fiscal resources for researchers and museum/collection personnel, fosters the advancement of next-generation research through ease of sharing, encourages collaboration among researchers and institutions, and can increase accessibility to the general public (Allison Reference Allison2008; Douglass et al. Reference Douglass, Kuhnel, Magnani, Hittner, Chodoronek and Porter2017; Means Reference Means2015, Reference Means2017; Selden, Means et al. Reference Selden, Means, Lohse, Koenig and Black2014; Wachowiak and Karas Reference Wachowiak and Karas2013; Weber Reference Weber2015). Virtual databases have allowed for the continuation of research during the COVID-19 pandemic, during which time museum travel—and travel in general—has largely been limited or restricted. It stands to reason that as the number of data-sharing endeavors increases, efforts to incorporate 3D data collected and processed using different modalities will increase as well. When mixing digitally rendered meshes generated from CT and surface scan data—or even different scanners within the same modality, such as between different 3D laser scanners—the question of whether those meshes are directly comparable is of considerable importance.
Consequently, numerous studies have investigated quality control and reliability by comparing digital and linear measures taken using various modalities (Fourie et al. Reference Fourie, Damstra, Gerrits and Ren2011; Stephen et al. Reference Stephen, Wegscheider, Nelson and Dickey2015; Stull et al. Reference Stull, Tise, Ali and Fowler2014). For example, when comparing CT and traditional caliper-collected data among skeletal studies, linear distances obtained from CT scans were found to be as reliable as those collected by hand (Koppe and Nagai Reference Koppe, Nagai, Radlanski and Renz1995; Koppe and Schumacher Reference Koppe and Schumacher1992; Márquez and Laitman Reference Márquez and Laitman2008; Montgomery et al. Reference Montgomery, Vig, Staab and Matteson1979; Zonneveld et al. Reference Zonneveld, Spoor and Wind1989). Similar results have been undertaken to compare caliper measures to data collected with MicroScribes (Menéndez Reference Menéndez2017; Stephen et al. Reference Stephen, Wegscheider, Nelson and Dickey2015) and laser scanners (Evgenikou and Georgopoulos Reference Evgenikou and Georgopoulos2015). Additional studies have investigated inter-methodological reliability in the collection of landmarks and distances among different sources (Algee-Hewitt and Wheat Reference Algee-Hewitt and Wheat2016; Katz and Friess Reference Katz and Friess2014; Shearer et al. Reference Shearer, Cooke, Halenar, Reber, Plummer, Delson and Tallman2017; Sholts et al. Reference Sholts, Flores, Walker and Wärmländer2011; Tzou et al. Reference Tzou, Artner, Pona, Hold, Placheta, Kropatsch and Frey2014). For example, Robinson and Terhune (Reference Robinson and Terhune2017) tested both inter-observer and inter-method error rates in a mixed-method study. Even though they specifically found that inter-method error rates overlapped with normal levels of variance among their samples, the authors cautioned researchers when using data compiled from multiple observers and technologies.
Although they are informative for a wide range of methodological techniques, analyses rarely investigate or discuss the importance of differential post-processing. Even though Robinson and Terhune (Reference Robinson and Terhune2017:64) were exhaustive in capturing inter-observer and inter-method error rates using four data collection methods to analyze variance at multiple levels, the details of their post-processing techniques are scarce. Furthermore, they mention that when processing microCT data, the “thresholding tool was employed to remove extraneous material from the scans [and was] manually adjusted until only bone [was] selected” (Robinson and Terhune Reference Robinson and Terhune2017:64). Although they assume this subjective method would not have a significant impact on the morphology of the external surface bone, it was conceded that differences in the effect of thresholding settings are worthy of further investigation (Robinson and Terhune Reference Robinson and Terhune2017:64).
More recently, Stock and colleagues (Reference Stock, Garvin, Corron, Hulse, Cirillo, Klales, Colman and Stull2020) investigated the effects of different processing techniques in segmentation of CT scans when modeling human pelvic bones. Ultimately, these authors noted that a small degree in varying threshold levels do not significantly alter measures on the 3D models. More important, they found that a consistent methodological approach across observers for segmentation and smoothing techniques is essential for precise data collection. They further note the need for additional error-based studies to test for quality control in using digitally derived data.
This investigation builds on recent efforts to explore variation introduced by different modalities of 3D scanners (Shearer et al. Reference Shearer, Cooke, Halenar, Reber, Plummer, Delson and Tallman2017), and the purpose of the current study is to assess whether meshes generated by CT and surface scanners can be pooled together for mixed-method studies as a means of increasing sample sizes—and if so, whether specific post-processing techniques should be followed. Given that several recent studies investigate inter-observer and inter-method error rates using linear dimensions (for a recent review, see Robinson and Terhune Reference Robinson and Terhune2017), we focus solely on post-processing techniques of 3D data.
METHODS
This study focused on post-processing techniques for a single object using two primary 3D data-capturing technologies: CT and surface (structured light) scans. The specimen used in the analysis is a mandible from the Mesolithic Wadi Halfa Collection (B11-2-15904). Original data collection involved CT and surface scanning of the Wadi Halfa Collection for a larger, ongoing project investigating the evolutionary craniofacial changes of these individuals and neighboring populations. During the development of that larger project, questions regarding mixed-modalities in image processing developed, leading to the current project. This mandible, versus other cranial bones, was chosen for the current study based on its complex geometry (including a broken condyle) and varying matrix densities (bone vs. enamel), which may impact CT-processing techniques.
The Wadi Halfa remains, as represented by the mandible presented here, were excavated with the full support of the Sudanese government from 1963 to 1964. This excavation was funded by the then largest international (UNESCO) salvage program ever assembled. Following its recovery and subsequent analyses, the osteological material was safely and securely housed at University of Colorado Boulder, where only qualified scholars were allowed access to it. In 2018, the Wadi Halfa Mesolithic collection was moved to Arizona State University, where it is housed today. For extensive background information on the collection and excavation, see Greene and Armelagos (Reference Greene and Armelagos1972).
CT Scanning and Processing
Scanning of the mandible was conducted at the Department of Radiology, Anschutz Medical Campus of University of Colorado Denver, using a Philips Gemini TF TOG 64 CT scanner with the following parameters: kVp140 mA30, 152FOV, and 0.625 mm slice thickness. Resulting files were saved as 16-bit DICOMs using VGStudio 2.2.
Although often ignored (for an exception, see Stock et al. Reference Stock, Garvin, Corron, Hulse, Cirillo, Klales, Colman and Stull2020), post-processing is a particularly important step in the analysis of CT images. Several studies have demonstrated that selecting the appropriate window level and thresholding technique is vital for creating accurate 3D models of the original item (Schwartz et al. Reference Schwartz, Thackeray, Reid and van Reenan1998; Spoor et al. Reference Spoor, Zonneveld and Macho1993; Ullrich et al. Reference Ullrich, Binet, Sanecki and Kieffer1980). There are various parameters and steps associated with CT post-processing that are dependent on material type (for step-by-step reviews, see Spoor et al. Reference Spoor, Jeffery, Zonneveld, O'Higgins and Cohn2000; Weber and Bookstein Reference Weber and Bookstein2011). As a result, scanning parameters may differ if one is investigating bony elements versus denser elements such as enamel or fossil matrix. This process is further confounded when analyzing an object with mixed materials, such as crania and mandibles that contain both bone and enamel. Additional post-processing of the mesh involves the decision to apply a smoothing factor (or not), to simplify the mesh (or not) to reduce the number of poly-faces in the mesh, and to remove additional artifacts (or not) from the mesh.
A total of eight isosurface meshes were rendered from the CT scan data in Amira 5.6 (Stalling et al. Reference Stalling, Westerhoff, Hege, Hansen and Johnson2005) using different post-processing techniques (Table 1). Differences in mesh creation were based on variable threshold levels and the application, or not, of a smoothing technique. CT images are represented by 3D stacks of pixels—that is, voxels, where varying shades of gray related to the degree of radiation intensity are assigned numeric values called Hounsfield units. In most cases, materials with the lowest densities (typically air) appear as darker grays or black and are represented by low numeric values, whereas materials with higher densities (e.g., bone, enamel, fossilised matrix, etc.) are usually lighter gray to white and are represented by higher numeric values (Prossinger et al. Reference Prossinger, Seidler, Wicke, Weaver, Recheis, Stringer and Müller2003; Spoor et al. Reference Spoor, Jeffery, Zonneveld, O'Higgins and Cohn2000). The lighter gray and white values of bone are not always easy to distinguish from the darker gray and black values of air. This is because slightly varying shades can be challenging for the human eye to decipher, resulting in blurred versus sharp air-to-bone (or other material) boundaries (Weber and Bookstein Reference Weber and Bookstein2011).
Isosurface Thresholds Used in the Analysis.

a Removed underlying towel and artifacts while keeping object visible.
Subjectively deciding where the air-to-bone boundary exists can result in artificial size differences among CT scan data. Therefore, the first step in creating accurate 3D meshes is to identify air versus the object in question (e.g., bone, rock/clay, etc.) through establishing a thresholding parameter. A higher threshold number results in less of the object being rendered (creating artificially thin areas and/or holes), whereas a lower threshold number results in more aspects of the object being rendered (perhaps artificially bloating or increasing the size of the object). To address this, the half-maximum-height (HMH) technique was previously developed to determine this boundary objectively (Schwartz et al. Reference Schwartz, Thackeray, Reid and van Reenan1998; Spoor et al. Reference Spoor, Zonneveld and Macho1993; Ullrich et al. Reference Ullrich, Binet, Sanecki and Kieffer1980). This technique averages the minimum and maximum values for the CT number across the boundary in question (e.g., air-bone, enamel-dentin). The number—essentially the midpoint value—is used to discriminate between air and bone, or other materials of interest, objectively. Consequently, when creating a mesh, all voxels corresponding to that threshold parameter will remain in the mesh, whereas voxels lower than that number will effectively be removed.
Four thresholding techniques were applied to create isosurfaces in Amira, using the isosurface tool. An isosurface represents a mesh of polygons that corresponds to grayscale values within the set thresholding parameters. It is important to note that, much like in surface scanning, isosurfaces only render external elements of the object. For meshes 1 and 2 (abbreviated as M1 and M2 in Table 1) a neutral threshold value of 0 was used so that any voxel lower than 0 was not rendered into the isosurface. This is the random, default setting in Amira. For meshes 3 and 4 (M3, M4) a threshold of −500 was applied. This threshold was subjectively determined in Amira to remove the underlying towel and CT-scanner bed (lower density objects) on which the mandible rested, while keeping the mandibular elements visible. The remaining two thresholding parameters for meshes 5–8 (M5–M8) were determined using the HMH technique. To identify the appropriate HMH numbers, the CT scan was uploaded to ImageJ 1.50i (http://imagej.nih.gov/ij/), where the maximum and minimum gray values were recorded using the line-measurement tool, following several studies (Butaric Reference Butaric2015; Coleman and Colbert Reference Coleman and Colbert2007). First, 20 measurements were collected across the mandibular bone-air transition and averaged to obtain an HMH value appropriate for bone (M5, M6). Then, 20 measurements were collected across the enamel-air boundary and averaged to obtain an HMH value appropriate for enamel (M7, M8). These HMH values were used to create two additional isosurfaces in Amira. Following the creation of the four isosurfaces, the generate surface tool in Amira was applied to each, and all four meshes were exported as a stereolithographic file (.stl) for the analyses.
Copies of these meshes were also subjected to the smoothing tool in Amira (four iterations, lambda 0.9), reducing the noise between the mesh poly-faces. The four smoothed meshes were exported as.stl files, resulting in a total of eight comparative meshes (Table 1). All meshes were subsequently imported into Geomagic Studio 2014 (3D Systems Inc.) to remove additional artifacts produced during processing and to address issues associated with folded/non-manifold poly-faces and small tunnels/holes. To ensure that processing across the models remained objectively the same at this step, the Mesh Doctor function was used to automate the process. These eight models comprise the test.
Surface Scan Processing and Modeling
In addition to the CT scans, the mandible (B11-2-15904) was also scanned with a Creaform GoSCAN 20. Following scanner optimization and shutter-speed configuration, scan data were collected atop a flat turntable at a 0.1 mm resolution with positioning targets required for increased accuracy. The mesh was cleaned in VXmodel 8.1.1, ridding it of isolated patches, self-intersections, spikes, small holes, singular vertices, creased edges, narrow triangles, outcropping triangles, narrow bridges, and non-manifold triangles. The point cloud associated with the unprocessed scan data was saved and exported as an.stl file prior to post-processing (Weyrich et al. Reference Weyrich, Pauly, Keiser, Heinzle, Scandella, Gross, Alexa and Rusinkiewicz2004).
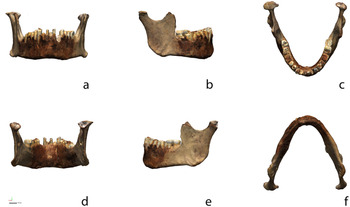
Surface scan data (Georgopoulos et al. Reference Georgopoulos, Ionnidis and Valanis2010; Mahmoud et al. Reference Mahmoud, Khali and Younes2015) were subsequently imported to Geomagic Design X (Dx), where an additional check for mesh errors was used to address potential issues with non-manifold poly-vertices, folded poly-faces, dangling poly-faces, small clusters, small poly-faces, non-manifold poly-faces, crossing poly-faces, and small tunnels. Due to the limitations of surface scanning, areas of the mesh associated with the mental foramina were cut, and the mesh boundary was edited prior to alignment. Following alignment, scan data were saved, and an object file (.obj) was exported for use as a 3D figure (Figure 1).
Surface scan data (with texture) for Mesolithic mandible B11-2-15904 from the Kulubnarti collection illustrating (a) anterior, (b) right buccal, (c) superior, (d) posterior, (e) left buccal, and (f) inferior views. The full-size figure can be viewed and downloaded at GitHub, and the 3D mesh generated by the surface scanner can be viewed interactively on Sketchfab.

Following data collection, the mandible was modeled in Dx using a custom patch network designed to capture the detail of the mesh in a surface model. Three-dimensional contour curves were applied along high curvature areas that were used as the basis for the initial layout of the custom patch network. The first iteration of the patch network enlisted an auto estimation for the number of patches necessary, which was subsequently refined through a series of iterative comparisons between the surface model and the mesh by moving between Dx and Geomagic Control X (Cx).
Throughout the design and layout process for the patch network, each iteration of the freeform surface model was exported to Cx to identify areas of the surface model's design that exceeded the specified—arbitrary—tolerance (0.1 mm, the same as post-processed mesh resolution) and required revision. Development of the final surface model was an iterative process resulting in a total of three revisions, yielding a freeform surface model where 100% of the surface model is within the 0.1 mm tolerance of the mesh. Revisions to the custom patch network were conducted by shuffling patch groups, editing, and inserting splines. The final freeform surface model was then exported to Cx for comparisons with the processed CT-rendered model. Although surface scan data were used as the control, that is not meant to convey a measure of accuracy or precision. Instead, these data are used to identify the CT post-processing method that yields a mesh with the smallest deviation between the surface model and CT-generated data.
Computer-Aided Inspection
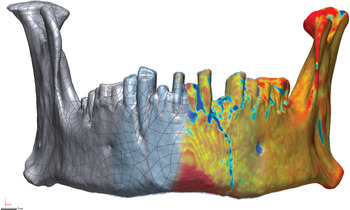
Cx was used to compare the topology of the surface model (nominal data) against that of the eight CT meshes (measured data; Selden Reference Selden2017; Selden and Jones Reference Selden and Jones2021; Figure 2). Measured data was compared against the nominal data (Li and Gu Reference Li and Gu2004; Minetola et al. Reference Minetola, Iuliano and Calignano2015; Obeidat and Raman Reference Obeidat and Raman2008; Poniatowska Reference Poniatowska2012) to identify the method of CT post-processing that best fits with the surface model based on the percentage of the 3D mesh that meets with a prespecified—arbitrary—tolerance (0.3 mm; Budzik et al. Reference Budzik, Burek, Bazan and Turek2016; Wong et al. Reference Wong, Chuah and Venuvinod2006; Yogi et al. Reference Yogi, Yatna and Raharno2014). Once identified, a series of two-dimensional (2D) slices were generated for the CT mesh that best fit with the surface scan to further clarify the character of the geometric shapes associated with gap distances.
Surface model (left) contrasted with CT point cloud (center) and gap distances between the surface model and CT mesh (right). Inspection tolerance was altered to 0.05 mm to more dramatically illustrate deviations that occur between the mesh and surface model for this figure. The full-size figure can be viewed and downloaded at GitHub.

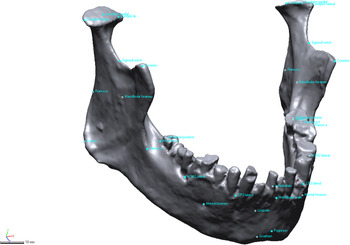
A total of 33 reference points were populated on the mesh in Dx (Figure 3). These points were placed in the vicinity of mandibular landmarks (e.g., menton) and were selected specifically due to their use in an unrelated study of the Mesolithic Kulubnarti mandibles (Galland et al. Reference Galland, Van Gerven, Von Cramon-Taubadel and Pinhasi2016). The reference points were saved as an initial graphics exchange specifications (IGES) file and imported to Cx as comparison points, where they were used to assess deviations between the surface model and CT meshes at known locations of analytical importance. Note that comparison points associated with the fractured left condyle of the mandible were not reflected here because they were in the geometric morphometric study (Galland et al. Reference Galland, Van Gerven, Von Cramon-Taubadel and Pinhasi2016). A number of methods have been proposed to reconstruct (Benazzi et al. Reference Benazzi, Stansfield, Kullmer, Fiorenza and Gruppioni2009; Senck et al. Reference Senck, Bookstein, Benazzi, Kastner and Weber2015) or otherwise account for missing data in geometric morphometrics (Arbour et al. Reference Arbour, Brown and Nakagawa2014; Couette and White Reference Couette and White2010; Neubauer et al. Reference Neubauer, Gunz, Weber and Hublin2012; Senck et al. Reference Senck, Coquerelle, Weber and Benazzi2013; Zelditch et al. Reference Zelditch, Swiderski and David Sheets2012), none of which were used here. Instead, comparison points were placed atop the area of the fracture, which afforded an opportunity to explore how a region of highly variable geometry would compare between the surface model and the CT meshes.
Location of the 33 landmarks used in Galland and colleagues (Reference Galland, Van Gerven, Von Cramon-Taubadel and Pinhasi2016; Supplemental Data), which were populated on the surface model in Dx and imported as comparison points to Cx. The full-size figure can be viewed and downloaded at GitHub.

RESULTS
Comparisons are limited to the topology of the surface model due to the fact that it is not possible to capture interior structures with a surface scanner. It is, however, possible to compare the topology of the CT mesh against that of the surface scan by limiting the analysis to the topology of the surface model.
Mesh Comparison (3D Compare)
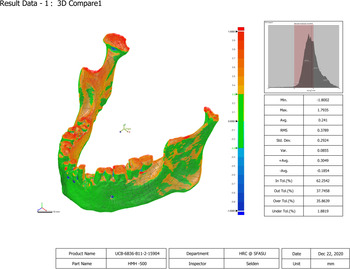
The 3D comparisons of the surface model across the eight CT meshes suggest that the M1 HMH 0 smooth mesh (in tolerance [InTol] 93.92%) and the M2 HMH 0 mesh (InTol 93.80%) correlate best with the surface model when the entirety of the mandible geometry—100% sampling ratio—is compared (Table 2). CT meshes M3 and M4 HMH −500 smooth and HMH −500 demonstrate the lowest tolerance levels (InTol 62.20% for both), so they correspond least to the surface scan. Additional comparisons indicate that high gap distances occur primarily in regions between dentition and around the mental foramina. Deviations also occur on the anterior rami and condyles, particularly in the area of the fractured left condylar neck (Figure 4).
Comparison between the surface model and the thresholding methods (isosurfacing) for HMH 500 (M4). Regions of mesh topology in green represent the geometry of Mesolithic mandible B11-2-15904 within the ± 0.3 mm tolerance. 3D comparison results associated with the HMH 500 smooth (M3) and HMH 500 (M4) meshes exhibited the highest deviations from the surface model. The full-size figure can be viewed and downloaded at GitHub.

Results of 3D Comparison between Surface Scan and CT Meshes.

The histogram in Figure 4 illustrates the Gaussian distribution for the number of errors over the whole deviation. The graph is split into six segments: 1σ at 31% from the average to the maximum deviation in each direction, 2σ at 69% from the average to the maximum deviation in each direction, and 3σ at 93.3% from the average to the maximum deviation in each direction. The average (AVG) is the sum of all deviations divided by the number of all deviations, and the RMS is the square root of all squared deviations divided by the number of all deviations (sometimes referred to as the “effective deviation”). In tolerance (InTol) and out tolerance (OutTol) percentages indicate the percentage of deviations in or out of the given tolerance, and over tolerance (OverTol) and under tolerance (UnderTol) percentages indicate the percentage of deviations over (positive direction) or under (negative direction) the tolerance range.
2D Sectioning (2D Compare)
The 2D comparison was generated for four sections of HMH 0 smooth at or very near locations on the mesh where comparison points—based on landmarks used by a previous study—were later applied (Table 3). Each section articulates with a specific curve, where semilandmarks (equidistant or otherwise) might be applied. For each of the 2D compare sections, two call-outs were added to illustrate the maximum measures of over/under tolerance. The single exception to the call-outs occurs in 2D compare 3, where gap distances associated with the mental foramina were of interest. In the case of 2D compare 3, the call-outs were issued for the two highest deviations that occur under the ± 0.3 mm tolerance.
Results of Sectioning (2D Compare) for HMH 0 Smooth in High-Deviation Regions of the Surface Scan / CT Mesh near the Locations of Landmark Data.

Through sectioning the specific CT mesh found to best fit the surface scan, variation between the surface scan and the HMH 0 smooth mesh was calculated. Even in the most ideal cases, some areas of the mesh may not be well suited for semilandmarks. For example, it would take substantial effort to identify areas of the left fractured condylar neck, left anterior ramus, left mandibular foramen, and both mental foramina where landmarks and semilandmarks would be deemed acceptable for inclusion in a formal analysis. However, a number of other areas remain on the HMH 0 smooth mesh that are likely suitable for use in a mixed-method analysis, but final placement would be dependent on the specifics of the research question.
Comparison Points
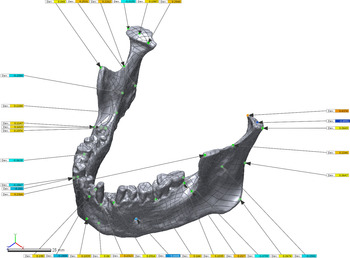
Figure 3 illustrates the placement of comparison points, and Figure 5 demonstrates the gap distance for comparison points between the surface model (reference position) and each of the eight meshes (measured position) in Cx. Gap distances were recorded (Table 4; Supplemental Data), and results are listed in order for the eight post-processing methods. Comparison points placed on the gnathion, gonion, and pogonion showed low (in tolerance) gap distances, whereas other anatomical regions demonstrated gap distances that were above tolerance for at least one of the CT meshes.
Surface model and comparison points contrasted with CT mesh HMH 0, illustrating the locations for measured positions and gap vectors associated with locations used in an unrelated geometric morphometric analysis (Galland et al. Reference Galland, Van Gerven, Von Cramon-Taubadel and Pinhasi2016; Supplemental Data). Green points denote a comparison point within tolerance; yellow points indicate a comparison point within tolerance, but above/below ± 0.15 mm; and red/blue boxes indicate a comparison point beyond the ± 0.3 mm tolerance. Importantly, these are not landmark-to-landmark measures; instead, they reflect the gap distance between the surface model and CT mesh at the location of the comparison point on the surface model. The full-size figure can be viewed and downloaded at GitHub.

Gap Distances between Points at Landmarks Applied to the Surface Scan Contrast with the Post-Processed CT Meshes.

Notes: CMP1 = comparison point; M1 = HMH 0 smooth; M2 = HMH 0; M3 = HMH -500 smooth; M4 = HMH -500; M5 = HMH 562 smooth; M6 = HMH 562; M7 = HMH 634 smooth; M8 = HMH 634; NR = No Result. Gap distances for points above the 0.3 mm tolerance are indicated in italics, and those above the 0.15 median are indicated in bold. See also Supplemental Data.
Comparison points placed around landmarks across the different CT meshes did not correspond well, with several exhibiting gap distances above the ± 0.3 mm tolerance. The CT meshes that best correspond with the repurposed constellation of comparison points were M1 and M2 (HMH 0 smooth and HMH 0). For these meshes, only three comparison points extend beyond the ± 0.3 mm tolerance: condylon tip (L), condylon medial (L), and mental foramen (L). It is important to reiterate, however, that the two measures atop the left condyle were collected in the area of a fracture, so this result is not unexpected (see discussion below). The meshes displaying the highest gap distances were the M3 and M4 CT meshes (HMH −500 smooth and HMH −500). It is worth noting that although mesh topology for M3 and M4 does vary in terms of the 3D compare analyses, gap distances for comparison points were exactly the same. Results for the M5–M8 meshes are also similar in terms of which landmarks extended beyond the median and maximum tolerance. In total, four landmarks remain below the median tolerance for all meshes (pogonion, gnathion, gonion [R], and gonion [L]), and only one landmark included a gap distance reaching only the median tolerance (ramus-a [R]). For the remainder of the comparison points, at least one extended beyond the maximum tolerance for all CT meshes (Table 4).
DISCUSSION
Eight CT meshes were digitally rendered using different thresholding parameters, then compared to a single 3D surface model to identify the post-processing method for CT scans that produces the smallest gap distances in terms of surface topology (3D comparisons), the sections most suitable for landmark and/or semilandmark placement (2D section comparisons), and the smallest gap distances in terms of landmark placement (comparison point analyses). All three analyses demonstrate that post-processing methods impact the comparability of the 3D meshes that are the primary data source used in studies of 3D geometric morphometrics. Consequently, if one is conducting a mixed-method study, incorporating those analyses employed here would be beneficial to identify which post-processing techniques yield the most consistent mixed-method dataset needed to address a specific research question while also highlighting those aspects of mesh geometry most suitable for landmark and semilandmark application in more advanced studies. As detailed below, it is recommended that unprocessed data be made available in addition to processed 3D meshes, making it possible to achieve consistent data processing for studies where reuse is possible, as well as replication studies where the processed mesh can be used.
Mesh Comparison (3D Compare)
Results indicate that the neutral CT-mesh M1, HMH 0 smooth, is the best match to the surface model in terms of overall model composition; however, this result does not necessarily mean that the HMH 0 smooth mesh is the most biologically accurate. As mentioned previously, numerous studies (Schwartz et al. Reference Schwartz, Thackeray, Reid and van Reenan1998; Spoor et al. Reference Spoor, Zonneveld and Macho1993; Ullrich et al. Reference Ullrich, Binet, Sanecki and Kieffer1980) have demonstrated that post-processing techniques, which include the HMH technique for objectively determining appropriate thresholding values depending on the material involved, are extremely important for obtaining accurate models and measurements. Despite this, studies enlisting CT meshes continue to use subjective methods and/or do not provide additional processing information.
It is likely that the appropriate post-processing methods for one study will not translate across multiple studies, given that research interests tend to be wide ranging. With this in mind, it is recommended that researchers pay particular attention when selecting the appropriate processing method. If mixed-method data cannot be avoided, preliminary comparative analyses that contrast results of differential post-processing techniques may be warranted. When obtaining CT, laser, structured light, et cetera from websites and digital repositories, it is important that post-processing methods—or stages—be thoroughly identified, understood, and communicated and that these data be provided with each (see Boyer et al. [Reference Boyer, Gunnell, Kaufman and McGeary2017] for a recent review of MorphoSource; see Lebrun and Orliac [Reference Lebrun and Orliac2017] for a recent review of MorphoMuseuM). In cases of 3D data, it is best to use the original files where possible (e.g., .tiff stacks, analyze files, DICOMs, etc.), as opposed to simply posting processed models/meshes. This would ensure that models and meshes can be rendered in a manner that yields consistent outputs for a specific project (Stock et al. Reference Stock, Garvin, Corron, Hulse, Cirillo, Klales, Colman and Stull2020). For example, a project that is focused on dentition may use different thresholding techniques compared to that of a project focused on mandibular bone, femur, pelvis, et cetera.
2D Sectioning (2D Compare)
Although it is an important first step, the complex variability for two or more specimens identified through the first comparison (3D compare) requires two-dimensional sectioning, where gap distances can be further scrutinized, illustrated, and clarified. The contribution of the 2D compare results may be of particular importance prior to the application of semilandmarks (Bookstein Reference Bookstein1991; Gunz et al. Reference Gunz, Mitteroecker, Bookstein and Slice2005) and sliding semilandmarks used to analyze the morphological variability among specific, well-defined curves (Bookstein Reference Bookstein1997; Bookstein et al. Reference Bookstein, Schfer, Prossinger, Seidler, Fieder, Stringer and Weber1999). The 2D compare sections illustrate specific areas of topology between the model and the mesh that are potentially problematic. For example, the 2D comparisons illustrate that areas of highly complex morphology may not be suitable locations for landmarks in a mixed-method dataset. Following identification of post-processing tools that result in the lowest gap distance between meshes and sections, landmark and semilandmark constellations can be refined.
Comparison Points
Identifying comparison points that should not be used as positions for landmarks or semilandmarks is as important as identifying those to use, given that the mesh topology in some regions will likely be better suited for a mixed-method approach than others. Those placed in areas of complex geometry—particularly areas with deeper structures associated with dentition, mental foramina, and fractures/breaks—deviate most (similar to results found in the 2D and 3D compare analyses). This could reflect the fact that surface scanning is limited to surface topography, whereas CT scans also capture elements of internal morphology. However, it is noteworthy that an analysis of a fully intact mandible may result in measures for comparison points on both condyles that are within tolerance, similar to those on the intact right condyle.
With this in mind, it is acknowledged that comparison points would not normally be placed on a broken specimen; instead, that area of the mesh would be virtually reconstructed (Benazzi et al. Reference Benazzi, Stansfield, Kullmer, Fiorenza and Gruppioni2009; Godinho and O'Higgins Reference Godinho, O'Higgins, Errickson and Thompson2017; Gunz et al. Reference Gunz, Mitteroecker, Neubauer, Weber and Bookstein2009; White Reference White2015; Zollikofer and Ponce de Leon Reference Zollikofer and de Leon2005), mirrored (Couette and White Reference Couette and White2010), or otherwise treated as missing (Arbour et al. Reference Arbour, Brown and Nakagawa2014; Couette and White Reference Couette and White2010; Neubauer et al. Reference Neubauer, Gunz, Weber and Hublin2012; Senck et al. Reference Senck, Coquerelle, Weber and Benazzi2013). However, placement of landmarks on the broken neck of the left condyle in this study provides interesting insights into potential problems associated with the application of comparison points—or landmarks—for mixed-method studies of complex geometric structures. Perhaps not surprisingly, these results suggest that CT scans may be better suited for analyses of deeper crevices (dentition), cranial sutures, foramina, fractures, and other biological structures at the point of transition from external to internal morphology. This finding is similar to that of Stock and colleagues (Reference Stock, Garvin, Corron, Hulse, Cirillo, Klales, Colman and Stull2020), who emphasized the importance of precise processing techniques when viewing complex anatomy, including the epiphyseal plates of subadult materials. The implications here are that the use of 3D scans or low thresholding that artificially “bloat” models may not pick up on the finer details, leading to erroneous biological interpretations. The current study did not specifically test how varying threshold levels or post-processing would affect results in an actual comparative study. Such analyses would be important avenues of future research. Additional avenues of research could involve investigating areas of “noise,” including the use of varying post-processing techniques in combination with different scanners on a single item (e.g., utilizing two different CT scanners or two different 3D surface scanners).
These results represent one approach to identifying variation in mixed-methods datasets and demonstrate the need to compare data produced using different collection and post-processing methods prior to analysis. The comparative methodological approach can be tailored to aid in the gradual refinement of post-processing workflows when used for a single scanner coupled with omnifarious post-processing methods, algorithms, and settings used to collect, process, and model 3D scan data (see Selden Reference Selden2017:22–23, Figure 2; Selden and Jones Reference Selden and Jones2021; Selden, Means et al. Reference Selden, Means, Iglesias and Mosier2018: Figure 4). To fully comprehend the complexities of the results, it is recommended that data be compared prior to formal analyses, allowing analysts to identify and further scrutinize specific areas of meshes that may prove problematic. Additional studies that compare modeling applications for skeletal objects (e.g., an entire cranium or post-cranial elements), cultural materials (e.g., ceramics, lithics; sensu Selden Reference Selden2018a, Reference Selden2018b, Reference Selden2019, Reference Selden, McKinnon, Girard and Perttula2021; Selden, Dockall et al. Reference Selden, Dockall and Shafer2018; Selden et al. Reference Selden, Dockall and Dubied2020), and proposed curve and patch elements associated with the addition and incorporation of semilandmarks or sliding semilandmarks will add important insights to the gradual identification of those processing techniques most appropriate for a wider range of mixed-method studies.
CONCLUSION
Comparative studies of 3D data processed using different hardware and software are necessary to comprehend the ambiguity introduced through the use of different post-processing methods. This is of particular import when the models and/or meshes used were produced for another analysis, perhaps with very different goals and data-collection protocols. Scan data curated in digital archives or databases warrant additional scrutiny because contextual and scan-specific metadata are neither standardized nor required (see Davies et al. Reference Davies, Rahman, Lautenschlager, Cunningham, Asher, Barrett and Bates2017; Niven and Richards Reference Niven, Richards, Errickson and Thompson2017), and too often these details are not included in the description or summary. Although it may be tempting to quickly download and import 3D mesh data generated for another study, it is best to request the unprocessed data and spend the time necessary to identify the post-processing methods that are best suited to the research question. Note that the successful identification of a post-processing workflow that achieves the smallest gap distance/deviation in one study may not represent the correct—or most appropriate—choice for another study, given that variable research questions tend to focus on different elements of mesh topology.
For analyses that employ a mixed-method approach using 3D data from digital repositories, websites, or other investigators, the tests needed to identify specific post-processing protocols will depend on the research design and question. In most cases, it is best to begin by identifying post-processing protocols that result in the most consistent whole-object variability across the mesh sample using 3D comparisons that provide a general overview of areas that may not compare well across the sample, and therefore may need to be avoided in a landmark-based geometric morphometric study. The analysis of 2D sections could be used to investigate potential challenges associated with a specific curve (archaeology) or biological feature (anthropology) as a means of determining whether or not it is suitable for semilandmark placement. Finally, the use of comparison points provides a means of assessing variation at specific locations on the mesh in advance of formal analysis to determine whether or not those locations are suitable for landmarks or other point-based measurements.
Acknowledgments
We express our gratitude to the Department of Anthropology at the University of Colorado Boulder for the requisite permissions and access needed to generate the scans of the mandibles, and to Bernard K. Means and Bonny Ford for their useful comments on an earlier draft. Further thanks go to Ramesh Karki for assistance in CT scanning at the Anschutz Medical Campus and to Charles Musiba for facilitating various aspects of this research project. Additional thanks go to Paul Sandberg and Austin Lawrence, who helped to locate samples in the Wadi Halfa collection, as well as to Erik Ordaz, who helped with abstract translation.
Data Availability Statement
All 3D data used in this analysis are digitally curated on Zenodo @ CERN (DOI:10.5281/zenodo.817449) and are embargoed for a period of five years from the most recent submission that employs them.
Supplemental Material
Supplemental material for this article is available on Zenodo, DOI:https://doi.org/10.5281/zenodo.817449.
Supplemental Data. Mesolithic mandible UCB-6B36-B11-2-15904-M from Sudan; curated in the collections at the University of Colorado at Boulder. Data were collected with a Creaform GoSCAN20. Additional data include CT scans produced using variable processing methods.