

1.0 INTRODUCTION
Data mining, the extraction of hidden predictive information from large databases, is a powerful new technology with great potential to help companies focus on the most important information in their data warehouses. Data mining tools predict future trends and behaviours, allowing businesses to make proactive, knowledge-driven decisions. The automated, prospective analyses offered by data mining move beyond the analyses of past events provided by retrospective tools typical of decision support systems. Data mining tools can answer business questions that traditionally were too time-consuming to resolve. They scour databases for hidden patterns, finding predictive information that experts may miss because it lies outside their expectations. Most companies already collect and refine massive quantities of data. Data mining techniques can be implemented rapidly on existing software and hardware platforms to enhance the value of existing information resources and can be integrated with new products and systems as they are brought online.
Data mining is the automated process of analysing large volumes of data and extracting patterns in the data. Data mining tools are capable of predicting behaviours and future trends, allowing an organisation to benefit from past experience in making knowledge-driven decisions. Flight delays are obviously frustrating to air travellers and costly to airlines. Airline companies are the most important customers of the airport. A well-known phrase – ‘the airplane earns only when flying’ – holds true. On-time performance of the airline’s schedule is a key factor in maintaining current customer satisfaction and attracting new ones. The flight schedule of the airport is the key to planning and executing an airline’s operations. With each schedule, the airline defines its daily operations and commits its resources to satisfying its customers’ air travel needs. Therefore, one of the basic requirements that all airlines have is to ensure a high efficiency of its ground handling activities and thus avoiding delays.
Flight delay is complex to explain. A flight can be behind schedule due to problems at the airport of origin, at the destination airport, or while it is airborne. A combination of these factors often occurs. Delays can sometimes also be attributed to the airlines themselves. Some flights are affected by reactionary delays, due to the late arrival of a previous flight. These reactionary delays can be aggravated by the schedule operation. Flight schedules are often subjected to irregularity. Due to tight connections among airlines resources, delays could dramatically propagate over time and space unless the proper recovery actions are taken. Despite the complexity, there exist some patterns of flight delay due to the schedule performance and airline itself. Some results have been extracted from the case study.
The airlines report the causes of delay in broad categories that were created by the Air Carrier On-Time Reporting Advisory Committee. The categories are Air Carrier, National Aviation System, Weather, Late-Arriving Aircraft and Security. The causes of cancellation are the same, except there is no late-arriving aircraft category.
Air Carrier: The cause of the cancellation or delay was due to circumstances within the airline’s control (e.g. maintenance or crew problems, aircraft cleaning, baggage loading, fuelling, etc.).
Extreme Weather: Significant meteorological conditions (actual or forecasted) that, in the judgment of the carrier, delays or prevents the operation of a flight such as tornado, blizzard or hurricane.
National Aviation System (NAS): Delays and cancellations attributable to NAS that refer to a broad set of conditions, such as non-extreme weather conditions, airport operations, heavy traffic volume and air traffic control.
Late-Arriving Aircraft: A previous flight with the same aircraft arrived late, causing the present flight to depart late.
Security: Delays or cancellations caused by evacuation of a terminal or concourse, re-boarding of the aircraft because of a security breach, inoperative screening equipment and/or long lines in excess of 29 minutes at screening areas.
Flight delays are present every day in every part of the world. There can be flight delays due to weather, to excessive traffic, to runway construction work and to other factors, but most delays are due to weather that people assume is part of flying. But what if we could accurately predict, at least with ˜70% accuracy, if a flight was going to be delayed due to weather within 10 days of the flight date? If possible, it would save passengers a great deal of time and money because passengers would be able to book flight connections with enough time to spare. By searching thoroughly through the Internet, we were able to collect a list of variables that will help create a flight delay scenario due to weather forecaster. First Waikato Environment for Knowledge Analysis (WEKA) will be used to build the model by trying different classifiers and selecting the one with the best results. WEKA is going to be used for its ease of use in accessing different classifiers and testing different settings. The flight variables used for the model have to be available at the time of ticket purchase, and at the same time, the weather variables will have to be obtained from a weather website. An early thought is that Naive Bayes (NB) will provide the best results.
In this paper, Section 2 provides a background review of airspace and delay performance metrics. Section 3 describes the algorithms used for model development. Section 4 describes the aircraft delay data sources. Section 5 presents experimental results from using WEKA methods and algorithms for delay estimation at the international level. Finally, conclusions are provided in Section 6.
2.0 BACKGROUND
Flight delay is a complex phenomenon because it can be due to problems at the origin airport, at the destination airport, or during flight. A combination of these factors often occurs. Delays can sometimes also be attributable to airlines. Some flights are affected by reactionary delays, due to late arrival of previous flights. These reactionary delays can be aggravated by the schedule operation. Flight schedules are often subjected to irregularity. Due to the tight connection among airlines’ resources, delays could dramatically propagate over time and space unless the proper recovery actions are taken. Despite this complexity, flight delays are currently measurable, and there exists some pattern of flight delay due to the schedule performance and airline itself (Wu, 2005)(Reference Wu1).
In the United States, two government agencies keep air traffic delay statistics. The Bureau of Transportation Statistics (BTS) compiles delay data for the benefit of passengers. They define a delayed flight when the aircraft fails to release its parking brake less than 15 minutes after the scheduled departure time. The Federal Aviation Authority (FAA) is more interested in delays indicating surface movement inefficiencies and will record a delay when an aircraft requires 15 minutes or longer over the standard taxi-out or taxi-in time (Eric and Chatterji, 2002)(Reference Eric and Chatterji2).
Generally, flight delays are the responsibility of the airline. Each airline has a certain number of hourly arrivals and departures allotted per airport. If the airline is not able to get all of its scheduled flights in or out each hour, then representatives of the airline will determine which flights to delay and which flights to cancel. These delays take one of three forms: ground delay programs, ground stops and general airport delays. When the arrival demand of an airport is greater than the determined capacity of the airport, then a ground delay program may be instituted. The airport capacity is unique to each airport, given the same weather conditions. The various facilities at an airport can determine how much traffic an airport can handle during any given weather event. Generally, ground delay programs are issued when inclement weather is expected to last for a significant period of time. These programs limit the number of aircrafts that can land at an affected airport. Because when demand is greater than the aircraft arrival capacity, flight delays will result.
Second, ground stops are issued when inclement weather is expected for a short period of time or the weather at the airport is unacceptable for landing. Ground stops mean that traffic destined to the affected airport is not allowed to leave for a certain period of time. Lastly, there are general arrival and departure delays. This usually indicates that arrival traffic is doing airborne holding or departing traffic is experiencing longer than normal taxi times or holding at the gate. These could be due to a number of reasons, including thunderstorms in the area, a high departure demand or a runway change. Our research finds that arrival and departure delays are highly correlated. Correlation between arrival and departure delays is extremely high, around 0.9, for 2002 and 2003. This finding is useful to prove that congestion at the destination airport is to a great extent originated at the departure airport.
In order to understand flight delay, it is useful to consider the phenomenon of scheduled delay. The simplest way of reducing delays is not to increase the speed and efficiency of the system to meet the scheduled time, but to push back the scheduled time to absorb the system delays. As a result, one estimate put the number of scheduled delays that were built into airline schedules in 1999 at 22.5 million minutes. The number of arrival delays reported by BTS would have been nearly 25% higher in 1999 if airlines had maintained their 1988 schedules (Wu, 2005)(Reference Wu1). Sources of airport delay include many elements, such as weather, airport congestion, luggage loading, connecting passengers, etc. Weather is the main contributor to delays in the air traffic control (ATC) system. Traffic volume delays are caused by an arrival/departure demand that exceeds the normal airport arrival rate (AAR)/airport departure rate (ADR). The demand may also exceed the airport capacity if AAR and ADR are reduced due to weather conditions at the airport, equipment failure or runway closure. Delays may also be attributed to airline operation procedures (Aisling and Reynolds-Feighan, 1999)(Reference Aisling and Reynolds-Feighan3).
Delays to airline schedules may result from many different causes. Some are due to airport capacity limits, while some maybe due to disrupting events, e.g. missing check-in passengers at airports. According to delay analyses carried out by Eurocontrol, around 47% of delays are due to airline-related operations at airports such as aircraft turnaround operations, while the remaining delays are due to other causes such as air traffic control, weather and airport capacity constraints (Eurocontrol, 2001)(4). The visualisation of both our algorithmic results and the statistical analyses makes it possible to discern meaningful trends in a large and complicated dataset (Phillips and Steele, 2009)(Reference Phillips and Steele5).
The delays are based on flight data from the Enhanced Traffic Management System (ETMS) and other information sources (e.g., airline schedules, operations and delays, weather information, runway information, etc.). Aviation System Performance Metrics (ASPM) delays are a measure of actual delays experienced by the airlines and its customers. ASPM collects data at a finer granularity, reports delays of one minute or more and classifies delay by all phases of flight and time of the day. The ASPM also provides the daily number of flights cancelled by the airlines. Both systems contain data entered by human operators and are prone to data recording errors. The two systems are overlapping in certain areas and complementary in others. Both databases can be used independently for developing NAS metrics models based on statistical analysis (Wang, Klein and Jehlen, 2009)(Reference Wang, Klein and Jehlen6). Due to their cost and the environmental and noise issues associated with construction, it is unlikely that any new airports will be built in the near future. Therefore, to make the National Airspace System run more efficiently, techniques to more effectively use the limited airport capacity must be developed (Smith and Sherry, 2008)(Reference Smith and Sherry7).
Correlation-based Feature Selection (CFS) subset evaluator, consistency subset evaluator, gain ratio feature evaluator, information gain attribute evaluator, OneR attribute evaluator, principal components attribute transformer, ReliefF attribute evaluators and symmetrical uncertainty attribute evaluator are used in this study in order to reduce the number of initial attributes. The classification algorithms such as Decision Tree (DT), K-nearest neighbour (KNN), Support Vector Machine (SVM), Artificial Neural Network (ANN) and NB are used to predict the warning level of the component as the classification attribution. We have explored the use of different classification techniques on aviation components data (Christopher and Balamurugan, 2014)(Reference Christopher and Balamurugan8).
3.0 PROPOSED METHOD
Flight delays have a weak effect on airlines, airports and passengers. Moreover, the development of accurate prediction models for flight delays became cumbersome due to the complexity of the air transportation system, the amount of methods for prediction and the deluge of data related to such system. In this context, this paper presents a thorough literature review of approaches used to build flight delay prediction models from the aircraft data perspective. We propose different data mining algorithms and summarise the initiatives used to address the flight delay prediction problem, according to scope, data and computational methods, giving special attention to an increasing usage of machine learning methods. Apart from this, we also present a timeline of major works that depict relationships between flight delay prediction problems and the research trends to address them.
In this paper, we are using different data mining methods for aircraft analysis data. The number of classifiers are NB, Functions, Lazy, Meta, MISC, Rules and DT, and the feature attribute selectors are CFS, Chi-square, Consistency (CS), Gain Ratio (GR), Information Gain, OneR, Principal Component Analysis (PCA), ReliefF (RF), Symmetrical Uncertainty (SU) and SVM attribute evaluator. These are the techniques used when building the model on training data. Then we reduce the attributes and will get the performance of the different classifiers and different feature selectors.
3.1 Feature selection
Feature selection is applied to inputs, predictable attributes or to states in a column. When scoring for feature selection is complete, only the attributes and states that the algorithm selects are included in the model-building process and can be used for prediction. If you choose a predictable attribute that does not meet the threshold for feature selection, the attribute can still be used for prediction, but the predictions will be based solely on the global statistics that exist in the model. A feature selection algorithm can be seen as the combination of a search technique for proposing new feature subsets, along with an evaluation measure that scores the different feature subsets. The simplest algorithm is to test each possible subset of features finding the one that minimises the error rate.
3.2 Classification Decision Tree (DT)
DT induction is a very popular and practical approach for pattern classification. Generally, DT is constructed in a greedy, top-down recursive manner. The tree can be constructed in a breadth first manner or depth first manner. The DT structure consists of a root node, internal nodes and leaf nodes. The classification rules are derived from the DT in the form of – ‘if then else’. These rules are used to classify the records with unknown value for class label. The DT is constructed in two phases: Building Phase and Pruning Phase.
In the Building Phase of the tree, the best attributes are selected based on attribute selection measures such as Information Gain, Gain Ratio, Gini Index, etc. Once the best attribute is selected, then the tree is constructed with that node as the root node and the distinct values of the attribute are denoted as branches. The process of selecting the best attribute and representing the distinct values as branches are repeated until all the instances in the training set belong to the same class label.
In the Pruning Phase, the sub-trees that may over fit the data are eliminated. This enhances the accuracy of a classification tree. DTs handle continuous and discrete attributes. DTs are widely used because they provide human-readable rules and are easy to understand, and the construction of a DT is fast and yields better accuracy. There are several algorithms to classify the data using DTs.
The common procedure used to resolve a connection between a weather forecast and airport facility was:
• Collect data from the various available data sources,
• Use WEKA tools, format the data into a usable layout,
• Use a number of classification algorithms to connect the datasets,
• Use feature selection attributes to connect the updated datasets, and
• Test the data to ensure there is accuracy and efficiency.
The following steps are involved in the data mining methods applied to the aircraft data analysis problem:
Step 1: Collect the aircraft data from the various available data sources
Step 2: Format the data into a usable layout
Step 3: Use classification algorithms to connect the datasets
Step 4: Apply feature selection attributes to connect the updated datasets
Step 5: Analyze performance of accuracy and efficiency
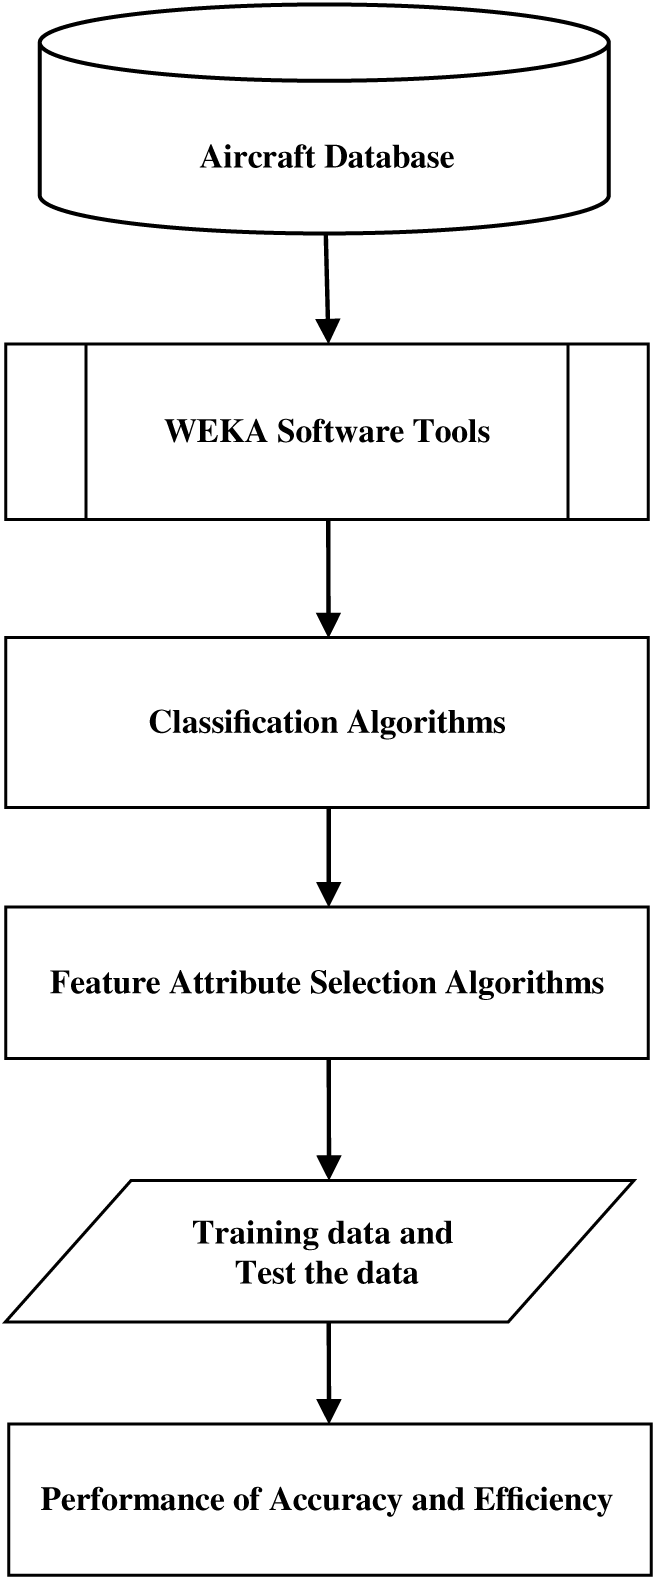
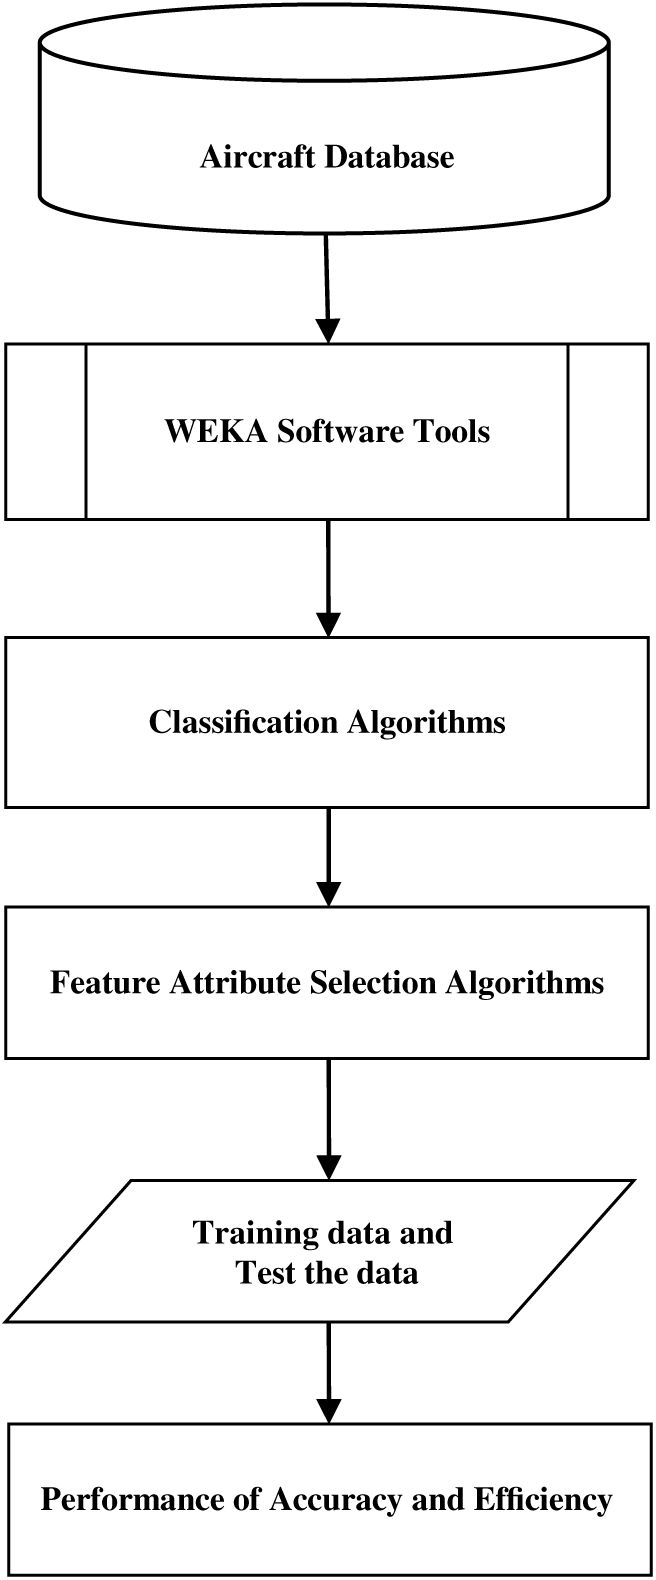
In this model, we found that the feature selection method attribute reduces the number of redundant and irrelevant attributes, thereby increasing the performance of classification methods. Figure 1 displays the block diagram of proposed classification model for training samples. In this diagram, we can eliminate irrelevant features and evaluate all classifiers, thereby increasing the performance of classification accuracy and efficiency of this model. All classifier techniques and the different features attribute selection evaluator methods applied in this model for large scale aircraft dataset analysis.
Block diagram of the proposed classification model.
The algorithm for these processes is outlined as follows:
Step 1: Input training dataset.
Step 2:
• Create replica sets of the same by random selection of training examples from the dataset.
• Learn the classifier by the different algorithms based on the actual training set.
Step 3: Create compound classifier as the aggregation of particular classifiers.
Step 4: Train the data using feature attribute selection algorithms to produce a classifier model.
Step 5: Input test data set
Step 6: Obtain test data and classify using the altogether built model.
Step 7: Initiate query for Flight Delays using classifiers.
Step 8: Analyze performance of accuracy and efficiency.
Step 9: Output Result Analysis
Figure 2 describes the aircraft dataset along with pre-processing, which results in accurate performance and efficiency through classification algorithms and feature attribute selection methods. This model is proposed for improving different classification accuracy by combining the prediction of multiple classifiers. The different data mining classifiers like NB, Functions, Lazy, Meta, MISC, Rules and DT are used for classification.
High level model of the system.

The classification models that are evaluated using the different performance metrics are Kappa statistic, Mean Absolute Error, Root Mean Squared Error, Relative Absolute Error and Root Relative Squared Error. A comparative study is carried out on the performances of the different classifiers, and after carrying out different feature selection techniques, the classifiers accuracy significantly improved.
 \[\begin{array}{l} {} \\ {{\rm Kappa\; statistic\;} =} \\ {} \end{array}\frac{{\rm totalAccuray-randomAccuracy}}{{\rm 1\; - \; randomAccuracy}} \]
Mean Absolute Error is a model evaluation metric used with regression models. The Mean Absolute Error of a model with respect to a test set is the mean of the absolute values of the individual prediction errors on overall instances in the test set. Each prediction error is the difference between the true value and the predicted value for the instance.
 \[\begin{array}{l} {{\rm Mean\; absolute\; error}={\rm \; }} \\ {} \end{array}\frac{\sum {\rm ni}=1{\rm abs}\left({\rm yi}-{\rm \lambda }\left({\rm xi}\right)\right)}{{\rm n}} \]
where  $y_{i}$ is the true target value for test instance
 $x{}_{i}$,
 $\lambda $(
 $x{}_{i}$) is the predicted target value for test instance
 $x{}_{i}$, and n is the number of test instances.
The performance of each feature selection method and classifiers model is evaluated by using statistical measures like accuracy, specificity and sensitivity. Receiver Operating Characteristics (ROC) parameters are used to compare the results of various classifiers. For the percentage of accuracy, sensitivity percentage and specificity percentage, True Positive (TP), True Negative (TN), False Positive (FP) and False Negative (FN) expressions are used. The various formulas based on ROC parameters are given below:
Total accuracy is simply the sum of TP and TN, divided by the total number of items, that is:
 \[{\rm Accuracy\;} =\frac{\left({\rm True\; Positive\; +\; True\; Negative}\right)}{\left({\rm True\; Positive\; +\; True\; Negative\; +\; False\; Positive\; +\; False\; Negative}\right)} \]
 \begin{equation*}
{\rm randomAccuracy\;} =\frac{{(\rm TN\; +\; FP}{\rm )}{\rm *\; }\left({\rm TN\; +\; FN}\right){\rm \; +\; }\left({\rm FN\; +\; TP}\right){\rm *\; }\left({\rm FP\; +\; TP}\right)}{{\rm Total*Total}}
\end{equation*}
 \[{\rm Sensitivity\;} =\frac{\left({\rm True\; Positive}\right)}{\left({\rm True\; Positive\; +\; False\; Negative}\right)} \]
 \[{\rm Specificity\;} =\frac{{\rm \; }\left({\rm True\; Negative}\right)}{\left({\rm True\; Negative\; +\; False\; Positive}\right)} \]
A confusion matrix contains information about actual and predicted classifications done by a classification system. Performance of such systems is commonly evaluated using the data in the matrix. Table 1 shows the confusion matrix for a two-class classifier. The entries in the confusion matrix have the following meaning in the context of our study:
• a is the number of correct predictions that an instance is negative,
• b is the number of incorrect predictions that an instance is positive,
• c is the number of incorrect of predictions that an instance negative, and
• d is the number of correct predictions that an instance is positive.
Confusion matrix for a two-class classifier

The accuracy (AC) is the proportion of the total number of predictions that were correct. It is determined using the equation:
 \[AC=\frac{(a+d)}{(a+b+c+d)} \]
We proposed a different feature attribute selection evaluator method in this model. The number of features obtained in the dataset is very large. We have applied the number of different attribute evaluators CFS subset evaluator, consistency subset evaluator, gain ratio feature evaluator, information gain attribute evaluator, OneR attribute evaluator, principal components attribute transformer, relief attribute evaluator and Symmetrical Uncertainty Attribute Evaluator. The principal components attribute transformer is better than other attribute evaluators because of the accuracy is very high and minimum time execution.
4.0 DATA SOURCES AND DESCRPTION
For this study, we collected the data from the database of aircraft aviation. FAA officials, airlines, air traffic controller shortage, poor airport design, bad weather, heavy traffic and close proximity delays flights at several major airports in the eastern U.S. The application is done on number of datasets to compare the results. We are collecting data covering 1920 to 2015. In this manner, we used 5,112 data instances for various data mining algorithms. The data is given in a report layout with the following sections shown in Table 2. As is apparent from Table 2, component reports have a greater number of attributes. The aim of the analysis is to find the attributes that affect the warning levels of aircraft.
Description of sample datasets used in application

5.0 EXPERIMENTAL RESULTS AND DISCUSSION
We have applied the classification algorithms like that DT, NB, SVM, KNN and NN to the aircraft database dataset.(9) After the classified dataset, we used different feature selection techniques like that CFS, CS, GR, OneR, PCA, RF and SU to build classification models on the aircraft datasets with various selected subset of features. These classification models are evaluated in terms of the accuracy and efficiency performance metrics.
The major contribution is the study of the classification performance in terms of accuracy and efficiency with different feature selection methods. It is observed from the comparison of different classifiers based on the performance metric Kappa Statistic, Means Absolute Error, Root Mean Squared Error, Relative Absolute Error and Root Relative Squared Error on reduced features by different feature selection methods and also found the performance of metric results are reliable.
Table 3 shows the performance of accuracy with different Bayes classifiers such as Aode, Aodesr, BayesNet, HNB, NB and Waode on a large-scale aviation dataset. Table 4 shows the performance of efficiency with different Bayes classifiers such as Aode, Aodesr, BayesNet, HNB, NB, and Waode on a large-scale aviation dataset. Table 5 shows the performance of accuracy with different function classifiers such as Logistics, MLP, RBF and Simple Logistics. Table 6 shows the performance of efficiency with different function classifiers such as Logistics, MLP, RBF and Simple Logistics. Table 7 shows the performance of accuracy with different Lazy classifiers IB1, IBK and Kstar. Table 8 shows the performance of efficiency with different lazy classifiers IB1, IBK and Kstar.
Bayes Classifiers accuracy with whole aircraft dataset before applying feature selection methods

Bayes Classifiers efficiency with whole aircraft dataset before applying feature selection methods

Functions Classifiers accuracy with whole aircraft dataset before applying feature selection methods

Functions Classifiers efficiency with whole aircraft dataset before applying feature selection methods

Lazy Classifiers accuracy with whole aircraft dataset before applying feature selection methods

Lazy Classifiers efficiency with whole aircraft dataset before applying feature selection methods

Table 9 shows the performance of accuracy with different Meta classifiers: AdaBoost1, Attribute selected, Bagging, ClassificationviaClustering, ClassificationviaRegression, CVParameterSelection, Dagging, Decorate, END, FilteredClassifier, Grading, LogitBoost, MultiBoostAB, MultiClassClasifier and MultiScheme. Table 10 shows the performance of efficiency with different Meta classifiers: AdaBoost1, Attribute selected, Bagging, ClassificationviaClustering, ClassificationviaRegression, CVParameterSelection, Dagging, Decorate, END, Filtered Classifier, Grading, LogitBoost, MultiBoostAB, MultiClassClasifier and MultiScheme.
Meta Classifiers accuracy with whole aircraft dataset before applying feature selection methods

Meta Classifiers efficiency with whole aircraft dataset before applying feature selection methods

Table 11 shows the performance of accuracy with different MISC classifiers: Hyperpipes and VF1. Table 12 shows the performance of efficiency with different Misc classifiers: Hyperpipes and VF1. Table 13 shows the performance of accuracy with different Rules classifiers: ConjunctiveRule, DecisionTable, DTNB, JRip, NNge, OneR, Part, Prism, Ridor and ZeroR. Table 14 shows the performance of efficiency with different Rules classifiers Conjunctive Rule, Decision Table, DTNB, JRip, NNge, OneR, Part, Prism, Ridor and ZeroR.
Misc Classifiers accuracy with whole aircraft dataset before applying feature selection methods

Misc Classifiers efficiency with whole aircraft dataset before applying feature selection methods

Rules Classifiers accuracy with whole aircraft dataset before applying feature selection methods

Rules Classifiers efficiency with whole aircraft dataset before applying feature selection methods

Table 15 shows the performance of accuracy with different trees classifiers: ADTree, BFTree, DecisionStump, FT, Id3, J48, J48graft, LADTree, NBTree, RandomForest, RandomTree, REPTree, Simplecart and UserClassifier. Table 16 shows the performance of efficiency with different Trees classifiers ADTree, BFTree, DecisionStump, FT, Id3, J48, J48graft, LADTree, NBTree, RandomForest, RandomTree, REPTree, Simplecart and UserClassifier. Table 17 shows the performance of different classifiers after applying feature selection attribute evaluator methods.
Trees Classifiers accuracy with whole aircraft dataset before applying feature selection methods

Trees Classifiers efficiency with whole aircraft dataset before applying feature selection methods

Performances of different classifiers after applying feature selection attribute evaluator methods

Figure 3 displays the performance of accuracy for different classifiers with different feature selectors on a large-scale aviation dataset. Figure 4 displays the performance of accuracy for different classifiers on a large-scale aviation dataset. Figure 5 displays the performance of accuracy for different feature attribute selectors on a large-scale aviation dataset. Figure 6 displays performance of different classification models after applied feature selection methods with ROC chart. The DT classifier is better than other classifiers accuracy is very high and minimum time execution.
Performance of different feature attributes selectors with classifiers.

Performance of different classifiers with accuracy.

Performance of different feature attributes evaluators with accuracy.

Performance of different classification models after applied feature selection methods with ROC chart.

6.0 CONCULSION
In this study, different classifiers are used for the classification of aircraft data. We have studied the performance of different feature attribute selection methods. The main contribution of this study is to evaluate the performance of different classification algorithms like DT, NB, SVM, KNN and ANN on aviation aircraft data. This paper scrutinises the importance of feature attribute selection methods for improving the performance of different classification methods. It is found that difference performance accuracy and efficiency can be found with the whole aircraft dataset before applying feature selection methods. After applying feature attribute selection methods, the WEKA tool increases the performance of different classifiers. We determined that the DT based on classifier and the PCA based on feature selector attribute evaluators are the best solution for aircraft analysis of flight delays using different data mining algorithms.
In this paper, we have explored different classification models and various evaluation attribute feature selection methods. By measuring the performance of the models using real data, we have seen interesting results on the predictability of the delays. The best delay prediction method appeared to be the most specific one, which considered all the combinations of categorical parameters and a condition on the arrival hour. The performances of the models were challenging to evaluate due to the variety of measures used and the different parameterisations adapted to them. However, the predictions obtained appeared to be better than the one seen in the literature. The classification algorithm was a very interesting method to learn and manipulate. Being a PCA method, it can be used each time we want to reconstruct a probabilistic model from some observations.
7.0 FUTURE WORK
The results of this qualitative research have significant implications for future research into the phenomenon of delay and for the design of policies aimed at solving this significant problem. First, these reports from the field highlight the fact that delay is as much a problem of unreliability as it is of longer trip times. When the air transportation system is plagued by delay, travellers become less able to predict when they will arrive, and so they become less able to plan their trips efficiently.
We could also model the phenomenon more precisely if instead looking at more than just the distribution of past data. We can, for instance, build separate models per time period, per type of aircraft, per airline and per region, and then group them into a general model. This way, we might be able to predict the delays of a new flight without needing several months of data to build a prediction model. Another step forward would be to generalise the model to flights of the entire world, or at least to exploit more data sources, to build more complete predictions. Finally, the most interesting step would be to integrate such a model into a flight booking tool, to provide the delay prediction to future passengers, even if this would require a strong confidence in the information provided, considering the possible impact in terms of reservations.
ACKNOWLEDGEMENTS
The authors wish to acknowledge the anonymous reviewers for their kind suggestions and comments for improving this paper.