

NOMENCLATURE
- A, B, C, D
state-state system matrix
- a
speed of sound
- BPR
by-pass ratio
- C
velocity
- CLM
component level modelling
- C p
specific heat coefficient at constant pressure
- D
drag
- EPR
engine pressure ratio
- E
command amplitude
- F
gross thrust
- f
fuel/air ratio by weight
- FAA
Federal Aviation Administration
- FADEC
Fuel Authority Digital Engine Control
- FPR
fan pressure ratio
- G
state-space system matrix
- G 0
generator function
- H
altitude, state-space system matrix
- ITT
inter-turbine temperature
- J
Jacobian matrix
- L
lift
- LM
Levenberg–Marquardt
- M
Mach number
- P
absolute pressure
- p
polynomial coefficient
- PSO
particle swarm optimisation
- R
gas constant
- RAFS
Research Aircraft Flight Simulator
- T
absolute temperature, time constant
- t
time
- TLA
throttle lever angle
- U
input vector
- v
noise matrix
- W
mass flow, weight
- w
noise matrix
- X
state vector
- x
input
- Y
output vector
- y
output, model response
- α
angle-of-attack, constant
- β
constant
- y
ratio of specific heats, climb angle
- δ
pressure ratio, difference
- ε
error
- η
efficiency
- θ
parameters to identify, temperature ratio
- ξ
damping parameter
- τ
time constant
- ω n
system frequency
Suffixes
- a
ambient, air
- c
compressor, cold
- d
delay
- dyn
dynamic
- f
fuel, fan, final
- g
gas
- i
initial, index
- j
nozzle, index
- k
index
- m
mechanical, polynomial degree
- n
net, polynomial degree
- ratio
ratio
- s
specific, sample
- stat
static
- t
turbine
- to
take-off
- th
theoretical
- tot
total
- 0
at t=0
- 10
at 10% response
- 90
at 90% response
Engine references
- 0
ambient
- 1
fan inlet
- 2
fan outlet/high-pressure compressor inlet
- 3
high-pressure compressor outlet/combustor inlet
- 8
cold nozzle outlet
1.0 INTRODUCTION
A commercial aircraft’s life cycle is around 100,000 flights. Surprisingly, aircraft rarely reach this limit, mainly because aircraft companies continuously update aircraft design and manufacturing to improve their performance in terms of materials used, as well as to invest in the avionics systems inside aircraft in order to reduce flight costs, mainly fuel consumption.
These improvements represent savings that they are usually achieved by changing the design of an aircraft rather than by its updating. Systems modelling plays an important role in these improvements, as it enables a very good understanding of the systems involved, and their different parameters’ influences. Thrust and fuel consumption are two significant parameters used in aircraft design( Reference Raymer 1 ). This study aims to elaborate a model predicting the aircraft performance for the whole flight envelope. The flight envelope is defined in this paper by a maximum number of flight tests covering it. These kinds of models can then be used to optimise flight trajectories( Reference Murrieta Mendoza, Demange, George and Botez 2 – Reference Sidibé and Botez 16 ), to save fuel, time and money. According to Suraweera( Reference Suraweera 17 ), component level modelling (CLM) plays a fundamental role in engine modelling. It has largely been used to model engine outputs( Reference Suraweera 17 – Reference Martin, Wallace and Bates 23 ), performance deterioration( Reference Ogaji, Sampath, Singh and Probert 24 ) and fault diagnosis( Reference Baig and Sayeed 25 ). This CLM approach consists in modelling each engine component based on thermodynamical assumptions and equations( Reference Saravanamuttoo, Rogers and Cohen 26 ). Some components influences are difficult to model correctly. One such example is the throttle lever angle (TLA) influence. On a twin spool high bypass ratio turbofan, the TLA does not influence the fuel flow directly, but it does influence the fan rotational speed (N 1), because a minimum specific fuel consumption (i.e. fuel flow per thrust unit) exists for different fan pressure ratios (FPR) as the FPR is directly linked to N 1 Reference Saravanamuttoo, Rogers and Cohen (26 ). N 1 is controlled by the full authority digital engine control (FADEC) with the aim to minimise the specific fuel consumption. The TLA influence can thus be difficult to model.
Other studies have been performed with different approaches, such as the ‘gas path analysis’. This approach models the dependent parameters’ influence on the independent parameters by using a matrix called the fault coefficient matrix (FCM) which depends on the input data. This matrix generally corresponds to the Jacobian of the system involved in these studies. With these hypotheses, the input data of the independent parameters are iterated in order to find the ones which fit to the measured data, and then the gas path analysis becomes the non-linear gas path analysis. Studies performed by Urban( Reference Urban 27 ) show the efficiency of this approach.
Kalman filtering is a powerful tool that has been used in various fields. Sugiyama( Reference Sugiyama 28 – Reference Sugiyama 30 ), Luppold( Reference Luppold, Roman, Gallops and Kerr 31 ) and Kobayashi and Simon( Reference Kobayashi, Simon and Litt 32 ) used a non-linear Kalman filter with a constant gain that corrects a state-space model using a constant gain of an engine in order to identify an aircraft dynamic model and to evaluate the variation of its performance with time.
Neural networks and genetic algorithms are powerful tools which allow any kind of system to be modelled. Their purpose is to recreate the human brain logic by training neurons using neural networks, and, further, genetic algorithms in order to fit their numerical outputs to the measured outputs. This approach was used in various engine modelling research( Reference Patrón and Botez 15 , Reference Kobayashi and Simon 33 – Reference Mathioudakis and Romessis 35 ) and gives excellent results.
Computational fluid dynamics (CFD) has played a major role in the aviation industry. It is based on the resolution of the Navier–Stokes equations generally through STAR-CCM+( Reference CD-adapco 36 ) or Fluent( Reference Fluent 37 ) software. The modelling system geometry and boundaries’ limitation( Reference Adamczyk 38 ) are described( Reference Adamczyk 38 ).
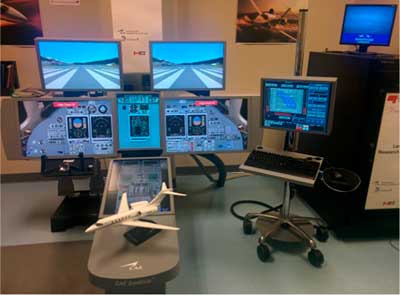
In this paper, the CLM and a generic model were used to model the fan pressure ratio (FPR), the engine pressure ratio (EPR), the inter-turbine temperature (ITT) and the thrust and the fuel flow outputs as functions of altitudes, Mach numbers and TLA’s under static and dynamic conditions. An optimisation algorithm was performed based on the least square estimation to fit the data acquired from flight tests on the Cessna Citation X Level D Research Aircraft Flight Simulator (RAFS) designed by CAE Inc. This algorithm was needed to improve the theoretical model. Level D is the highest level designated by the certification authorities for flight dynamics modelling, according to the Federal Aviation Administration (FAA, AC 120-40B) (Fig. 1).
Cessna Citation X Level D Research Aircraft Flight Simulator (RAFS).

2.0 SYSTEM IDENTIFICATION
2.1 Goal
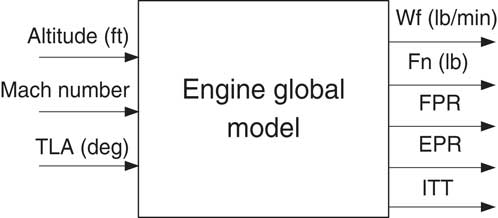
The purpose of this research is to identify an engine model as described in Fig. 2. Where W f is the fuel flow, F n is the net thrust, FPR is the fan pressure ratio, EPR is the engine pressure ratio and ITT is the inter turbine temperature. These five parameters were chosen because they are important parameters in the engine design. In particular, they are characteristics of engine performance and safety.
Global engine model.
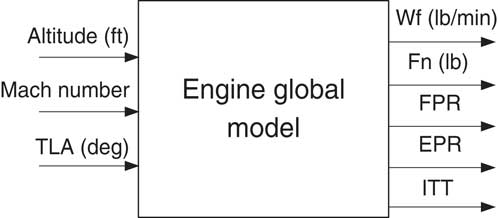
This global model was then divided into three submodules as shown in Fig. 3.
Engine model submodules.

As indicated in Fig. 3, the FPR, EPR and ITT were modelled by the first submodule seen in Fig. 3. These parameters were then used by the second submodule to predict the net thrust, F n, and then all these parameters were used to predict the fuel flow. These models were obtained using identification and validation procedures.
2.2 Method
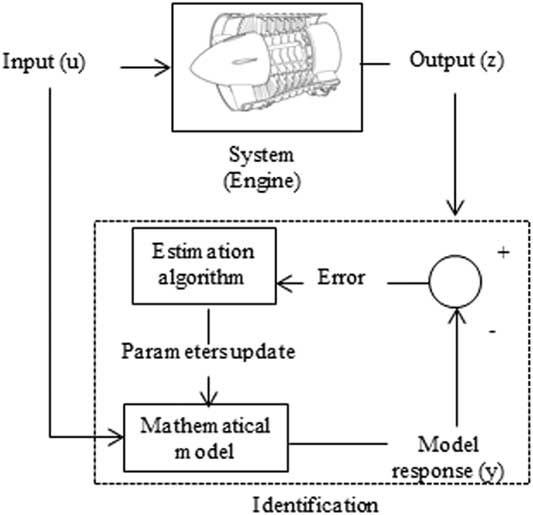
‘System identification’ identifies a system by knowing its inputs and outputs. This method has been broadly used for aircraft systems’ stability and control analyses, and for their performance analysis( Reference Beaulieu, De Jesus Mota and Botez 39 – Reference Klein and Morelli 50 ). The procedure is described in Fig. 4.
System identification principles applied to an engine.

As explained earlier, experimental data are needed in order to identify an engine model. In this study, the data were extracted from flight tests performed on the level D Research Aircraft Flight Simulator for the Cessna Citation X.
2.3 Data acquisition
2.3.1 Simulated test flight experiments
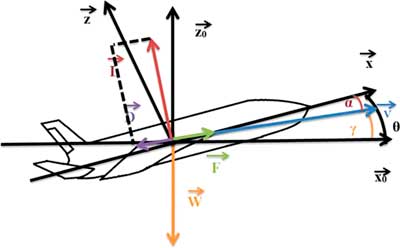
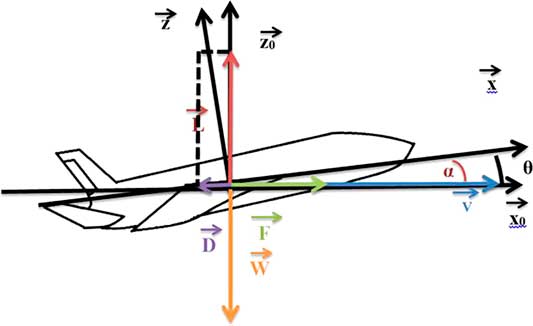
Flight tests were executed in two phases. Phase 1 is a climb phase at a constant speed and TLA. The balance of forces during this phase is presented in Fig. 5.
Balance of forces during the climb phase.

with
 $\left( {\overrightarrow{{x_{0} }} ,\overrightarrow{{z_{0} }} } \right)$
representing the earth reference frame and
 $\left( {\vec {x},\vec {z}} \right)$
the aircraft reference frame. The blue vector
 $\vec {V}$
represents the speed, the red vector the lift
 $\vec {L}$
, the green vector the gross thrust
 $\vec {F}$
, the purple vector the drag
 $\vec {D}$
and the orange vector represents the weight
 $ \vec {W}$
. The angle-of-attack α is the angle between the speed and the aircraft’s x-axis, γ is the angle of climb between the horizontal axis of the earth and the speed and θ, or the pitch angle, is the sum of these two angles α and γ. The second phase corresponds to the phase in which the experimental data are acquired.
When the desired altitude is reached, the nose of the aircraft goes down, which leads to the drag reduction but the gross thrust does not change, as shown in Fig. 6. This change in the work balance leads to the acceleration of the aircraft for a constant altitude and TLA. A large number of flight tests are then performed for the accelerated cruise of the aircraft with constant TLA.
Balance of forces during the cruise phase.

The model developed here must be validated for the whole flight envelope; thus, the meshing of the flight envelope is a significant part of the methodology. The proposed solution consists in meshing the whole flight envelope using different flight tests conducted on the level D flight test simulator. Level D is the highest level of certification given by the FAA for flight dynamics toolbox. This level ensures that the flight dynamics data of the simulator are obtained within required tolerances with respect to the simulated test flight experiments.
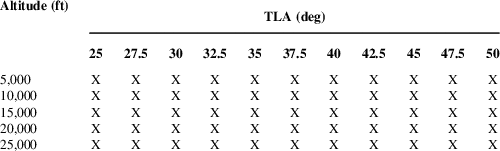
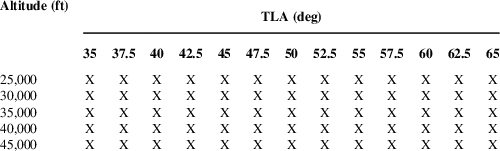
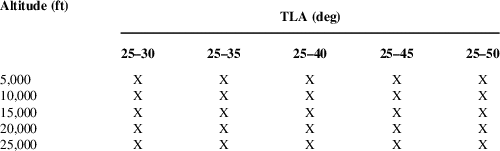
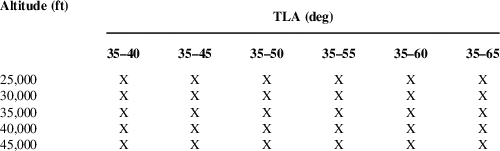
In order to mesh the whole flight envelope, the boundaries of the system are shown in Tables 1 and 2, and, more precisely, the inputs limits according to different hypotheses must be found.
Flight test distributions for low altitudes

Flight test distributions for high altitudes

However, in this aircraft modelling, the problem was that the TLA range varied according to the altitudes values. For example, the maximum TLA value required to trim the aircraft at 5,000 ft is 50°, the climb position. On the other hand, the minimum TLA value needed to maintain the altitude constant at 45,000 ft is 35°. To solve this TLA range issue, the flight tests meshing module was divided into two submodules, one for low altitudes, Table 1, and one for high altitudes, Table 2. Different meshings were used that are indicated in Tables 1 and 2.
The goal of the modelling process was to minimise the mean relative error as well as the number of flight tests. This error was calculated as the difference between the model responses explained in the previous section and the measured flight test data.
The modelling approach consisted in performing various flight tests with different TLA values at fixed altitudes. Then, if a flight test corresponding to a TLA value generated a high error in the model validation, it was used instead in the model identification. The best results were obtained with the meshing that are presented in Tables 1 and 2. The identification flight tests’ cases are presented in red, while the validation flight tests are shown in blue. Different sets of altitudes and TLAs were used in order to determine their impact on the final modelling error.
2.3.2 Simulated transient controls input flight tests
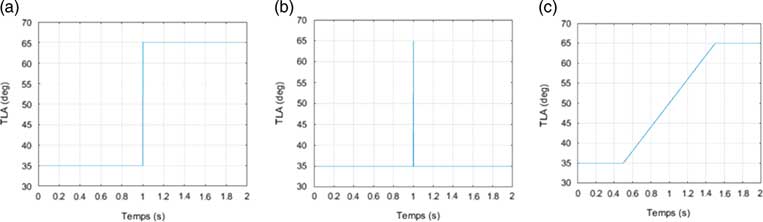
In order to model the dynamic part of flight tests, it is necessary to perform flight tests with a time-dependant input. Therefore, the choice was to perform flight tests with a TLA perturbation as input. Three main kinds of perturbations were chosen to be modelled, and they were expressed in Equations (1)–(3), where TLA0 is the initial TLA position, E 0 is the perturbation amplitude and T s is the acquisition time frequency:
∙ ‘Step’, an instant TLA variation, expressed as
(1) $$\eqalignno{ & {\rm If}\;{\rm }t\,\gt\,1,\quad {\rm TLA(}t{\rm )}{\equals}{\rm TLA}_{0} {\plus}E_{0} \cr & {\rm Else}\,{\rm TLA}(t){\equals}{\rm TLA}_{0} {\rm \hbox{;}\, } $$
∙ ‘Impulse’, an instant TLA variation which returns to the original position, expressed as
(2)
$$\eqalignno{ & {\rm If}\,1\,\lt\,t\,\lt\,1{\plus}T_{{\rm s}} ,\quad {\rm TLA(}t{\rm )}{\equals}{\rm TLA}_{0} {\plus}E_{0} \cr & {\rm Else}\,{\rm TLA(}t{\rm )}{\equals}{\rm TLA}_{0} \hbox{;\;{\rm and}} $$
∙ ‘Ramp’, a linear variation of TLA, expressed as


 $$\eqalignno{ & {\rm If}\,t\,\lt\,{\equals}0.5 \cr & {\rm TLA(}t{\rm )}{\equals}{\rm TLA}_{0} \cr & {\rm Else}\,{\rm if}\,0.5\,\lt\,t\,\lt\,1.5 \cr & {\rm TLA(}t{\rm )}{\equals}{\rm TLA}_{0} {\plus}E_{0} (t{\minus}0.5) \cr & {\rm Else}\,{\rm TLA}(t){\equals}{\rm TLA}_{0} {\plus}E_{0} . $$
The examples of TLA perturbations presented in Equations (1)–(3) are plotted as shown in Fig. 7.
TLA perturbations. (a) TLA step. (b) TLA impulse. (c) TLA ramp.

The dynamic flight test procedure is bit different than the one for simulated steady controls input flight tests. The aircraft is trimmed at a constant speed, altitude and TLA. The speed is directly linked to both the altitude and the TLA values. This study focuses on acceleration flight tests. The initial TLA value was fixed to the minimum of the flight envelope study, which is 25° for low-altitude flight tests and 35° for high-altitude flight tests as explained in the previous section. The TLA variation occurs at t=0, where the data acquisition starts. The flight tests were performed for different sets of altitudes and for various amplitude perturbations. The flight tests distributions for the low-altitude model and for the high-altitude model are presented in Tables 3 and 4.
Acceleration flight test distributions for low altitudes

Acceleration flight test distributions for high altitudes

The identification flight test cases are presented in red, and the validation flight tests are shown in blue. These flight tests were performed for the step, impulse and ramp perturbations.
3.0 STEADY CONTROLS INPUT SYSTEM RESPONSE MODELLING
The static system modelling was performed with two different approaches. The ‘Black Box’ approach consisted in using only an estimation algorithm to model the system, and the ‘Grey Box’ approach used the combination of an estimation algorithm with a mathematical model; both approaches are presented in the following sections.
3.1 Thrust modelling
A generic model was used for the thrust output and was further optimised with the estimation algorithm and the identification data.
Mattingly presented a thrust generic model( Reference Mattingly, Heiser and Pratt 51 ):
 $$F_{{\rm n}} (H,{\rm M}){\equals}F_{0} \left[ {{{{\rm \rrho (}H{\rm )}} \over {{\rm \rrho }_{0} }}} \right]^{{0.6}} \left[ {0.568{\plus}{{(1.2{\minus}{\rm M})^{2} } \over 4}} \right]$$
as a function of the net thrust, F
n, the maximum trust at sea level, F
0, the air density at the altitude H,
 ${\rm \rrho }(H)$
, the air density at sea level,
 ${\rm \rrho }_{0} $
and the Mach number, M.
Another model that is dependent on the take-off conditions was developed by Torenbeek( Reference Torenbeek 52 ):
 $$F_{{\rm n}} \left( {H,{\rm M}} \right){\equals}F_{0} \left[ {1{\minus}{{1{\plus}{\rm BPR}} \over {\sqrt {5{\rm \eta }_{{\mib{j}} } \left( {1{\plus}{\rm \eta }_{{{\rm t}_{{{\rm to}}} }} {\rm BPR}} \right)} G_{0} }}{\rm M}{\plus}\left( {0.6{\plus}{{0.11{\rm BPR}} \over {G_{0} }}} \right){\rm M}^{2} } \right]$$
where η j is the nozzle efficiency, ηt the turbine efficiency and BPR is the bypass ratio. The index to for η t indicates that the parameters’ values are obtained for take-off (to) conditions. G 0 is the generator function that is expressed as follows:
 $$G_{0} \left( {{\rm EPR,M,ITT}} \right){\equals}\left[ {\left( {{{{\rm ITT}} \over {T_{0} }}} \right)_{{{\rm to}}} {\minus}{{{\rm EPR}^{{{{{\rm \rgamma }{\minus}1} \over {\rm \rgamma }}}} {\minus}1} \over {{\rm \reta }_{{\rm c}} }}} \right]\left[ {1{\minus}{{1.01} \over {{\rm EPR}^{{{{{\rm \rgamma }{\minus}1} \over {\rm \rgamma }}}} \left( {{{{\rm EPR}^{{{{{\rm \rgamma }{\minus}1} \over {\rm \rgamma }}}} {\minus}1} \over {\left( {{{{\rm ITT}} \over {T_{0} }}} \right)_{{{\rm to}}} {\rm \reta }_{{\rm c}} {\rm \reta }_{{\rm t}} }}} \right)}}} \right]{\rm M}^{2} $$
where ITT is the inter-turbine temperature, T 0 is the temperature at sea level, EPR is the engine pressure ratio, ηc is the compressor efficiency and γ the adiabatic coefficient. Torenbeek’s model depends on the speed, with its reliance on the Mach number, but it is also indirectly dependent on the altitude and TLA since it varies with the EPR and the ITT.
There are other models, such as the aerospatial model, with k a constant determined experimentally( Reference Roux 53 ):
 $$F_{{\rm n}} \left( {H,{\rm M}} \right){\equals}k{{{\rm \rrho }\left( H \right)} \over {{\rm \rrho }_{0} }}\left[ {1{\minus}{\rm M}{\plus}{{{\rm M}^{2} } \over 2}} \right]$$
and Wanner’s(
Reference Wanner
54
) model that also depends on the engine class and uses the constants
 $k_{{\rm f}} $
and
 ${\rm \rlambda }_{{\rm f}} $
:
 $$F_{{\rm n}} \left( {H,{\rm M}} \right){\equals}k_{{\rm f}} {\rm \rrho }\left( H \right)[a{\rm M}]^{{{\rm \rlambda }_{{\rm f}} }} $$
The two last models have been adapted in various studies( Reference Ghazi, Botez and Achigui 43 , Reference Roux 53 , Reference Rodriguez and Botez 55 , Reference Bardela and Botez 56 ).
In his book( Reference Saravanamuttoo, Rogers and Cohen 26 ), Saravanamuttoo described a complete engine model by considering every component of the engine. This approach was used here and gave accurate results. Another approach considered only the ‘Cold Thrust’ part of the engine, which is the thrust generated by the air passing through the fan and that bypassed the other engine components (high-pressure compressor, burner, high-pressure turbine and low-pressure turbine). The ‘Cold Thrust’ portion represents approximately 75% of the net thrust. The ‘net thrust’ can then be calculated as follows:
 $$\eqalignno{ F_{{\rm n}} \left( {H,{\rm M}} \right){\equals}& {{W_{{\rm a}} {\rm .BPR}} \over {{\rm BPR}{\plus}1}}.\left[ {2.C_{{{\rm pa}}} .({\rm \reta }_{J} .T_{{\rm a}} .{\rm FPR}^{{{{{\rm \rgamma }_{{\rm a}} } \over {{\rm \reta }_{{\rm f}} {\rm .(\rgamma }_{{\rm a}} {\minus}1)}}}} \left( {1{\minus}\left( {{\raise0.7ex\hbox{$1$} \!\mathord{\left/ {\vphantom {1 {FPR}}}\right.\kern-\nulldelimiterspace}\!\lower0.7ex\hbox{${FPR}$}}} \right)} \right)^{{{{{\rm \rgamma }_{{\rm a}} } \over {{\rm \reta }_{{\rm f}} .({\rm \rgamma }_{{\rm a}} {\minus}1)}}}} ))} \right]^{{0.5}} {\minus}{\rm W}_{{\rm a}} {\rm C}_{{\rm a}} \cr & W_{{\rm a}} {\equals}{\rm \rrho }\left( H \right)SC_{{\rm a}} \cr & C_{{\rm a}} {\equals}{\rm M}\sqrt {{\rm \rgamma }_{{\rm a}} {\rm RT}_{{\rm a}} } $$
where
 $W_{{\rm a}} $
is the inlet mass flow,
 $ C_{{\rm a}} $
is the air inlet velocity,
 $C_{{{\rm pa}}} $
is the specific heat at constant pressure at the ambient temperature,
 $T_{{\rm a}} $
is the ambient temperature depending of the altitude,
 ${\rm \rgamma }_{{\rm a}} $
is the ratio of specific heats,
 ${\rm \reta }_{{\rm f}} $
is the fan efficiency,
 ${\rm \reta }_{J} $
is the nozzle efficiency, S is the air surface passing through the fan and FPR is the fan pressure ratio.
3.2 Fuel flow modelling
Fuel flow is much more difficult to predict than the thrust. This difficulty may be due to the fact that the fuel flow is controlled by the computer integrated in the aircraft (FADEC). For example, the fuel flow is controlled in order to maintain a reasonable combustor outlet temperature (around 900°C). In fact, a too high temperature could damage the turbine blade positioned next to the combustor.
Torenbeek( Reference Torenbeek 52 ) also described a fuel consumption model which is expressed by the following equation:
 $$W_{{\rm f}} \left( {H,{\rm M}} \right){\equals}F_{{\rm n}} \left[ {{{\left( {{{{\rm ITT}} \over {T_{0} }}} \right)_{{{\rm to}}} {\minus}{\rm \mu }\left[ {1{\plus}{{\left( {{\rm EPR}^{{{{{\rm \rgamma }{\minus}1} \over {\rm \rgamma }}}} {\minus}1} \right)} \over {{\rm \reta }_{{\rm c}} }}} \right]\sqrt {{T \over {T_{0} }}} } \over {\sqrt {5{\rm \reta }_{j} \left( {1{\plus}{\rm \reta }_{{t_{{{\rm to}}} }} {\rm BPR}} \right)} \sqrt {G_{0} {\plus}0.2{\rm M}^{2} {{{\rm \reta }_{{\rm f}} } \over {{\rm \reta }_{{\rm t}} }}{\rm BPR}} {\minus}\left( {1{\plus}{\rm BPR}} \right){\rm M}}}{\rm M}} \right]$$
where all the parameters are the same as those expressed in Equations (5) and (6).
BADA( Reference Nuic 57 ) is a software for calculating the fuel consumption of an aircraft. It uses a fuel flow model integrated in it and given by the following equations:
 $${\rm If}\,H\leq 25,000\,ft\quad {\rm W}_{{\rm f}} (F_{{\rm n}} ){\equals}F_{{\rm n}} .{{C_{{fl1}} } \over {6,000}}\left( {1{\plus}{{1.9438C_{{\rm a}} } \over {C_{{{\rm fl2}}} }}} \right)$$
 $${\rm If}\,H\,\gt\,25,000\,ft\quad W_{{\rm f}} (F_{{\rm n}} ){\equals}F_{{\rm n}} .{{C_{{{\rm fl1}}} } \over {6,000}}\left( {1{\plus}{{1.9438C_{{\rm a}} } \over {C_{{{\rm fl2}}} }}} \right)C_{{{\rm fcr}}} $$
where
 $C_{{{\rm fl1}}} $
,
 $ C_{{{\rm fl2}}} $
and
 $C_{{{\rm fcr}}} $
are constants that are programmed in the software and the fuel flow
 $W_{{\rm f}} $
is in lbs per second.
Yoder( Reference Yoder 58 ) exposed another approach for fuel flow modelling, based on the Hill and Peterson approach( Reference Hill and Peterson 59 ). His model is expressed as follows:
 $$W_{{\rm f}} \left( {H,{\rm M}F_{{\rm n}} } \right){\equals}F_{{\rm n}} .\sqrt {\rm \theta } .\left[ {{\rm \ralpha }{\plus}{\rm \rbeta }_{1} {\rm M}{\plus}{\rm \rbeta }_{2} {\rm e}^{{{\minus}{\rm \rbeta }_{3} \left( {{\raise0.7ex\hbox{${F_{{\rm n}} }$} \!\mathord{\left/ {\vphantom {{F_{{\rm n}} } {{\rm \delta }^{{0.9}} }}}\right.\kern-\nulldelimiterspace}\!\lower0.7ex\hbox{${{\rm \rdelta }^{{0.9}} }$}}} \right)^{{0.3}} }} } \right]$$
where θ is the ratio of ambient temperature to sea level standard, δ is the ratio of ambient pressure to sea level standard, and α and β i , i=[1,2,3] are constants to be determined.
In this paper, Yoder’s model was modified in order to obtain more accurate results, and its expression is given by the next equation:
 $$W_{{\rm f}} \left( {{\rm M},F_{{\rm n}} ,{\rm FPR},P} \right){\equals}F_{{\rm n}} .\left[ {{\rm \rbeta }_{1} {\plus}{\rm \rbeta }_{2} {\rm M}{\plus}{\rm \rbeta }_{3} {\rm e}^{{{\minus}{\rm \rbeta }_{4} \left( {{\raise0.7ex\hbox{${{\rm FPR}}$} \!\mathord{\left/ {\vphantom {{{\rm FPR}} {{\raise0.7ex\hbox{$P$} \!\mathord{\left/ {\vphantom {P {P_{0} }}}\right.\kern-\nulldelimiterspace}\!\lower0.7ex\hbox{${P_{0} }$}}^{{0.9}} }}}\right.\kern-\nulldelimiterspace}\!\lower0.7ex\hbox{${{\raise0.7ex\hbox{$P$} \!\mathord{\left/ {\vphantom {P {P_{0} }}}\right.\kern-\nulldelimiterspace}\!\lower0.7ex\hbox{${P_{0} }$}}^{{0.9}} }$}}} \right)^{{0.3}} }} } \right]$$
3.3 Estimation algorithm
3.3.1 Unmeasurable parameters
This study’s level D flight simulator is an excellent tool for acquiring data, but it does not measure all the parameters presented in the equations of sections D and E, namely their different efficiencies. The researchers decided to determine the parameters in the mathematical model with an estimation algorithm.
The purpose of an estimation algorithm is to reduce the error ε between the output measured on the real system and the output calculated from a proposed model. This algorithm tunes the different parameters of the system θ, thereby improving the model’s accuracy. Thus, estimation algorithm uses a cost function,
 $J({\rm \rtheta })$
, and tunes the system’s parameters to reduce the cost function which leads to new estimated parameters
 ${\hat{\rtheta }} $
(
Reference Jategaonkar
49
,
Reference Klein and Morelli
50
). In this study, since the least square method is used, the cost function is expressed as follows:
 $$J{\rm (\rtheta )}{\equals}{1 \over 2}\mathop \sum\limits_{k{\equals}1}^N {\repsilon}(k)^{2} {\equals}{1 \over 2}{\rm {\repsilon}}^{{\rm t}} {\rm {\repsilon} }$$
Different estimation algorithms could be used to reduce this cost function, such as the Levenberg–Marquardt (LM) and the particle swarm optimisation (PSO) algorithms.
The LM is an iterative algorithm coupling the speed convergence of the gradient algorithm with the accuracy of the Gauss–Newton algorithm dependent on the values of the damping parameters λ. Using this algorithm, an initial value of the parameters to identify, θ, is postulated and then corrected by adding
 ${\rm \rdelta \rtheta }$
, calculated with the following equation:
 $${\rm \rdelta \rtheta }{\equals}\left( {J^{T} .J} \right)^{{{\minus}1}} J^{T} \left( {y{\minus}f\left[ {x,{\rm \rtheta }} \right]} \right)$$
where J is the Jacobian, y is the actual output data and f is the mathematical model, dependent on the input x and the parameters to identify represented by θ.
The new value is then used as the initial value and the process is iterated until the precision criterion, basically the maximal error tolerated, has been reached.
PSO is a metaheuristic algorithm based on the social behaviour of some animals( Reference Eberhart and Kennedy 60 ). A set of different initial potential solutions are used to start the algorithm procedure, and the cost function is calculated for each potential solution. A global leader, the best solution found, and a local leader for the best solution among a chosen restricted population are defined. The motion of the particle V k+1 is then required in order to calculate the particle’s next position X k+1 , which is dependent on three parameters: the former motion’s inertia, ω, the local leader’s influence Pl and the global leader’s influence P g:
 $$\eqalignno{ & V_{{k{\plus}1}} {\equals}{\rm \romega }V_{k} {\plus}b_{1} \left( {P_{l} {\minus}X_{k} } \right){\plus}b_{2} \left( {P_{g} {\minus}X_{k} } \right) \cr & X_{{k{\plus}1}} {\equals}X_{k} {\plus}V_{{k{\plus}1}} $$
where b 1 and b 2 are randomly equal to 0 or 1. The process is iterated until the precision criterion is reached.
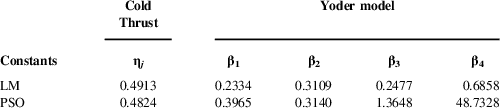
Both algorithms were used on the different models to calculate the parameters’ values, θ. The following chart presents the parameters’ identification results for the ‘Cold Thrust’ and the ‘Yoder’ models.
As expected, the algorithms LM and PSO provide different coefficients of the ‘Cold Thrust’ and ‘Yoder’ models at high and low altitudes as shown in Tables 5 and 6, respectively.
Parameter values at high altitudes

Parameters values at low altitudes

3.3.2 Black Box
The estimation algorithm can be applied to solve non-linear problems iteratively, by using orthogonal functions, such as polynomial functions. The estimated parameters are then the coefficients of the polynomial function, determined by the LM optimisation algorithm( Reference Marquardt 61 ). A maximum of two inputs’ influences can be expressed through the polynomial function, but our models have three inputs. Since our flight tests were performed with fixed altitude and TLA, the solution was to fix the TLA and to identify a polynomial function depending upon the altitude and the Mach number, for the thrust:
 $${\mib{ }} F_{{\rm n\;HM}} \left( {H,{\rm M}} \right){\equals}\mathop \sum\limits_{i{\equals}0}^n \mathop \sum\limits_{j{\equals}0}^m p_{{ij}} {\rm M}^{i} H^{j} $$
where
 $p_{{ij}} $
are the polynomial function coefficients, and where n and m are the polynomial function degrees. A polynomial function can then be identified in order to find the coefficients
 $p_{{ij}} $
dependent on the TLA values:
 $${\rm }p_{ij} \left( {{\rm TLA}} \right){\equals}\mathop \sum\limits_{k{\equals}0}^l p_{k} {\rm TLA}^{k} $$
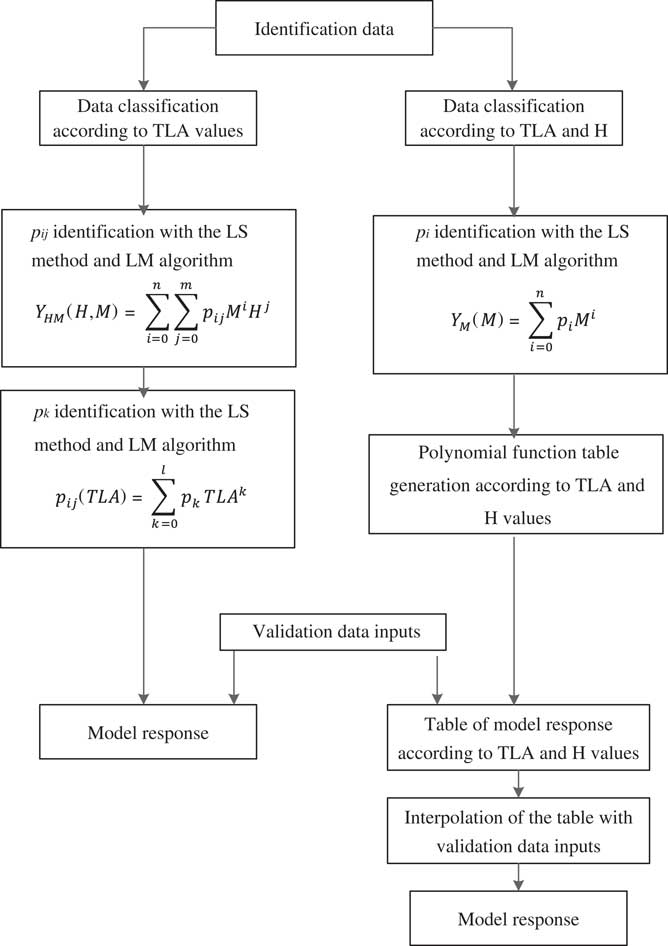
This whole process could have also been performed by fixing the altitude instead of the TLA; the principle is the same. By combining Equations (18) and (19), it is possible to express an output based on the three inputs by using an estimation algorithm. This polynomial ‘Black Box’ approach was performed for each output (FPR, EPR, ITT, F n and Wf).
Another ‘Black Box’ approach was performed using tables and interpolations. This procedure began with the identification of a polynomial function for each flight test, depending on the Mach number,
 $ F_{{\rm nTLA,H}} ({\rm M})$
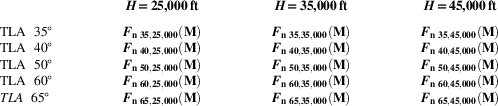
for example, in the thrust output case. All these polynomial functions were then listed in Table 7 according to the TLAs and altitudes.
Table of polynomial functions to interpolate for high altitude

During the validation process, the Mach number was applied to each of the polynomial functions from the table, and all of the values were interpolated according to the TLA and altitude input values.
The two ‘Black Box’ approaches are summarised in Fig. 8.
Black Box identification process.

3.3.3 Polynomial correction
The above section presented the ‘Black Box’ approach, which corresponds to estimation algorithm by itself. The combination of an estimation algorithm and a mathematical model correspond to the ‘Grey Box’ approach, which was described in sections D and E.
A polynomial correction can be added to a theoretical mathematical model in order to improve the ‘Grey Box’ model’s accuracy. For example, a thrust mathematical model
 $F_{{\rm n}} _{{{\rm th}}} $
can improved with a polynomial function dependent on the Mach number M and altitude H:
 $${\rm }F_{{\rm n\;tot}} \left( {H,{\rm M,TLA}} \right){\equals}F_{{\rm n\;{th}}} \mathop \sum\limits_{i{\equals}0}^n \mathop \sum\limits_{j{\equals}0}^m p_{{ij}} {\rm M}^{i} H^{j} $$
where
 $ F_{{\rm n\;tot}} $
is the final thrust model. However, the polynomial correction may also depend on other variables, and parameters such as the FPR, EPR and ITT for the thrust, and
 $F_{{\rm n}} $
for the fuel flow.
3.3.4 Polynomial degrees and interpolation method
The use of estimation algorithms allows solving various problems. For example, the polynomial degrees can vary in the different approaches exposed previously. A change in degrees changes the identification success rate, as well as the validation success rate. Generally, it was observed that higher degrees for the polynomial approach or for the interpolation method provided more accurate results for the identification process, but not eventually for the validation process. In addition, using polynomial corrections, the inputs values chosen can vary, thus giving different output results. For example, with the thrust final model, the best results were obtained with a polynomial correction dependent on the Mach number and the FPR, where n=m=5, while with the ‘Black Box’ interpolation approach, the best results were obtained using the spline approximation for each output modelling.
3.4 Synthesis
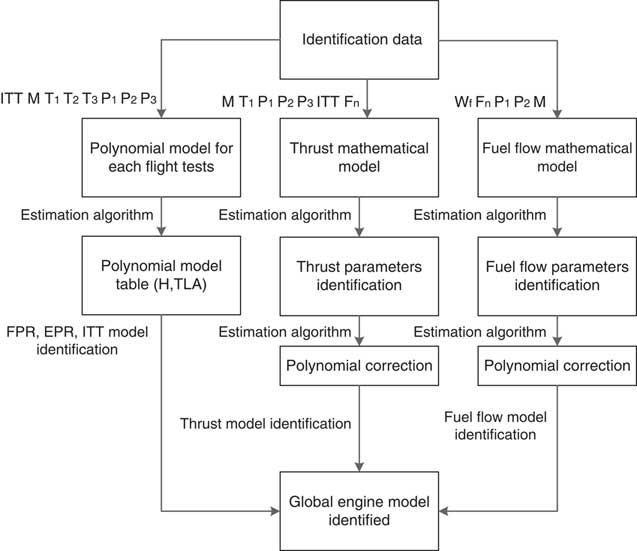
Both the ‘Grey Box’ and ‘Black Box’ approaches may be performed to identify the thrust and the fuel flow. In this work, only ‘Black Box’ approaches have been used for the FPR, EPR and ITT prediction (i.e. no theoretical model was used).
An example of the global identification procedure is summarised in Fig 9, in which the FPR, EPR and ITT are identified with the ‘Black Box’ interpolation approach, the thrust is identified with the ‘Cold Thrust’ model, and the fuel flow with the ‘Yoder’ model.
Global engine model identification process.

4.0 TRANSIENT CONTROLS INPUT SYSTEM RESPONSEMODELLING
4.1 Settings
The method chosen to identify the dynamic model consisted in dividing the output data Y from the simulator by the static model response identified in the previous section. The ratio between the actual model data and the static model responses is given below:
 $$Y_{{{\rm ratio}}} {\equals}{\rm [FPR}_{{{\rm ratio}}} {\rm ,EPR}_{{{\rm ratio}}} {\rm ,ITT}_{{{\rm ratio}}} ,F_{{\rm n\;ratio}} ,W_{{\rm f\;ratio}} ]$$
With
 ${\rm FPR}_{{{\rm ratio}}} {\rm {\equals}}{{{\rm FPR}_{{{\rm dyn}}} } \over {{\rm FPR}_{{{\rm stat}}} }}$
;
 ${\rm EPR}_{{{\rm ratio}}} {\rm {\equals}}{{{\rm EPR}_{{{\rm dyn}}} } \over {{\rm EPR}_{{{\rm stat}}} }}$
;
 ${\rm ITT}_{{{\rm ratio}}} {\rm {\equals}}{{{\rm ITT}_{{{\rm dyn}}} } \over {{\rm ITT}_{{{\rm stat}}} }}$
;
 ${\rm F}_{{\rm n\;ratio}} {\rm {\equals}}{{{\rm F}_{{\rm n\;dyn}} } \over {{\rm F}_{{\rm n\;stat}} }}{\rm }$
;
 ${\rm W}_{{\rm f\;ratio}} {\rm {\equals}}{{{\rm W}_{{\rm f\;dyn}} } \over {{\rm W}_{{\rm f\;stat}} }}$
.
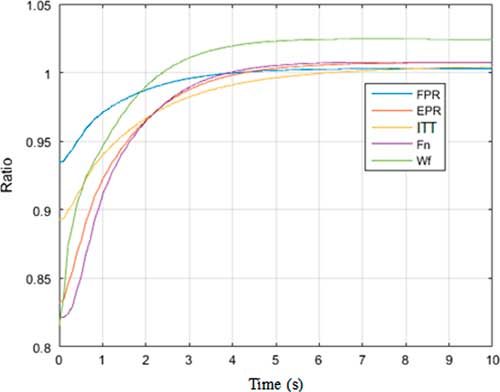
The stat index represents the response of the static model and the dyn index represents the acceleration flight tests data. The different ratios obtained with step perturbations are represented in Fig. 10.
Ratios between the static (sta) and the dynamic (dyn) models using step perturbation.

Figure 10 shows that the system outputs’ responses are slightly different. For example, the thrust ratio starts slower than the others, while the ITT response is the last to reach the steady state. In addition, the difference between the FPR data from the simulator and the FPR of the static model is smaller than that of the other outputs, since the ratio starts around 0.94 and the ratios of the other outputs are below 0.9. Lastly, the fuel flow final response exceeds 1, which was due to the static model’s imprecision; there was to 2% underestimation of the fuel flow output with the static model, which is why the fuel flow ratio exceed 1 as shown in Fig. 10.
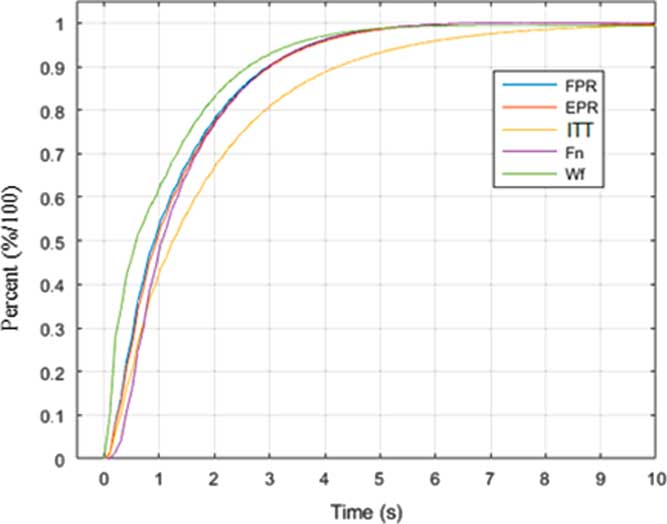
In order to facilitate the modelling, the ratios given in Fig. 10 were scaled from 0 to 1 with Equation (22) as shown in Fig. 11:
 $$Y_{{{\rm ratio\,\%}}} {\equals}{{(Y_{{{\rm ratio}}} {\minus}Y_{{{\rm ratio\;i}}} )} \over {(Y_{{{\rm ratio\;f}}} {\minus}Y_{{{\rm ratio\;i}}} )}}$$
Ratios between the static and the dynamic model responses with step perturbation, scaled from 0 to 1.

The scaled responses are presented in Fig. 11.
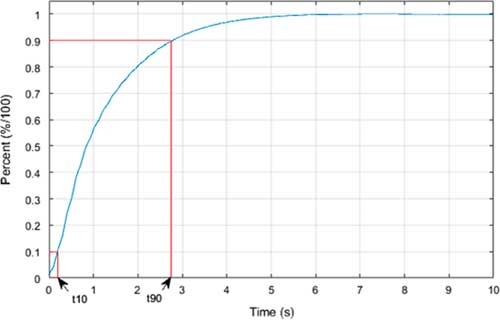
The above ratios represent the actual response of the system that was identified in the following sections. In order to evaluate the different models’ accuracy, the validation criteria established by the FAA were used; a validation success was obtained if the time response at 90%, t 90, and at 10%, t 10, of the output was predicted within 10% error with the actual data as shown in Fig. 12:
Time response at 10% and 90% for the thrust output.

4.2 Grey Box modelling
4.2.1 Step modelling
By considering the different responses represented in the ratios as shown in Fig. 11, first- and second-order transfer functions were used in order to model the dynamic response. The first-order function equation is the following:
 $$Y_{{{\rm ratio}}} (t){\equals}\left[ {1{\minus}(1{\minus}Y_{0} ){\rm exp}\left( {{\minus}{\raise0.7ex\hbox{$t$} \!\mathord{\left/ {\vphantom {t {\tau _{0} }}}\right.\kern-\nulldelimiterspace}\!\lower0.7ex\hbox{${\tau _{0} }$}}} \right)} \right]{\rm TLA}\left( t \right)$$
where Y is one of the five outputs such as FPR and EPR and where the index ratio means that the data from the simulator were divided by the static model response. The parameter to identify is the time constant
 ${\rm \tau }_{0} $
.
The first approach consists in a direct identification used to reduce the sum of the squared error between the model response and the data from the simulator. This study directly identifies this time constant in order to fit the 90% time response:
 $${\rm \rtau }_{0} {\equals}{{{\minus}t_{{90}} } \over {{\rm ln}\left[ {{\raise0.7ex\hbox{${\left( {1{\minus}0.9} \right)}$} \!\mathord{\left/ {\vphantom {{\left( {1{\minus}0.9} \right)} {\left( {1{\minus}Y_{0} } \right)}}}\right.\kern-\nulldelimiterspace}\!\lower0.7ex\hbox{${\left( {1{\minus}Y_{0} } \right)}$}}} \right]}}$$
No parameters were identified to meet the 10% time response criterion. The solution was to add a time delay T d. While we may have been able to calculate it with an estimation algorithm, an iterative approach was chosen instead.
The time response at 10% of the model was calculated for T
d =0 and T
d =T
s, with T
d being the delay time and T
s the sample time. If the tolerance criterion with T
d =T
s was less than the tolerance criterion with T
d =0, then T
d was increased, so that T
d =T
d +T
s, and the process was iterated until the lowest tolerance at 10% of the time response was found with the corresponding delay time T
d. Then, the new time constant
 ${\rm \rtau }_{0} $
was calculated with the following equation:
 $${\rm \rtau }_{0} {\equals}{{T_{{\rm d}} {\minus}t_{{90}} } \over {{\rm ln}\left[ {{\raise0.7ex\hbox{${\left( {1{\minus}0.9} \right)}$} \!\mathord{\left/ {\vphantom {{\left( {1{\minus}0.9} \right)} {\left( {1{\minus}Y_{0} } \right)}}}\right.\kern-\nulldelimiterspace}\!\lower0.7ex\hbox{${\left( {1{\minus}Y_{0} } \right)}$}}} \right]}}$$
A second-order transfer function was also used; its expression depends on the damping parameter ξ values:
∙ If ξ>1, the state of the system is aperiodic, and the step response is expressed as follows:
 $$\eqalignno{ & Y_{{{\rm ratio}}} \left( t \right){\equals}\left[ {1{\plus}{1 \over {{\rm \rtau }_{2} {\minus}{\rm \rtau }_{1} }}\left( {{\rm \rtau }_{1} {\rm e}^{{{\raise0.7ex\hbox{${{\minus}t}$} \!\mathord{\left/ {\vphantom {{{\minus}t} {{\rm \rtau }_{1} }}}\right.\kern-\nulldelimiterspace}\!\lower0.7ex\hbox{${{\rm \rtau }_{1} }$}}}} {\minus}{\rm \rtau }_{2} {\rm e}^{{{\raise0.7ex\hbox{${{\minus}t}$} \!\mathord{\left/ {\vphantom {{{\minus}t} {{\rm \rtau }_{2} }}}\right.\kern-\nulldelimiterspace}\!\lower0.7ex\hbox{${{\rm \rtau }_{2} }$}}}} } \right)} \right]{\rm TLA}\left( t \right) \cr & {\rm \rtau }_{1} .{\rm \rtau }_{2} {\equals}{1 \over {{\rm \romega }_{{\rm n}} ^{2} }}\,{\rm and}\,2\,\,{\rm \xi }{\equals}{{{\rm \rtau }_{1} {\plus}{\rm \rtau }_{2} } \over {\sqrt {{\rm \rtau }_{1} .{\rm \rtau }_{2} } }} $$
where τ1 and τ2 parameters depend upon ξ and ωn.
∙ If ξ<1, the state of the system is periodic, and the step response is expressed as follows:
 $$Y_{{{\rm ratio}}} \left( t \right){\equals}\left[ {1{\minus}{{{\rm e}^{{{\minus}t{\rm \romega }_{n} {\rm \xi }}} } \over {\sqrt {1{\minus}{\rm \xi }^{2} } }}\left( {{\rm cos}({\rm \romega }_{n} \left( {1{\minus}{\rm \xi }^{2} } \right)t{\plus}{\rm arcsin}({\minus}{\rm \xi })} \right)} \right]{\rm TLA}\left( t \right)$$
No direct solution was found for ξ and ωn values that would fit the tolerance criterion; therefore, it was decided to identify them with the LM estimation algorithm.
4.2.2 Impulse modelling
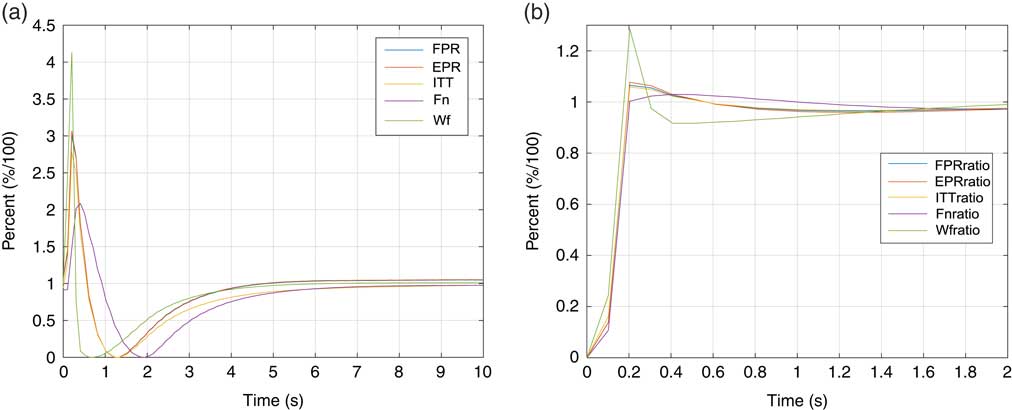
The dynamic responses to identify are presented in Fig. 13.
The difference between Fig 13(a) and (b) shows that the static model changes very much the dynamic response. Figure 13(a) looks like a classic second-order impulse response, while Fig. 13(b) seems to be a response to a particularly fast step. The response presented in Fig. 13(b) also seems easier to identify. Therefore, the static model was used for system identification with the same equations as those used to identify the step response in the previous section (Equations (23)–(27)).
Dynamic response with an impulse perturbation.

4.2.3 Ramp modelling
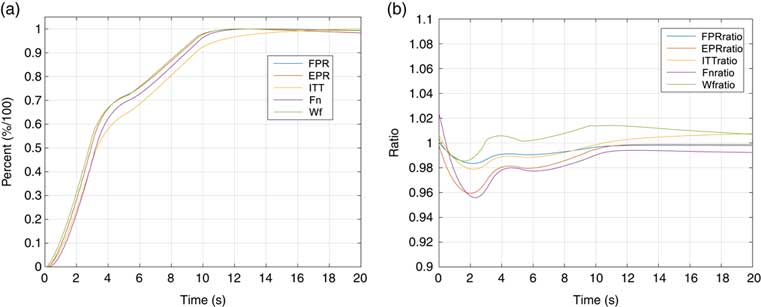
The dynamic response to identify is presented as shown in Fig. 14.
Dynamic response with a ramp perturbation.

Once again, the static model modifies the dynamic response, revealing that by applying the static model, the relative error does not exceed 4.5% in Fig. 14(b). In addition, the ramp presented here corresponds to the highest amplitude and, thus, to the highest error, as the maximum error decreases with the ramp amplitude. However, the response of the system with the static model applied, presented in Fig. 14(b), does not correspond to a classic function. The responses presented in Fig. 14(a) seem to be easier to identify, but the curve is ‘concave’, while classic ramp transfer functions are ‘convex’ as shown in Fig. 14(a).
Therefore, it does not seem to be a model wisely chosen. Instead, a concave function as those presented in section Step modelling was used. The model is identified as a slow step response with the same tools as those presented in section Step modelling.
4.3 Black Box modelling
4.3.1 Model presentation
A state-space model was used to identify the model responses to different perturbations:
 $$\eqalignno{ & \dot{X}{\equals}{\bf A}X{\plus}{\bf B}U{\plus}{\bf G}v \cr & Y{\equals}{\bf C}X{\plus}{\bf D}U{\plus}{\bf H}w $$
where Y is a vector with different outputs, U represents the inputs, X is the state of the system,
 ${\bf Y}{\equals}\left[ {{\rm FPR,EPR,ITT,}F_{{\rm n}} ,W_{{\rm f}} } \right], \quad {\bf U}{\equals}[{\rm TLA}]$
, and A, B, C, and D are matrices representing the behaviour of the system. v represents the noise of the data acquisition and w represents the noise filter noise. G and H are the matrices representing the noise behaviour.
It was chosen to use the canonic form of this system and to neglect the noise, which imply that C was the identity matrix, D=v=w=0, and Y=X. The final system to identify is expressed now as the following:
 $$\dot{Y}{\equals}{\bf AY{\plus}BU}$$
4.3.2 State-space identification
The subspace method was utilised to identify matrices A and B; this method uses different orthogonal and oblique projections between the Hankel matrices formed with the input U and output Y vectors ( Reference Flint and Vaccaro 62 ).
This method offers different choices to the user:
∙ The identification of the order of the system. This identification is directly related to the size of matrix A, and, therefore, to the number of parameters to identify.
∙ The composition of the output vector. The simplest way for this composition would be to directly express all the different outputs in a single vector; this approach influences the sizes of the A and B matrices, and, thus, the number of parameters to identify.
These two parameters might not seem important during the identification process since the results look similar, but they play their roles in the validation process. The purpose in this paper is to identify the different parameters of the matrices A and B for different altitudes and perturbation amplitudes. These parameters are saved in tables and will be interpolated in these tables in the system validation process. Thus, it was observed that the validation process presented more accurate results when the parameters’ values did not vary, or, if they did vary, only increasing or decreasing.
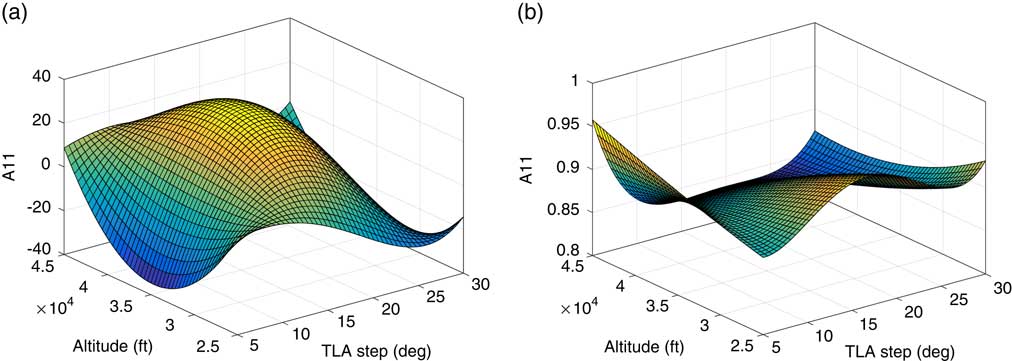
For example, with a five outputs and a fifth-order ‘Black Box’ model, which means 30 parameters to identify, the first coefficient of matrix A, called A 11, varies considerably with altitudes and TLAs, as shown in Fig. 15(a). However, with one output and a fourth order, it varies less, as shown in Fig. 15.
A 11 variation according to the altitude and the TLA step for two different systems representations.

The identification process followed by the validation process is needed in order to determine the model accuracy, and, thus, it require stable parameters to be identified.
5.0 RESULTS AND VALIDATION OF THE MODEL
The validation criterion established by the FAA was used to evaluate the models’ accuracy: a success in model validation or identification is obtained when the thrust is predicted within a 5% error margin. This criterion remains the same for the fuel consumption.
5.1 Static model results
5.1.1 FPR, EPR and ITT results
The results obtained for the FPR, EPR and ITT using different models are presented in Tables 8–10.
Mean relative error obtained with the FPR and EPR at low altitudes

Mean relative error obtained with the FPR and EPR at high altitudes

Mean relative error obtained with the ITT at low and high altitudes

The stage-stacking method is able to predict the FPR and the EPR but not the ITT( Reference Bardela, Botez and Pageaud 63 ). The first observation is that the results were slightly better at high altitudes than those obtained at low altitudes, which can be explained by the data acquisition process; the flight tests at low altitudes and high TLA’s were much more difficult to perform, because of the fact that their altitudes were difficult to maintain. This altitude variation explains the accuracy drop at low altitudes. The best results were obtained with the ‘Black Box’ interpolation method; therefore, this model will be used in the rest of the study.
5.1.2 Thrust and fuel flow results
The results obtained for the different thrust models exposed in Sections 3.1 and 3.2 at high altitude are presented in Table 11.
Thrust validation results for different models at high altitudes

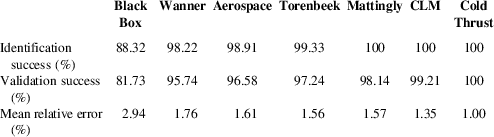
‘CLM’ in Table 11 stands for ‘component level modelling’, in which all the components of an engine are modelled( Reference Bardela and Botez 56 ). The best results were obtained with the Cold Thrust model as seen in Table 11. Thus, this model was the best in predicting the thrust input of the fuel flow.
The fuel flow prediction results obtained using six models are presented in Table 12.
Fuel flow validation results for different models at high altitudes

The modified Yoder model called ‘Yoder+’ was expressed, as shown previously, by Equation (14); this model presents the best results with respect to the other models, and gives 99.68% validation success and only 1.38% mean relative error. The models presented in Table 11 were not used since they could not predict the fuel flow.
The results presented in Tables 8–12 show that the ‘Interpolation Black Box’, the ‘Cold Thrust’, and the improved ‘Yoder’ models were the most accurate for high-altitudes’ prediction. The results obtained for low-altitudes’ models are presented in Table 13.
Thrust and Fuel flow validation results for different models at low altitudes

The parameters were identified with the LM algorithm in as presented in Tables 8–13.
A similar type of results was obtained with the parameters identified with the PSO algorithm, but less accuracy was obtained (around 1.1% mean relative errors and 100% validation success for the thrust at high altitude and 1.4% and 99.2%, respectively, for the fuel flow).
5.2 Dynamic model results
5.2.1 Step response
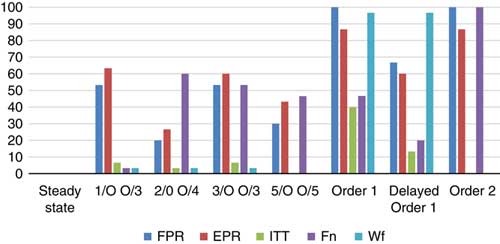
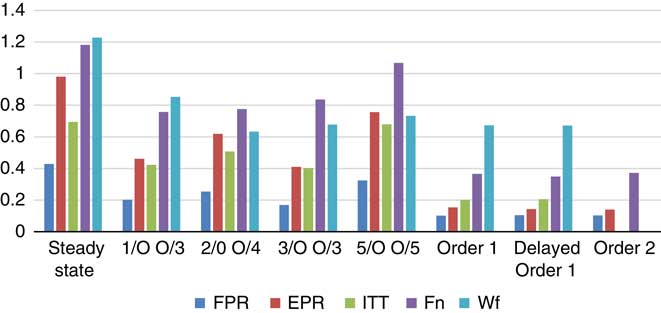
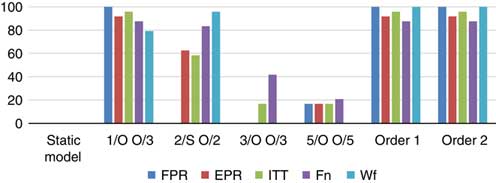
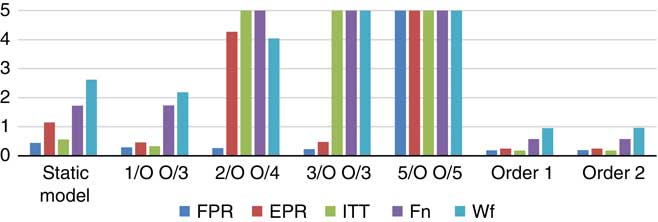
The validation of the different models with the step response input is presented in Figs 16 and 17. The notation 1/O O/3, for example, refers to the ‘Black Box’ model and has 1 output, and it was identified with a third-order system; the ‘Grey Box’ model is referred as the first-order 1 or 2 system, as presented in section Introduction.
Validation success results of the dynamic models step response.

Mean relative error results of the dynamic models step response.

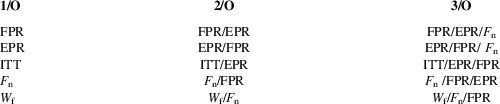
The different dynamic models made possible to reduce their mean relative error with respect to the static model mean relative error. However, it was observed that the ‘Grey Box’ models globally give a lower mean relative error than the ‘Black Box’ model. The best results are generally obtained with the delayed order 1 system, except for the fuel flow prediction. The identification success was 100% in all cases for each output (these results are not here presented). Regarding the mean relative error, the various ‘Grey Box’ model results were similar, and the model with the lowest mean relative error was not the same for each output. The best results for the validation criterion were obtained with the ‘Grey Box’ order 1 model for any of the outputs studied. The ‘Black Box’ models presented less accurate results, especially in validation success, but they also presented a correct mean relative error. The different output combinations are also presented in Table 14; they were chosen because they gave the best results.
Best output combination summary

The same output combinations were used for the impulse and the ramp responses model studies.
5.2.2 Impulse
The validation of different impulse responses’ models is presented in Figs 18 and 19.
Validation success results of the dynamic models impulse response.

Mean relative error results of the dynamic models impulse response.

The different ‘Black Box’ models presented inaccurate results when they were identified with several outputs and order higher than 2. As shown in Figs 18 and 19, the mean relative error was very high, and the validation success was low. It was observed that some flight tests gave accurate results, and other tests were highly divergent, which led to a high error and increased the mean relative error. The best ‘Black Box’ results were obtained with the simplest model: one output and third-order for each output, and its results were close to those obtained with the ‘Grey Box’ models. The delayed order 1 ‘Grey Box’ model was not used, since the response to identify was very fast. The best results were obtained with the order 1 ‘Grey Box’ model, as it presented the smallest mean relative error and the highest validation success for every output studied.
5.2.3 Ramp
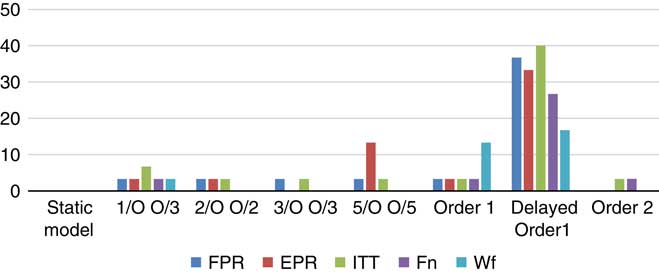
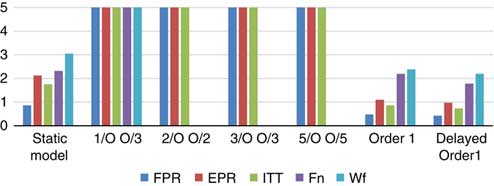
The validation of the different models using ramp responses is presented as shown in Figs 20 and 21.
Validation success results of the dynamic models ramp response.

Mean relative error results of the dynamic models ramp response.

The ramp response models’ results were not as accurate as the step and impulse response models’ results presented in Sub-sections 5.2.1 and 5.2.2, that is mainly due to the fact that most of the model ramp responses inputs (Fig. 14(a)) are more difficult to identify than those of the step and impulse response inputs. The ‘Black Box’ results are very inaccurate, mainly those obtained for the thrust and the fuel flow predictions. It was also observed that these inaccurate results were obtained during the ‘Black Box’ identification process. At the same time, the ‘Grey Box’ models do not provide very accurate results in comparison with the results obtained with the step and impulse response inputs. The best results were obtained with the delayed first-order model, except for the fuel flow prediction where the second-order model presented more accurate results.
6.0 CONCLUSION
A Cessna Citation X simulator engine was identified with flight tests, and the identified model was validated, using simulated flight tests. The identified model was based on different mathematical models utilised to estimate the FPR, the EPR, the ITT, the thrust and the fuel flow outputs of the system. Different models were used, such as the ‘Cold Thrust’ model, that gave the most accurate results with an average error of around 1% for the thrust prediction and a 100% validation success at high altitudes, while the other models gave accurate results with more than 95% validation success, except for the ‘Black Box’ model (Table 10). The other thrust models (Mattingly, Torenbeek, Wanner Aerospace) only predicted the gross thrust instead of the net thrust, which corresponds to the gross thrust minus the drag. A drag model was added in order to provide more accurate results. For the fuel flow, the improved Yoder model presented the most accurate results with a 1.38% average error and a 99.68% validation success.
The accuracy difference between the ‘Black Box’ and the ‘Grey Box’ models proved that the use of theoretical models made it possible to improve the thrust and fuel flow prediction as ‘Grey Box’ model gave better results than the ‘Black Box’ model. The stage-stacking theoretical model did not provide accurate results compared to the ‘Black Box’ results in terms of the FPR and EPR predictions, thus it did not seem appropriate for this engine modelling. The thrust and the fuel flow models both depended on the FPR, which meant that an improvement in the FPR prediction also provided an improvement in the thrust and the fuel flow predictions. This dependency also explained the difference between the thrust and fuel flow results; since the fuel flow depended on the thrust results, an improvement in the thrust prediction also led to an improvement in the fuel flow prediction.
The dynamic modelling presented good results for the model responses to step and impulse perturbations for every output studied. However, the ramp model has to be revised with another approach, as its response gave not very accurate results. Generally, for every perturbation and output studied, the best results were obtained with the lowest order models. Following the results obtained, the model step and impulse response could be identified, and validated with a model with only one or two parameters. A higher number of parameters led to a huge variation of the different parameters involved in the different models, which gave accurate results in the identification process. These model parameters were not adapted for every flight condition and perturbation amplitude, which in turn led to poor validation results. To avoid this issue, it seemed wiser to choose a model with a number of parameters adapted to the system complexity.
It is important to notify that the model identified is based on data acquired on a flight simulator and not directly on the engine. Yet, since the flight simulator is equipped with a level D flight dynamics FAA certified, very accurate data are ensured.
Further work will be carried out on the low-altitude engine modelling, since the static model results were less accurate at low altitudes than for high altitudes. To improve this static model, the approach will consist in finding the available TLA range according to the different altitudes of the flight envelope. A new drag model will also be developed, depending on the angle-of-attack, in order to generalise this cruise model to a climb or descent model. Another estimation algorithm should be used in order to find the best-suited algorithm for system identification (thrust region, Genetic Algorithm GA, etc.). The deceleration dynamics will be modelled with step, impulse and ramp responses.
ACKNOWLEDGEMENTS
This work was performed at the Laboratory of Applied Research in Active Controls, Avionics and AeroServoElasticity Research (LARCASE). The Research Aircraft Flight Simulator (RAFS) was obtained by Dr Ruxandra Botez, Full Professor, thanks to research grants approved by the Canadian Foundation of Innovation (CFI) and the Ministère du Développement Économique, de l’Innovation et de l’Exportation (MDEIE), as well as to the contributions of CAE Inc. In addition, thanks are dues to the Canada Research Chair program as Dr Botez is the Canada Research Chair Holder Tier 1 in New Aircraft Modeling and Simulation Technologies since 2011. We wish to thank the CAE Inc. team led by Mr Ken Dustin, as well as Mr Oscar Carranza Moyao for their support in the development of the Aircraft Research Flight Simulator at the LARCASE laboratory. Thanks are also due to Mrs Odette Lacasse at ETS for her support on this project.