


Nomenclature
Abbreviations
- UAV
-
Unmanned Aerial Vehicle
- GV
-
Guaranteed Voronoi
- POI
-
Points Of Interest
- PID
-
Proportional-Integral-Derivative
Variables
- a
-
major semi-axes of elliptical sensing area
- A
-
proportional factor of control variable
- b
-
minor semi-axes of elliptical sensing area
- C
-
perception area of UAV
- d
-
the distance d of the GV cell
- D
-
uncertain regions
- f
-
coverage quality of UAV
- h
-
tilt angle of visual sensor
- H
-
coverage quality target
- i
-
the ith UAV in the swarm
- K
-
control gain
- N
-
Delaunary neighbors
- q
-
projection of the UAV in the task area
- r
-
uncertainty boundary
- R
-
second-order rotation matrix
- W
-
sub-regions assigned to UAV
- x
-
horizontal position of x-axis
- X
-
position vector
- y
-
horizontal position of y-axis
- z
-
height range
-
 $\theta$
-
span angle of visual sensor
-
$\delta$
-
field of view angle
- u
-
control variable
-
$\Omega$
-
target area
-
$\phi$
-
importance factor of each UAV
-
$\mu$
-
mean value of the task area


1.0 Introduction
Visual area coverage for UAV swarm is one of the important tasks of multi-agent cooperative operation, which refers to the global coverage of target area performed by a certain number of UAV cooperated with each other. It is necessary to divide and allocate the target task area when searching and covering the scenes of detection, rescue, signal base station construction, etc. Swarm cooperative coverage area allocation is a task planning problem essentially. The target task needs to be assigned to different UAVs in the swarm according to the weight value under a variety of constraints. The key parts focus on the establishment of mathematical models, the dynamic solution of inputs such as swarm control law and the design of partition algorithms [Reference He and Wang1, Reference Zhai, Egerstedt and Zhou2].
The research of multiple UAVs coverage problem can be divided into static coverage and dynamic coverage. In static coverage, the target of UAV is to converge to the desired state and optimise some performance standards [Reference Abbasi, Mesbahi and Velni3, Reference Pierson, Figueiredo, Pimenta and Schwager4]. In dynamic coverage, the position of multiple UAVs change with time due to their performance index [Reference Palacios-Gasós, Montijano, Sagüés and Llorente5, Reference Franco, Stipanović, López-Nicolás, Sagüés and Llorente6]. In the study of UAV swarm coverage problem, the most common method is geometric optimisation [Reference Stergiopoulos, Thanou and Tzes7], in addition to strategic game [Reference Ramaswamy and Marden8], optimal trajectory tracking control [Reference Wang, Zhou and Liu9], receding-horizon ergodic control [Reference Mavrommati, Tzorakoleftherakis, Abraham and Murphey10] and reinforcement learning [Reference Xu and Chen11], etc.
In reference [Reference Lin, Zhu and Zeng12] the search task scene of UAV swarm in mountainous environment was studied, in which a coevolution algorithm based on ant colony algorithm by rasterising the task area map was proposed, and the grid access sequence of the task area was established. Similarly, in the study of swarm coverage task, the whole coverage task was divided into two stages, first the search strategy was used to optimise the path length of UAV globally, then the genetic algorithm was used to divide the task area and update the number of UAVs needed in the swarm [Reference Li, Li and Yu13]. Bouzid studied swarm optimal coverage planning in a two-dimensional damaged area and arranged a group of points of interest (POI) within the task area [Reference Bouzid, Bestaoui and Siguerdidjane14]. When all interest points were placed, the swarm is considered to have completed the overwrite task. After the placement of interest points, an improved heuristic method was used to determine the best interest point access sequence of UAV in the swarm. Hoang proposed an angle particle swarm optimisation algorithm that could generate the sequence of access points of UAV swarms to the task area [Reference Hoang, Phung, Dinh and Ha15]. In the above references, the layout of UAVs in the swarm is centralised framework. For the study of the coverage task with the distributed framework, Gupta studied the coverage task in the two-dimensional obstacle environment and proposed the lowest cost path of the swarm return after the execution of the task [Reference Gupta, Dutta, Rastogi and Chaturvedi16]. Park proposed a distributed coverage path planning algorithm based on adaptive sawtooth pattern by establishing connection detection and relay deployment of the self-organising network in the UAV swarm [Reference Park, Shin, Jeong and Lee17].
In the study of UAV swarm coverage task planning, there is still a situation that the task environment is unknown. Yang proposed an improved ant colony algorithm for the unknown task environment. Ant colony pheromone feedback is used to integrate the UAV swarm to avoid planning waypoint overlap and maximise task area coverage [Reference Yang, Ji, Yang, Li and Li18]. Based on the ant colony algorithm, Zhen proposed an improved distributed search attack task using the Dubins curve and ant colony algorithm to plan cooperative Dubins paths for swarm [Reference Zhen, Xing and Gao19]. Luo proposed a coevolutionary pigeon swarm algorithm based on cooperation or competition mechanism, which realised the UAV swarm to complete the search target with maximum probability in an uncertain two-dimensional environment, and ensured the safe return of the swarm to the departure point by using search tracking method [Reference Luo, Shao, Xu, You and Duan20]. In addition, a model predictive control method for the coverage search task planning problem and a hybrid particle swarm optimisation algorithm to solve the search problem are proposed [Reference Hu, Liu and Wang21].
Based on the above literatures, two UAV swarm collaborative coverage control methods will be proposed, and the measurement uncertainty problem also will be considered. At present, the methods to solve the localisation uncertainty generally include probability method [Reference Habibi, Mahboubi and Aghdam22], safety trajectory planning [Reference Davis, Karamouzas and Guy23], Voronoi diagram method [Reference Papatheodorou, Tzes, Giannousakis and Stergiopoulos24, Reference Bousias, Papatheodorou, Tzes and Tzes25] and artificial neural network plus Bayesian probability framework [Reference Liu, Wang, Gu and Li26], etc. Aiming at the uncertain problem in proportional-integral-derivative (PID) control, a non-probability based method to calculate time-dependent reliability is introduced to estimate the safety of controller performance [Reference Wang, Liu, Yang and Wu27]. In this paper, the uncertainty problem is introduced into the original Voronoi diagram, so that an improved Guaranteed Voronoi (GV) method is presented for area coverage, and a new UAV swarm collaborative coverage control method combining GV with planning algorithm is proposed. Furthermore, the simulation verification is conducted to show the feasibility and the performance of the two proposed methods.
2.0 UAV swarm coverage model
2.1 Visual perception model of UAV
Set the target area to be detected as
 $\Omega \in {{\mathbb R}^2}$
, and define the number of UAV as
 $n$
. The position information of the ith UAV in the swarm is set as
 ${X_i} = {\left[ {{x_i},{y_i},{z_i}} \right]^T}$
,
 $i \in {I_n} = \left\{ {1,2,...,n} \right\}$
, and the height
 ${z_i}$
is limited within the predetermined height range, i.e.
 ${z_i} \in \left( {{z_{\min }},{z_{\max }}} \right)$
. The projection of the UAV in the task area is
 ${q_i} = {\left[ {{x_i},{y_i}} \right]^T} \in \Omega $
.
For the airborne visual sensors, suppose that all UAVs have the same finite-distance uniform radial sensing area, thus
 \begin{align}C_i^s({q_i},{r^s}) = \left\{ {q \in \Omega \;:\left\| {q - {q_i}} \right\| \le {r^s}} \right\},i \in {I_n}\end{align}
where
 ${r^s}$
is the common perception radius of visual sensor within the swarm, and
 $|| \cdot ||$
corresponds to the Euclidean metric.
In this paper, the visual sensor is considered as Pan-Tilt-Zoom camera [Reference Bousias, Papatheodorou, Tzes and Tzes25], then the span and tilt angle of the ith visual sensor are defined as
 ${\theta _i}$
,
 ${h_i}$
. The visual sensor has the cone-shaped field of view, and the field of view angle is
 $2{\delta _i}$
. The conical field of the visual sensor and the target area section are approximately conical section, which is defined as the UAV perception area. The centre of the perception area
 ${q_{i,c}}$
is the projection centre of the UAV in mission area, then the perception area of each UAV is defined as
 \begin{align}C_i^s\left( {{X_i},{h_i},{\theta _i},{\delta _i}} \right) = \boldsymbol{{R}}\left( {{\theta _i}} \right)C_i^b + {q_{i,c}},i \in {I_n}\end{align}
where
 $\boldsymbol{{R}}$
is the second-order rotation matrix,
 $C_i^b$
is the original perception area of the UAV
 $i$
. The formulas for calculating
 $C_i^b$
and
 ${q_{i,c}}$
are as follows
 \begin{align}C_i^b = \left\{ {q \in {{\mathbb R}^2}\;:\left\| {\left[ \begin{matrix} 1/a_{i}\;\;\;\;\; & 0 \\[5pt] 0\;\;\;\;\; & 1/b_{i} \end{matrix}\right]q} \right\| \le 1} \right\}\end{align}
 $${b_i} = {z_i}\tan \left( {{\delta _i}} \right)\sqrt {1 + {{\left[ {\left( {\tan \left( {{h_i} + {\delta _i}} \right) - \tan \left( {{h_i} - {\delta _i}} \right)} \right)/2} \right]}^2}} $$
 $${a_i} = {z_i}{\rm{ }}/2{\rm{ }} \cdot \left[ {\tan \left( {{h_i} + {\delta _i}} \right) - \tan \left( {{h_i} - {\delta _i}} \right)} \right]$$
 $${q_{i,c}} = {q_i} + {w_i}{z_i}{\rm{ }}/2\; \cdot \left[ {\tan \left( {{h_i} + {\delta _i}} \right) - \tan \left( {{h_i} - {\delta _i}} \right)} \right]$$
where
 ${a_i}$
and
 ${b_i}$
represent the major and minor semi-axes of the section respectively,
 ${z_i}$
is the height information of the UAV. The horizontal quantity
 ${\theta _i}$
in the sensing area of the UAV affects the orientation of the sensing area, and the vertical quantity
 ${h_i}$
affects the eccentricity of the sensing area.
To realise the UAV swarm collaborative coverage, the UAVs are set moving in the task space
 ${\mathbb R}^{3}$
. The horizontal and vertical quantities of the vision sensor are separated from the position state of the UAV, and the ith UAV dynamics model is set as [Reference Bousias, Papatheodorou, Tzes and Tzes25]
 \begin{align}\left\{ \begin{array}{l} {{{\dot q}_i} = {u_{i,q}},{q_i} \in \Omega } \\[5pt] {{{\dot z}_i} = {u_{i,z}},{z_i} = \left[ {z_{}^{\min },z_{}^{\max }} \right]} \\[5pt] {{{\dot \theta }_i} = {u_{i,\theta }},{\theta _i} \in {\mathbb R}} \\[5pt] {{{\dot h}_i} = {u_{i,h}},{h_i} \in \left( { - h_{}^{\max },h_{}^{\max }} \right)} \\[5pt] {{{\dot \delta }_i} = {u_{i,\delta }},{\delta _i} \in \left[ {\delta _{}^{\min },\delta _{}^{\max }} \right]} \end{array} \right.\end{align}
where
 ${u_{i,q}} \in {{\mathbb R}^2},{u_{i,z}},{u_{i,\theta }},{u_{i,h}},{u_{i,\delta }} \in {\mathbb R}$
.
2.2 Positional uncertainty of UAV swarm
Due to measurement error, disturbance of external wind, flight control accuracy and other reasons, the position of aerial robots is uncertain in practical application. The positional uncertainty of each UAV is defined as a circular area
 $C_i^u$
with the centre of
 ${q_i}$
and the radius of
 ${r^u}$
, thus there is
 \begin{align}C_i^u({q_i},{r^u}) = \left\{ {q \in \Omega \;:\left\| {q - {q_i}} \right\| \le {r^u}} \right\},i \in {I_n}\end{align}
Where the radius
 ${r^u}$
represents the positioning error of UAV. By locating the uncertain area
 $C_i^u$
and the sensing area
 $C_i^s$
, the guaranteed sensing area of UAV is defined as
 \begin{align}C_i^{gs}\left( {C_i^u,C_i^s} \right) = \left\{ {\mathop \cap \limits_{{x_i}} C_i^u\left( {{q_i},{r^s}} \right),\forall {q_i} \in C_i^u} \right\},i \in {I_n}\end{align}
If
 $C_i^u$
,
 $C_i^s$
are defined as circles, the guaranteed perceptual area is expressed as
 \begin{align}C_i^{gs}({q_i},{r^u},{r^s}) = \left\{ {q \in \Omega :\left\| {q - {q_i}} \right\| \le {r^s} - {r^u}} \right\},i \in {I_n}\end{align}
For UAV swarm in the task space
 ${{\mathbb R}^3}$
, the uncertainty boundary of each UAV is defined as
 ${r_i} = {\left[ {r_i^q,r_i^z} \right]^T}$
, where
 $r_i^q$
and
 $r_i^z$
represent the boundary values of the uncertain region in the horizontal and vertical directions, respectively. The position of the UAV
 ${X_i}$
may be anywhere in the uncertainty region
 $C_i^u$
, which is expressed as
 \begin{align}C_i^u({X_i},{r_i}) = \left\{ {{X_i} \in \Omega \times \left[ {z_i^{\min },z_i^{\max }} \right]:\left[ \begin{matrix} {\left\| {q - {q_i}} \right\|} \\[5pt] {\left\| {z - {z_i}} \right\|} \end{matrix} \right] \le \left[ \begin{matrix} {r_i^q} \\[5pt] {r_i^z} \end{matrix} \right]} \right\}\end{align}
Therefore, taking into account the uncertainty of each UAV, the guaranteed perception area
 $C_i^{gs}$
of the UAV
 $i$
represents the area that contains all possible positions of the UAV
 $i$
within its uncertainty area
 $C_i^u$
. Therefore, the guaranteed perception area
 $C_i^{gs}$
of the UAV
 $i$
is expressed as
 \begin{align}C_i^{gs}\left( {{X_i},{h_i},{\theta _i},{\delta _i},{r_i}} \right)\mathop {\rm{ = }}\limits^\Delta \left\{ {\mathop \cap \limits_{{X_i} \in C_i^u} C_i^s} \right\} = \left\{ {\mathop \cap \limits_{z \in \left[ {{z_i} - r_i^z,{z_i} + r_i^z} \right]} C_i^p\left( z \right)} \right\}\end{align}
where
 $C_i^p$
is the perception area of the UAV
 $i$
at different heights in its uncertain area.
 $C_i^p$
is calculated by the following equation
 \begin{align}\left\{ \begin{matrix} {C_i^p\left( z \right) = \boldsymbol{{R}}\left( {{\theta _i}} \right)C_i^{{b_{gs}}} + {q_{i,c}}} \\[5pt] {C_i^{{b_{gs}}} = \left\{ {q \in \Omega :\left\| {\left[ \begin{matrix} 1/({a_i} - r_{i}^{q}) & 0 \\[5pt] 0 & 1/({b_i} - r_{i}^{q}) \end{matrix} \right]q} \right\| \le 1} \right\}} \end{matrix} \right.\end{align}
where
 $C_i^{{b_{gs}}}$
represents the original guaranteed perception area of the UAV
 $i$
.
Based on the above model, when the uncertainty
 ${r^u}$
is greater than the capabilities of the visual sensor
 ${r^s}$
, the
 $C_i^{gs}$
will be empty. On the other hand, when the UAV’s position is accurate, i.e.
 ${r_i}{\rm{ = }}0$
, the guaranteed sensing area is equivalent to its sensing area.
The construction of the distributed network of the UAV swarm is shown in Fig. 1. The figure shows the perception area of UAV
 $i$
and its neighbouring UAV set
 ${N_i}$
. The guaranteed perception area of the UAV for longitudinal quantities
 ${h_i} = 0$
and
 $${h_i} \in \left( {0,\left( {\pi {\rm{ }}/2} \right) - {\delta _i}} \right)$$
is shaded.
The construction of the distributed network of the UAV.

3.0 Design regional division algorithm
3.1 Guaranteed Voronoi division principle
In the traditional Voronoi diagram, when the UAV position is pinpointed, i.e.
 ${r^u} = 0,i \in {I_n}$
, the target areas can be assigned to individual UAV in the swarm via a Voronoi diagram. Each UAV’s area of responsibility (called a Voronoi cell) is defined as the area of space that is closer to itself than any other UAV in the swarm [Reference Papatheodorou, Tzes, Giannousakis and Stergiopoulos24]. The formula is as follows.
 \begin{align}{V_i} = \left\{ {q \in \Omega \;:\left\| {q - {q_i}} \right\| \le \left\| {q - {q_j}} \right\|,\forall j \in {I_n},j \ne i} \right\},i \in {I_n}\end{align}
The Fig. 2 (left) a shows a Voronoi diagram formed when the number of UAVs is 6. The main image properties of the Voronoi diagram are expressed as: (a)
 ${ \cup _{i \in {I_n}}}{V_i} = \Omega $
; (b)
 $Int({V_i}) \cap Int({V_j}) = \emptyset ,\forall i,j \in {I_n},i \ne j$
.
Voronoi diagram (left) and GV diagram (right) of six UAVs.

Define the Delaunary neighbours of UAV
 $i$
as
 ${N_i}$
, which are the UAVs whose Voronoi cells share an edge with the UAV
 $i$
in the partitioned network, then
 \begin{align}{N_i} = \left\{ {j \in {I_n},j \ne i\;:\;{V_i} \cap {V_j} \ne \emptyset } \right\},i \in {I_n}\end{align}
A GV diagram that defines a set of uncertain regions is
 $D = \left\{ {{D_1},{D_2},...,{D_n},{D_i} \subset {R^2}} \right\}$
, each uncertain region contains all possible positions of a UAV
 ${q_i} \in {R^2}$
. Specify a cell
 $V_i^g$
on each uncertainty region so that it contains any point within the target region that close to
 ${q_i}$
. Therefore, the set of points that are at least as close to
 ${D_i}$
as area
 ${D_j}$
is defined as
 \begin{align}H_{ij}^g = \left\{ {q \in \Omega \;:\left\| {q - {q_i}} \right\| \le \left\| {q - {q_j}} \right\|,\forall {q_i} \in {D_i},\forall {x_j} \in {D_j}} \right\}\end{align}
The cell of
 ${D_i}$
represents the intersection of all
 $H_{ij}^g$
, which is defined as
 \begin{align}V_i^g = \mathop \cap \limits_{j \ne i} H_{ij}^g = \left\{ \begin{matrix} q \in \Omega \;:\max \left\| {q - {q_i}} \right\| \le \min \left\| {q - {q_j}} \right\|, \\[5pt] \forall j \in {I_n},j \ne i,{q_i} \in {D_i},{q_j} \in {D_j} \end{matrix} \right\}\end{align}
Similar to the Delaunary neighbours
 ${N_i}$
in the Voronoi diagram, define the Delaunary neighbours
 $N_i^g$
in the GV graph as
 \begin{align}N_i^g = \left\{ {j \in {I_n},j \ne i\;:\;\partial {H_{ij}} \cap \partial V_i^g \ne \emptyset } \right\}\end{align}
The neighbour is also the node that affects
 $\partial V_i^g$
in the partitioned network, so all the properties of the GV diagram are expressed as: a)
 ${ \cup _{i \in {I_n}}}V_i^g \subseteq \Omega $
; b)
 $V_i^g \subseteq {V_i},\forall i \in {I_n}$
.
Since the GV division result of UAVs is not a complete mosaic of space Ω, the neutral zone
 $O \buildrel \Delta \over = \Omega \backslash\! \left( {{ \cup _{i \in {I_n}}}V_i^g} \right)$
corresponds to the point set of space that is not allocated on any node of the network.
3.2 A division method based on GV principle
When the uncertain area
 ${D_i}$
of the UAV swarm is a circular area, i.e.
 $C_i^{gs}({q_i},{r^u},{r^s})$
, the two axes of the hyperbola are denoted as
 $\partial H_{ij}^g,\partial H_{ji}^g$
[Reference Papatheodorou, Tzes, Giannousakis and Stergiopoulos24]. The focus of the hyperbola is at
 ${q_i}$
,
 ${q_j}$
, and the eccentricity is denoted as
 $$e = \left\| {{q_i} - {q_j}} \right\|{\rm{ }}/\left( {r_i^d + r_j^d} \right){\rm{ = }}$$
 $$\left\| {{q_i} - {q_j}} \right\|{\rm{ }}/\left( {2{r^d}} \right)$$
. The GV distribution diagram of six UAVs in the swarm is shown in Fig. 2b. The
 $\partial H_{ij}^g$
and
 $\partial H_{ji}^g$
are two branches of the same hyperbola (even
 $r_i^d \ne r_j^d$
), so that they are symmetrical with respect to the perpendicular bisector of the focus
 ${q_i},{q_j}$
. When
 $\Omega = {R^2}$
,
 $N_i^g \subseteq {N_i}$
, as can be seen from Fig. 2 (right), in the Voronoi diagram, node 1 and node 5 are Delaunay neighbours, but they do not belong to Delaunay neighbours in the finite area calculation in the GV diagram. Considering the area coverage, since the calculation of
 ${N_i}$
has a simple
 $o\left( {n{{\log }_2}n} \right)$
algorithm, but the calculation of
 $N_i^g$
is more complicated, so the Delaunay neighbours can be used to generate a GV diagram.
The relationship between the distance d of the GV cell and its centre
 ${d_{ij}} = d({q_i},{q_j})$
is as follows, as shown in Fig. 3 (top left), when the circular areas
 ${C_i},{C_j}$
overlap,
 $V_i^g$
is empty. When the positional relationship of
 ${C_i},{C_j}$
is circumscribed, the divided area unit is the ray starting from the centre
 ${q_i},{q_j}$
and extending along the direction of
 ${C_i},{C_j}$
, as shown in Fig. 3 (top right). When
 ${C_i},{C_j}$
do not intersect, the GV region is surrounded by the two branches of the hyperbola. As
 ${d_{ij}}$
further increases, the eccentricity of the hyperbola increases, and the distance from the centre of
 ${C_i},{C_j}$
to the vertex of the hyperbola (the point closest to its centre) increases, as shown in Fig. 3 (middle). This results in an increase in the area of
 $V_i^g$
covered by
 $C_i^{gs}$
. As
 ${d_{ij}}$
increases, the distance between the vertices of the hyperbola remains constant at
 $2{r^d}$
. The GV division of two circular regions also depends on the sum of their radius
 $r_i^u + r_j^u$
, as shown in Fig. 3 (bottom). As
 $r_i^u + r_j^u$
decreases, the eccentricity of the hyperbola increases, and the result on the area unit is the same as the distance from the centre of the area increases. As mentioned above, when
 $r_i^u + r_j^u = 0$
, the GV region is divided in the same way as the typical Voronoi region.
Relationship of GV region on
 ${d_{ij}}$
and
 $r_i^u + r_j^u$
.

Under this assumption, the total area measured by multiples UAVs is expressed as
 \begin{align}H = A\left( {\Omega \cap \mathop \cup \limits_{i \in {I_n}} C_i^{gs}} \right) = \sum\limits_{i \in {I_n}} {A\left( {V_i^{gs}} \right)} \end{align}
where
 $A\left( \bullet \right)$
is the area function of the fixed argument.
 $V_i^{gs}$
is defined as
 \begin{align}V_i^{gs} = V_i^g \cap C_i^{gs},i \in {I_n}\end{align}
Eq. (20) represents a part of the GV area that can be perceived by UAV i, so that the coverage quality target is defined as
 \begin{align}H = \sum\limits_{i \in {I_n}} {\int\limits_{V_i^{gs}} {\phi (q)dq} } = \sum\limits_{i \in {I_n}} {\int\limits_{V_i^g \cap C_i^{gs}} {\phi (q)dq} } = \sum\limits_{i \in {I_n}} {{H_i}} \end{align}
Eq. (21) represents the total area of the responsibility area obtained by the division of the UAV using the GV diagram. Where the function
 $\phi \;:\;{R^2} \to {R_ + }$
represents the importance of each point in the sub-area. The importance of the sub-areas divided by the GV diagram in the target task region is related to the prior setting, and it can be extended to practical applications according to the actual task environment.
4.0 Design area coverage planning algorithm
4.1 Regional division process
According to the GV division principle, this paper designs a regional division process, as shown in Fig. 4. Different from the traditional Voronoi diagram, the GV diagram divides the entire target area into several sub-areas assigned to the UAV swarm. Each UAV is assigned an area of responsibility based on the UAV’s guaranteed perception area
 $C_i^{gs}$
and quality of coverage. The sub-regions assigned to UAVs are expressed as
 \begin{align}{W_i}\mathop {\rm{ = }}\limits^\Delta \left\{ {q \in \Omega \;:\;{f_i} \gt {f_j},i \ne j} \right\},i \in {I_n}\end{align}
where
 ${f_i}$
and
 ${f_j}$
represent the coverage quality of UAV
 $i$
and UAV
 $j$
respectively.
The regional division process.

When dividing the sub-areas for UAV
 $i$
in the swarm, check whether the guaranteed sensing areas of all neighbouring UAV
 $j \in {N_i}$
and the UAV
 $i$
overlap, if there is overlap, and the coverage quality of the UAV
 $i$
is less than or equal to UAV
 $j$
, then update the sub-areas assigned to UAV
 $i$
.
The union of sub-area
 ${W_i}$
cannot completely inlay the overall guaranteed perception area
 ${ \cup _{i \in {I_n}}}C_i^{gs}$
of the swarm, because when the task area is divided for UAVs, the area with the same coverage quality in UAV
 $i$
and its neighbouring UAV set will not be assigned. However, these areas still have an impact on the coverage quality target
 $H$
. Therefore, UAV
 $i$
and its neighbours with the same coverage quality
 ${f^l}$
and guaranteed overlapping perception areas form a new set
 $L$
, and the number in the set is
 ${L_n}$
, which can be expressed as
 \begin{align}{L_l} = \left\{ {i,j \in {I_n},i \ne j\;:\;C_i^{gs} \cap C_j^{gs} \ne \emptyset \wedge {f_i} = {f_j} = {f^l}} \right\},l \in {I_L}\end{align}
where
 ${I_L} = \left\{ {1,2,...,{L_n}} \right\}$
. Therefore, the unallocated area
 $W_c^l$
is the partial area in the set
 $L$
where the UAV’s guaranteed sensing area overlaps, which is expressed as
 \begin{align}W_c^l = \left\{ {\exists i,j \in {L_l},i \ne j\;:\;q \in C_i^{gs} \cap C_j^{gs}} \right\},l \in {I_L}\end{align}
The entire target area is divided into assigned area and unassigned area through GV diagram. Once UAV
 $i$
obtains all the state information of neighbouring UAV set
 ${N_i}$
, it can construct its unit through the division process in Fig. 4. As shown in Eq. (2), both
 ${X_i}$
and
 ${\delta _i}$
are necessary for the construction of
 $C_i^s$
. The coverage optimisation target
 $H$
is calculated for UAVs in the swarm, and the coverage optimisation target included UAVs coverage quality function
 ${f_i}$
and importance factors
 $\phi $
assigned to the sub-areas.
According to the UAV swarm coverage model and the characteristics of visual sensors, the coverage quality depends on the distance between the object being photographed and the sensor. The coverage quality can be improved by reducing the UAV’s height
 ${z_i}$
, decreasing the camera’s tilt angle
 ${h_i}$
and field of view angle
 ${\delta _i}$
(i.e. zooming in), otherwise the quality will be reduced. Thus a coverage quality function
 ${f_i}$
can be presented as
 \begin{align}{f_i}\left( {{z_i},{h_i},{\delta _i}} \right){\rm{ = }}{1 \over 3}{\sum\limits_{x \in ({z_i},{h_i},{\delta _i})} {\left[ {{{\left( {{{x - {x^{\min }}} \over {{x^{\max }} - {x^{\min }}}}} \right)}^2} - 1} \right]} ^2}\end{align}
The Eq. (25) is uniform throughout each sensed pattern of UAV swarm, so that the following performance can be obtained
 \begin{align}{f_i}\left( {z_i^{\min },h_i^{\min },\delta _i^{\min }} \right) = 1,\,\,{f_i}\left( {z_i^{\max },h_i^{\max },\delta _i^{\max }} \right) = 0\end{align}
where 0 and 1 correspond to the lowest and highest quality of the visual sensor, respectively. Of course, how to design this function is not unique, and different functions will result in different quality coverage trade-offs.
According to the coverage quality function obtained by Eq. (25), combined with the importance factor
 $\phi $
of each UAV, the coverage quality target can be expressed as follows
 \begin{align}H\mathop {\rm{ = }}\limits^\Delta \int\limits_\Omega {\mathop {\max }\limits_{i \in {I_n}} {f_i}\left( {{z_i},{h_i},{\delta _i}} \right)\phi \left( q \right)} dq\end{align}
where
 $\phi \left( q \right)$
reflects any prior information about the area of interest. For example, when the entire task area
 $q = {\left[ {x,y} \right]^T} \in \Omega $
is set in a search or rescue mission, if the coverage space is equally important, the importance factor can be expressed as
 $\phi \left( q \right){\rm{ = }}1$
, which is a uniform distribution function. However, if a certain key local area is known in advance, the density of the local area can be set higher, and a two-dimensional Gaussian distribution function can be used
 \begin{align}\phi \left( q \right) = {1 \over {2\pi {{\left| \sum \right|}^{1/2}}}}\exp \left[ - {1 \over 2}{\left( {q - \mu } \right)^{\mathop{\rm T}\nolimits} }{\Sigma ^{ - 1}}\left( {q - \mu } \right)\right]\end{align}
where
 $\mu $
is the mean value of the variable
 $q$
,
 $\Sigma $
is the covariance matrix of the variable.
Eq. (26) comprehensively considers the swarm coverage area and the coverage quality of the area, and also includes the weight factor of each UAV, so that the multiple UAV coverage quality target
 $H$
reaches the maximum; that is, the coverage scope is maximised. Combining Eq. (22) and Eq. (24), Eq. (27) is updated as follows
 \begin{align}H\mathop {\rm{ = }}\limits^\Delta \sum\limits_{i \in {I_n}} {\int\limits_{{W_i}} {{f_i}\phi \left( q \right)dq} } + \sum\limits_{l = 1}^{{L_n}} {\int\limits_{W_c^l} {{f^l}\phi \left( q \right)dq} } \end{align}
4.2 Space allocation control law
Based on the aerial UAV perception performance Eq. (2), the dynamics model Eq. (7), and the coverage quality target Eq. (29), a space allocation control method based on gradient can be designed. The control law increases coverage monotonously by partition. The UAVs are controlled by dynamics and coverage quality targets. Based on the analysis of reference [Reference Bousias, Papatheodorou, Tzes and Tzes25], this paper set the swarm control law as
 \begin{align}\left\{ \begin{array}{l} {{u_{i,q}} = {A_{i,q}}\left[ {\displaystyle\int\limits_{\partial {W_i} \cap \partial O} {u_i^i{k_i}{f_i}\phi \left( q \right)dq} + \sum\limits_{\scriptstyle j \in {I_n} \atop \scriptstyle j \ne i } {\displaystyle\int\limits_{\partial {W_i} \cap \partial {W_j}} {u_i^i{k_i}\Delta {f_{ij}}\phi \left( q \right)dq} } } \right]} \\[5pt] {{u_{i,z}} = {A_{i,z}}\left[ {\displaystyle\int\limits_{\partial {W_i} \cap \partial O} {v_i^i{k_i}{f_i}\phi \left( q \right)dq} + \displaystyle\int\limits_{{W_i}} {{{\partial {f_i}} \over {\partial {z_i}}}\phi \left( q \right)dq} + \sum\limits_{\scriptstyle j \in {I_n} \atop \scriptstyle j \ne i } {\displaystyle\int\limits_{\partial {W_i} \cap \partial {W_j}} {v_i^i{k_i}\Delta {f_{ij}}\phi \left( q \right)dq} } } \right]} \\[5pt] {{u_{i,\theta }} = {A_{i,\theta }}\left[ {\displaystyle\int\limits_{\partial {W_i} \cap \partial O} {\tau _i^i{k_i}{f_i}\phi \left( q \right)dq} + \sum\limits_{\scriptstyle j \in {I_n} \atop \scriptstyle j \ne i } {\displaystyle\int\limits_{\partial {W_i} \cap \partial {W_j}} {\tau _i^i{k_i}\Delta {f_{ij}}\phi \left( q \right)dq} } } \right]} \\[5pt] \begin{matrix} {u_{i,h}} = {A_{i,h}}\left[ {\displaystyle\int\limits_{\partial {W_i} \cap \partial O} {\sigma _i^i{k_i}{f_i}\phi \left( q \right)dq} + \displaystyle\int\limits_{{W_i}} {{{\partial {f_i}} \over {\partial {h_i}}}\phi \left( q \right)dq} + \sum\limits_{\scriptstyle j \in {I_n} \atop \scriptstyle j \ne i } {\displaystyle\int\limits_{\partial {W_i} \cap \partial {W_j}} {\sigma _i^i{k_i}\Delta {f_{ij}}\phi \left( q \right)dq} } } \right] \\[5pt] {u_{i,\delta }} = {A_{i,\delta }}\left[ {\displaystyle\int\limits_{\partial {W_i} \cap \partial O} {\mu _i^i{k_i}{f_i}\phi \left( q \right)dq} + \displaystyle\int\limits_{{W_i}} {{{\partial {f_i}} \over {\partial {\delta _i}}}\phi \left( q \right)dq} + \sum\limits_{\scriptstyle j \in {I_n} \atop \scriptstyle j \ne i } {\displaystyle\int\limits_{\partial {W_i} \cap \partial {W_j}} {\mu _i^i{k_i}\Delta {f_{ij}}\phi \left( q \right)dq} } } \right] \end{matrix} \end{array} \right.\end{align}
where
 ${A_{i,q}},{A_{i,z}},{A_{i,\theta }},{A_{i,h}},{A_{i,\delta }}$
are the proportional factor,
 $O$
represents the remaining area in the target area not covered by the swarm guaranteed sensing area,
 ${k_i}$
is the outward normal vector on the sub-area
 ${W_i}$
,
 $\Delta {f_{ij}} = {f_i} - {f_j}$
represents the difference of coverage quality function between UAV
 $i$
and its neighbour UAV
 $j$
. The Jacobian matrix
 $u_i^i,v_i^i,\tau _i^i,\sigma _i^i,\mu _i^i$
respectively represents the projection position, height, sensor translation, sensor tilt and sensor cone angle variable, which can be expressed as follows
 \begin{align}u_j^i \buildrel \Delta \over = {{\partial q} \over {\partial {q_i}}},v_j^i \buildrel \Delta \over = {{\partial q} \over {\partial {z_i}}},\tau _j^i \buildrel \Delta \over = {{\partial q} \over {\partial {\theta _i}}},\sigma _j^i \buildrel \Delta \over = {{\partial q} \over {\partial {h_i}}},\mu _j^i \buildrel \Delta \over = {{\partial q} \over {\partial {\delta _i}}},q \in \partial {W_i},i,j \in {I_n}\end{align}
The effectiveness and feasibility of the control law can be proved by derivation. Firstly, evaluate the time derivative of optimal coverage quality target
 $H$
 \begin{align}{{dH} \over {dt}} = \sum\limits_{i \in {I_n}} {\left[ {{{\partial H} \over {\partial {q_i}}}{{\dot q}_i} + {{\partial H} \over {\partial {z_i}}}{{\dot z}_i} + {{\partial H} \over {\partial {\theta _i}}}{{\dot \theta }_i} + {{\partial H} \over {\partial {h_i}}}{{\dot h}_i} + {{\partial H} \over {\partial {\delta _i}}}{{\dot \delta }_i}} \right]} \end{align}
by selecting the following control inputs
 \begin{align}{u_{i,q}} = {A_{i,q}}{{\partial H} \over {\partial {q_i}}},{u_{i,z}} = {A_{i,z}}{{\partial H} \over {\partial {z_i}}},{u_{i,\theta }} = {A_{i,\theta }}{{\partial H} \over {\partial {\theta _i}}},{u_{i,h}} = {A_{i,h}}{{\partial H} \over {\partial {h_i}}},{u_{i,\delta }} = {A_{i,\delta }}{{\partial H} \over {\partial {\delta _i}}}\end{align}
In this paper,
 ${A_{i,q}},{A_{i,z}},{A_{i,\theta }},{A_{i,h}},{A_{i,\delta }} \ge 0$
and
 $$\partial H{\rm{ }}/dt$$
in UAV swarm are set to be non-negative, so the coverage quality target is monotonically increasing. The partial derivative of covering quality target is expressed as follows.
 \begin{align}{{\partial H} \over {\partial {q_i}}} = {\partial \over {\partial {q_i}}}\left\{ {\sum\limits_{i \in {I_n}} {\int\limits_{{W_i}} {{f_i}\phi \left( q \right)dq} } + \sum\limits_{l = 1}^L {\int\limits_{W_c^l} {{f^l}\phi \left( q \right)dq} } } \right\}\end{align}
By applying the Leibniz integration rule, when
 $$\partial {f_i}\left( {{z_i},{h_i},{\delta _i}} \right){\rm{ }}/\partial {q_i} = \partial {f_j}\left( {{z_j},{h_j},{\delta _j}} \right){\rm{ }}/\partial {q_i} = 0$$
, then Eq. (34) becomes
 \begin{align}{{\partial H} \over {\partial {q_i}}} = \int\limits_{\partial {W_i}} {u_i^i{k_i}{f_i}\phi \left( q \right)dq} + \sum\limits_{\scriptstyle j \in {I_n} \atop \scriptstyle j \ne i } {\int\limits_{\partial {W_i} \cap \partial {W_j}} {u_i^i{k_i}{f_i}\phi \left( q \right)dq} } \end{align}
Referring to the method of [Reference Papatheodorou and Tzes28], this paper uses the boundary of
 $\partial {W_i}$
to decompose into disjoint sets
 \begin{align}\partial {W_i} = \left\{ {\partial {W_i} \cap \partial \Omega } \right\} \cup \left\{ {\partial {W_i} \cap \partial O} \right\} \cap \left\{ {\mathop \cup \limits_{i \ne j} \partial {W_i} \cap \partial {W_j}} \right\} \cap \left\{ {\mathop \cup \limits_{l = 1}^L \partial {W_i} \cap \partial W_c^l} \right\}\end{align}
Assume that the static task area to be detected is
 $\Omega $
. Since
 $\partial {W_i} \cup \partial W_c^l$
is a subset of
 $\partial C_j^{gs}$
boundary of a certain perception area, it has nothing to do with the state of UAV
 $i$
. The projection position of UAV is
 $q \in \left\{ {\partial \Omega \cap \partial {W_i}} \right\} \cup \left\{ {\partial {W_i} \cup \partial W_c^l} \right\}$
, and the Jacobian matrix is
 $u_i^i = {{\bf{0}}_{2 \times 2}}$
. In addition, since boundary
 $\partial {W_i} \cup \partial {W_j}$
is shared between UAV
 $i$
and
 $j$
.
 $u_j^i = u_i^j$
,
 ${k_i} = - {k_j}$
can be obtained during its evaluation. Eq. (35) can be expressed as follows
 \begin{align}{{\partial H} \over {\partial {q_i}}} = \int\limits_{\partial {W_i} \cap \partial O} {u_i^i{n_i}{f_i}\phi \left( q \right)dq} + \sum\limits_{\scriptstyle j \in {I_n} \atop \scriptstyle j \ne i } {\int\limits_{\partial {W_i} \cap \partial {W_j}} {u_i^i{n_i}\left( {{f_i} - {f_j}} \right)\phi \left( q \right)dq} } \end{align}
Similarly, if
 $$\partial {f_i}{\rm{ }}/\partial {z_i} = \partial {f_j}{\rm{ }}/\partial {\theta _i}{\rm{ }} = \partial {f_i}{\rm{ }}/\partial {h_i}{\rm{ }} = \partial {f_i}{\rm{ }}/\partial {\delta _i} = 0$$
is given, the remaining control laws
 ${u_{i,z}}$
,
 ${u_{i,\theta }}$
,
 ${u_{i,h}}$
,
 ${u_{i,\delta }}$
can be obtained.
5.0 Simulation results and analysis
5.1 Area coverage using GV regional division
In this section, the simulation of regional division method based on GV principle is carried out. Three types of target task area are divided into regions, and then the effectiveness of the algorithm is analysed.
In cases 1∼3, the initial information of the UAVs are set in Table 1. It should be noted that the “units” in Table 1 indicate different scale ranges, such as 1m, 10m, 1km, etc. For example, in the following cases, if the unit is meter or kilometer, then 6m2 is reasonable for real case of indoor or small-scale coverage applications, and 6km2 is suitable for real outdoor applications.
The initial information of aerials UAVs

In order to verify the effectiveness of the regional division method proposed in this paper, when setting the initial state information of the UAVs, the radius of the detection range of UAV’s viewing area was set as small enough, and only the responsibility sub-area assigned by the regional division algorithm is considered. The UAV is located in the centre of the region divided. The performance of the algorithm can be reflected by covering the ratio curve of the quality target to the set target. The following will simulate three mission scenarios.
-
(1) Case 1. The task scene is set as a square with the area of 6 units2. The UAVs are concentrated in a corner of the task area according to the initial position in Table 1, and then start to move until the coverage quality target reaches the set target value. According to the final operation result (Fig. 5), the UAVs start to move from the initial position to the centre of the responsible sub-area assigned by the regional division algorithm, and finally completes the division of the entire task area. As shown in Fig. 5 (right), without considering the field of view coverage, when the task area is square, the target of swarm coverage quality can be achieved using the algorithm.
-
(2) Case 2. The task scene is set as a rectangle to verify the partitioning performance of the algorithm for narrow areas. The length and width are set to be 8.5 units and 2.8 units respectively. Similar to case 1, the UAVs are concentrated in a corner of the task area at first, and then began to move until the coverage quality target reached the set value. According to the final results (Fig. 6), the UAVs start from the initial point and moves to the centre of the responsible sub-area assigned by the regional division algorithm, and finally completes the division of the entire mission area. As shown in Fig. 6 (right), when the task area is a rectangle the region partition algorithm can complete the division of the narrow area, and finally achieve the target of regional coverage quality.
-
(3) Case 3. The task scene is set as concave area to verify the partitioning performance for irregular areas. The area is set to cut a 2.5 units long and 2 units wide rectangle from a square with a side length of 5 units. Similarly, the initial positions of UAVs are on a corner of the task area, and move to achieve the set value of the coverage quality target. According to the final operation result (Fig. 7), the UAVs start from the initial point and move to the centre of the responsibility sub-area to complete the division of the entire task area. As shown in Fig. 7 (right), when the task area is concave, the region partition algorithm cannot deal with the incomplete part well, and its coverage quality objective function cannot reach the set value. Therefore, for swarm coverage task in irregular area, the visual sensor detection area of UAV needs to be considered comprehensively.
-
(4) Case 4. The square task scene is used to further analyse the impact of positional uncertainty on the performance of area coverage, and compare the proposed GV method with the original Voronoi method. In order to better demonstrate the effect of GV regional division, three UAVs are used to carry out the area coverage tasks.
The square partition (left) and cover quality ratio (right) results of GV regional division in case 1.

The rectangular partition (left) and cover quality ratio (right) results of GV regional division in case 2.

The concave partition (left) and cover quality ratio (right) results of GV regional division in case 3.

When the UAV’s initial position is near to the centre of the region, for example {
 ${q_1},{q_2},{q_3}$
} = {[3.3 3.3], [3.4 3.8], [3.7 3.4]}, the division result at the first second is shown in Fig. 8 (top left). When the positional uncertainty variable
 ${r^u}$
= 0.1 and
 ${r^u}$
= 0.2, the final area coverage results are shown in Fig. 8 (top right) and Fig. 8 (bottom left) respectively, and the cover quality ratio can reach 100% in both cases. It should be noted that with the increase of
 ${r^u}$
, the time to complete the coverage increases correspondingly. When
 ${r^u}$
is greater than the perception radius
 ${r^s}$
of visual sensor, the GV division will not work well. If
 ${r^u}$
= 0, the GV method will be converted to the original Voronoi method, which can also work well at this time, as shown in Fig. 8 (bottom right).
Comparison of GV and Voronoi for scenario 1: state at t = 1s (top left),
 ${r^u}$
= 0.1 of GV (top right),
 ${r^u}$
= 0.2 of GV (bottom left) and
 ${r^u}$
= 0 of Voronoi (bottom right).

When the UAV’s initial position is far from the certre of the region, for example {
 ${q_1},{q_2},{q_3}$
}= {[5.0 4.0], [5.1 4.0], [5.2 4.0]}, the division results of GV method are shown in Fig. 9 (top, and bottom left), at this time the GV method can achieve good results, and the cover quality ratio can reach 100%. However, when
 ${r^u}$
= 0, i.e. original Voronoi method can not perform well, as shown in Fig. 9 (bottom right), at this time the cover quality ratio is 86.1%. This results is consistent with the previous theoretical analysis.
Comparison of GV and Voronoi for scenario 2: state at t = 1s (top left),
 ${r^u}$
= 0.1 of GV (top right),
 ${r^u}$
= 0.2 of GV (bottom left) and
 ${r^u}$
= 0 of Voronoi (bottom right).

5.2 Area coverage planning simulation
This section adds the dynamics equation of UAV swarm and visual detection area to simulate the area coverage planning algorithm. In order to intuitively see the simulation results of the coverage result, the target task area is set as the same three scenes as in the previous section. Assuming that the density function of the task area is
 $\phi \left( q \right) = 1$
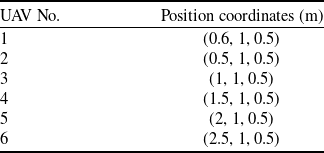
, which means that all position points in the area have the equal importance, and all UAVs have positioning uncertainties. The initial location settings of UAVs are shown in Table 2.
The initial location settings of UAV

The airborne visual sensor in the swarm has a longitudinal volume limit of
 $h_i^{\max } = {\rm{3}}{0^ \circ }$
, a visual cone angle limit of
 $\delta _i^{\min } = {15^ \circ }{\rm{,}}\delta _i^{\max } = {35^ \circ },\forall i \in {I_n}$
, and an altitude range of
 ${z_{\min }} = 0.3{\rm{m}},{z_{\max }} = 2.3{\rm{m}}$
. The UAV’s perception area is filled with grey to ensure that the boundary of the perception area is represented by a dotted line. The area coverage algorithm is simulated in three different target task areas, and the total simulation time is set as 150s with step size of 0.2s.
-
(1) Case 1. The task scene is set as a square with sides of 6m. In the area coverage algorithm, the control gain is set as
${K_x} = 0.25$
,
${K_y} = 0.25$
,
${K_z} = 0.25$
in the horizontal and vertical direction of UAV. Visual sensor horizontal quantity is
${K_{th}} = 0.0005$
, longitudinal quantity is
${K_h} = 0.0005$
, visual cone angle is
${K_{zoom}} = 0.0005$
. Figure 8a shows the initial state of the swarm. Firstly, the coverage quality and perception area are initialised. Then the task area is divided based on partition algorithm, and the size of perception area is calculated. Finally, the coverage quality target is maximised by updating the swarm control law. The simulation results are shown in Fig. 10 (top), which represent the two-dimensional and three-dimensional views for distribution of UAV swarm. The corresponding coverage change and coverage quality target change diagram are given in Fig. 10 (bottom), as can be seen that the swarm coverage quality goal increases monotonously over time until it reaches the maximum value, and the coverage for square area can reach 91.96% according to the above constraints.


The results of planning simulation in case 1: the 2D and 3D diagram of initial state (top left), the 2D and 3D diagram of results (top right), coverage quality ratio (bottom left) and coverage quality target (bottom right).

In addition, the stability and effectiveness of the proposed coverage algorithm can be analysed by using the location variation and error variation diagram of the UAVs. As can be seen from Fig. 11 (left), when the task scene is square, the position changes smoothly during the execution of the whole area coverage task, and the height information does not exceed the height limit range. According to Fig. 11 (right), the errors in the three-dimensions are all less than 0.2m, and gradually converge to 0. Based on the above analysis, it can be concluded that when the task scene is square, the swarm area coverage task planning algorithm can assign responsibility sub-areas to UAV and make it reach the planning site smoothly. The location accuracy is guaranteed while the coverage of the task area and the coverage quality target are monotonously increased. Therefore, the effectiveness and stability of swarm coverage algorithm in this scenario are verified.
The position information (left) and position error (right) of UAVs in case 1.

-
(2) Case 2. The area information is the same as that in case 2 in Section 5.1. The algorithm parameters are the same as in case 1. The location distribution before the simulation starts is shown in Fig. 12 (top left), and the location distribution is shown in Fig. 12 (top right) after the simulation. According to the location distribution of UAVs, in order to ensure that the coverage quality targets can be monotonously increased in the narrow area, the projection points of some UAVs are outside the task area. The Fig. 12 (bottom) show changes in coverage of the task area and changes in coverage quality targets of the whole region coverage task. For the narrow area, the coverage of the swarm to the target area can reach 94.96%, and the coverage quality target increases monotonously with simulation time, and finally reaches the maximum value of the target.
The results of planning simulation in case 1: the 2D and 3D diagram of initial state (top left), the 2D and 3D diagram of results (top right), coverage quality ratio (bottom left) and coverage quality target (bottom right).

It also can be seen from Fig. 13 (left) that when the UAV swarm perform regional coverage task on the narrow area, the variation range of location is not smooth as in case 1, but the fluctuation range of data remains in a very small range. At the same time, the UAV height is always in the limited height range. As can be seen from Fig. 13 (right), the error in the three-dimensions of UAVs when they go to the sub-area of responsibility cannot converge to 0, but the variation range remains within 0.2m. Thus it can be concluded that the regional coverage planning algorithm can assign responsibility sub-area and make it reach the planning site more smoothly. The accuracy of the location information is guaranteed while the coverage rate of the task area and the coverage quality target increase monotonously, so that it can fluctuate within a very small range.
The position information (left) and position error (right) of UAVs in case 2.

-
(3) Case 3. Set the task scene as a concave area with the same as in case 3 in Section 5.1. The algorithm parameters are the same as case 1. The location distribution before the simulation starts is shown in Fig. 14a, and the location distribution after the simulation ends is shown in Fig. 14b. The changes in coverage of the swarm to the task area and changes in coverage quality target of the whole region coverage task are shown in Fig. 14c and Fig. 14d. For concave area, the coverage task planning algorithm can make the swarm coverage to the target area reach 90.31%, and the coverage quality target increases monotonously with the simulation time, and finally reaches the target maximum value.
The results of planning simulation in case 3: the 2D and 3D diagram of initial state (top left), the 2D and 3D diagram of results (top right), coverage quality ratio (bottom left) and coverage quality target (bottom right).

It also can be seen from Fig. 15a that when UAVs perform area coverage task in concave area, they can realise smooth change of location information during task execution and ensure that height information does not exceed the height limit range. As can be seen from Fig. 15b, in the concave task environment, the errors in the three-dimensions are all less than 0.1m and gradually converge to 0. Based on the above analysis, it can be concluded that when the task scene area is concave, the area coverage algorithm can assign responsibility sub-areas for UAV to gently reach the planning site. The accuracy of the location information is guaranteed while the coverage of the task area and the coverage quality target are monotonously increased.
The position information (left) and position error (right) of UAVs in case 3.

-
(4) Case 4. The influence of regional density function
$\phi \left( q \right)$
for the proposed method is analysed. In order to better demonstrate the effect, the first three UAVs in Table 2 are selected to cover the square task scene. When set
$\phi \left( q \right){\rm{ = }}1$
, i.e. uniform distribution, the area coverage task is completed when all three UAVs reached the maximum condition limit
${z_{\max }} = 2.3{\rm{m}}$
, as shown in Fig. 16 (top left). At this time, with the increase of the restricted height, the area covered will increase, as shown in the Fig. 16 (top right). When
$\phi \left( q \right)$
is set as a Gaussian distribution (Eq. 28), the results of
$\mu = [2.6,2]$
and
$\mu = [2,4.2]$
are shown in Fig. 16 (bottom left) and Fig. 16 (bottom right). In this case, the proposed method not only maximise the swarm coverage quality, but also taking into account the importance of some local region as expressed by Gaussian function.


The results of uniform Vs. Gaussian distribution for
 $\phi \left( q \right)$
:
 ${z_{\max }} = 2.3{\rm{m}}$
(top left),
 ${z_{\max }} = 5{\rm{m}}$
(top right),
 $\mu = [2.6,2]$
(bottom left) and
 $\mu = [2,4.2]$
(bottom right).

6.0 Conclusion
In this paper, an effective optimal visual area coverage planning method is proposed, and the problems of area division, motion and positioning inaccuracy of UAV are fully considered. Firstly, the algorithm model of swarm area coverage is established, and the regional division method based on GV principle is proposed. Next, the swarm area coverage process is studied. Under the premise of comprehensively considering the coverage quality and effect, the control law is improved to guide the UAVs into the local area, and the optimal configuration can maximise the coverage quality target. Finally, simulation experiments are carried out in different types of mission scenarios. The results show that the proposed GV method is better than the original Voronoi method under positional uncertainty. Furthermore, the proposed GV division plus planning algorithm is more efficient than the separate GV division, especially to solve the coverage problem of irregular regions, which can achieve the optimal regional distribution and maintain more than 90% coverage in three kinds of scenarios. The method in this paper can realise the rapid search of the target area on the premise of ensuring the coverage quality, and provide effective support for the application of target recognition, detection and rescue.
Acknowledgements
This work was supported in part by the equipment advance research project (50912020401) and the aviation science foundation of China (201908052002). The authors also gratefully acknowledge the helpful comments and suggestions of the reviewers, which have improved the presentation.
Conflicts of interest
The authors declare that they have no known competing financial interests or personal relationships that could have appeared to influence the work reported in this paper.