





Nomenclature
- CONUS
-
contiguous United States
- CWN
-
Call-When-Needed contract
- EU
-
Exclusive-Use contract
- LAT
-
large air tanker
- MATOC
-
Multiple Award Task Order Contracts
- USFS
-
United States Forest Service
- UTC
-
coordinated universal time
- VLAT
-
Very Large Air Tanker
- VMC
-
visual meteorological conditions
1.0 Introduction
Wildfire is a fundamental ecological process that contributes to nutrient cycling, habitat heterogeneity and the maintenance of biodiversity in fire-adapted ecosystems. In the United States, wildfire activity has increased markedly over recent decades, driven in part by prolonged and more severe drought conditions [Reference Wasserman and Mueller1–Reference Farid, Alam, Goli, Akin, Akinleye, Chen and Winkler3]. Rising temperatures and altered precipitation regimes have increased fuel aridity and lengthened fire seasons by several months relative to historical norms [Reference Abatzoglou and Williams4]. Concurrently, the frequency and extent of large wildfires – including so-called “megafires” exceeding 100,000 acres – have increased substantially since the early 2000s, particularly in the western United States [Reference Varga, Jones, Trugman, Carvalho, McLoughlin, Seto, Thompson and Daum5].
In addition to increased frequency and magnitude, the risks associated with wildfires have also increased due to the continued expansion of human development into fire-prone wildland–urban interface (WUI) areas [Reference Radeloff, Helmers and Kramer6].
In response to these evolving fire regimes, wildfire management strategies have increasingly leveraged technological innovation and data-driven policy frameworks. Satellite-based remote sensing systems, including Moderate Resolution Imaging Spectroradiometer (MODIS) instruments, are now central to detecting active fires, monitoring fire behaviour and assessing burned area at regional to continental scales [Reference Justice, Giglio and Korontzi7]. More recently, advances in machine learning and predictive modelling have enabled the integration of meteorological, fuel and topographic data to support probabilistic fire occurrence and spread forecasts, improving situational awareness for decision makers [Reference Jain, Coogan, Subramanian, Crowley, Taylor and Flannigan8].
Aerial firefighting capabilities have also been expanded to better support ground-based suppression and containment efforts. Modern helicopters are equipped with precision water-delivery systems and infra-red imaging sensors, providing real-time intelligence that enhances coordination with ground crews and incident command [9]. In addition, the operational envelope of aerial suppression has expanded through the introduction of night-flying aircraft and unmanned aerial systems, which allow reconnaissance and limited suppression during periods of reduced visibility when conventional daytime operations are constrained [Reference Calkin, Thompson and Finney10].
Very large air tankers (VLATs), large air tankers (LATs), and scoopers now play an increasingly prominent role in initial attack, in direct line construction and large-fire suppression. Their high transit speeds and long operational ranges enable rapid response to remote or rugged terrain, where ground access is limited. VLATs, such as converted DC-10 aircraft, can deliver up to approximately 9,400 gallons of retardant in a single drop, producing extended containment lines under suitable conditions, while LATs – including MD-87, Boeing 737, BAe-146 and C-130 platforms – typically carry 3,000–4,000 gallons per sortie [11]. Scooper aircraft can rapidly cycle between a nearby water source and the fire line, enabling high-frequency water delivery with minimal turnaround time (when a water source is available) compared to land-based tankers [Reference Plucinski, McCarthy, Hollis and Gould12].
These aerial suppression operations are enabled by a distributed network of specialised airports – air tanker bases that provide the infrastructure required for retardant mixing, loading, maintenance and rapid aircraft turnaround [13]. The performance and capacity of these bases are therefore a critical component of national wildfire response capability.
This paper presents descriptive statistics on VLAT, LAT and Scooper aerial fire-fighting operations and the associated demands placed on U.S. airports during the 2025 fire season. Because such operational data are not routinely consolidated or publicly disseminated, the results may be of use to air tanker operators, airport planners, air navigation service providers, aircraft manufacturers and policymakers.
The paper is organised as follows: Section 2 describes data used for the analysis, and the analytical process and methods. Section 3 provides the results of analysis for the 2025 data: fleet characteristics, flight operations and airport operations. Section 4 provides a discussion of the results of the analysis described in Section 3.
2.0 Data and process for analysis
This section describes the data sources and the process for analysing the fleet, flight operations and airport operations.
2.1 Data sources
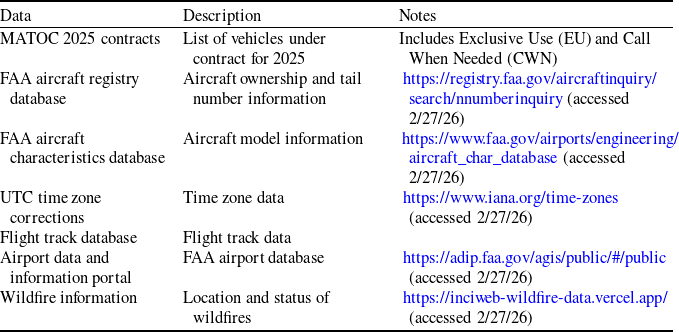
The data sources used for this analysis are listed in Table 1.
Data sources

Table 1. Long description
A table with seven rows and three columns. The columns are labeled Data, Description, and Notes. Row 1: Data: MATOC 2025 contracts; Description: List of vehicles under contract for 2025; Notes: Includes Exclusive Use (EU) and Call When Needed (CWN). Row 2: Data: FAA aircraft registry database; Description: Aircraft ownership and tail number information; Notes: https://registry.faa.gov/aircraftinquiry/search/nnumberinquiry (accessed 2/27/26). Row 3: Data: FAA aircraft characteristics database; Description: Aircraft model information; Notes: https://www.faa.gov/airports/engineering/aircraft_char_database (accessed 2/27/26). Row 4: Data: UTC time zone corrections; Description: Time zone data; Notes: https://www.iana.org/time-zones (accessed 2/27/26). Row 5: Data: Flight track database; Description: Flight track data. Row 6: Data: Airport data and information portal; Description: FAA airport database; Notes: https://adip.faa.gov/agis/public/#/public (accessed 2/27/26). Row 7: Data: Wildfire information; Description: Location and status of wildfires; Notes: https://inciweb-wildfire-data.vercel.app/ (accessed 2/27/26).
2.2 Process for analysis
The process for analysing the data, summarised in Figure 1, includes the following seven steps:
Process for analysing data and generating the results.

Figure 1. Long description
Panel A: The process begins with collating tail numbers and air tanker bases. This data is then merged with FAA aircraft registry and characteristics data to create vehicle data. Panel B: UTC time conversion is applied to ADS-B flight track data, which is then merged with tail number data to form flight operations data. Panel C: Airport location, infrastructure, and equipment data are merged to form airports data. Panel D: Statistical analyses are performed on aircraft characteristics, flight operations, and airport operations data to generate respective statistical information.
-
Step (1) Collate tail numbers and bases from MATOC 2025 contract: This process generates a tail number list.
-
Step (2) Merge aircraft registration, characteristics and tail number data. This process uses the FAA aircraft registry database and the FAA aircraft characteristics database. The process generates a vehicle data file.
-
Step (3) Perform statistical analysis. This process uses the vehicle data file to generate aircraft characteristics statistical information, including aircraft model, age of fleet, takeoff gross weight (TOGW), and landing gear configuration. For the purpose of this paper, statistics include minimum, median, mean, maximum and standard deviation. Excel spreadsheet functions were used.
-
Step (4) Merge tail number and flight track data. This process uses flight track data for each tail number to generate flight operations data. Data are converted from Coordinated Universal Time (UTC) to local time.
-
Step (5) Perform flight and airport statistical analysis. This process uses flight operations data to generate flight operations data such as flights per day, average flights per day, flight durations, average flights per day and flight operations at each airport. Includes tracing flight tracks and the location and status of the wildfires. For the purpose of this paper, statistics include minimum, median, mean, maximum and standard deviation. Excel spreadsheet functions were used.
-
Step (6) Merge airport location, infrastructure, and equipment data. This process generates the airport and heliport data list. The process uses an FAA airport database and a heliport database (created for this analysis).
-
Step (7) Perform airport operations statistical analysis. This process generates airport and heliport infrastructure and equipment statistical information, including the number of runways, runway weight limitations and navigation equipment.
3.0 U.S. aerial fire fighting statistics (2025)
In 2025, there were 77,850 reported wildfires that burned 5.3M acres [14]. The annual number of wildfires was a 10-year high that exceeded the 10-year average by 25%. The Southern Area, a region bounded by Virginia, Florida, Texas and Kentucky, had the most wildfires (37,088).
Non-intuitively, the total acres burned was the third lowest over the last 10 years and was 33% below the 10-year average. Alaska had the most acres burned (1M). The total acreage burned can be disproportionately driven by a small number of very large fires. National Interagency Fire Center (NIFC) long-term statistics demonstrate years in which wildfire counts are high, but total area burned remains relatively low, reflecting variability in fire size distributions and suppression effectiveness [11].
In 2025, the National Interagency Coordination Center (NICC) received 1,339 requests for VLATs and LATs (including scoopers). Nine hundred and eighty-two requests were filled, 207 were cancelled and 173 were unable to fulfill (UTF). This annual number of mobilisations was slightly below the 10-year average (1,050).
3.1 Fleet characteristics
The U.S. Forest Service Multiple Award Task Order Contract (MATOC) for 2025 included a fleet of 43 VLAT, LAT and scooper aircraft (Figure 2). There were 4 DC-10s that have a retardant capacity of 9400 gallons, 14 vehicles with a 4,000-gallon capacity (737, MD87 and C-130), 15 BAE–146 class vehicles with a retardant capacity of 3,000 gallons, 2 vehicles with 2,600-gallon capacity (Dash-8) and 8 scoopers with 1,600-gallon capacity.
All the vehicles, except for the C-130s, load retardant through flow (i.e. batch loading pumps or gravity feed). C-130s load retardant via pre-filled roll-on tanks to reduce retardant loading times. Scoopers collect water from nearby lakes.
U.S. MATOC Fleet 2025.

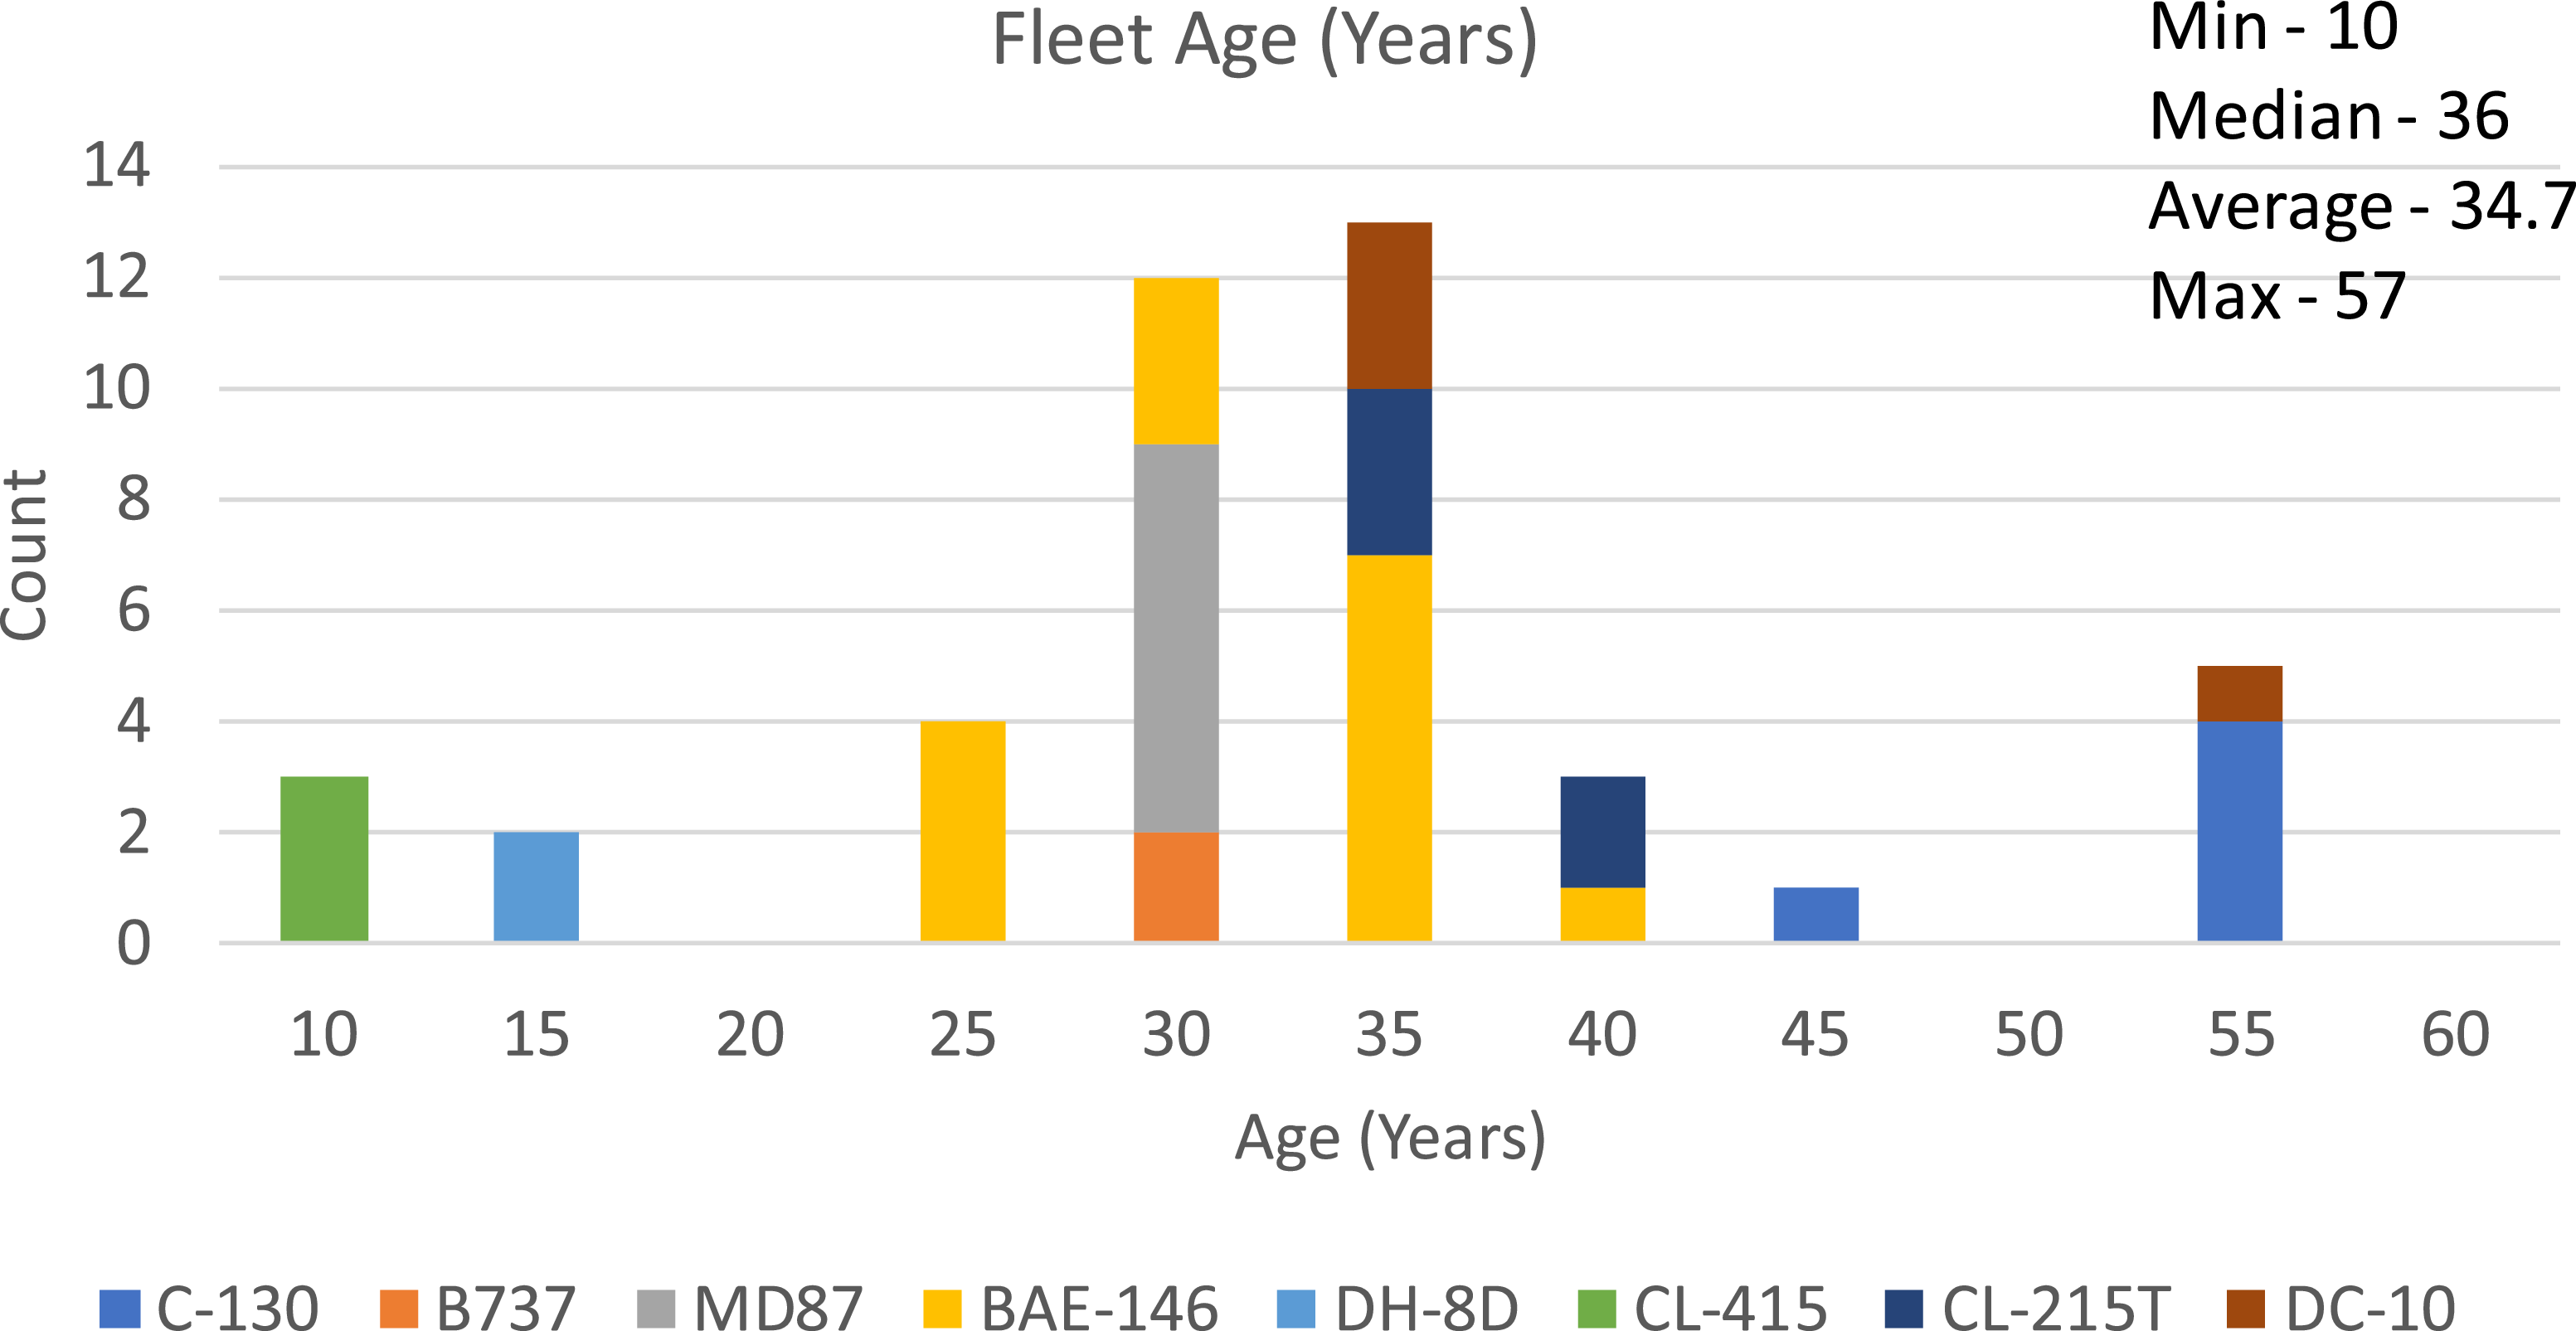
The oldest aircraft in the fleet, the C-130s, are 57 years old as of the date of manufacture (Figure 3). The youngest aircraft are the three scoopers (CL-415) and the two Dash-8s (DH-8D). The number of aircraft is equally split above and below the median age of 36 years. The mean age of the fleet is 34.7 years.
The U.S. MATOC Fleet 2025 ranges from 10 to 57 years, with an average of 34.7 years.

3.2 Flight operations
The analysis of flight operations was conducted for all 43 active aircraft in the U.S. MATOC fleet in 2025. The flight operations included retardant drops, repositioning, maintenance tests and field training. An estimated 10,902 flight operations occurred during this period. This was a 2.8% reduction over 2024 [Reference Sherry and Chaudhari15]. Note that the 2025 statistics included the scoopers that were not included in the 2024 statistics.
3.2.1 Flight operations per day
One or more vehicles were active on 92% of the days in 2025 (Figure 4). On the average day, 30.5 flight operations were conducted. The median was 8.5 flights per day. A maximum of 206 flights were conducted in one day (August 3rd).
There were 8 days that exceeded three standard deviations from the mean (
 $\gt$
161 flights per day), 27 days that exceeded two standard deviations (
 $\gt$
118 flights per day), and 57 days that exceeded one standard deviation (
 $\gt$
74 flights per day). The eight days above three sigma represent a “fat-tailed” distribution where extreme outliers occur far more frequently than predicted by a normal distribution.
Number of flights per day for each day of the year.

Number of flights per day for each month.

The days in excess of one sigma occurred predominantly during a period between June 1 and September 30. For this paper, this period is labelled as the “high-tempo” operations period.
The fleet-wide daily flight operations exhibit a pronounced seasonal escalation in activity with clear contrasts between winter/spring, and the high-tempo, peak fire summer months (Figure 5). From January through May, daily activity is generally low to moderate, with a median daily operational count ranging from 2.5 to 13 flights per day. Average daily activity in this period is modest, typically below 16 operations per day, and the maximum monthly value is 56 flights per day. The max flights per day reflect the limited surge requirement in support of sporadic but large wildfires (e.g. the Palisades, Eaton, Kenneth and Hurst fires in Los Angeles in January).
A sharp inflection occurs beginning in June, intensifying through August, when the system transitions into sustained high-tempo operations (Figure 5). In these months, medians rise dramatically – from 44.5 in June to 103 flights per day in August – indicating that high activity is not occasional but typical. Average daily operations peak at 115 flights per day in August, with extreme maximums of 183–206 flights. These statistics represent the system’s need to absorb large surges during major fire events. The elevated minimum in August (39 flights per day) further underscores continuous demand with virtually no downtime.
Activity starts to decline rapidly in September and returns to low levels by October–December, reinforcing the cyclical nature of operations.
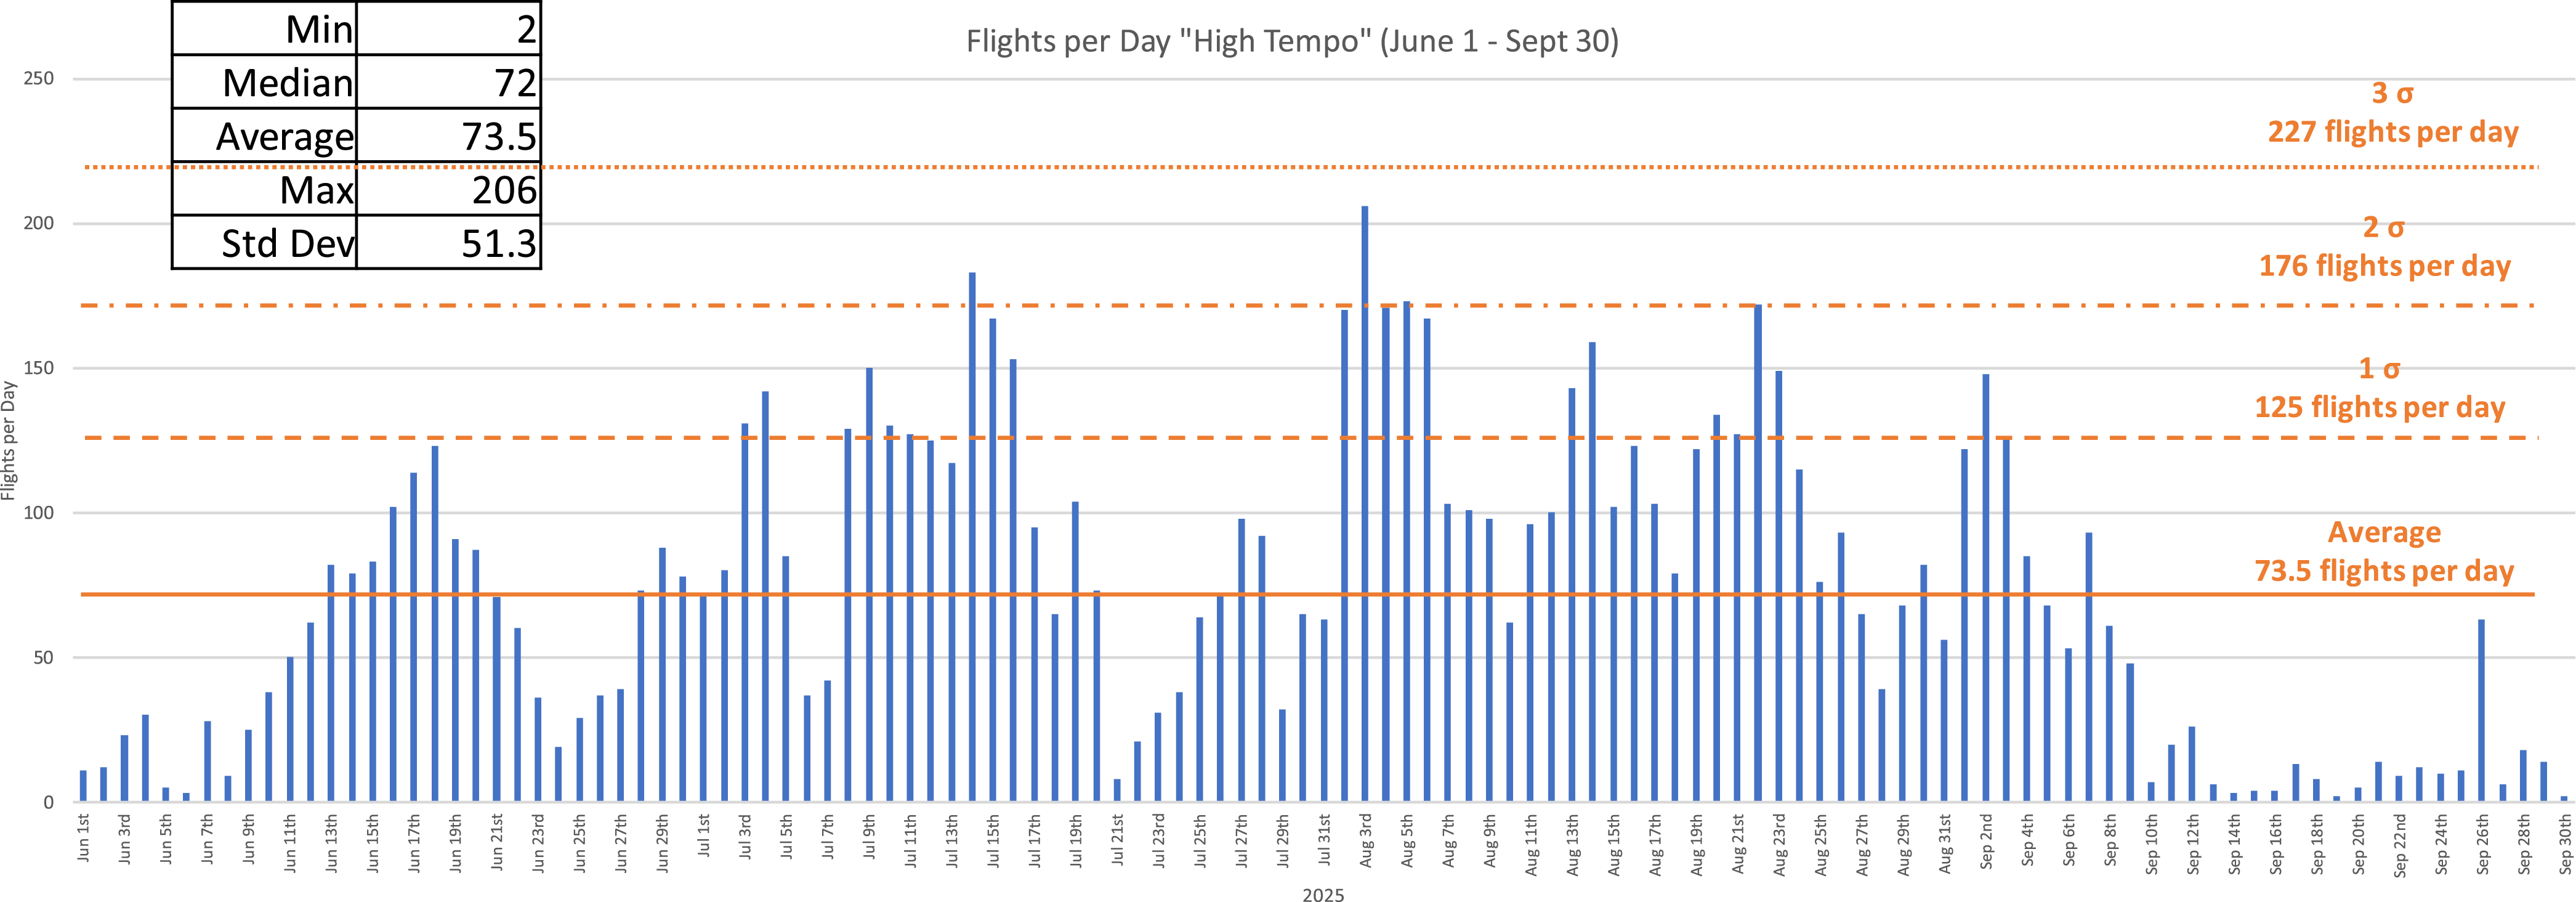
For the high operations tempo period, June 1 to September 30, the average number of flights per day was 73.5 with a median of 72 flights per day (Figure 6). The maximum number of flights per day was 206. Using the average and standard deviation during this period, there were no days in excess of 3 sigma (
 $\gt$
227 flights per day), 2 days with flights in excess of 2 sigma (
 $\gt$
176 flights per day), and 19 days in excess of 1 sigma (
 $\gt$
125 flights per day). During this period, the distribution is symmetric (i.e. median = mean), and the absence of days above 3 sigma is indicative of demand for flight operations that can be anticipated with reasonable accuracy.
Number of flights per day for each day from June to September.

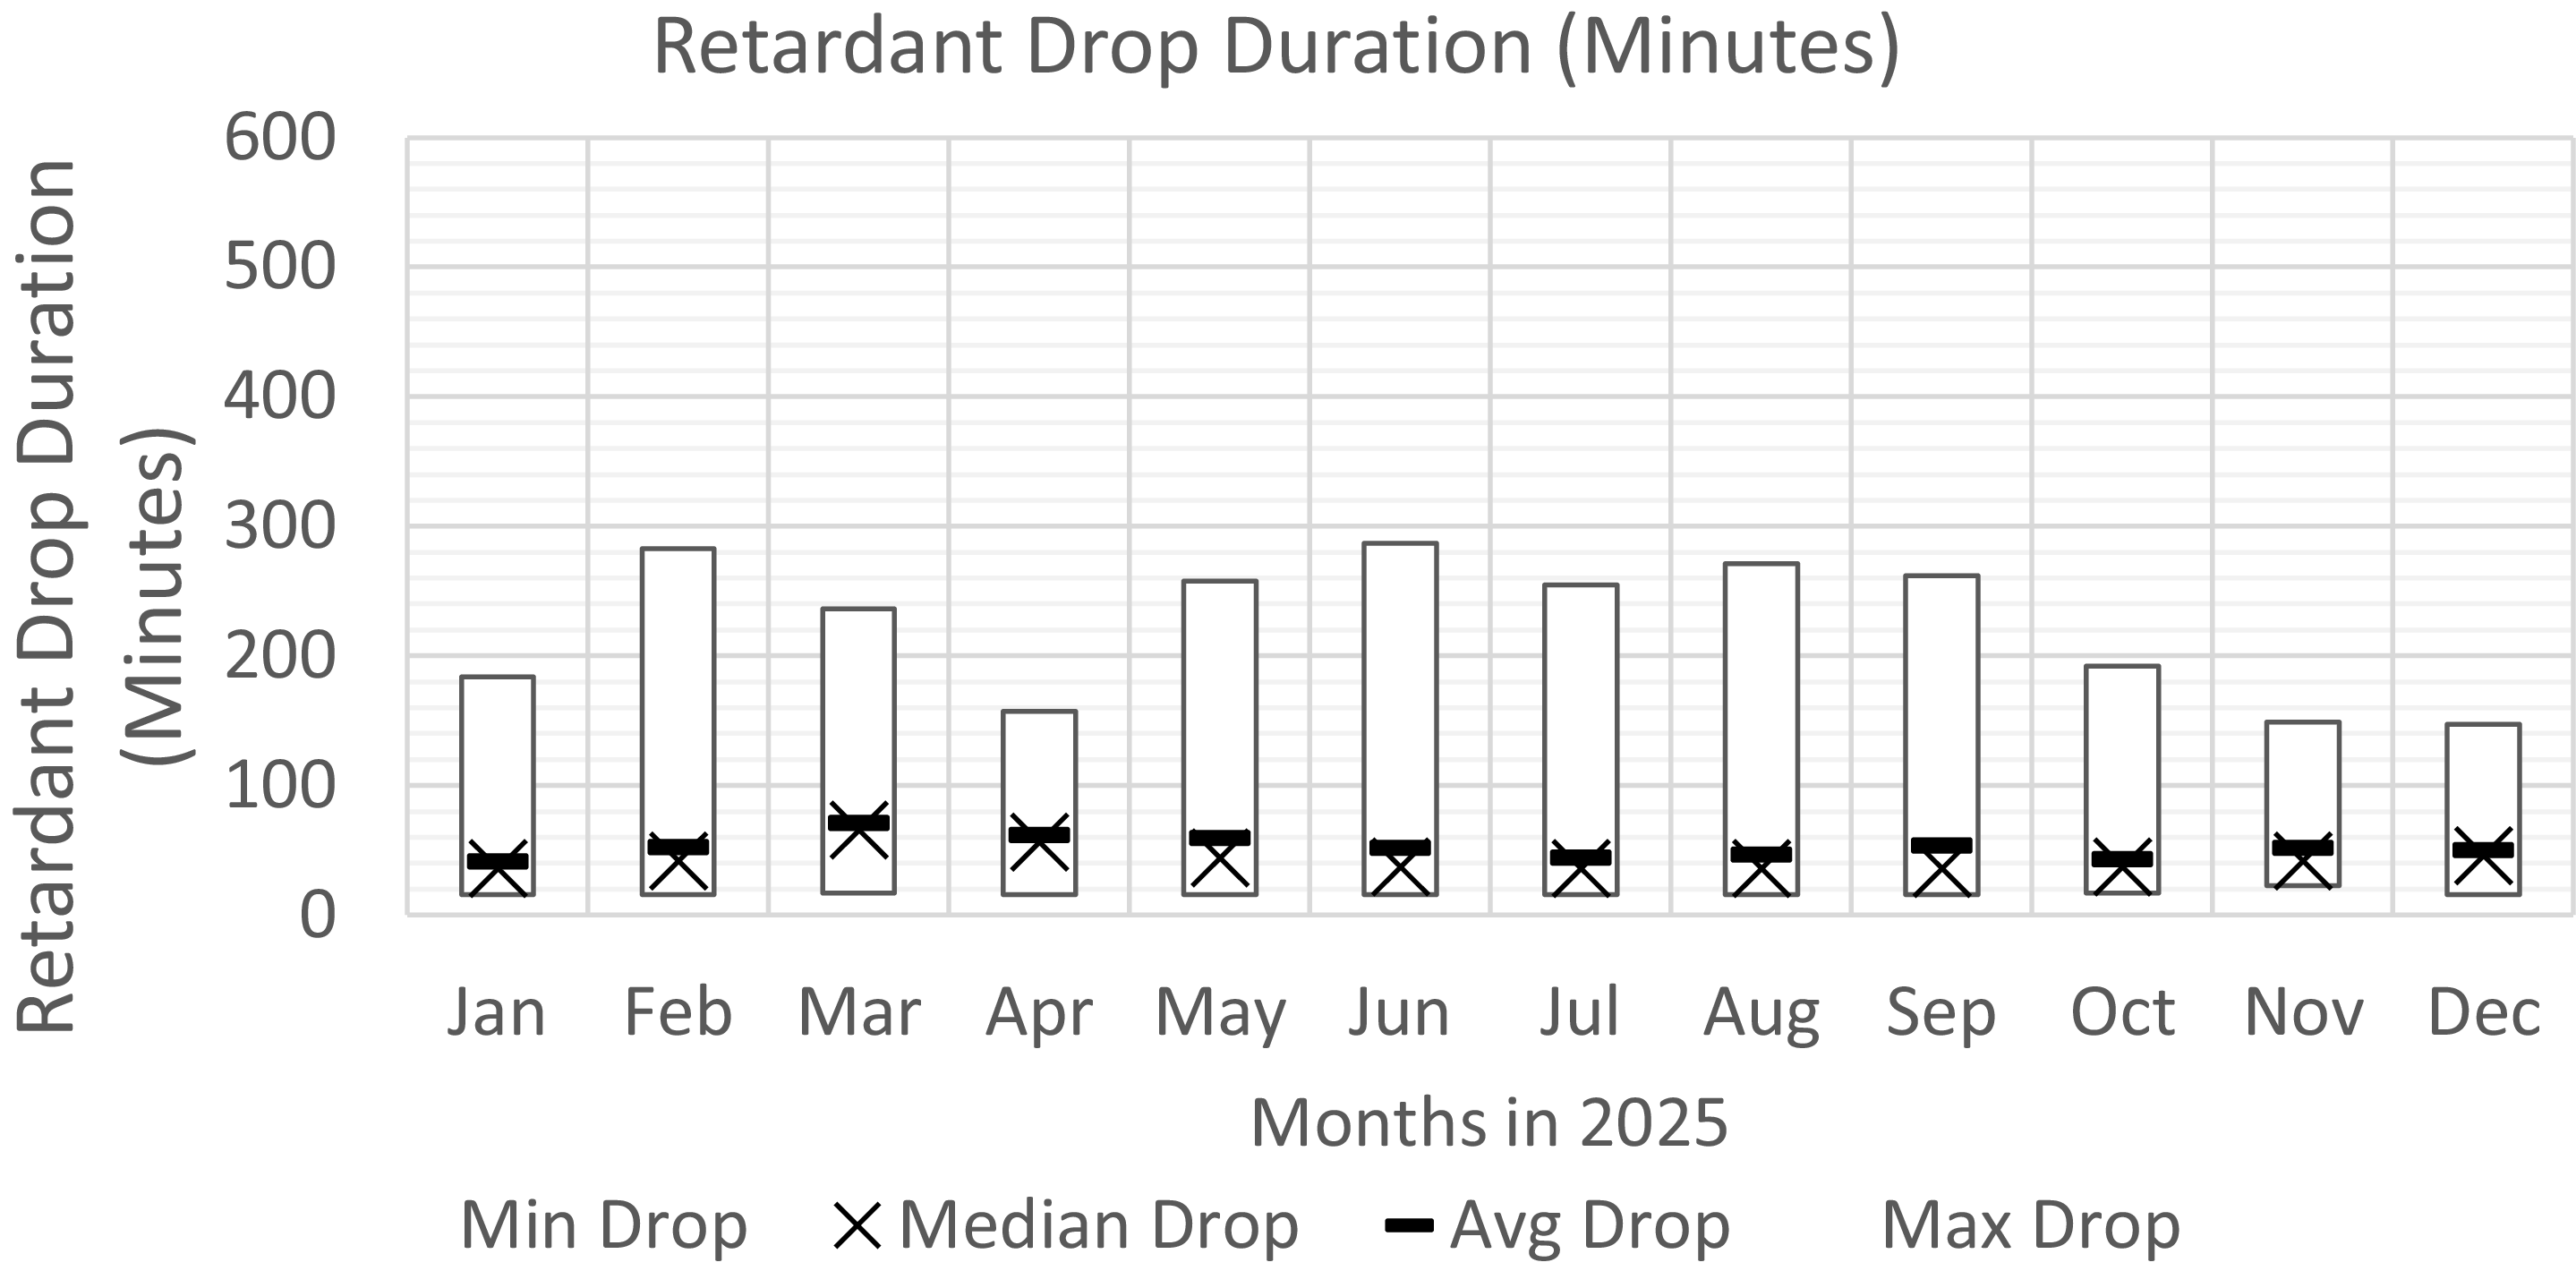
Flight duration for retardant drop flights.

3.2.2 Flight durations: retardant drops and repositioning
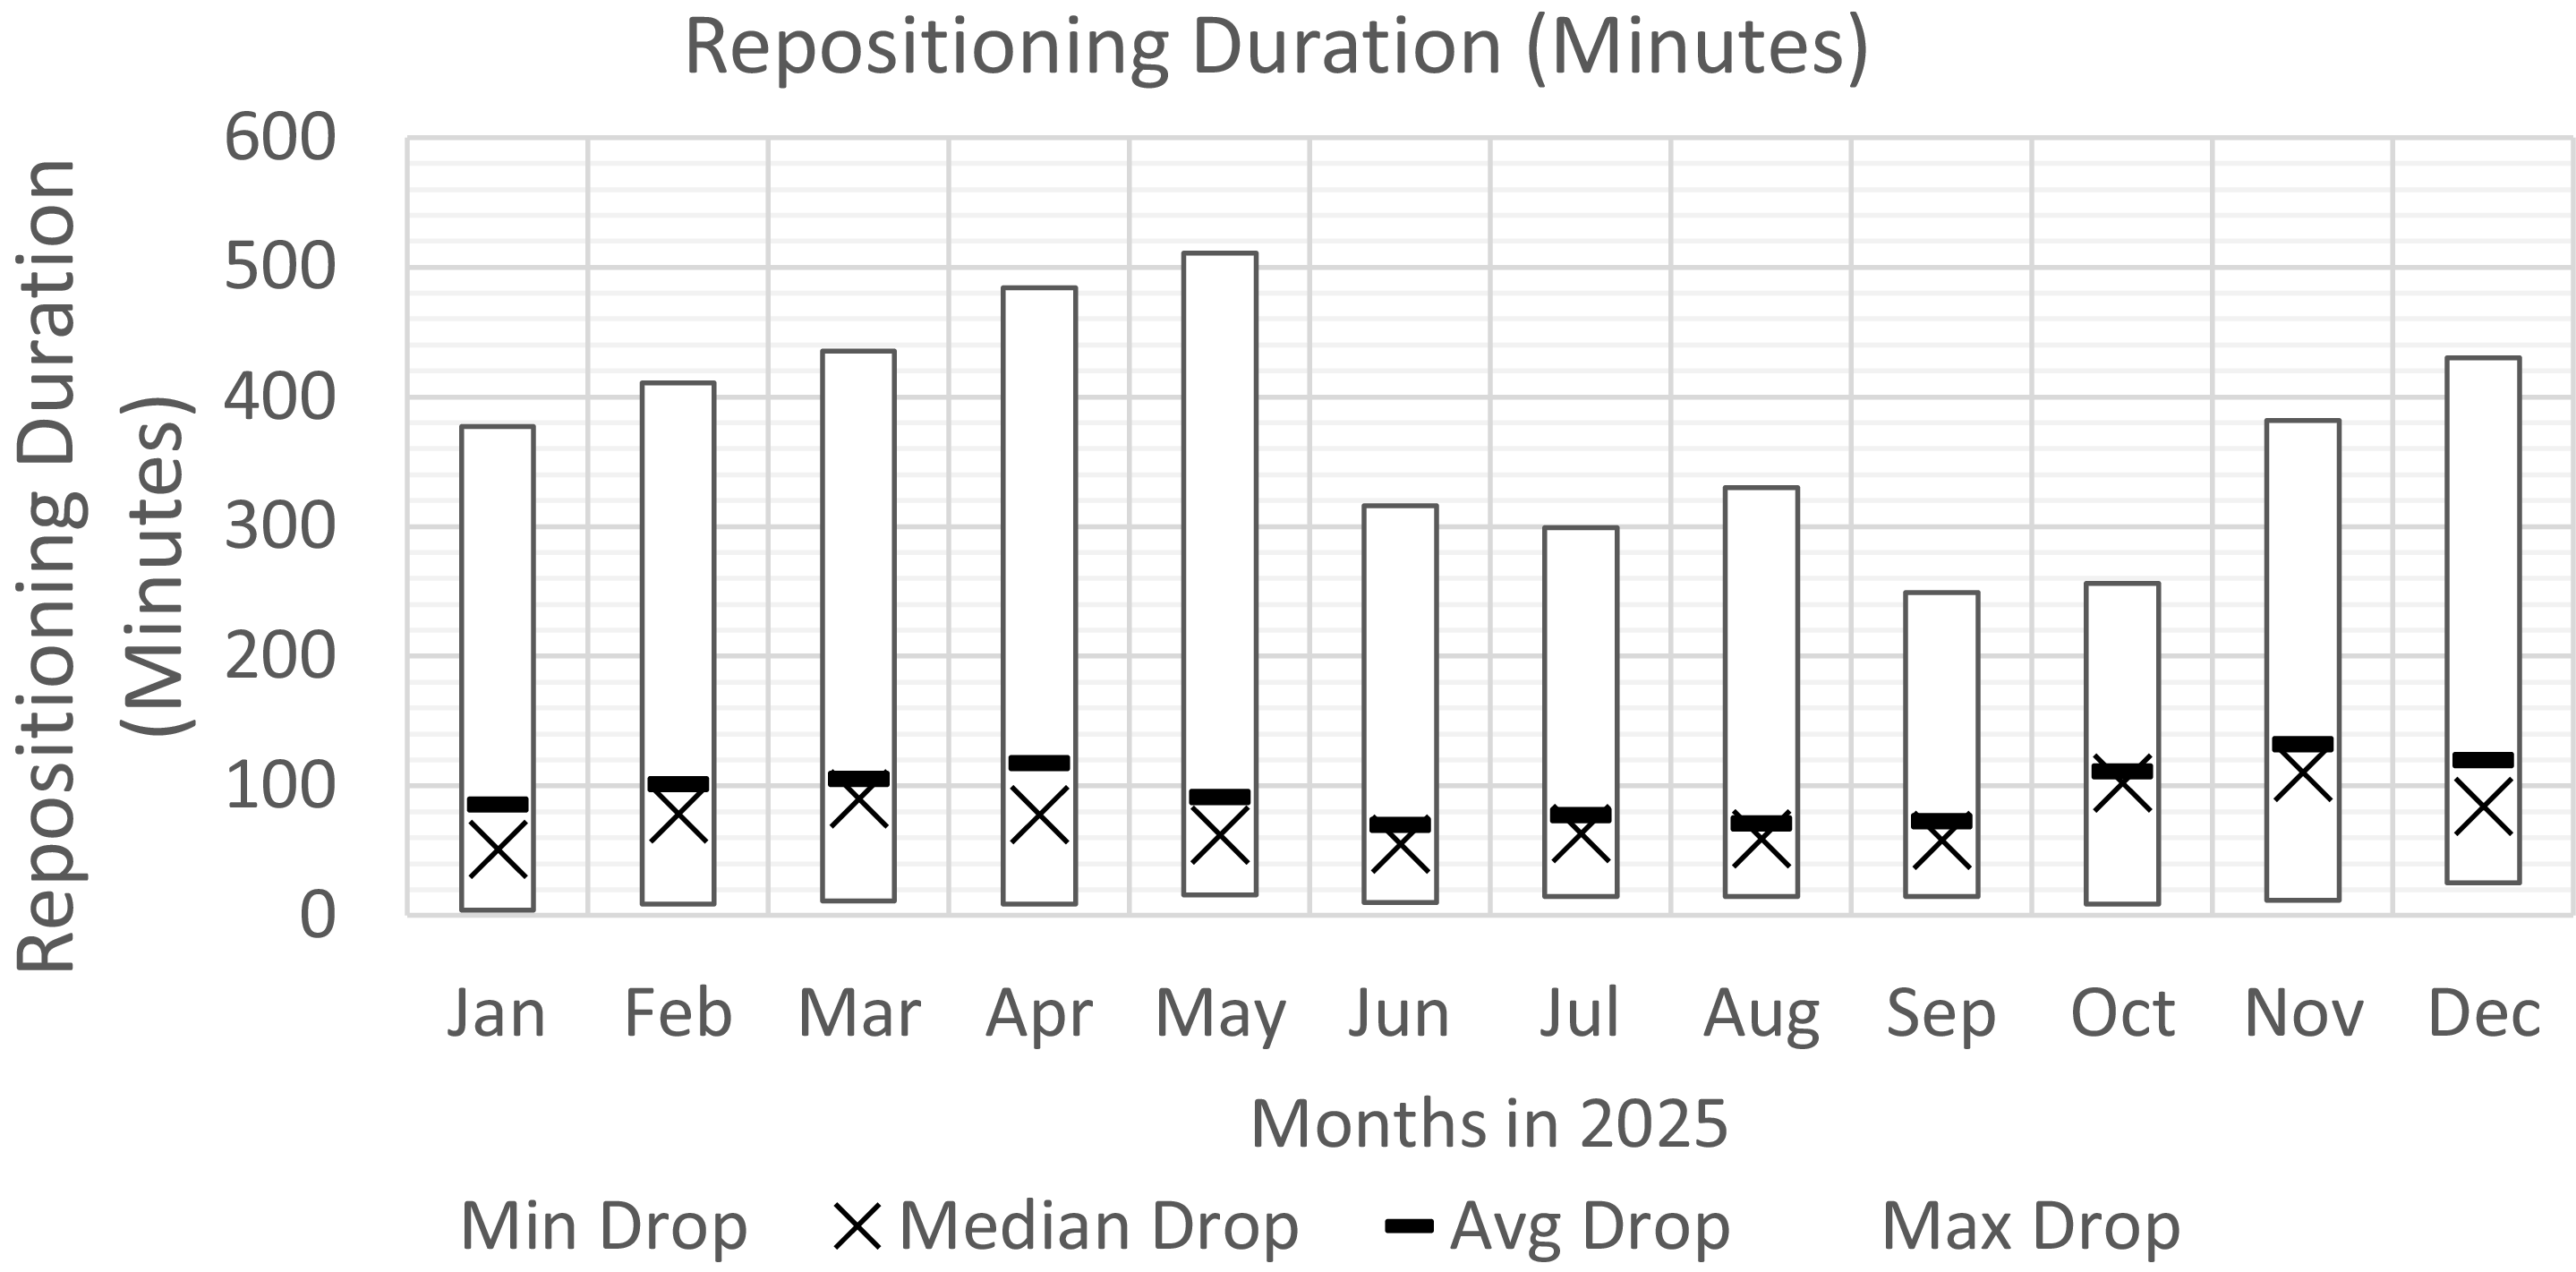
The efficacy of getting VLATs/LATs/scoopers over the wildfires can be measured by the flight duration of retardant drop flights (Figure 7). The efficacy of the basing and pre-positioning can be measured by the flight duration for repositioning flights (Figure 8).
During the high-tempo operational months (June–Sept), the median flight duration for retardant drop flights was ∼36 minutes. This indicates that half of the flights were operating from air tanker bases in geographic proximity to the wildfires such that the aircraft could be over the fire in around 30 minutes. The other half of the flights had drop durations up to 287 minutes, indicating that the location of the wildfires relative to the bases required longer trips. Note that the flight duration for retardant drop flights includes loitering times.
During the lower-tempo months, the monthly median flight duration for retardant drop flights ranged between 44 and 56 minutes, indicating that during these periods the available aircraft were based further from the active wildfires.
Repositioning-flight durations in 2025 also exhibited seasonal variability, with monthly median values ranging from approximately 70–120 minutes. The maximum repositioning durations ranged from 250 to 300 minutes during the high-tempo operations period and from 350 to 500 minutes during the rest of the year.
The ratio between repositioning flight durations and retardant drop flight durations is approximately 1.5 during the high-tempo months, and between 1.5 and 2.5 during low-tempo months.
It should be noted that the retardant drop durations and repositioning durations are the result of a complex interaction between the location of the wildfires, the location of airports that can serve as air tanker bases, the availability of aircraft and the real-time location of aircraft. The data indicates that during the high-tempo months, the geographic proximity of the wildfires west of the Rockies is closer than the geographic proximity in the other months when the wildfires were spread out across the south and southeast.
Flight duration for repositioning flights.

3.2.3 Time of day
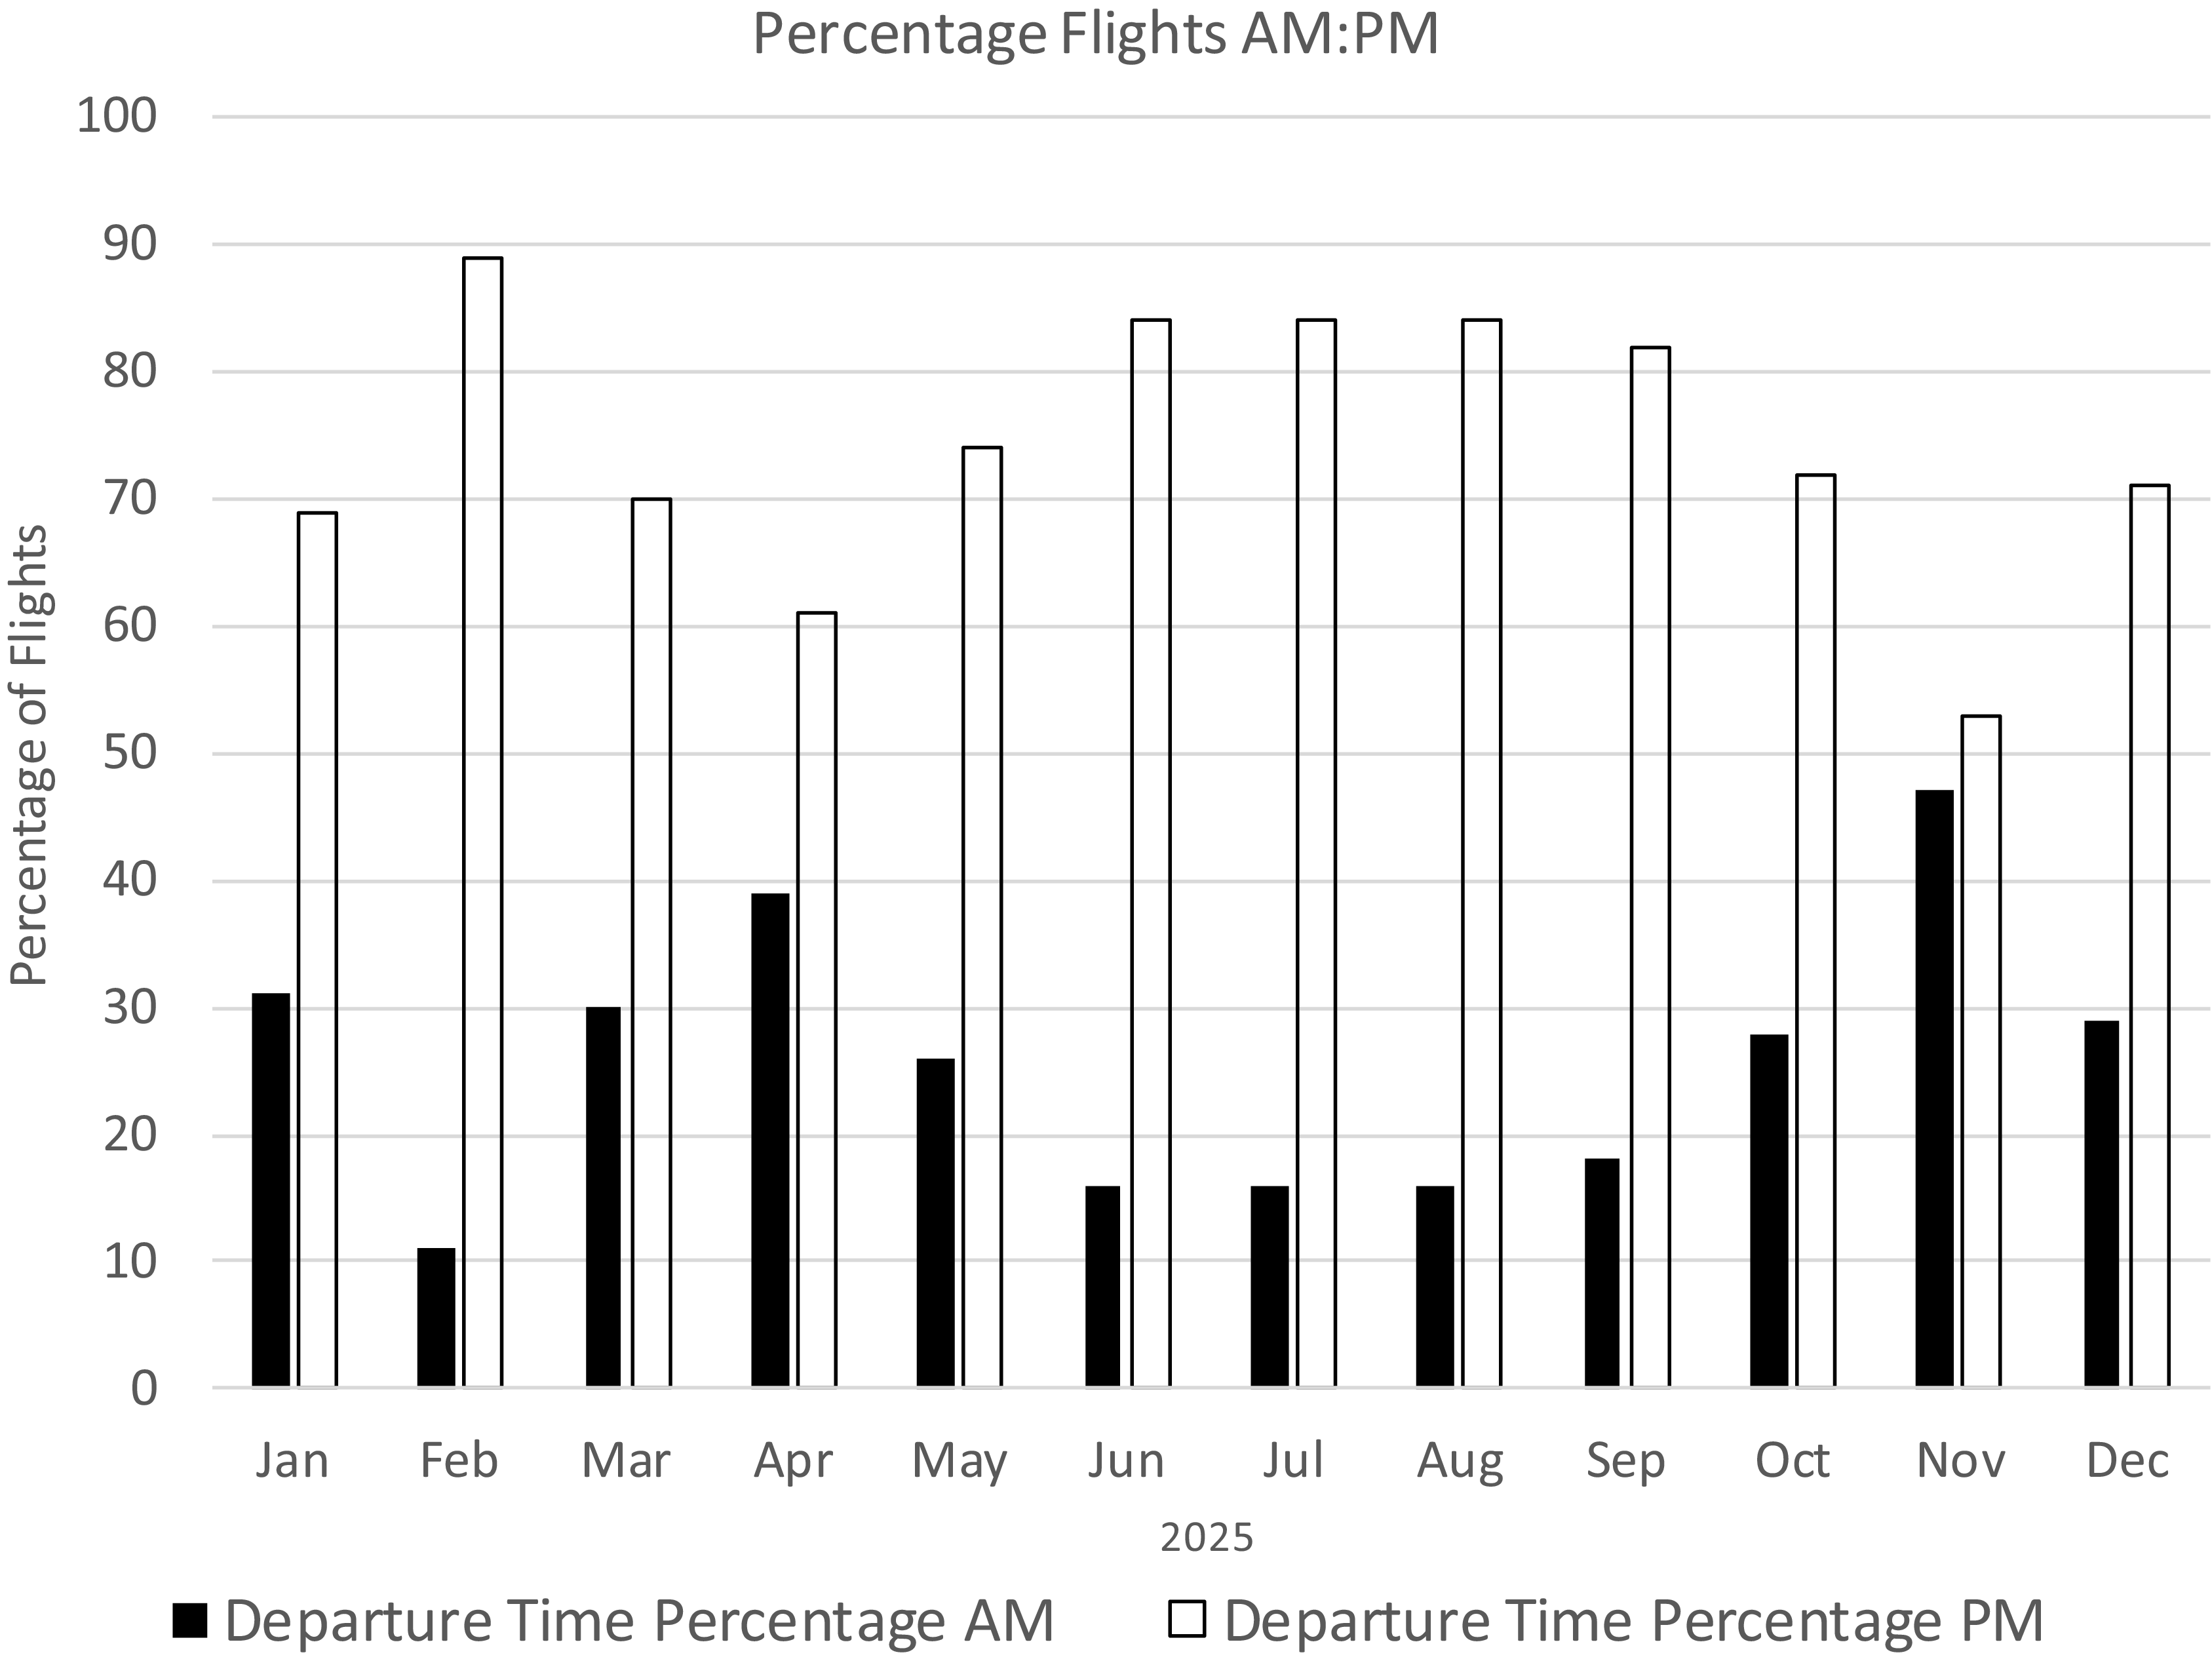
Throughout 2025, afternoon (PM) departures consistently made up the majority of flights, while morning (AM) departures remained much lower across all months (Figure 9). Afternoon departures stayed high year-round, generally ranging from about 70% to 90%, peaking in February, June–August and September, where they exceeded 80%. Departures before noon exhibited fluctuation between roughly 10% and 45%. Morning flight activity was lowest in February and June–August, and highest in April and November. The time of day is determined by operational rules that require air tankers to operate in visual meteorological conditions (VMC; i.e. daylight), and by wildfire dynamics that dictate the preferential time of day for retardant drops.
Percentage of flights before noon (blue) and after noon (orange). All times are local.

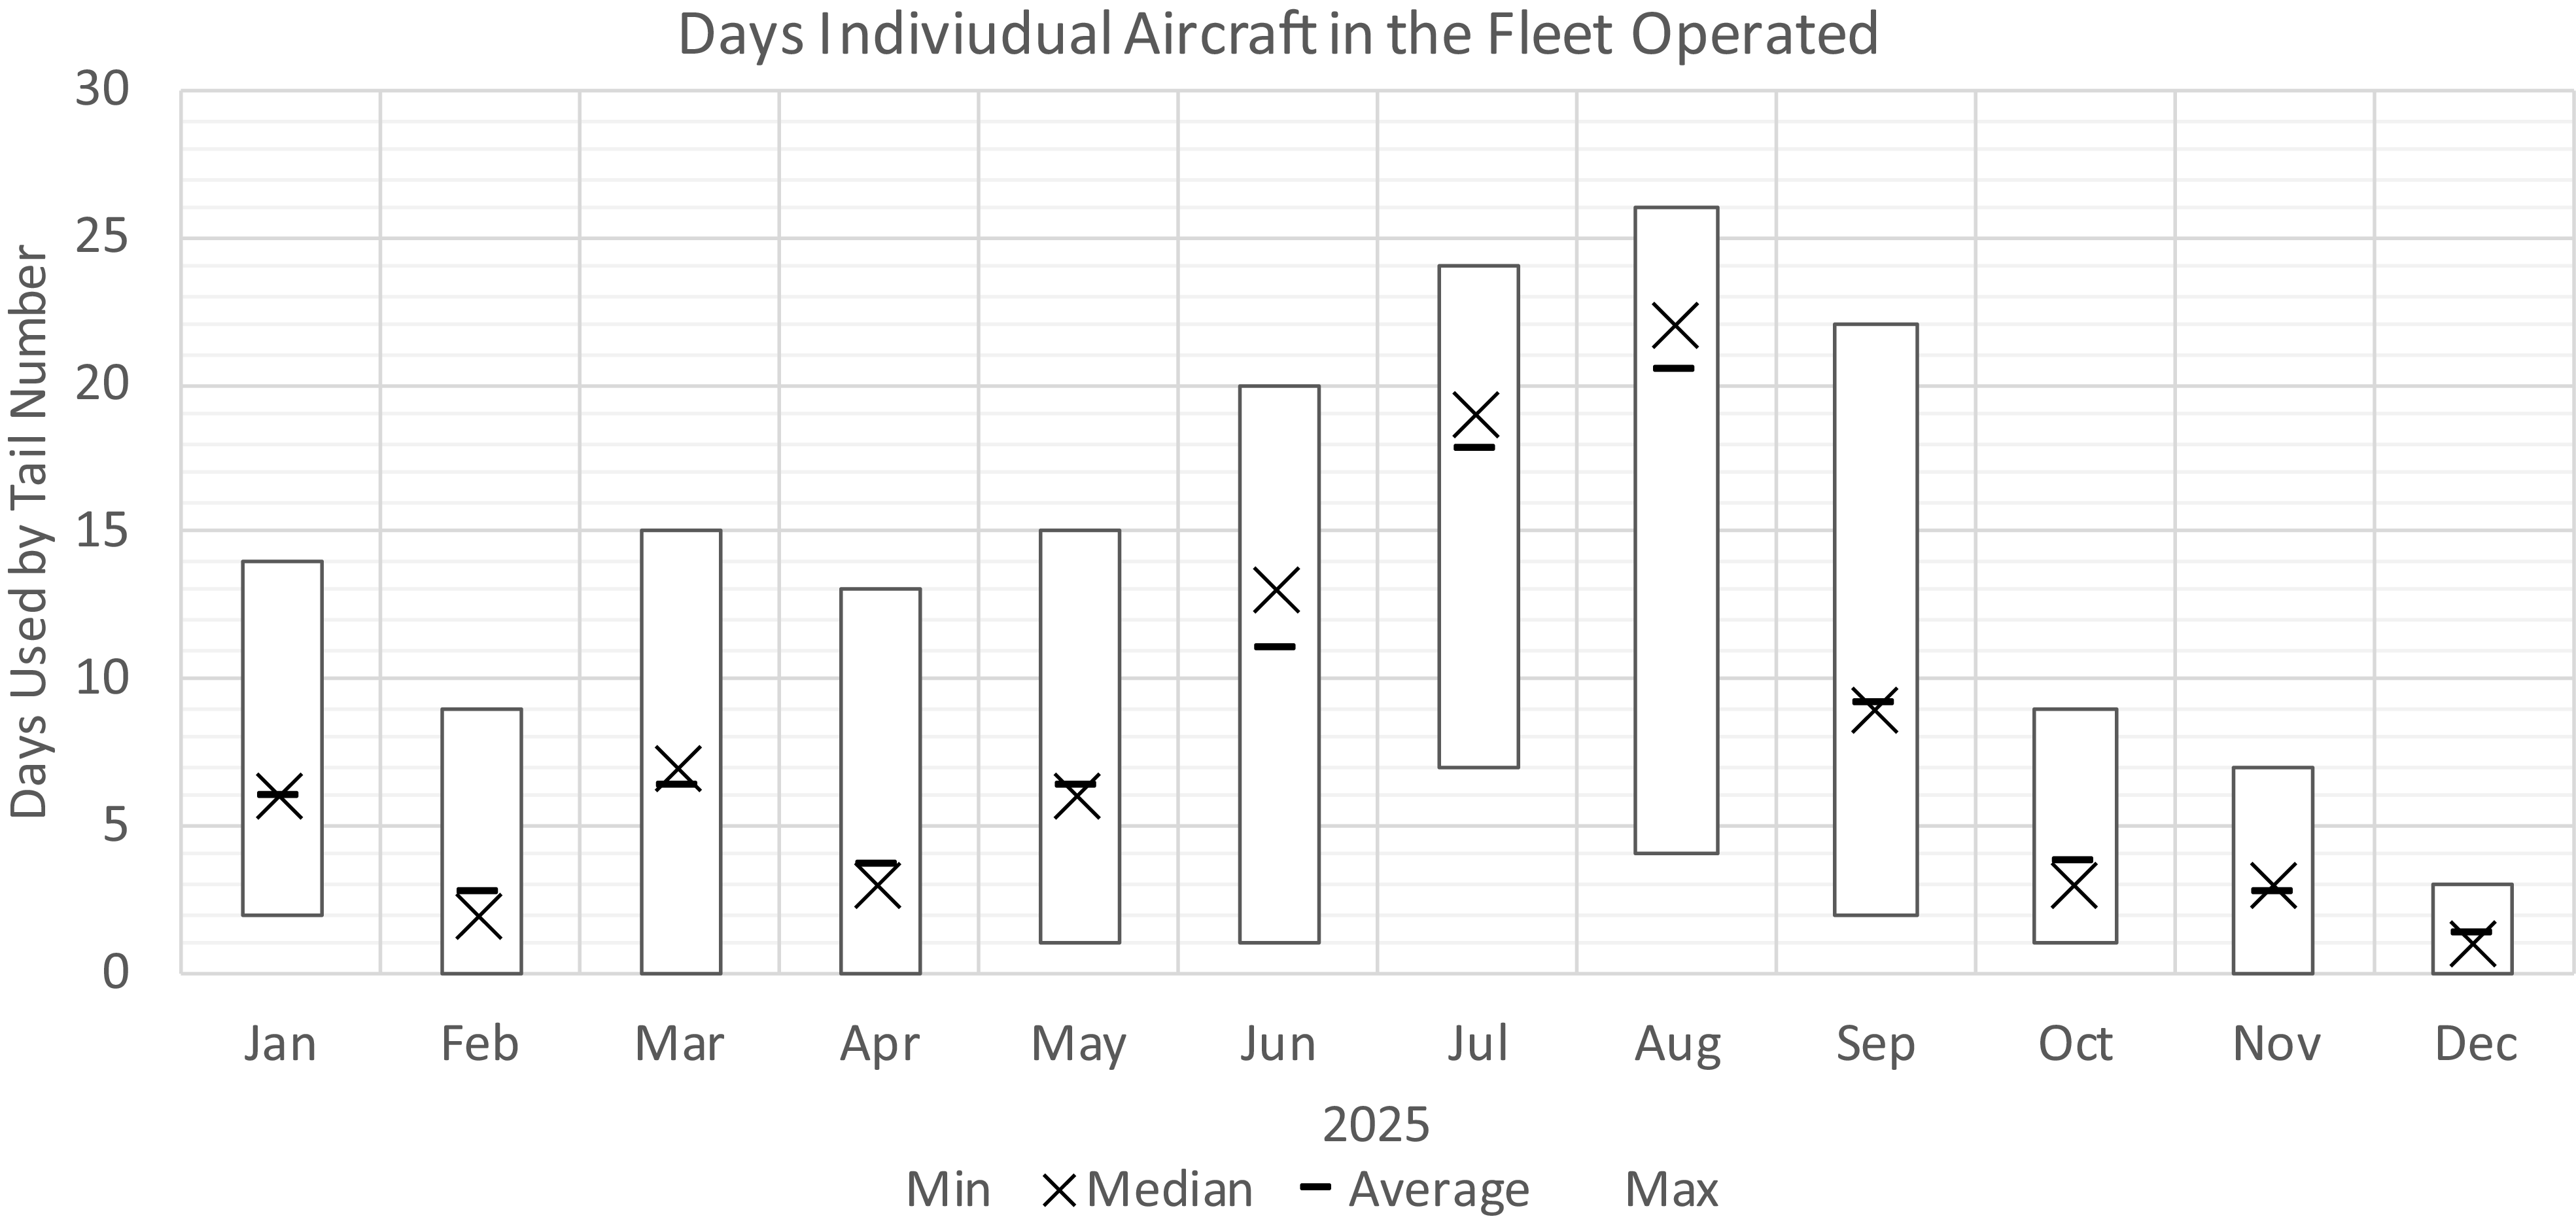
Days per month operated by aircraft in the fleet.

3.2.4 Fleet utilisation
The number of days in each month operated by aircraft in the fleet varied by season (Figure 10). The maximum days operated by one or more aircraft was 20, 24, 28 and 22 days a month in June, July/August, July and September, respectively. During these months, the average and median are a few days below the maximum, indicating that the majority of the aircraft in the fleet are operating almost daily, approaching their practical limits once weather, maintenance and crew rest are considered.
During low-tempo operations, the average number of days operated was between 1.4 (December) and 6.4 (March) days per month.
These statistics have implications for fleet sizing, maintenance scheduling, fatigue management and contract design.
3.3 Airport utilisation
In 2025, 195 airports in the contiguous United States (CONUS) and Alaska had one or more departures. One hundred and fourteen (114) airports had four or more departures. During the peak summer months, major wildfire activity (orange) was supported by airport operations (blue) in Northern and Central California, Oregon, Washington, Idaho, Montana, Arizona and Alaska (Figure 11). During the low-tempo operations season from January to May, 44 airports had one or more departures. Twenty-one of the airports were in the region bounded by New Mexico, Florida, North Carolina and Tennessee.
Distribution of major wildfires (orange) and airports with more than three air tanker departures (blue).

Twenty-four airports, ranked by the number of departures, accounted for 75% of total departures.

A small number of airports accounted for the majority of the departures. Seventy-five percent (75%) of departures took place from 24 airports (Figure 12), and 13 airports accounted for 50% of departures. These top 24 airports are located adjacent to and west of the Rocky Mountains (Figure 13).
Geographic locations of top 24 airports that account for 50% of departures.

4.0 Conclusions
Wildfires are a key ecological process to maintain biodiversity and promote ecological health in fire-prone regions. When wildfires burn uncontrolled, they can rapidly escalate and create severe threats to ecosystems, human life and infrastructure. The increasing frequency and intensity of these fires have led to a greater need for effective fire containment and suppression strategies such as aerial firefighting.
This report provides a statistical analysis of the VLAT, LAT and scooper fleets contracted under the USFS MATOC programme for the 2025 fire season. Data include the aircraft characteristics, flight operations and airport utilisation. Analysis identified key performance metrics such as aircraft age, operational tempo and the location of wildfires and air tanker bases. This information, which is not readily available, may be of use to air tanker operators, airport planners, air navigation service providers and policy makers.
The current fleet of VLATs, LATs and scooper aircraft is predominantly composed of ageing airframes, many of which were re-purposed from former military or commercial service decades ago. This ageing profile can limit availability and increase maintenance burdens.
The reliance on older platforms reflects the economic realities of the high costs of developing and certifying purpose-built firefighting aircraft, versus the lower costs of converting existing airframes to retardant delivery roles. Recently, there has been activity toward purpose-designed and more sustainable firefighting aircraft. For example, Neptune Aviation announced plans to transition to Airbus A319-based tankers with greater payload capacity and operational efficiency (neptuneaviation.com). These aircraft are scheduled to enter service in the 2027 wildfire season. Similarly, new amphibious and utility aircraft such as the KE-72/FF-72 series are under development to replace legacy scooper types with improved performance and higher water capacities. The KE-72/FF-72 are variants of the ATR-72 (positive-aviation.com/).
In the U.S., the highest tempo operations occurring June through September were located to the west and adjacent to the Rocky Mountains. In the lower-tempo months in the spring season, aerial fire-fighting efforts occurred in the southeastern and southern states. These states generally do not have the proportional state budgets or infrastructure to support wildfire fighting as the western states do.
The fleet size should be determined by the peak demand. In 2025, this occurred in August when aircraft were operating around 25 days per month, which may be a measure of the upper practical limits for sustained operations.
During peak operations, 50% of the fleet were over the wildfire in approximately 30 minutes. Increasing fleet size and prepositioning could improve this statistic. Longer retardant drop locations were for operations in the southeast and southwest where that rely on temporary air tanker bases.
The location of airports used indicates a growing trend for aerial firefighting in the south and southeast.
The difference in the ratio of retardant drop duration and repositioning duration provides some insights into the effectiveness of coordination, infrastructure availability and prepositioning of retardant and fleet. Whereas the goal is to maximise the use of aircraft for retardant drops, the complex interaction between the relative location of the wildfires and the airports designated as air tanker bases, the availability of aircraft for service, and the real-time location of aircraft determines the actual utilisation.
The ratio between dropping and repositioning duration may be a useful metric for determining fleet size and the efficacy of coordinating, dispatching and pre-positioning. Further research is required to better understand the circumstances behind the unable-to-fulfill statistic and possibly enhance it.
Under current operational rules, air tankers performing low-altitude retardant drops are restricted to operations in VMC (i.e. daylight). Although most drops occur in the afternoon, research suggests an expanded diurnal cycle to include the early morning hours – specifically soon after sunrise – when atmospheric conditions favour controlled, accurate delivery [16]. At this time of day, surface-level winds are generally the lightest, relative humidity begins to rise and the boundary layer remains shallow and stable, minimising turbulence and reducing drift during retardant dispersion. Increased moisture content in the early morning air may help retardant adhere to foliage and reduce evaporation losses, further enhancing efficacy. As the day progresses into late morning and afternoon, rising temperatures generate stronger convection and gusts, which elevate turbulence and degrade drop accuracy – particularly in complex terrain where diurnal upslope winds can be significant. Ongoing advances in aircraft navigation and advances in the fidelity of drop zone identification may provide an opportunity to perform retardant drops at these times of the day.
Fire retardant deployment, aircraft repositioning, fleet utilisation and airport usage data can be integrated to optimise wildfire prevention and suppression planning by ensuring that aerial firefighting resources are located where they can respond most rapidly to emerging fire threats. The fleet utilisation data, identifying aircraft availability, maintenance requirements, surge capacity and airport usage data that reveal runway capabilities, fuelling infrastructure, retardant loading facilities and congestion constraints can be used to develop strategies that minimise response times, maximise aircraft effectiveness, reduce operational costs and improve the likelihood of containing fires during the critical early stages when suppression efforts are most effective. Future work also includes the addition of meteorological data such as average, minimum and maximum air temperatures, air humidity and wind speeds and directions during air tanker operations.
Acknowledgements
The authors acknowledge the contributions to this research of Paul Petersen, Tiffany Taylor (UAFA), John Gould and Joel Kerley (10Tanker), Randy Sakowitz (Prime Minute), George Donohue, John Shortle, Chaowei (Phil) Yang, Shahab Aref, Fahimeh Ghorbani and Ashim Thapa (GMU).






 Open access

