

Introduction
To research into design process, experimental methodologies are widely used. The term “Design Experiments” was introduced in 1992 by Brown (Reference Brown1992) and Collins (Reference Collins, Eileen and Tim1992) in their articles (Collins et al., Reference Collins, Joseph and Bielaczyc2004). Since then, various design experiments are carried out in order to look into design process. Among these experiments, data analysis methodologies become more and more popular and important. However, applying data analysis in design experiment could be challenging.
Firstly, most design problems are complicated or even ill-defined (Buchanan, Reference Buchanan1992). In this case, transforming complicated real-world design process and results into data could be tricky. Many design researches try to explore design process in common design tasks which is always complicated and hard to experimentally control. In this case, methods like protocol analysis, Linkograph (Goldschmidt, Reference Goldschmidt1990), and electrophysiological monitoring method are introduced to support design experiments. The other types of research, on the other hand, set up simplified tasks and framed processes of design. Interactive evolutionary computation (IEC), which is the core topic of this paper, is one of the methods used here. IEC is an optimization method based on evolutionary computation and subjective human evaluation. We could take it as an EC system with fitness function replaced by human evaluation (Takagi, Reference Takagi2001).
Secondly, many design experiment researches fail to collect enough data to carry out effective data analysis. Since design experiment could be time-consuming and requires certain environments, carrying out experiment widely is always tough. Dorst and Cross (Reference Dorst and Cross2001) carried out a design experiment to look into creativity in design process. The design objective was a concept for a “litter disposal system” in train. The experiment applied verbal report as well as video recording. A single round of experiment takes 2.5 h and analyzing the recording takes even more. With nine subjects in total, their analysis mostly focused on design process at the individual level, and the correlation between design quality and simple design feature. Statistical analysis of design process details was not carried out since the sample size is insufficient. The situation is common and inevitable when it comes to complicated design tasks. However, certain kinds of IEC systems could be applied on large-scale experiments since it does not require specific environment and the recorded data can be transformed without manual work.
Thirdly, recording the process of design experiment is also tricky. Since real-world design process often includes many stages and activities, to record and structuralize design process requires a well-designed experiment setting. Gero (Reference Gero1990) proposed the famous FBS ontology to describe design process which concludes activities in design into six models of activities involving different relationships between function, behavior, structure, and description. The FBS ontology adequately shows the complexity of design process. Additionally, design activities can also be conducted and recorded via numerous medias including speaking, gesture, sketching, modeling, and operations on any digital platform, troubling both recording and structuralizing of design process. In this case, restricting and simplifying design process is inevitable for most design research. IEC system could simplify and record design process since the system naturally restricts design process into looped evaluation and evolution. In this way, design process is simplified from the complicated real-world process into structured loops which filters away most details. Human evaluation recorded at each round could be used as data which reflects behavior and preference in design process.
In this paper, we introduce a research based on a previously conducted IEC design experiment to face the challenges above. With the dataset collected from this experiment, we try to explore the category and process of the recorded designs, as well as further usage of data for improving IEC systems. In the experiment, an IEC system was employed to help 230 users select the most satisfying designs. Since the EC we developed is greatly based on genetic algorithm (GA), we could also address it as an IGA system. In our previous work, we analyzed their selected images and got some general design patterns such as the relationship between the income and their design preference. In this paper, further analysis is conducted using holistic color interval and K-means clustering method, trying to reveal individual differences of design patterns. We also try to set up a recommendation system with collected user data and clustering method to help improve the IEC system.
This research is significant in three aspects. Firstly, different from many related research involving from a few to dozens of participants, 230 subjects in our experiment provide a considerable dataset that could be used for various statistical evaluations. Secondly, the IEC design system simplifies and describes design process as choices of designs over generations, which is consistent in data form, making it feasible to conduct clustering, visualizing, and recommending. Lastly, applying data analysis and recommendation system to IEC design systems is a field without much existing research. The method and criterion introduced in our research could be inspiring for the following research.
Related work
Design experiments and data analysis
Many researches try to explore the manual design process with experiments and data analysis. To simplify the complexity of real-world situations and control the experiment conditions (Collins et al., Reference Collins, Joseph and Bielaczyc2004), the setting of the experimental environment (including design assignment, experimental procedure, design method, etc.) is crucial since they should be compatible with research focus and analysis method. With experiment data collected, the data analysis usually involves description, visualization, and statistical testing methods to explore the observed activity and test hypotheses. Researches in recent years also adopt various methods including machine learning methods like clustering and regression.
Dorta et al. (Reference Dorta, Marchand and Pierini2018) established a design experiment with an immersive retrospection environment to help subjects describe design process in verbal report. Based on process experience data collected from the experiment, they described design process of individuals and visualized the distribution of different experience states. Their method of marking different experience state could serve as a good example of how could manual design process be recorded and represented. Han et al. (Reference Han, Shi, Chen and Childs2018) carried out a design experiment involving 20 participants to produce ideas for a design challenge with and without the Retriever, which is a computational tool developed by the authors to assist idea generation. Their experiment recorded and evaluated the performance of participants based on four matrices. Hypothesis testing and Bayes testing were conducted between two groups based on matrices values. Their research is a typical example of control variable experiments and statistical testing being used in design experiment. Kan and Gero (Reference Kan and Gero2018) researched into the innovative process in design space. In their experiment, information entropy based on protocol analysis and linkograph was calculated to describe and analyze design process.
IEC and IGA
Based on the understanding of design activities, many computational methods have been developed to help find the human design mechanism (Mitchell, Reference Mitchell1990). Intelligent systems have been applied in solving complex design process which was previously conducted by human, such as the methods of IEC including interactive genetic algorithm (IGA), genetic programming, and so on. IEC and IGA are widely used in design research with hundreds of related works well summarized in two papers focusing on the research progress of 1990s and 2010s (Takagi, Reference Takagi2001; Pei and Takagi, Reference Pei and Takagi2018).
Gero et al. (Reference Gero, Louis and Kundu1994) found that GA formalism provides a computational construct to carry out evolutionary learning of novel grammars for design improvement. Takagi (Reference Takagi2001) presented a general view of IEC in researches through a survey of 250 papers on IEC. Cheng and Kosorukoff (Reference Cheng and Kosorukoff2004) compared the performance of the IGA and human-based GA (HBGA) when searching for a fixed goal, and the HBGA proved to be more efficient with such problems. Mok et al. (Reference Mok, Xu, Wang, Fan, Kwok and Xin2013) used a customized fashion design system for non-professional users to create their preferred fashion designs. An IGA-based model was employed to present sketches for customers via the user-friendly interface, and the system was effective in generating fashion sketches reflecting the user's preferences. Dou et al. (Reference Dou, Zong and Li2016) developed a multi-stage IGA design system to collaboratively customize the product. Their system was applied to a car console conceptual design problem, showing good user-fatigue improvement. It was argued that many design problems can be considered as “imprecise optimization” and “solved” with IGA, so that IGA can be used for applications between AI, optimization, and CAD. García-Hernández et al. (Reference García-Hernández, Pierreval, Salas-Morera and Arauzo-Azofra2013) used the IGA to solve problems that could be subjective, unknown at the beginning or changed during the process, which differed from a classic optimization problem. The research showed that the proposed IGA is capable of capturing the user's preferences. Mata et al. developed an IGA system combined with affordance evaluation and tested the system on a steering wheel design task. Their ABIGA system and experiment revealed that specific affordance could be targeted with changes in design. Using data to improve IEC system is also discussed and conducted in some researches. Pei and Takagi (Reference Pei and Takagi2018) listed many works that try to train human model and accelerate the search of IEC in their review article. One of the works mentioned in this article is using fuzzy systems and machine learning systems to reduce human fatigue (Kamalian et al., Reference Kamalian, Yeh, Zhang, Agogino and Takagi2006). In this research, fuzzy system was used to predict IEC user evaluation, which helps IEC system reach a better solution faster.
Recommendation system
Recommendation systems are software tools and techniques providing a predicted rating of user and suggestions of possible interest (Ricci et al., Reference Ricci, Rokach and Shapira2011). Recommendation systems have been applied to almost every online platform, for example, Twitter (Gupta et al., Reference Gupta, Goel, Lin, Sharma, Wang and Zadeh2013), to help provide the best content to users. With wide usage and a huge amount of research effort on recommendation system, the system has developed sophisticatedly and numerous types have emerged.
Recommendation system has been widely used in the recommendation of movies, music, news, books, search engine, products, and many other fields in general. It is also a practice-oriented research field. The performance of recommendation systems has already become one of the core competitiveness of online platforms. Davidson et al. (Reference Davidson, Liebald, Liu, Nandy, Van Vleet, Gargi and Sampath2010) introduced the video recommendation system used on YouTube, explaining the major challenges of video recommendation and their strategy to handle them. Hicken et al. (Reference Hicken, Holm, Clune and Campbell2005) introduced a music recommendation system which processes audio signals of music to generate content feature.
Some research also tries to apply recommendation system in IEC systems. Kim et al. (Reference Kim, Lee and Ahn2010) combined recommendation system and IEC on a fictive objective with an automatic test-agent. Their research demonstrated the possibility of the combined system and the feasibility of using clustering to process recommendation items. Geyer-Schulz et al. (Reference Geyer-Schulz, Hahsler, Jahn, Wolfgang, Otto and Martin2000) introduced their recommendation system framework which is based on observed consumer behavior and IEC. Wang and Hong (Reference Wang, Hong and Lin2019) combined IEC system with recommender system and tested their system on movie reviewers.
There is also some research not using recommendation system as the keyword but pursue a similar objective. Sung et al. (Reference Sung, Su, Kim, Chaudhuri and Guibas2017) developed a component suggestion system to complement the 3D model with reasonable parts. Training multiple neural networks on a 3D model database and making prediction based on the probability distribution, the system performs well on complementing model with multiple reasonable parts. Jaiswal et al. (Reference Jaiswal, Huang and Rai2016) developed an intuitive 3D modeling interface to support design activities. Their algorithm helps user browsing in the database and find the most compatible component with model. Lupinetti et al. (Reference Lupinetti, Giannini, Monti and Pernot2018) developed a multi-criteria retrieval system of CAD assembly models. By extracting features from the complicated CAD model and solving the matching problem, the system could retrieve similar models in the database. Their work could be used as an interactive tool which helps modeler refer to existing models and perform better in designing.
IEC design experiment
Our work of experiment includes two main parts. The first part is the development of a design support platform with IEC as the main algorithm. The platform simplifies interior design task into selections of generated color combination and helps user find out their ideal design. The second part is conducting design experiment with the IEC system on volunteers and further analysis based on the collected data.
Development of the IEC design system
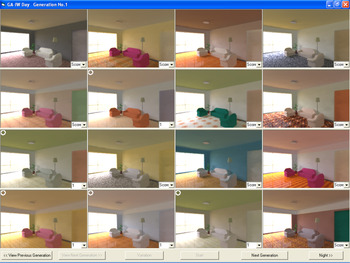
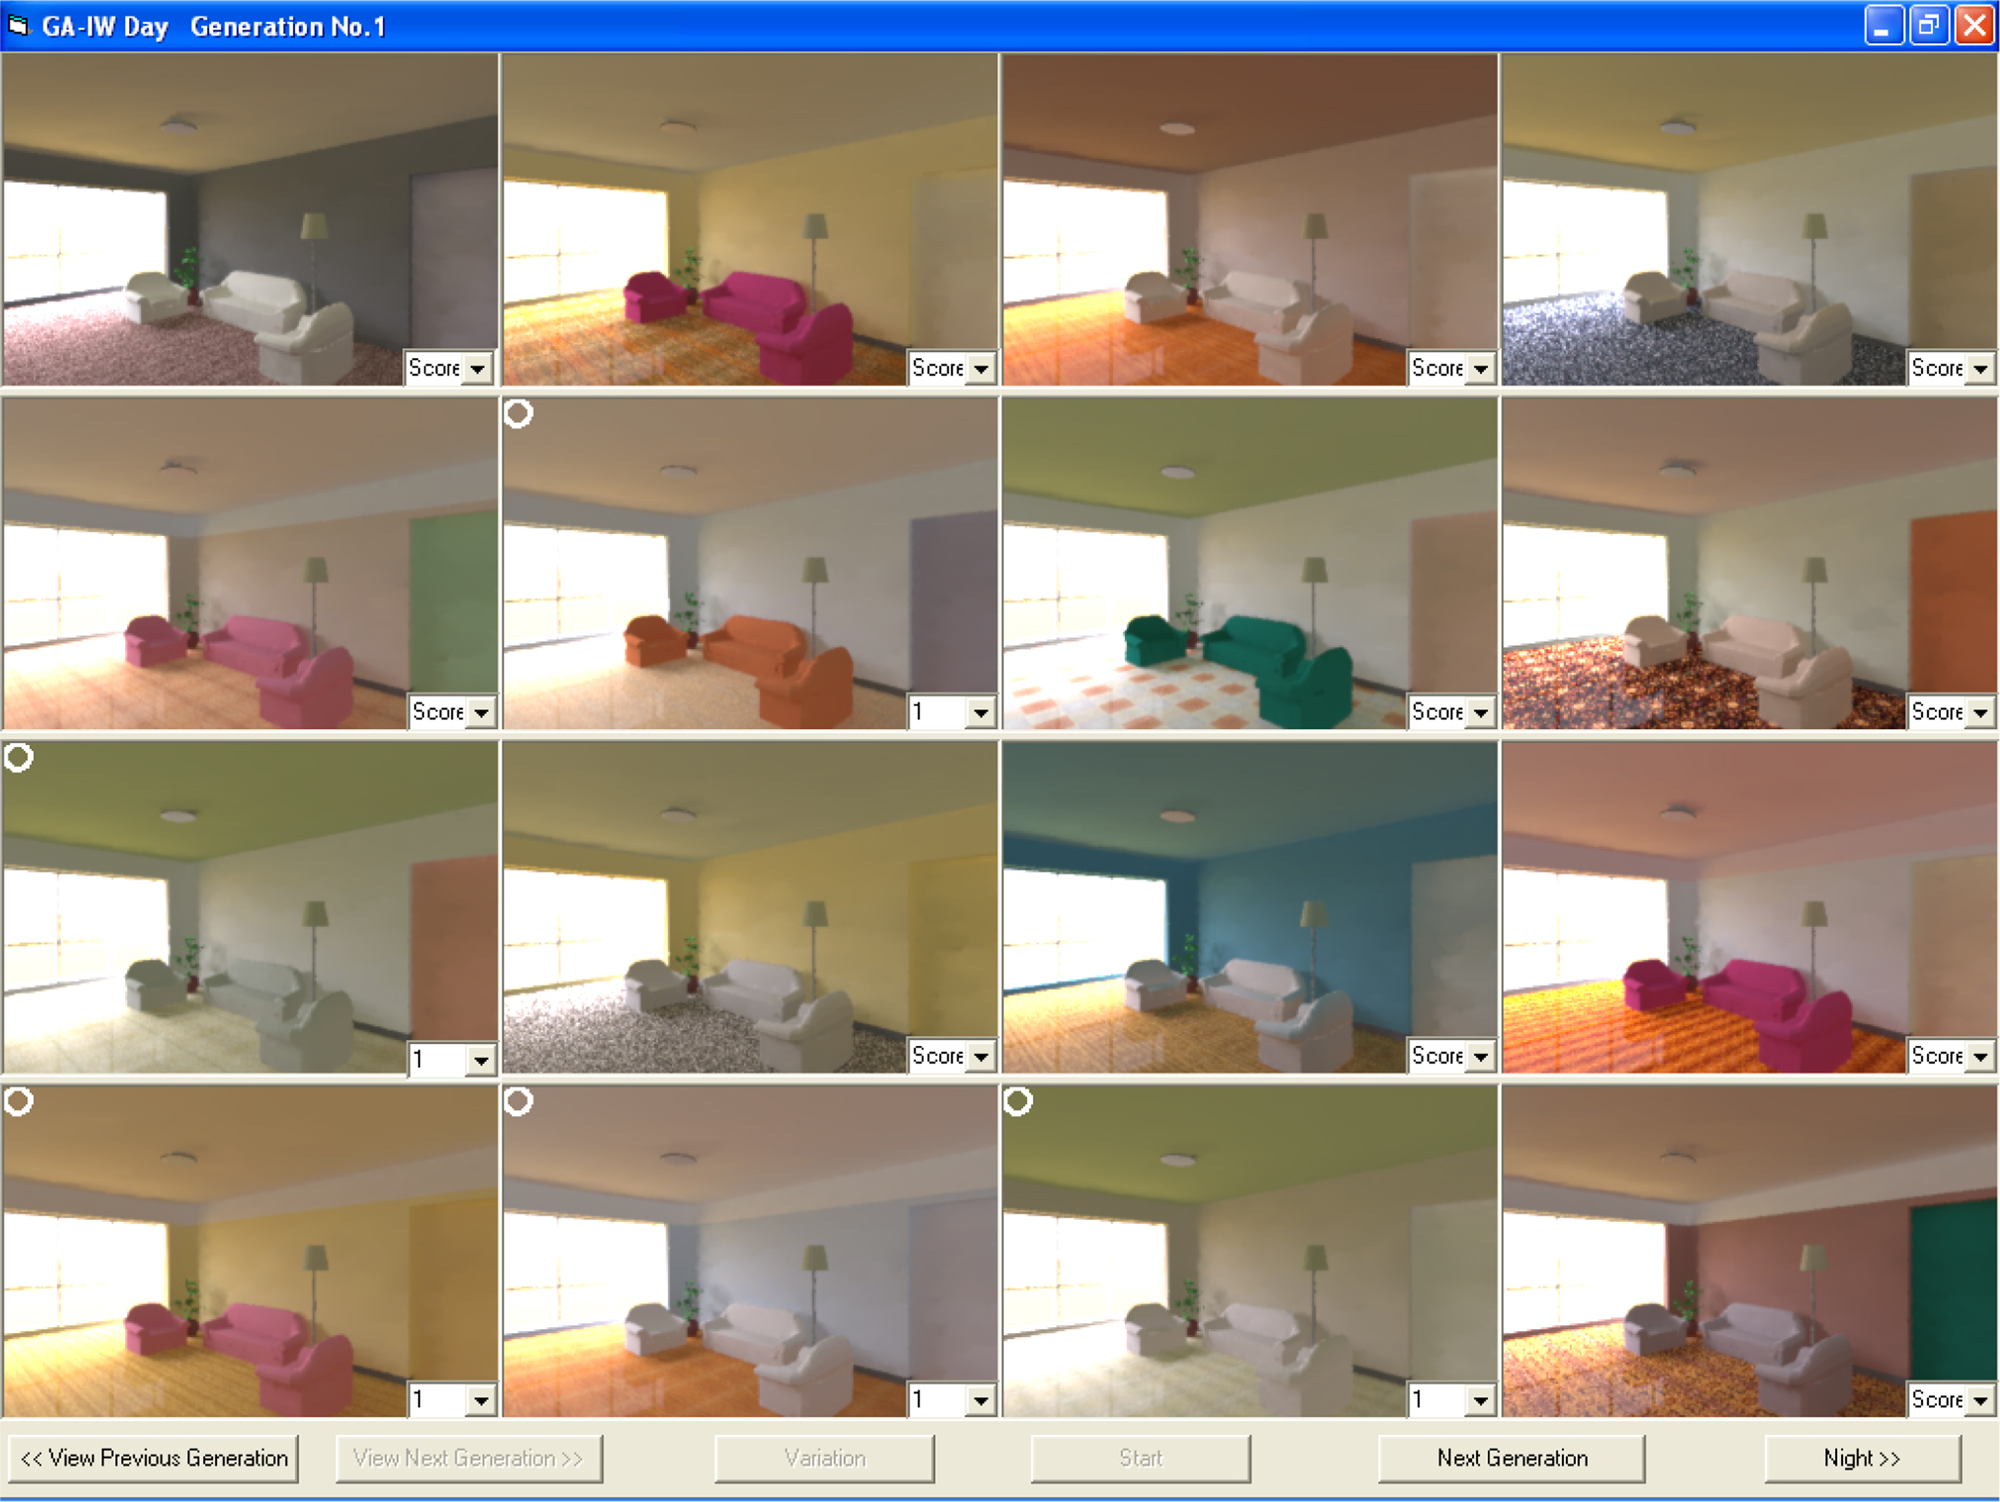
The interior decoration color selection and combination of a living room were the design objectives in this research. With a given interior setting and fixed viewpoint, the design task is way simplified than the actual interior design activity. To further simplify and structuralize this objective, we selected five certain interior elements as the changing factor in the design experiment setting and generate renderings based on the color combinations of interior elements. Figure 1 shows the interface of the system which contains 16 images of rendered pictures. With the interface showing interior renderings, the design outcomes are visually shown to participants, helping them intuitionally evaluate designs and pick out their preferred design.
IEC program interface.
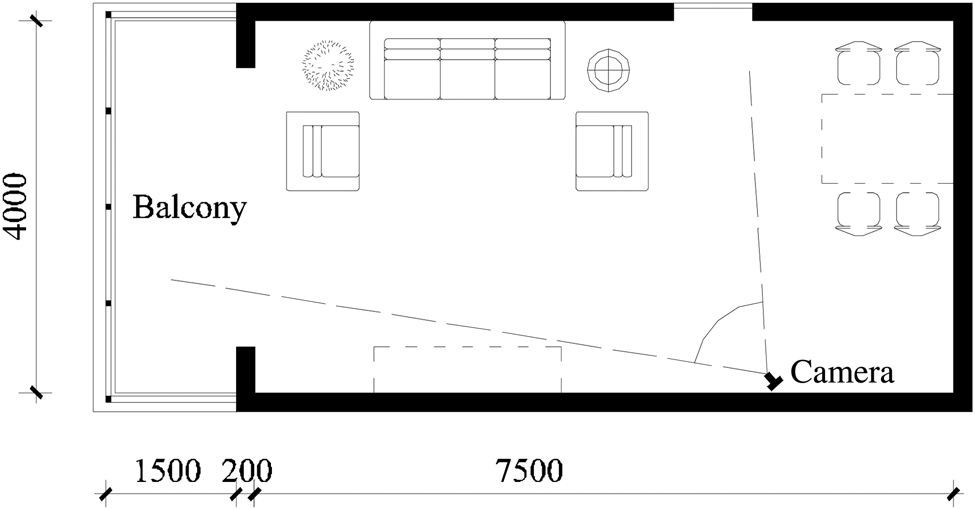
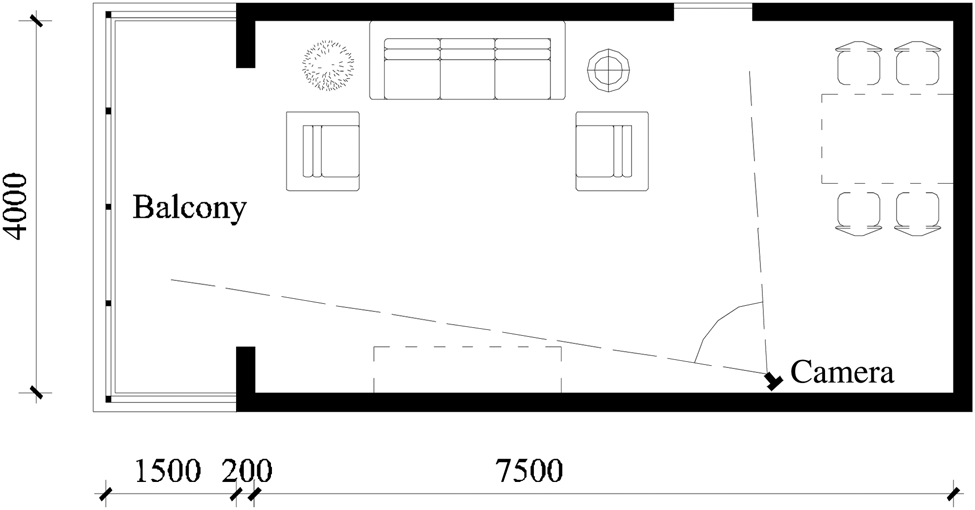
All the rendering generated by computer graphics are all viewed from a same position in a fixed indoor environment shown in Figure 2. To simplify the experimental process, we render all pictures under the same daylight illumination setting. The indoor environment model is built based on living rooms of common Chinese apartments, with a set of sofa, lamp, French window, and a few other elements involved. We try to show a familiar living room environment to our subjects so that their choice of preference could be more based on their actual experience and ideal home imagination. Radiance was used in lighting simulation.
Living room model plan. Interior space height: 2600 mm, camera height: 1550 mm.
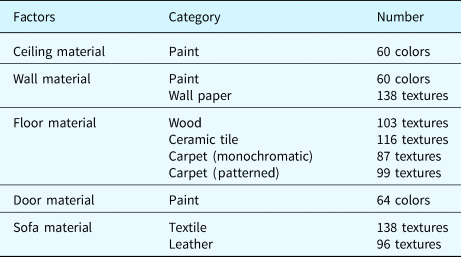
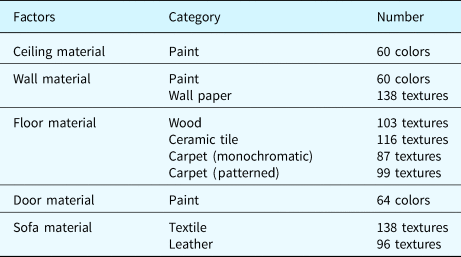
The material of ceiling, wall, floor, door, and sofa were the selected changing factor in the living room environment. The choice is made based on their impact on general visual outcomes. A material library was constructed based on the context of the actual Chinese interior design practice. As shown in Table 1, the material library provides hundreds of material choices for these five elements. After being generated or collected, all the materials are processed with the Bicubic method to obtain its average RGB color values, which are used as coordinates of the material in RGB space.
Material library construction
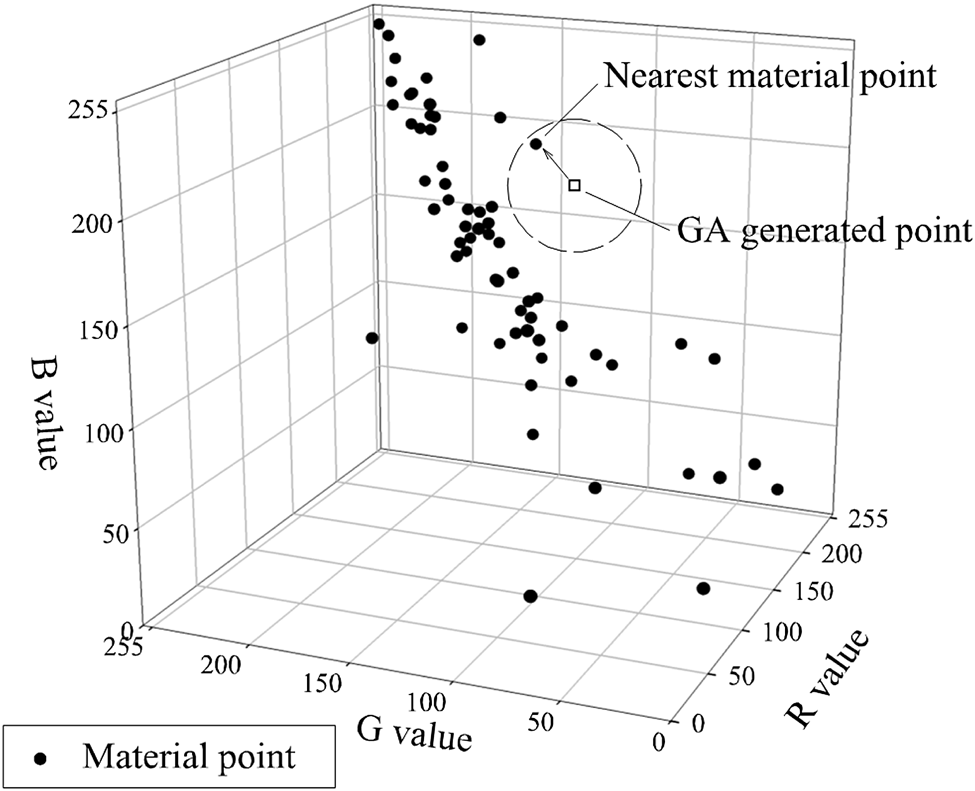
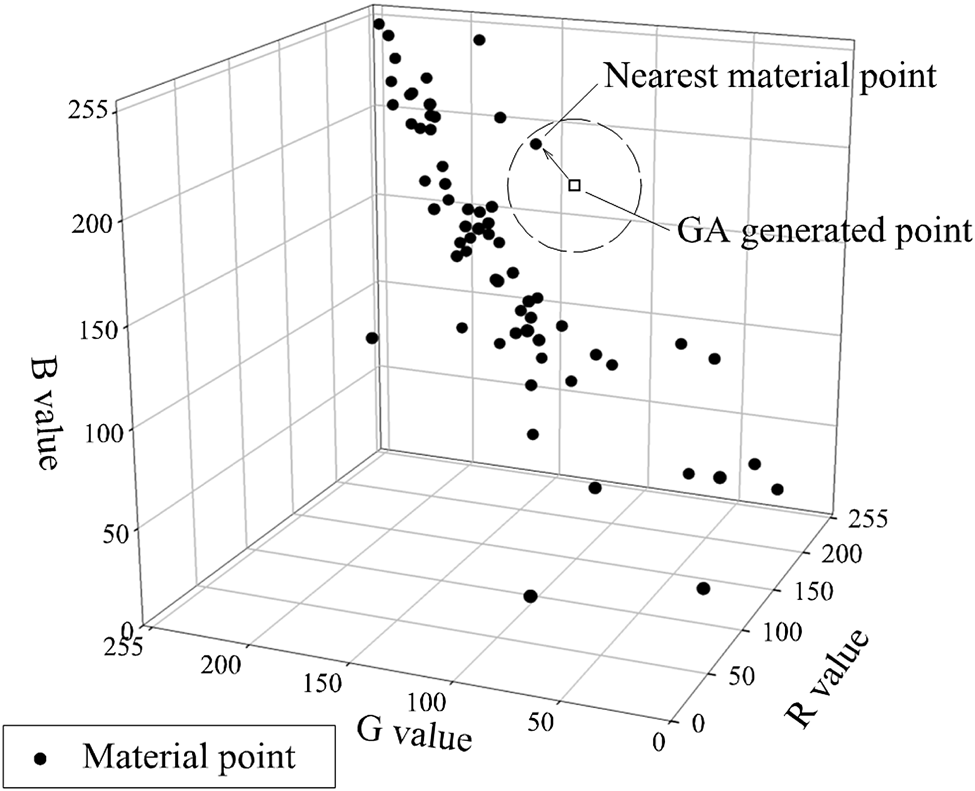
The generation of element color combination is executed in interactive and evolutionary method, adopting GA as the main algorithm. Combined with human evaluation and selection, an IGA system is then established. The chromosome structure used in the GA system included all the RGB values of five elements. With the process of crossover and mutation, new combinations of RGB values are generated on the chromosome as gene fraction. Since the material in our Material Library are discrete points in RGB space and the generated RGB value could be non-corresponding precisely to any existing points, we pick out the nearest (defined by Euclidean Distance) point to replace the gene fraction. This process is shown in Figure 3.
Material samples and gene relocation in RGB space (Huang and Xu Reference Huang and Xu2009).
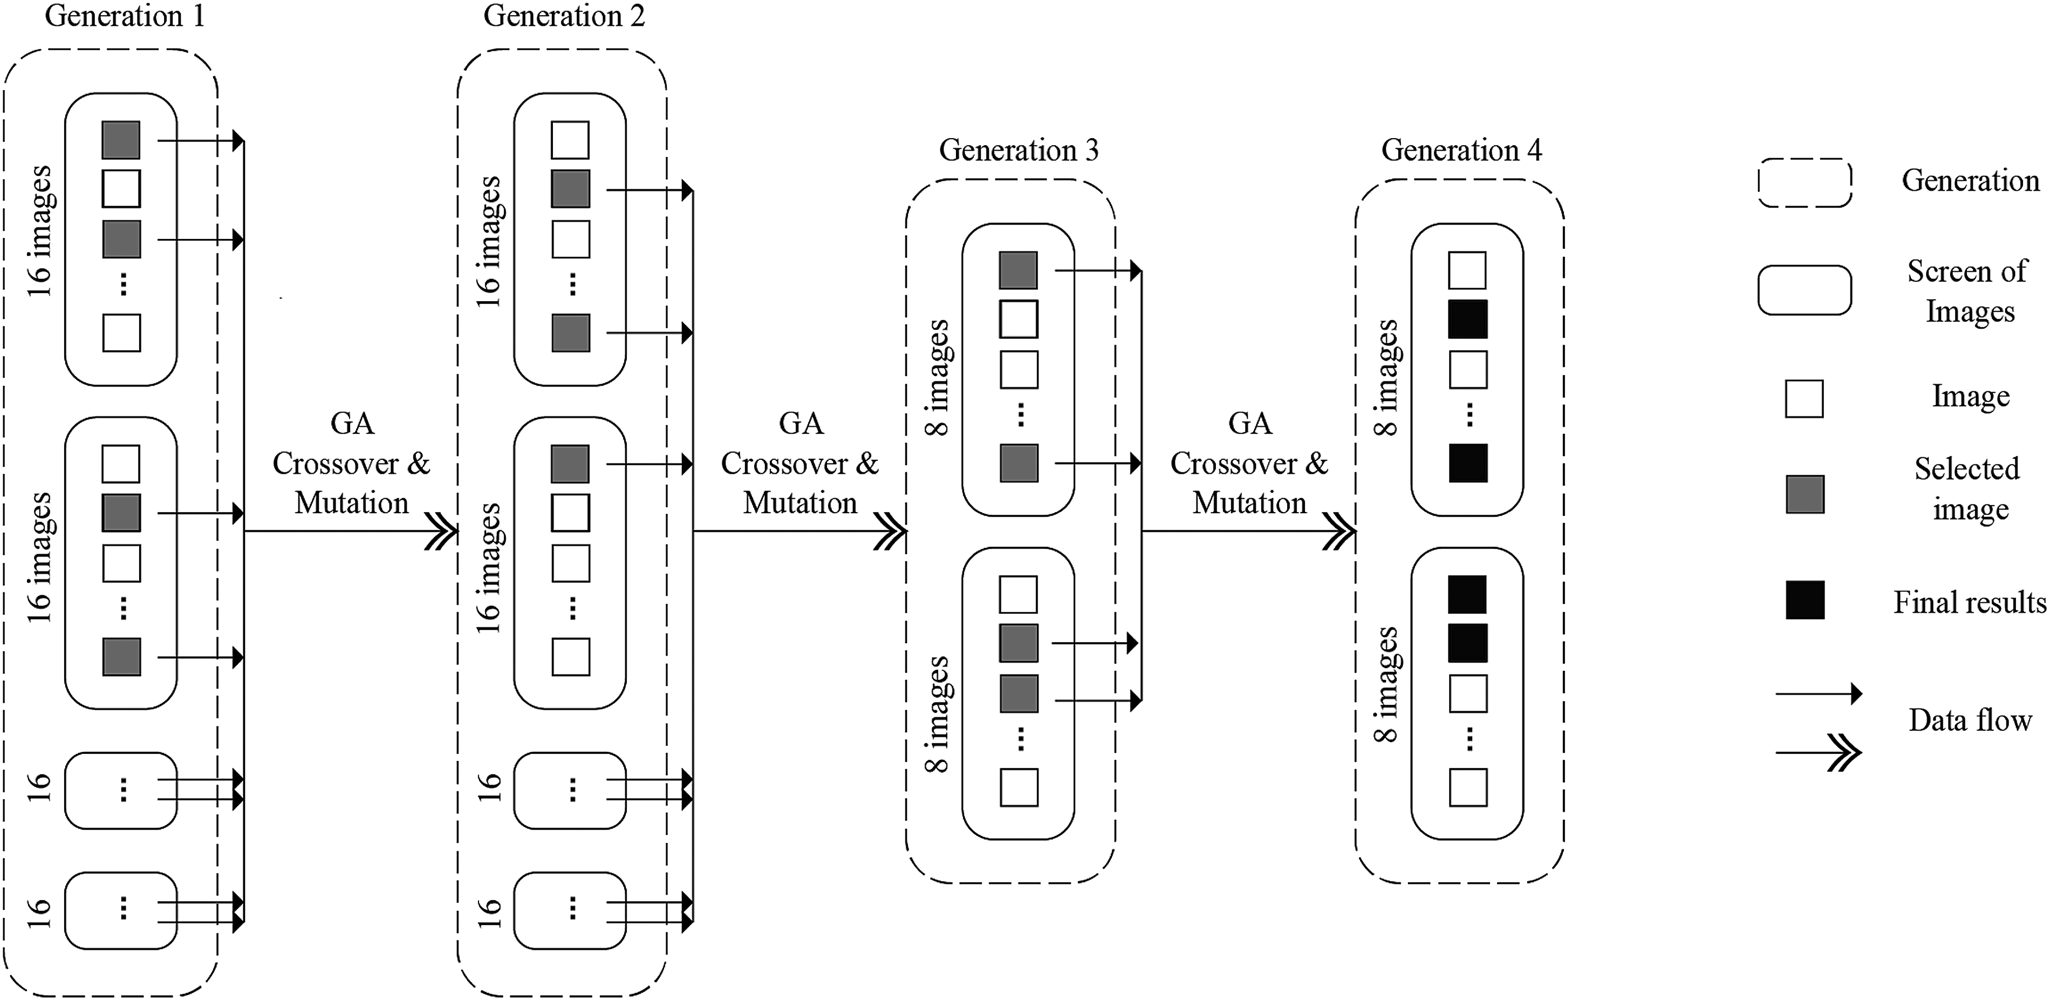
With the design objective and generation algorithm defined, we could then design our experiment process to create an interactive design activity which aims to reveal user preference and design process. The first generation of designs was generated randomly, ensuring every design is independent and identically distributed in solution space, making the starting point similar for all the participants. Since random generation could provide design in any range of solution space, we expanded the number of pictures in the first generation to 64, which is shown on a screen of 16 pictures for four successive steps. In this way, more of the solution space could be explored and participants could be more likely to find their ideal design. With choices of the first generation, the next generation is generated by crossover and mutation as in the usual GA process. Considering our experiment schedule and user-fatigue problem, we set our total number of generations to four, with numbers of pictures shown in each generation set to 64, 64, 16, and 16 (Fig. 4). Users start the design process by clicking “start” button. With randomly generated renderings shown on screen, the user could pick their preferred ones and produce the next generation of design by clicking “next generation” button. The generate and choose loop is repeated then until the finish. The number of pictures shown in each generation and many other parameters of the system were set after adjustment, intending to balance the trade-off between human fatigue and the quality of the results.
IEC system process flow diagram.

With the IEC design system, the complex design process is simplified into choices of preferred combinations of colors. Since GA would only do crossover and random mutation based on the previous selection of design, the designs of the next generation would have a similar distribution with the previous generation. In this way, the preference and intention of users would be the only factor influencing generated designs. The user could then figure out their preference gradually by choosing and push the distribution of designs towards an ideal range of solution space.
The experimental process
Our experiment was carried out in an interior ornamental material shopping mall in Beijing. The mall provides a wide range of materials and services for interior ornament. Since the mall is specifically focused on interior ornaments and is relatively separated from residential neighborhoods, we could then assume that the majority of customers in this mall have a goal or interest in interior design. The volunteers of our IEC interior design experiment were recruited among these customers, ensuring that our subjects are relevant and interested in the design task. Volunteers followed the procedure mentioned above to finish the IEC design experiment. It costs approximately 20–35 min for each volunteer to finish the whole process. After completing the design process employing IGA, volunteers were required to evaluate the results and the process by completing a questionnaire.
Data collected
The experiment lasted for 22 working days with 236 participants involved. In this study, the data from 230 participants were included, in which 94 were male and 137 were female. Most of the volunteers had a high school or college-level education, and their ages ranged from 18 to 74 years. Additionally, only 15 of 230 volunteers had design-related experience, ensuring that most of our participants are amateur in design.
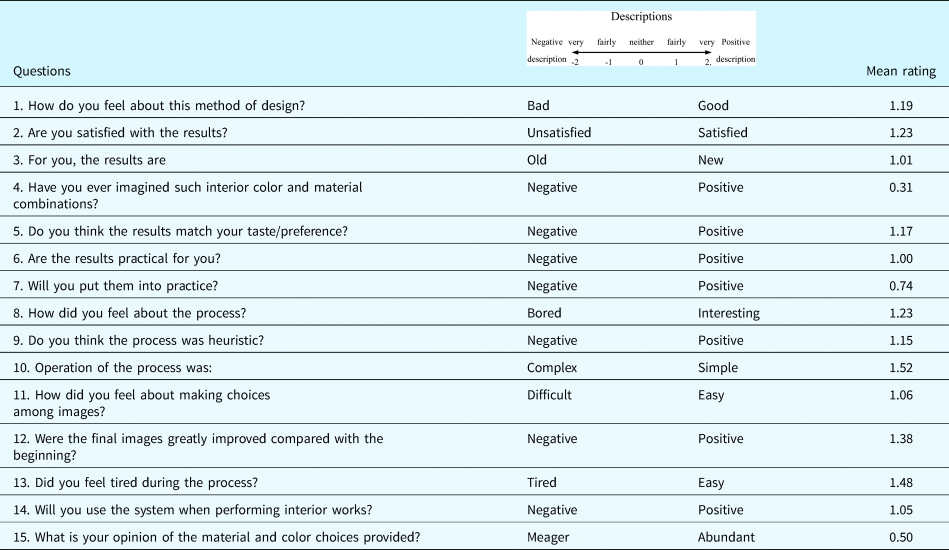
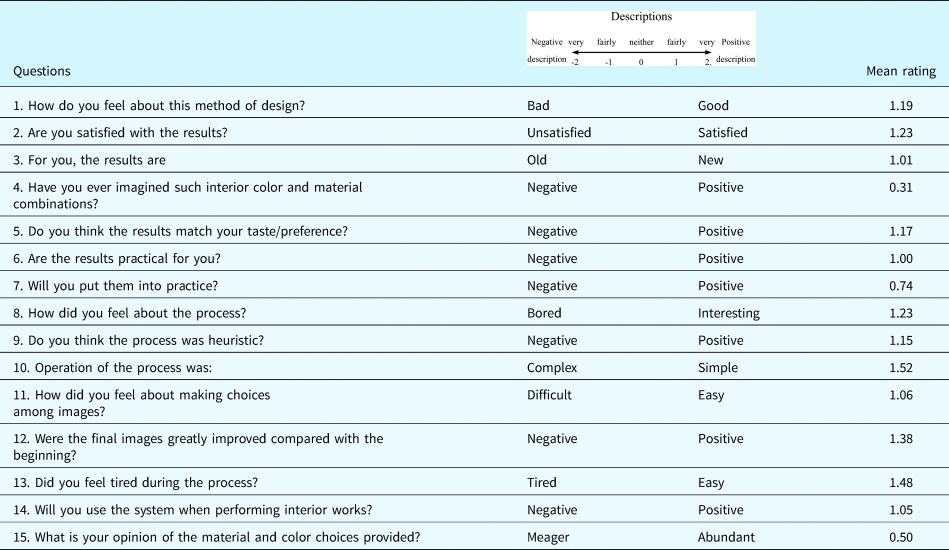
A total of 33,670 images were generated by the IEC system during the experiment, in which 8637 images were selected by 230 participants during the four rounds of IEC evaluation. The following analysis and visualization are based on these data. Additionally, volunteers finished the questionnaire which included 15 questions about their attitude towards the experience and outcome of the IEC interior design system. Their ratings are based on a 5-degree semantic scale between negative and positive descriptions. The degrees are described as “very negative”, “fairly negative”, “neither”, “fairly positive”, “very positive” and assigned to numerical values from −2 to 2 (with −2 as “very negative” and 2 as “very positive”). The questions and mean ratings are shown in Table 2. The ratings show that the volunteers had a generally positive attitude towards the IEC design system and feel good about the design process.
Questions and mean rating
Category and process of design in IEC design experiment
To dig into the design process recorded in our experiment, the CIELab values of color combination need to be evaluated to characterize and visualize design features, since the direct relationship between color value and the impact on the viewer could be ambiguous and indirect. The method of clustering and the holistic color interval is used to process the color values of each design.
Clustering images with holistic color interval
Just as the popular photo editing app Prisma takes the correlation between different attributes (convolution with different kernels) of a picture as its style (Gatys et al., Reference Gatys, Ecker and Bethge2016), we could use the relationships between fives factors of generated designs to characterize certain feature in interior design. Chuang and Ou (Reference Chuang and Ou2001) employed the holistic color interval method for exploring the problem of color harmony, showing the holistic color interval is related with sense brought by color combination. Here the holistic color interval is defined as Euclidean distance between two colors in CIELab color space. The calculation is shown as follows:
 \hskip5.1pc∆ E_{ab}^{*}=[(&∆L^* )^2 + (∆a^* )^2+(∆b^* )^2] ^{1/2} \hskip3pc (1)
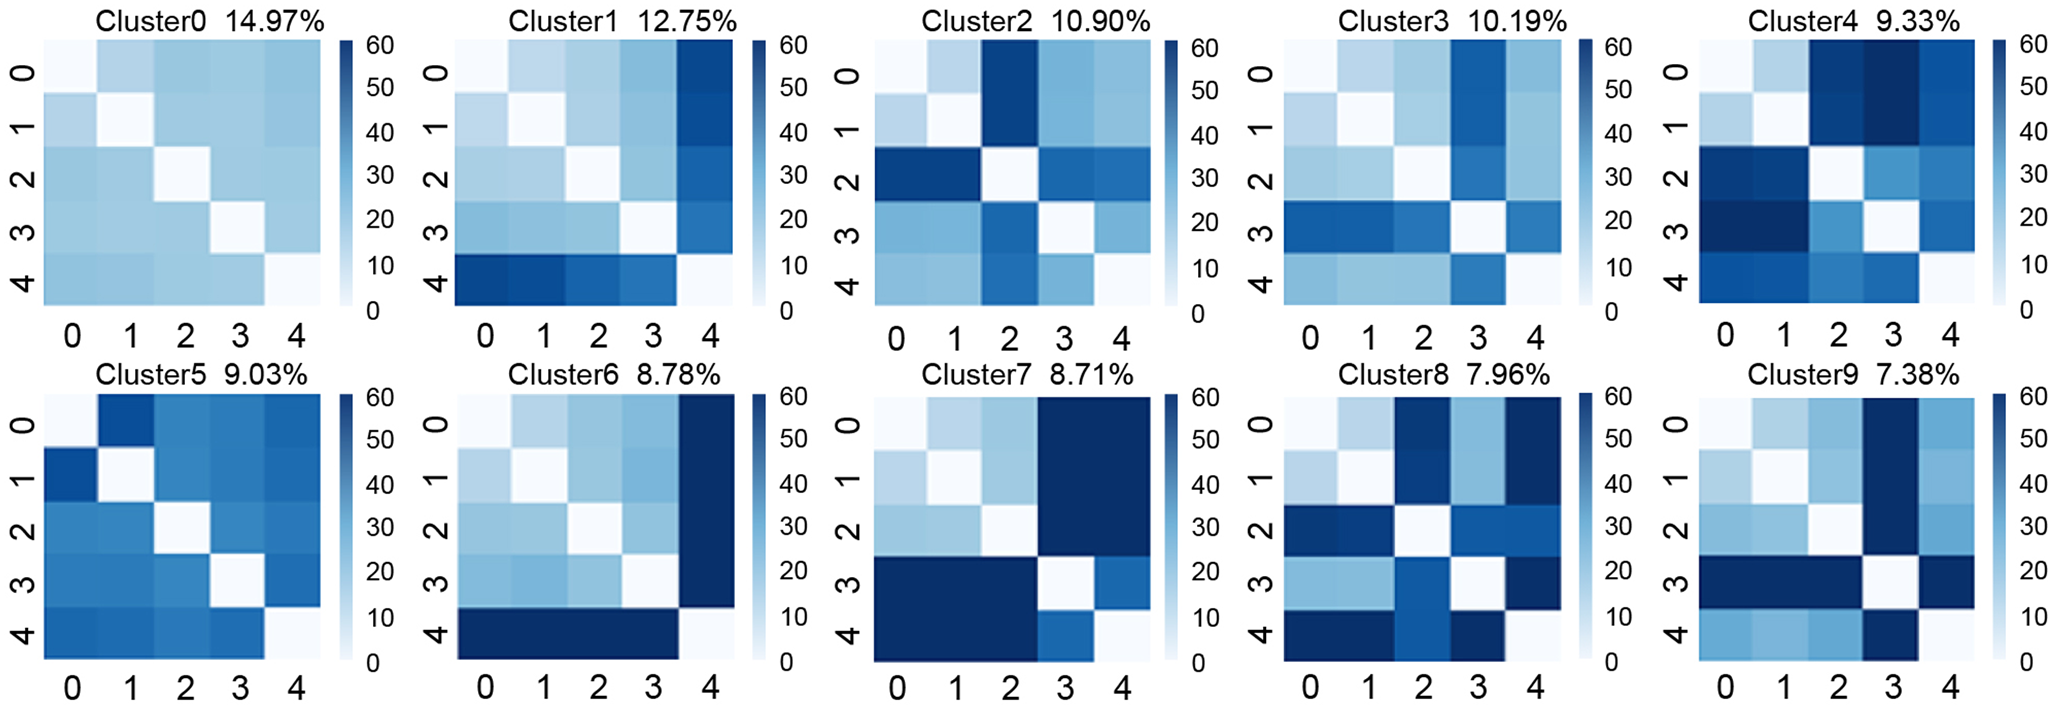
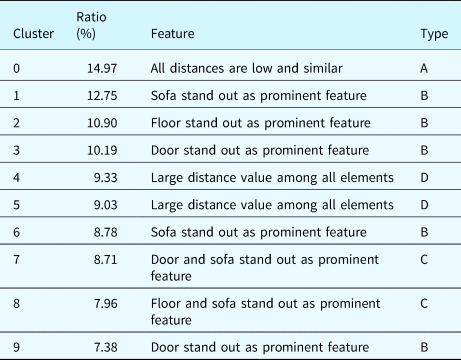
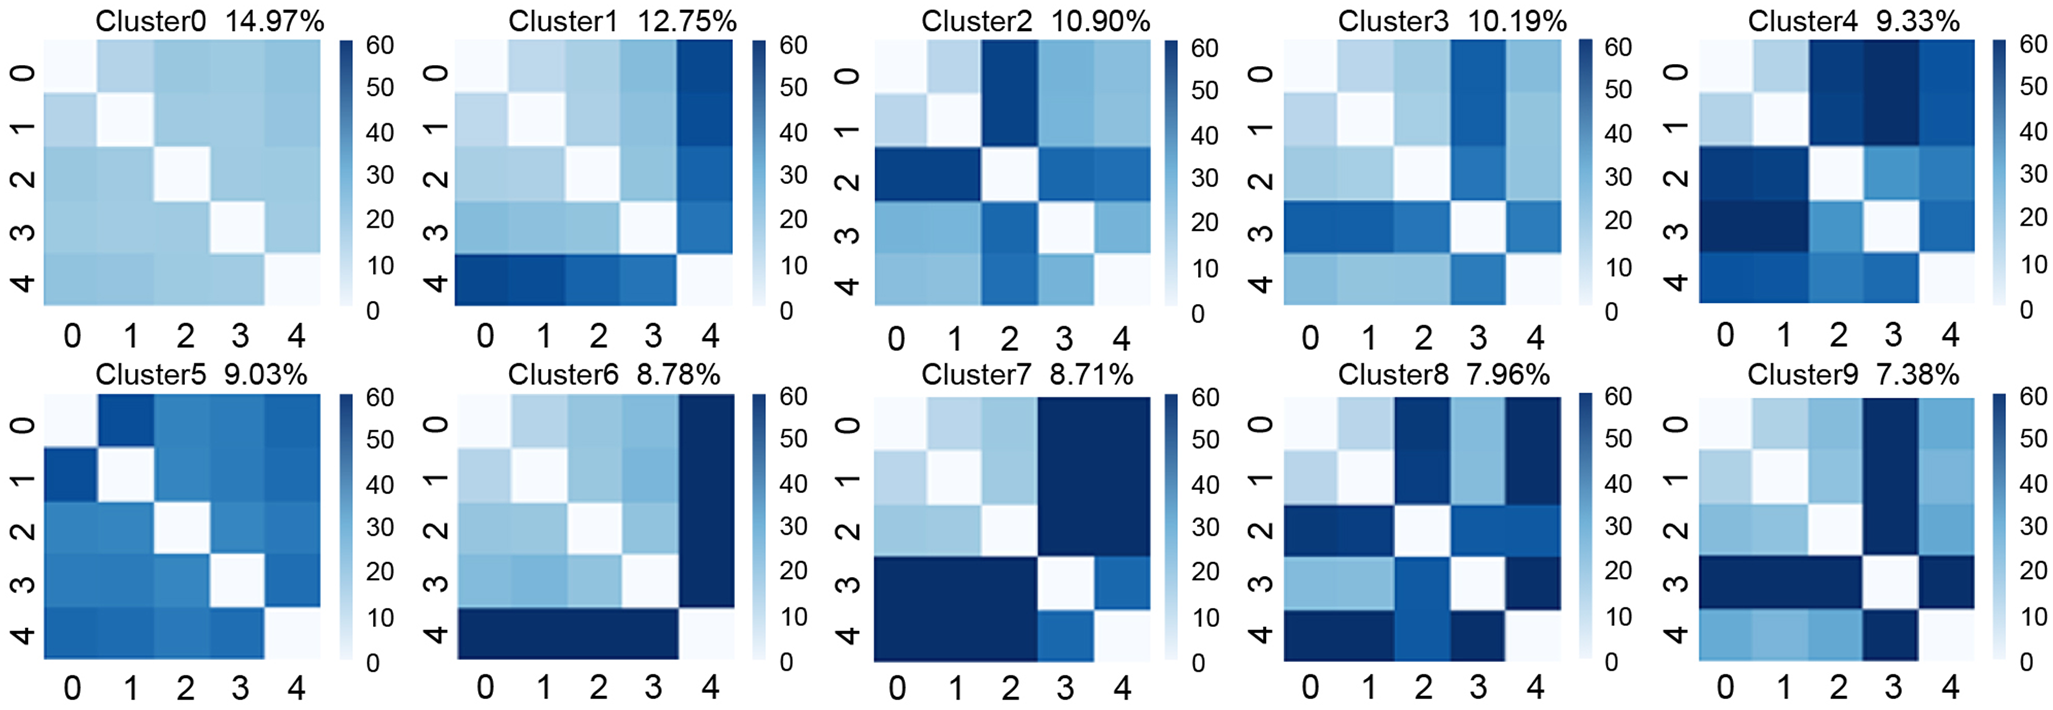
Using this method, the inner relationship of color combination in our design experiment could be transformed into all  $10( = C_5^2 )$ color distance values. The original RGB color values are re-calculated into CIELab color values not only because of related researches but also for being tested with better performance in the following analysis. With the holistic color interval as a representation of images, we could carry out clustering to find out possible categories of designs in all selected pictures. K-means clustering was used since the distance is more important than adjacency in our problem. The number of clusters is tested to be set to 10. Figure 5 shows the average holistic distance of every cluster of selected images. As shown in Table 3, it is easy to discover several significant categories of design after clustering. The table lists out features and categories of all 10 clusters. There are four categories of design observed.
Design solution clustering outcome visualization using holistic color interval.
Feature and type of clusters of designs
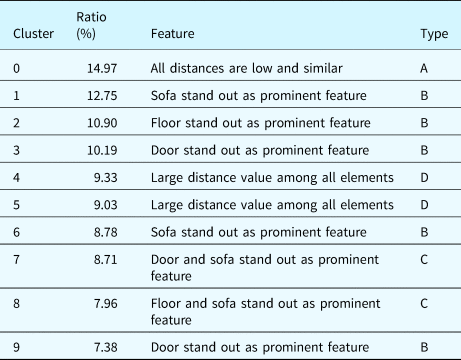
Category A contains only Cluster 0, which represent the category of images that tend to take on similar colors among all five elements. With minimal holistic color interval between elements, designs of this category look soft and average. The generation of this category reflects the design preference of achieving harmony and balance.
Category B contains Cluster 1, 2, 3, 6, 9 and is also the biggest category in forms of both number of clusters and number of images. These clusters represent designs where one particular element is obviously distant from others and becomes the prominent “figure” against the other four factors. Only three elements are observed to outstand in these clusters, which are floor, door, and sofa. Among them, the sofa is the most frequent element to pop out in images, which accounts for over 20% of all selected images. In total, category B images account for 50% of all selected images, showing that the tendency that makes only one interior element “pop out” is very common among participants.
Category C contains Cluster 7 and 8, representing images in which two of the total five factors are diverse and the other three are similar. This category is similar to Category B but with more diversity in elements. This category also shows the tendency that keeps only certain element outstanding but may seem discord if poorly arranged.
Category D contains Cluster 4 and 5, representing images in which most of the five elements are diverse and holistic distance values are almost all high. Images of this category may look very colorful and diverse. Category D images account for 18.36% of total selected images, showing that the preference for high color diversity is also common among participants.
With the clear categories of design shown by clustering, we could find out that selections in the IEC design experiment show strong interpretable patterns. We could observe that many participants of our experiment tend to prefer designs with typical features. Additionally, it is worth noting that one volunteer may select more than one category of design. So different tendencies or preferences may be observed on one participant. Also, from all the types and clusters listed above, we could find out that the role of some elements, especially the sofa, is more unique than other elements in this design task since it is observed “popping out” way more frequent than other elements (in 38.2% of all images while the percentage for floor and door is 18.86 and 26.28, respectively).
Changes of holistic distances over generations
The changes of the holistic color intervals over generations can also be used to evaluate and visualize the design process in this interactive setting. With four generations of images and selections, we could observe changes of both color values and holistic color intervals over generations. Naturally, the effect of selection done by participants can be observed in the shift of color values since the IEC system is greatly based on GA which makes selections and next generation highly correlated. To filter away much of the natural tendency of color value shifting and reveal more of the design process, we could visualize holistic color intervals instead of original color values in various ways.
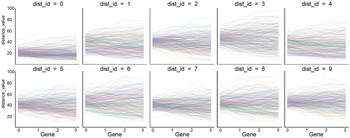
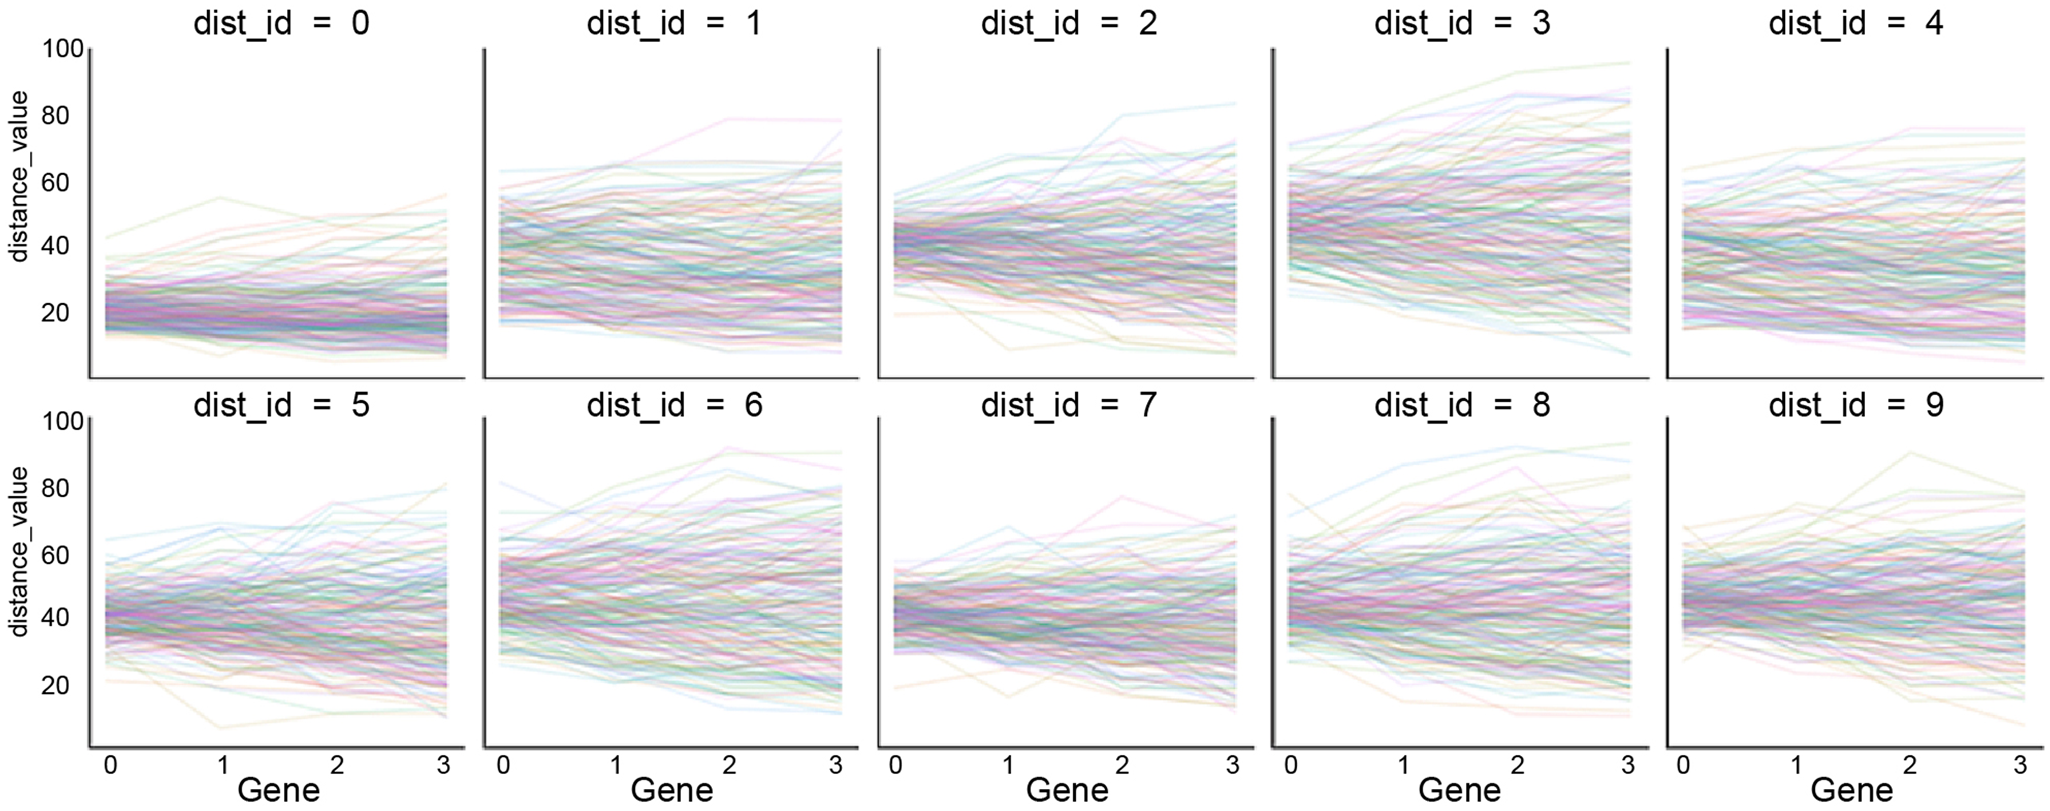
Figure 6 shows the changes in all 10 average holistic color intervals of users throughout four generations of selection. Each line represents the mean value of a certain holistic color interval of one individual. Since the first generation of images is generated randomly, there are no notable differences in the holistic color interval between people in the first generation. However, the span of lines expands greatly and steadily, showing that different people evolve towards different directions as generation goes, resulting in great diversity among people in the final generation. This implies that the IGA system gradually establishes personal preferences from relatively similar starting points through evolution and interaction. The figure shows that the IEC system works as intended in general, evolving in a steady direction to the final generation, which is our presumed ultimate user preference of styles. The design process is shown to be straightforward here with certain objectives to approach steadily.
Visualization of 10 holistic color interval changing among generations.
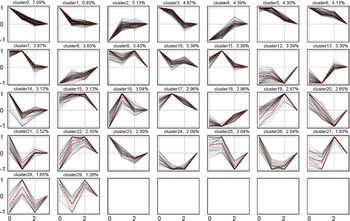
Although we could observe some general tendencies in Figure 6, the figure could not provide a detailed picture of all the changes. Also, even though we could see a similar pattern of change over generations, we still can observe the difference in elements if we process and visualize the data individually for all 10 holistic color intervals. To further inspect the changes, we need to calculate the sequential changes directly. We assume that the images chosen in the fourth generation approach the goal of participants most. Based on this assumption, we could calculate the difference of the holistic color interval of individuals between one generation and the later one. We define these sequential values as successive distances (SD) which is calculated by subtracting the holistic color interval of generation 2, 3, 4, 4 with generation 1, 2, 3, 4 and then normalize the outcome to range between −1 and 1. The SD value of the last generation is also calculated but would be always 0. Here, no absolute value or square value is used because this measurement is asymmetric. With SD calculated on all 10 holistic distances of individuals, we applied 30 cluster K-means clustering on these SD values, which are four-dimensional numerical values ending with 0. Figure 7 shows the values and means of different clusters. Every subplot in Figure 7 shows one cluster of SD values in gray lines and their mean values in red dash lines. The horizontal axis represents generation 1 to 4, while the vertical axis represents the normalized SD values ranging from −1 to 1. It is natural to see all lines end on the horizontal axis because the last value of SD is always 0.
Visualization of successive distance clustering outcome with cluster average shown.

As shown in Figure 7, the SD values of individual holistic colors fall in similar clusters which shows gradual and steady approaching to the final value. Any line that stays at one side of the horizontal axis represents a monotonically changing holistic color interval since the values represent changes between one generation and the next one. With 20 out of all 30 clusters shows generally monotonically changing SD values, we could then describe the design process as steady and monotonical in general. But there are still clusters, mostly smaller ones, showing oscillation. These clusters are possible signs of “changing idea” on some elements happening throughout the interactive design process.
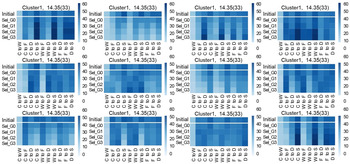
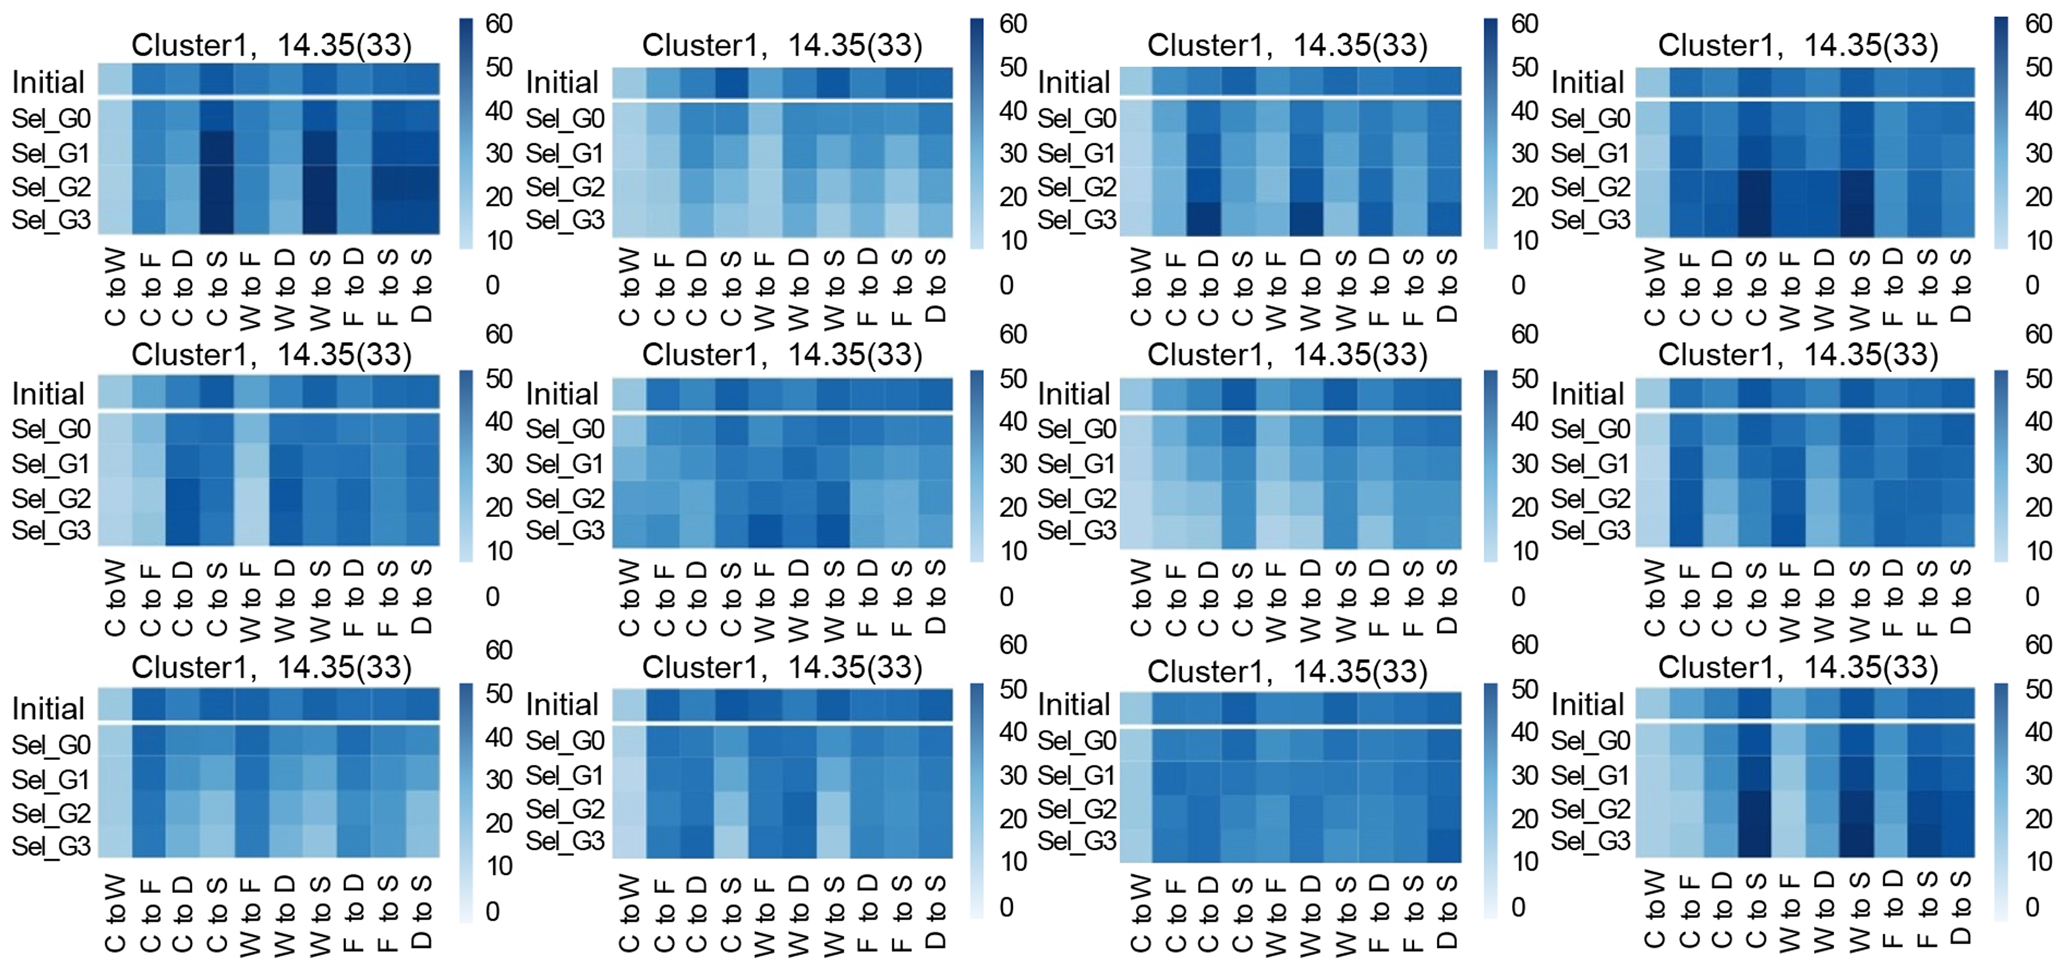
If we want to have an overall view of the individual design process, we could then calculate the average holistic color interval of four generation selections for every individual, and apply K-means clustering on all 40 holistic color interval values to find out common types of design processes. Figure 8 shows the average holistic color intervals of clusters. Every cluster represents a certain number of individuals (with percentage and number of individuals shown on top of the plot). Every plot shows 50 values in color, with 10 columns representing 10 holistic color intervals between elements labeled at the bottom (i.e. C to W means ceiling to wall). The five rows represent initially generated designs and selected designs in four generations. Among these clusters, many sticks out with certain types of design gradually become dominant over generations. For example, clusters 0, 6, and 11 show the gradual process of the sofa being outstanding from other elements; while cluster 2 shows door popping out, and clusters 7 and 8 show floor outstands gradually. These clusters all show a similar design process of gradually forming typical designs discussed in Figure 5 and Table 3.
Visualization of individual holistic color interval clustering outcome with cluster average shown.
From all the figures and analysis above, we could find out that despite the diverse goals of evolution in the final generation and partial oscillation observed in SD, the evolving processes remain similar. Almost for all participants, the deviation of total holistic color distances from corresponding goals of the same individual would decrease monotonically as the system evolves. Different people differ only in the time when a significant decrease takes place. It is beyond our expectation that almost all participants were generally approaching their final design goals step by step steadily in a consistent direction. A possible explanation for the absence of expected overall uncertainties in design process is that the massive generation of design alternatives enables quick comparison and judgment among designs and lessens the need for exploring new possibilities.
Trial of applying recommendation system to IEC
Though successfully applied to numerous fields and proved to be efficient in our experiment, there are still challenges that IEC design systems are generally facing. Firstly, as IEC system relies on human evaluation for numerous loops, user fatigue could be a daunting challenge to keep the system working efficiently and effectively. Even a moderately sized IEC design problem may require hundreds or even thousands of user evaluations, which is improper or even impossible (Llorà et al., Reference Llorà, Sastry, Goldberg, Gupta and Lakshmi2005). For our design experiment, which is designed to reduce user workload, the average number of images shown to users is around 160, meaning 160 passive evaluations are required. With long-time repetitive interaction on similar design tasks, users could become impatient and evaluate arbitrarily, decreasing the quality of design outcome. Also, long-time consumption would also lead to the low efficiency of experiment, making IEC design systems harder to be popularized.
Secondly, the common IEC algorithm could lead to a limited diversity of design. Algorithms like GA may mutate randomly each generation but never strong enough to offer reasonable and also diverse designs since there is always a trade-off between being reasonable and being diverse in random algorithms. In this case, users of IEC systems could fall in a range of satisfactory design solution space and fail to explore the entire solution space to find possible better solutions or yield multiple diverse good solutions. The situation is even more obvious when the user is an amateur or even fresh hand designer since he or she does not have enough experience to fully realize their preference and to actively lead to their ideal solution.
Thirdly, primitive IEC systems could not improve the quality of the generated solutions using previously collected data, which contains the knowledge of design objective and also well-fixed design solutions. Making full use of previous user data could help the system become smarter and more efficient to use.
To solve these problems, a popular and well-discussed tool we could use is recommendation system. In our research, we try to apply recommendation systems to our experiment dataset to test whether it could help improve IEC system. Since this part of work is based on collected data, the objective here is to show the feasibility. Further experiments are needed to test the actual performance on human users.
Common recommendation system algorithm introduction
With much work shown in the field of recommendation system, many types of recommendation system have emerged. Among them, the most widely used ones are classified into three main categories: collaborative filtering, content-based filtering, and hybrid recommendation approaches (Adomavicius and Tuzhilin, Reference Adomavicius and Tuzhilin2005).
Collaborative filtering is a method based on a large amount of user data collected. With ample information about user behavior and preference, the similarity between users could be figured out, then recommendation could be made based on similar users' behavior. In short, collaborative filtering recommends similar users' likes. The advantage of collaborative filtering is that it does not require an understanding of items being recommended. However, this algorithm requires a large amount of user data collected and also requires items to be in a limited number. In this case, it may not be suitable for our design objective, where images of designs are almost all unique.
Content-based filtering algorithm is also widely used. It is based on the description of items and a formed profile of users' preference. With the description of items, features could be subtracted and used as a representation of items. Field knowledge or common sense could also be used in this process. With a profile of the user, which is calculated by observing user behavior, we could match the user with items that are most likely to be liked. Since the design data in our experiment must be processed for recommendation and user profile could be generated based on user selection of initial generation, content-based filtering is ideal for our needs.
Another type of recommendation system is hybrid recommendation system, which refers to a combination of above two approaches and other techniques like knowledge-based approaches. Hybrid approach could improve system performance by avoiding drawbacks of a certain single approach, but requires more data, knowledge, and workload to develop. To sum up, content-based filtering would be suitable to be applied to our system and the key challenge of implementing it is to form a description of designs and to generate a user preference profile.
Description of design: with K-means clustering
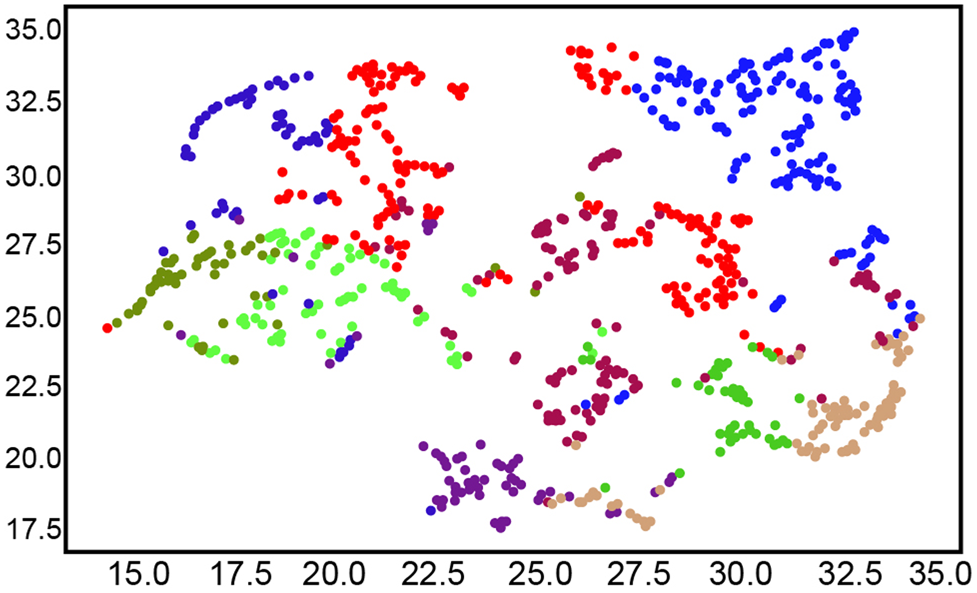
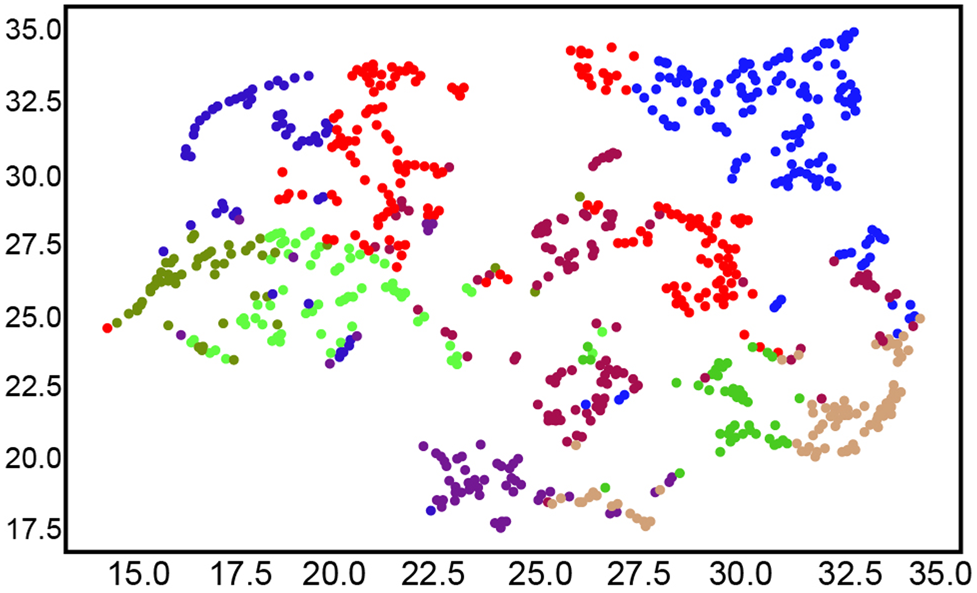
With several clustering trials introduced above, we found out that clustering using holistic color intervals could yield an interpretable outcome. To further verify the clustering outcome, we could embed the designs into lower dimensional space and visualize the design data points. Here we adopt Uniform Manifold Approximation and Projection (UMAP) as the tool of visualization. UMAP is a novel manifold learning technique for dimension reduction developed by Mclnnes et al. (Reference McInnes, Healy and Melville2018). UMAP could reduce the high-dimension data points and project them into two-dimensional space. Figure 9 shows the visualization outcome of selected designs in generation 4. All data points are colored with 10-cluster K-means clustering outcome label. We could observe that points with different colors are generally segregated. Based on the visualization outcome, we could reasonably presume that the clustering method could divide design solutions into groups with different data features.
UMAP visualization of selected designs in generation 4 colored by clustering outcome.
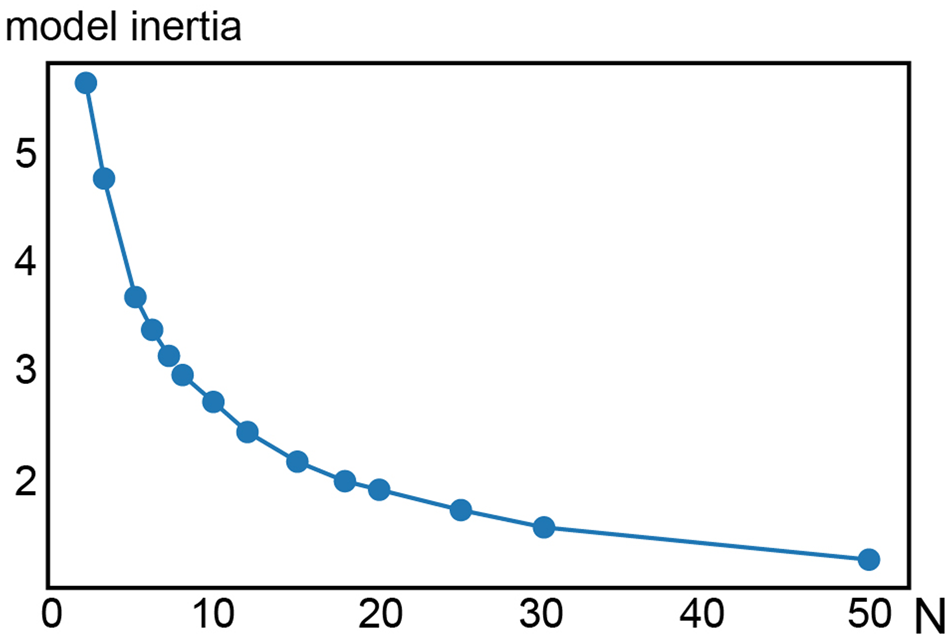
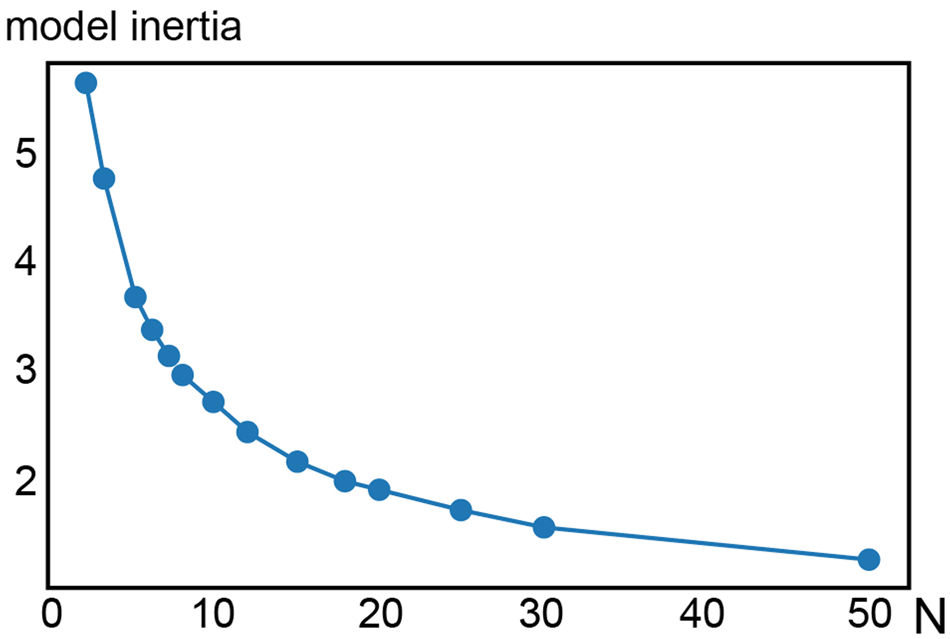
Just like the previously introduced method, the clustering process uses 10 holistic color distances of images instead of original color values. The number of clusters is manually set and would be adjusted. Figure 10 shows the relationship of cluster model inertia of all selected designs and the cluster number N. Inertia is a criterion called within-cluster sum of squares which K-means try to minimize. Inertia measures the sum of square distances of points within groups, showing how well the data points are divided by K-means clustering. Since no obvious sharp turning point is observed in Figure 10, the choice of cluster number has to be made based on other evaluations. In the following steps, the number of clusters would be represented by N.
Relationship between clustering model inertia and number of clusters.
After clustering, we divide images into groups and describe them with the cluster label. Since clustering method is not interpretable, the aim here is not to link or interpret cluster to certain styles or features like orient, western, classic, etc., but to find out similarities between images and describe similar designs with the same label.
Generate user preference profile based on clustering outcome
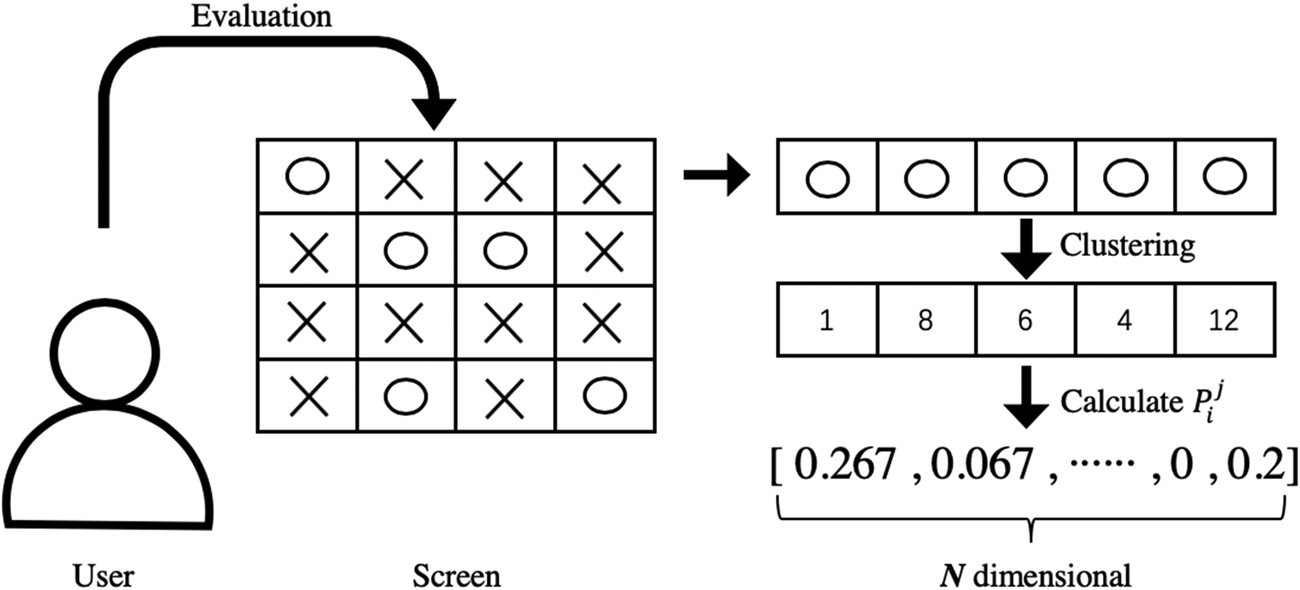
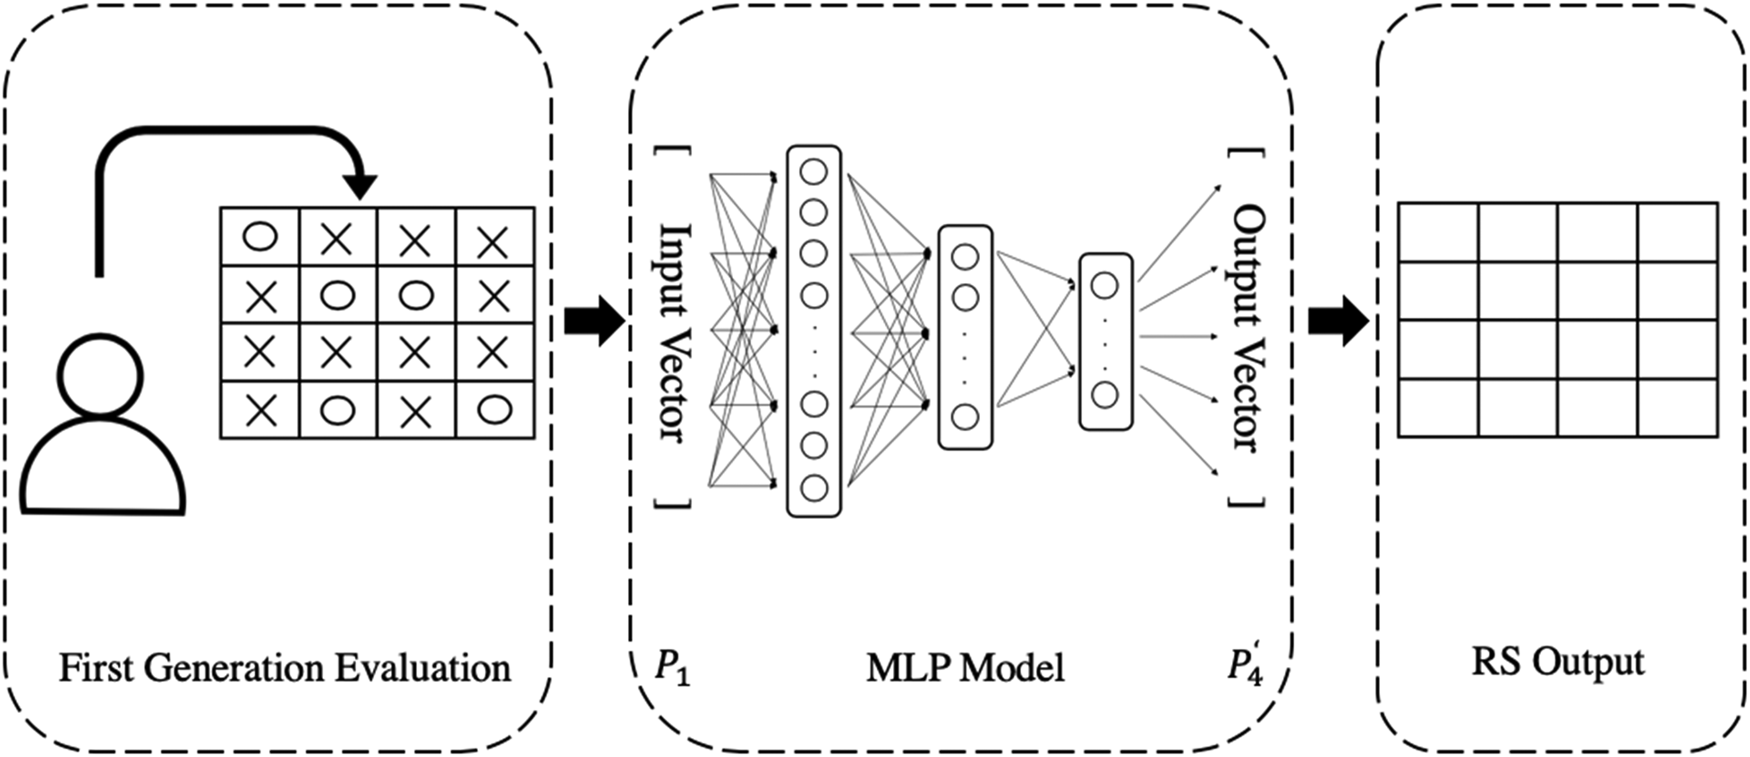
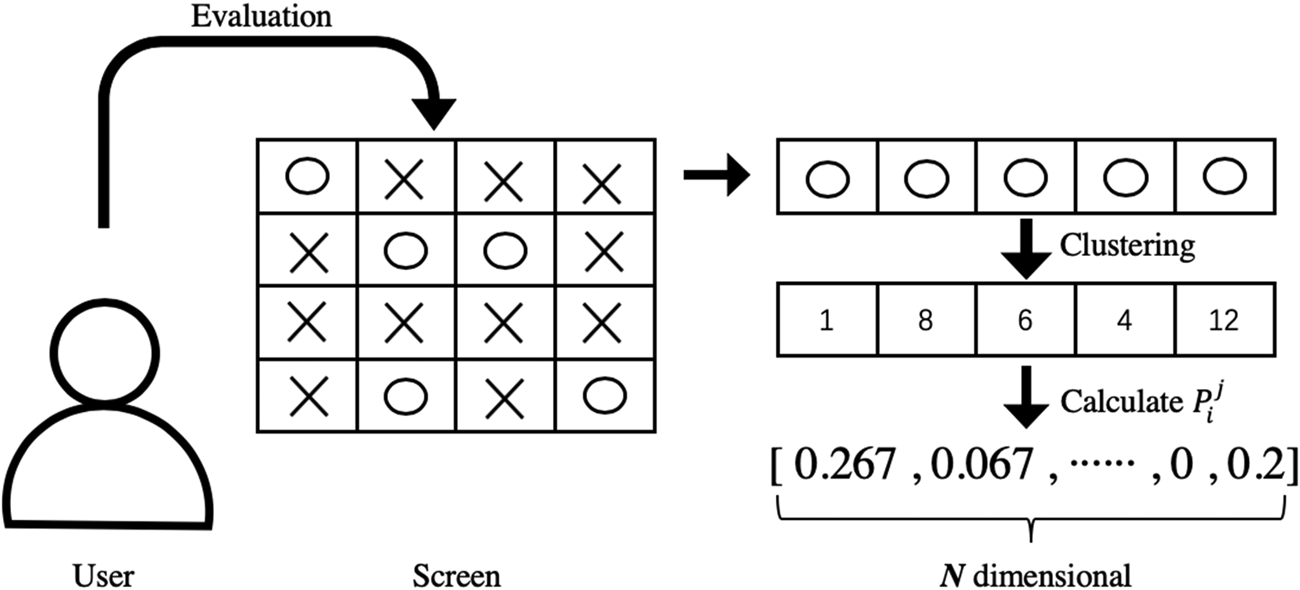
With data of user selection being represented by clusters, the user preference profile could be calculated as the ratio of selections of designs in clusters. The assumption here is simple and straightforward: how much a user prefers a certain cluster is shown by how many pictures of this cluster been selected. The process is shown in Figure 11. With every generation, individual user's selections are turned into an N-dimensional vector  ${\bi P}_{\bi i}^{\bi j}$ as shown in formula (2) (i for No. of generations, i = 1, 2, 3, 4; j for user serial number;
 $\; {}_\; ^x S_i^j$ for number of images of cluster x chosen by user j in generation i) which represents user preference distribution among clusters. Since the first generation of images is generated randomly, the initial selections show the general preference of users, then we could use P1 as the user preference profile. Selections of the last generation show a more precise design outcome that users expect from the beginning, so we use P4 as ground truth of user expectation and objective of recommendation.
 $${\bi P_i^j} = \displaystyle{{{[{}_\; ^1 S_i^j \;\comma \, {}_\; ^2 S_i^j \;\comma \, {}_\; ^3 S_i^j \;\comma \, \; \ldots \ldots\comma \, {}_\; ^N S_i^j ]}^T} \over {\mathop \sum \nolimits_{x = 1}^N {}_\; ^x S_i^j}} $$
User preference profile calculation process flow diagram.
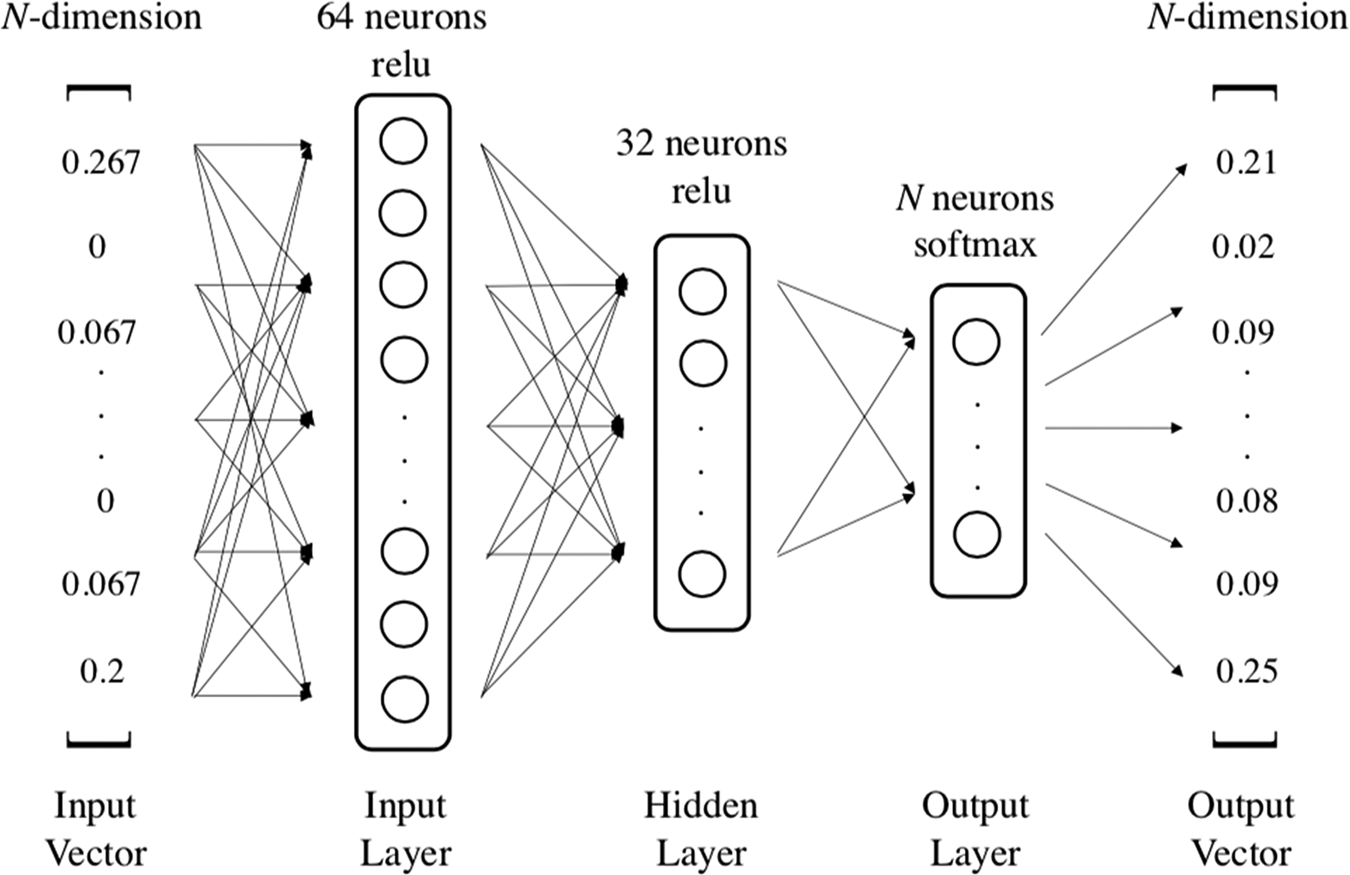
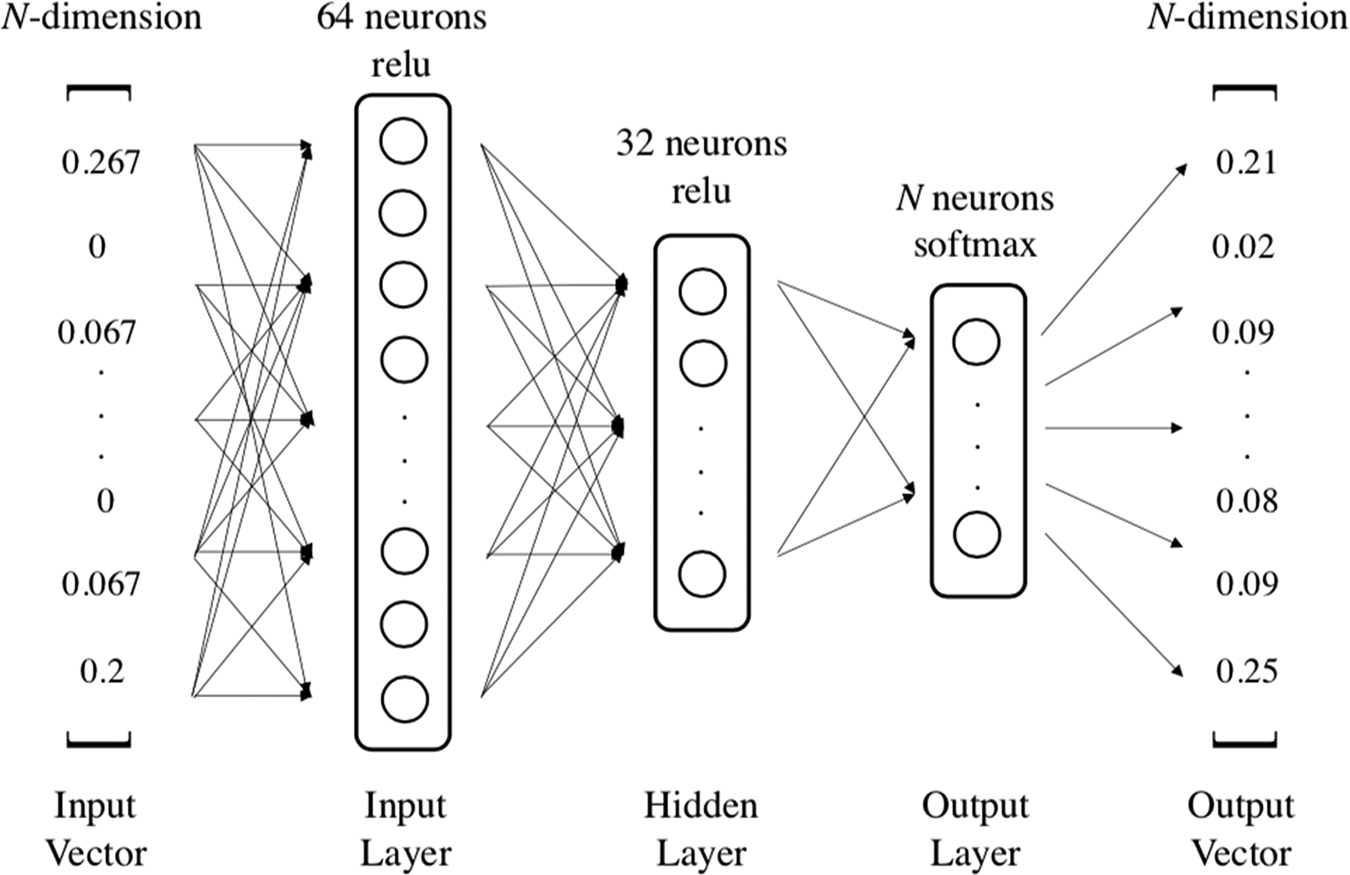
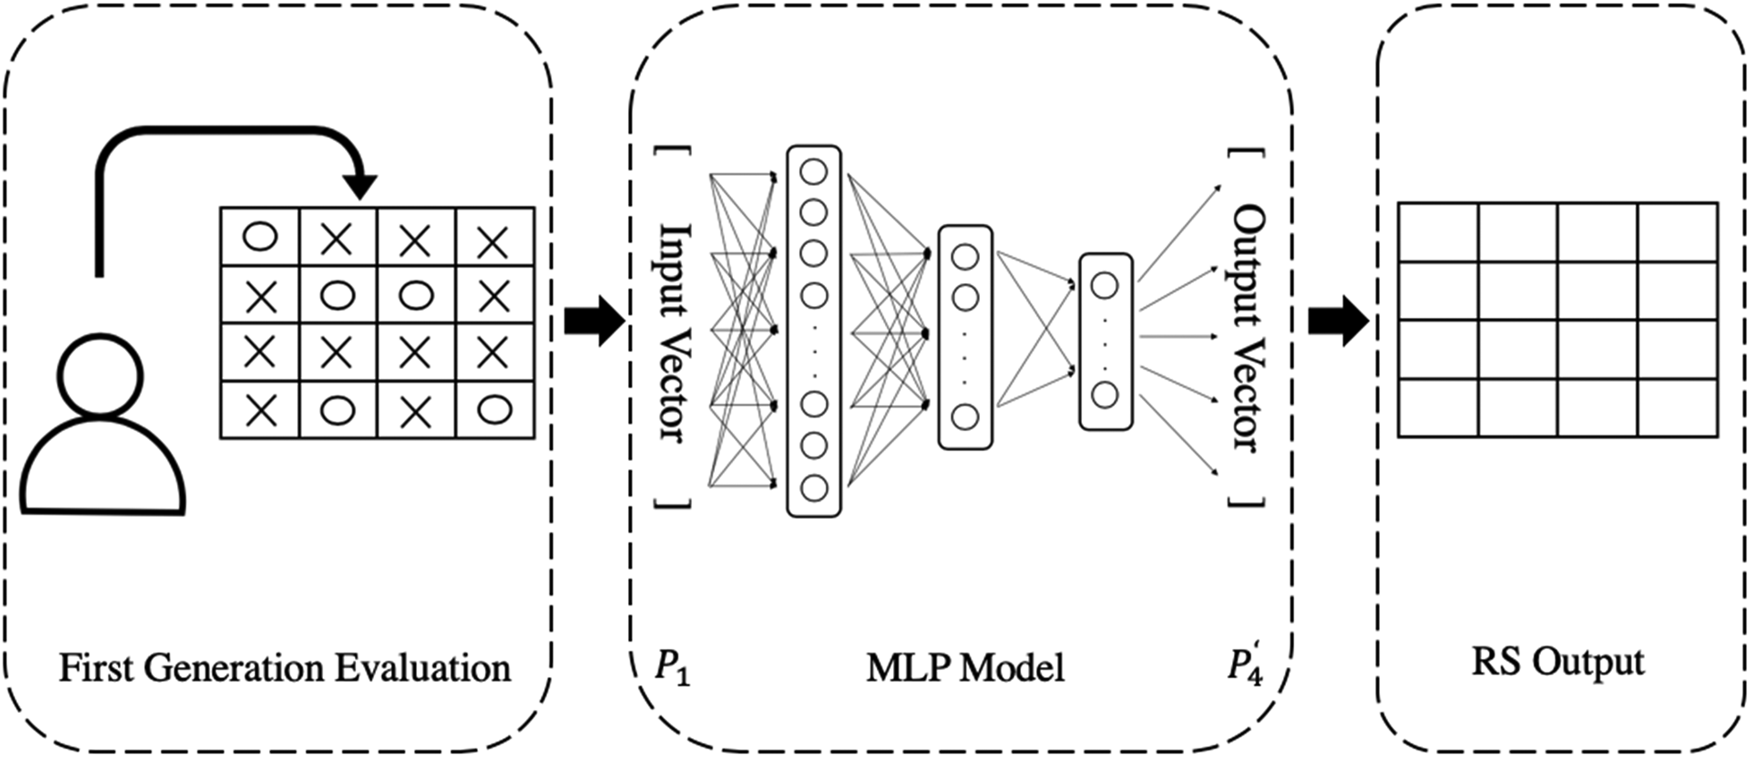
With calculated P1 and P4, we set up a dataset which includes input feature and tags of 230 subjects. Then the dataset could be used to train a machine learning model that generates P4 with P1 given. Since these two vectors have identical and limited dimensions, the learning task is just mapping one input vector to an output vector. A multi-layer perceptron (MLP) is set up as the model to finish the task (shown in Fig. 12). Here MLP is picked for its simplicity and capacity on this task. It is proved that a two-layer backpropagation network with sufficient hidden nodes could be a universal approximator (Cybenko Reference Cybenko1989; Hornik et al., Reference Hornik, Stinchcombe and White1989). The most obvious drawback of MLP is that they are usually not computationally economical when facing high-dimensional input data like images and videos. Since the input and output of our task is low dimensional, an MLP network would work well on it. With one input layer of 64 neurons, one hidden layer of 32, and an output layer of N softmax neurons, the MLP could generate N-dimensional softmax vector  ${ {\bi P}^ {{\prime}}_4}$.
Multi-layer perceptron network structure.
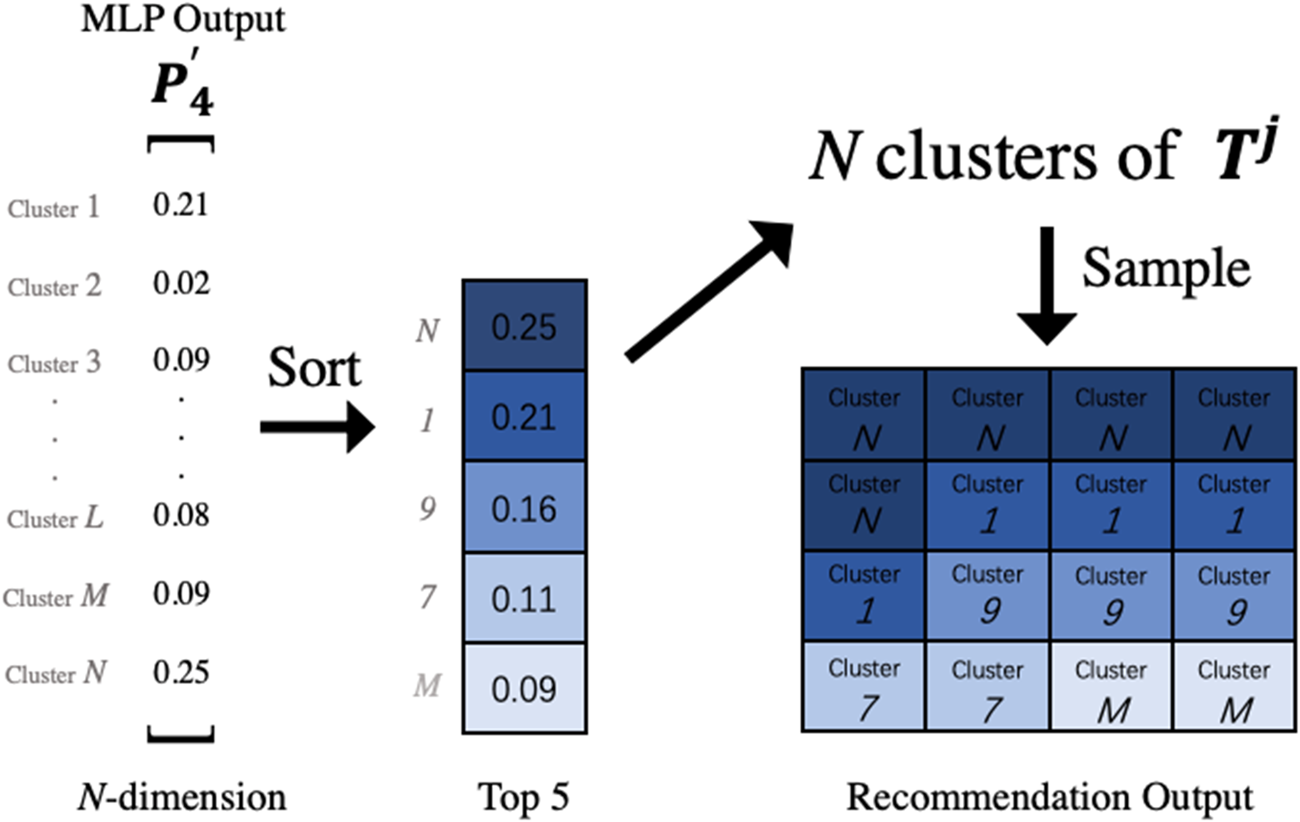
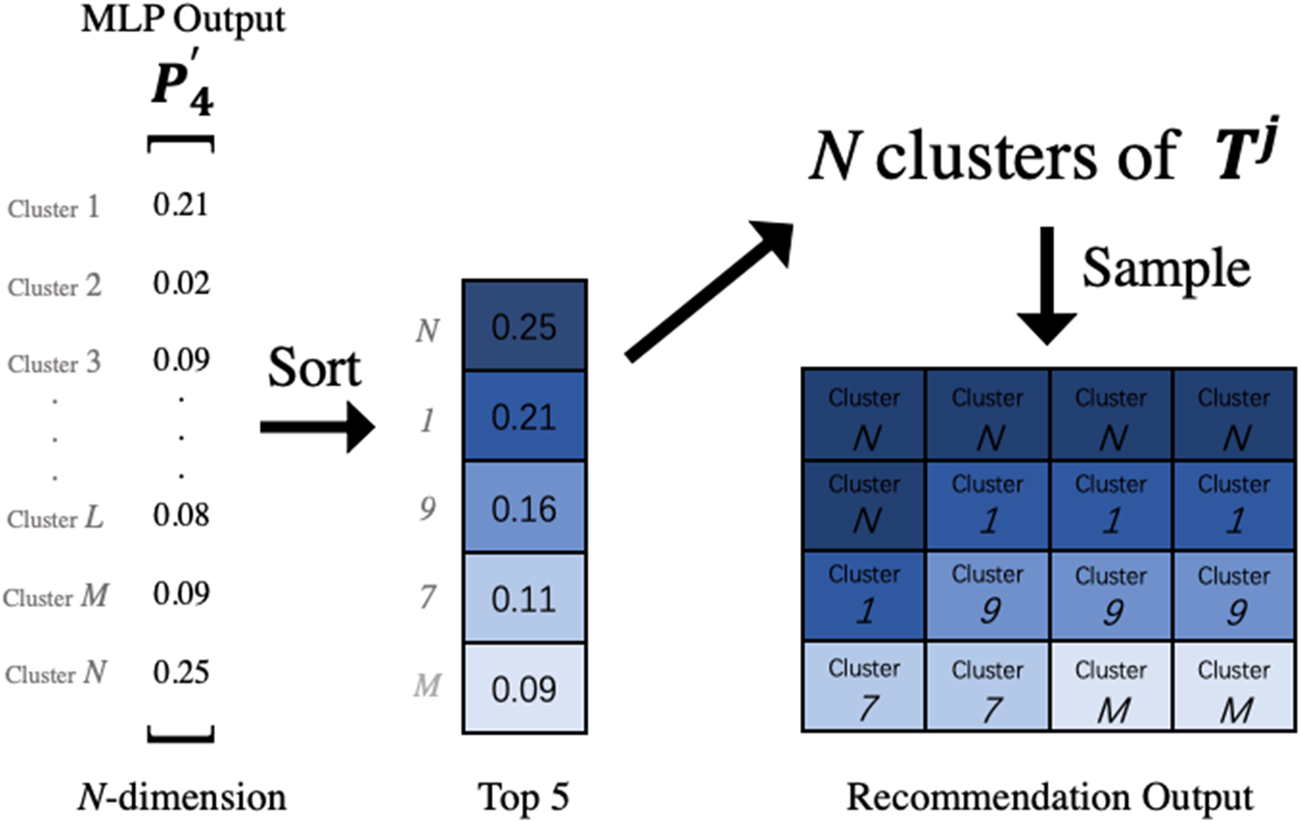
To make a complete recommendation system, generating outputs is necessary. Figure 13 shows the generating process. Here we use random sampling from clusters of final generation selections to transform MLP outcome  ${ {\bi P}^{\prime}_4}$ into 16 design solution images just as IEC system would provide for the last generation. We expect not only the solutions GA would produce but also diverse solutions which the MLP learn that the user might like. In this case, we sort out the top five values from vector
 ${ {\bi P}^{\prime}_4}$ and distribute N img = 16 to the top five valued clusters. Then design solutions would be sampled in corresponding clusters. Figure 14 shows the complete process flow of the content-based recommendation system.
Generating process of recommendation output.
Recommendation system process flow diagram.
Evaluation of recommendation system: AQV criterion
After recommendation system finishes its work flow, we need to evaluate its performance. There are lots of previous work on this topic. The criteria mainly focus on two parts: the output of recommendation system and the experience of users (Pu et al., Reference Pu, Chen and Hu2012). For the evaluation of the recommendation system output, there are quite a few factors that matters most: Accuracy, which refers to the ratio of recommended item being actually liked; Familiarity (Swearingen and Sinha, Reference Swearingen and Sinha2002), which refers to how well-known the recommended items are; Diversity, meaning how diverse the recommended items are. There are so many factors and criterions that some of them are even overlapping with others. Choice of criterion must be closely based on the research field and experimental methodology, especially when recommendation system is implemented in design systems, instead of an online content provider.
Based on our experiment, the criterion of recommendation system outcome contains three factors:
Accuracy: The ratio of last generation user selections T j (the number of selections is T j) which is found with any similar design in the recommendation system output O j. We expect the recommendation system to successfully capture user preference and produce outputs which partially correspond with actual user selections. A high ratio value is meaningful because it indicates that user preference is captured and shown in the output.
 $${\rm Accuracy\;} A^j = \displaystyle{1 \over {t^j}}\mathop \sum \nolimits^ {\rm Sim}\lpar {T_i^j\comma \, O^j} \rpar $$
Here the similarity is defined with the square distance of two solutions.
 $${\rm Sim}\lpar {T_i^j\comma \, O^j} \rpar = {\rm bool}\left( {\sqrt {\displaystyle{{\mathop \sum \nolimits_{i = 1}^5 \lpar {\Delta L_i^2 + \Delta a_i^2 + \Delta b_i^2} \rpar } \over {3 \times 5}}} {\rm \;} \lt 30} \right)$$
Quality: How generally preferred the recommendation system outputs O j are. We assume that final generation selections T k made by the one user k (here referring to any user) reflect the preference of the user itself. If one recommendation system output  $O_i^j \;$ is similar to any of these selections T k, then the output solution is of good quality for this certain user k. In this case, the ratio of user (230 in total) whose final generation selections contain at least one similar solution with certain recommendation system output shows how widely liked this output solution is. Then the quality value is calculated as the mean ratio of all O j outputs.
 $${\rm Quality}\; Q^j = \displaystyle{1 \over {230 \times N_{{\rm img}}}}\mathop \sum \limits_{i = 1}^{N_{{\rm img}}} \mathop \sum \limits_{k = 1}^{230} {\rm bool}\left( {\mathop \sum \limits_{x = 1}^{t^k} {\rm Sim}\lpar {O_i^j\comma \, T_x^k} \rpar \gt 0} \right)$$
Variety: How different recommendation system outputs are from each other. It is calculated as the mean standard deviation of all pairs of output. Variety value is high when outputs are distant from each other in CIELab space. With accuracy and quality values in an acceptable range, a high variety value would be a good sign showing recommendation system having much potential of recommending diverse solutions. Formula (6) is also applied on actual chosen images of the last generation T j, calculating the average variety of T j is 43.22, which could be used as a standard for comparison.
 $${\rm Variety}\; V^j = \displaystyle{{\mathop \sum \nolimits_{x = 1}^{N_{{\rm img}}-1} \mathop \sum \nolimits_{y = x + 1}^{N_{{\rm img}}} {\rm Dis}\lpar {O_j^x\comma \, O_j^y} \rpar } \over {C_{N_{{\rm img}}}^2}} $$
 $${\rm Dis}\lpar {x\comma \,y} \rpar = \sqrt {\displaystyle{{\mathop \sum \nolimits_{i = 1}^5 \lpar {{\lpar {L_x^i -L_y^i} \rpar }^2 + {\lpar {a_x^i -a_y^i} \rpar }^2 + {\lpar {b_x^i -b_y^i} \rpar }^2} \rpar } \over {3 \times 5}}} $$
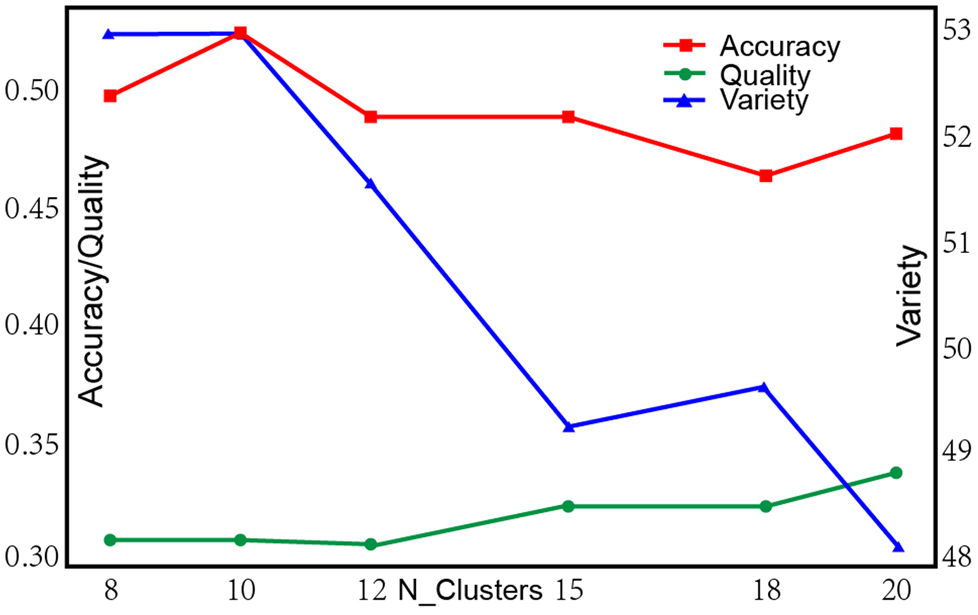
Together, these three factors (AQV) could comprehensively evaluate recommendation system in our IEC design experiment. With the AQV criterion evaluating recommendation system performance, we could then visualize the relationship of N (number of clusters) and overall performance. Figure 15 shows the AQV values with N (number of clusters) set to 8, 10, 12, 15, 18 and 20.
Relationship between accuracy, quality, and variety values of recommendation system with a different number of clusters.
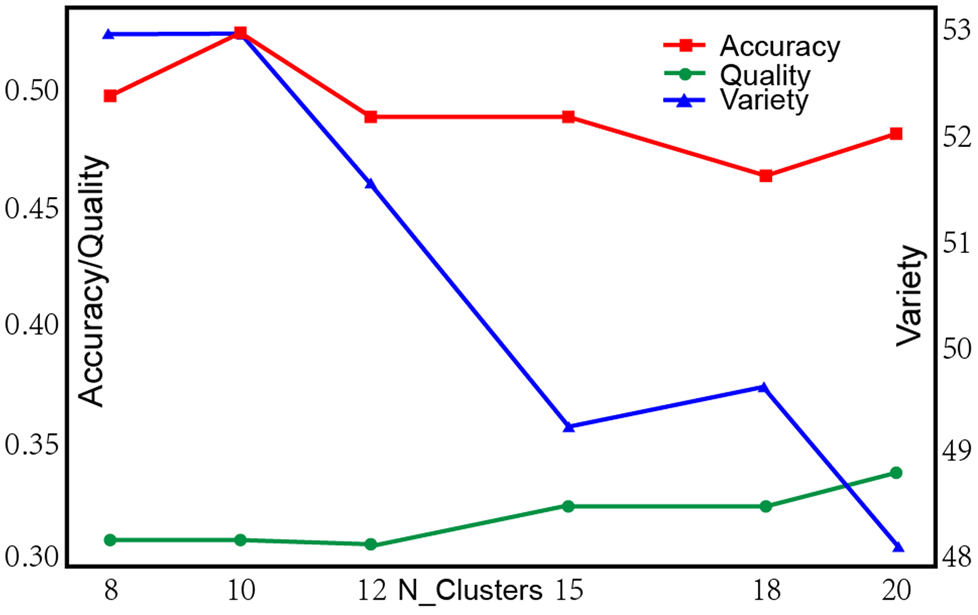
As shown in Figure 15, accuracy and quality are generally steady with a different number of clusters N, while an obvious negative correlation between variety and N is observed. The relatively weak correlation between accuracy/quality and number of clusters N is beyond our expectation since N affects the precision of the design solution description. It positively indicates that the recommendation system is fairly robust with different N selected. The negative correlation between variety and N shows that a higher N leads to lower output variety. However, the oscillation of values could still be observed along with correlation. There are two possible causes: firstly, the K-means clustering involved in recommendation system is highly randomized and could produce different outcome with varying random state given, bringing partial uncertainty in recommendation system performance; secondly, the distribution of design solution data in color space may not be as uniform as inferred from Figures 9 and 10, making model with certain N performing better or worse than expectation. As for the absolute values of AQV, we could find accuracy all above 0.45 and quality above 0.3, which is a relatively high value showing recommendation system works well in our experiment. We could also notice that all variety value in Figure 15 is significantly higher than the average variety of T j, the selected designs of the fourth generation, which is 43.22. It shows that the recommendation system could provide more diverse solutions than the original IEC system.
From the outcomes above, we could conclude that the content-based recommendation system works well in our IEC design system. The method of using clustering to describe the content and build user preference profile is also shown useful.
Conclusion and discussion
In this paper, we aim to explore how data recorded in design experiment could be utilized for the analysis of the design process and for improving interactive design system performance by training a recommendation system. We introduced an IEC design system experiment with interior material selection as the design objective. With the holistic color interval and K-means clustering used in data analysis, clear design categories and steady design process were shown. In this case, we could state that the IEC system works effectively on our design objective and the analysis does capture insights into the design process. A content-based filtering recommendation system is applied to the IEC experiment dataset with K-means clustering used for the description of design and MLP used for recommendation. A three-factor criterion, including accuracy, quality, and variety is also set up based on the IEC design experiment to evaluate overall performance, proving the recommendation system working effectively in the IEC design system.
Although the majority of our experiment participants are not professional designers, obvious design categories and design process pattern, which we expect only from professionals who could express their design thinking properly, are observed after data processing. In this case, the otherwise undiscovered design process could be concluded from data analysis, showing the great potential of data-driven design researches. Furthermore, with only 230 participants involved, which are much smaller than common machine learning datasets, we could already figure out clear conclusions in the design process. It suggests that the dataset of data-driven design researches could be statistically valuable without being excessively large in scale.
In future research, there are a lot of possibilities in following up this work. Firstly, although our IEC design system is already trying to reduce time consumption and cost of experiment, it is still adopting a traditopnal method of experiment and data collection. Since collecting massive datasets by conducting experiments is undoubtedly expensive and time-consuming, the data scale of our IEC system is still limited. In this case, integrating the IEC system into an online application or even a social media platform could be a fancy solution to make a larger dataset easily collected. With a larger data scale, a more complicated design experiment involving more factors could be carried out, expanding the possibility of the IEC design system greatly. Secondly, methods applied in this research including k-means clustering and content-based recommendation could be expanded with many other methods. Classification, regression, and knowledge-based analysis methods can also be used to analyze design process. With more sophisticated design experiment setting and more user data collected, collaborative filtering and hybrid approach recommendation system could also be applied in IEC design system. One question that occurs here is: how can IEC systems further integrate with state-of-the-art approaches? Thirdly, this paper focuses on the analysis of collected data of IEC design experiment. Further experiments on human user is needed to verify conclusions and adjust IEC system settings. Can recommendation system improve the overall user experience of IEC system? How do IEC system affect design process and does it really facilitate creativity? We will dive into these questions in our future research.
Weixin Huang is an Associate Professor at School of Architecture, Tsinghua University. His research focuses on three major topics: human computer integrated spatial cognition, environmental behavior analysis using big data, weaving structure and bending active grid-shell system.
Xia Su is a masters student of Department of Building Technology and Science at School of Architecture, Tsinghua University. He received bachelor of architecture from School of Architecture, Tsinghua University. His current research focus is application of machine learning methods in design research and creativity, and 3D indoor synthesis based on graph generative models.
Mingbo Wu is a Ph.D candidate at Institute of Geographical Sciences and Natural Resources Research, Chinese Academy of Sciences. He received bachelor's degree in Tsinghua University and master's degree in University of Chinese Academy of Sciences. His current research focuses on big data application in environmental behavior analysis and urban analysis.
Lijing Yang is a Ph.D candidate at Department of Building Technology and Science at School of Architecture, Tsinghua University. Her research interests include spatial performance and human settlement, the relationship between human behavior and the built environment, and employment of big data in environmental behavior.