

1. INTRODUCTION
To successfully develop a product or product line, designers must determine what consumer variation will be addressed, and how this variation will be handled. The information available to designers is dependent on the stage of the design process. Prior to concept generation, the design information considered should be solution independent (Ulrich & Eppinger, Reference Ulrich and Eppinger2012). As a result, the available information for designers to consider is limited to user characteristics and design specifications. The ideal scenario is that for each consumer, the artifact purpose(s) can be addressed equally well with the same artifact, though this situation is not realistic. As such, part of the conceptual design process should investigate potential solutions to address consumer variation.
Consumer variation refers to the differences in consumer characteristics, consumer needs, and the corresponding design specifications. Consumer variation may result from differences in preferences, anthropometry, age, use location, and so forth, and is a mix of qualitative and quantitative information. This variation has the potential to map to the engineering domain, where information must be precise and measurable.
Consumer variation can be addressed through a number of design paradigms (see Section 2.2). However, the selection of a design methodology is typically an ad hoc or a priori decision. Few products fully meet consumer needs (Cowper, Reference Cowper2008). This could be in part because the needs of individuals are commonly grouped (market segmentation), and few methods formally consider the variation within a segment.
The contribution of this work is to present an affordance-based framework that allows designers to evaluate the consumer variation present prior to concept generation. In doing so, progress is made toward a formal selection process to choose a design paradigm to address consumer variation. Evaluation takes place at the individual level, allowing all design paradigms for addressing consumer variation to be considered, even mass customization. The following section provides a review of previous research. The methodology for analyzing consumer variation is presented in Section 3. A case study demonstrating the method is presented in Section 4, looking at consumer variation for a child stroller (sometimes called a pram or pushchair). The paper concludes with challenges and areas of future work.
2. PREVIOUS WORK
This research focuses on the initial stages of a design process when the problem is defined and clarified. A brief review of affordance-based design is presented, as this work seeks to contribute to this area. Because the proposed method is intended to be used prior to selecting a design paradigm for addressing consumer variation, the available paradigms are reviewed. Finally, because the numerical taxonomic method is adapted in the proposed method, a brief review is provided.
2.1. Affordance-based design and problem formulation
Maier and Fadel (Reference Maier and Fadel2001a ) formally identified affordance as a basis for design. Maier and Fadel then went on to propose the use of affordances as a means to represent consumer needs (Maier & Fadel, Reference Maier and Fadel2003). According to Maier and Fadel (Reference Maier and Fadel2003), once raw needs have been identified, they can be restructured as affordances. Cormier et al. (Reference Cormier, Olewnik and Lewis2014) created a formal affordance basis, which built off an initial set of common affordances identified by Maier and Fadel (Reference Maier and Fadel2003). As such, the design problem is captured by the set of affordance (i.e., the designers must design an artifact that realizes the desired affordances).
A formal affordance-based design was proposed by Maier and Fadel (Reference Maier and Fadel2009), which includes an approach for designing a solution to a particular affordance. A defining feature of affordance-based design is a relational viewpoint. The characteristics of the user and of the artifact influence what benefits are provided to a given user, by a given artifact. Thus, designers must strive to deliver a set of affordances even with the presence of consumer variation.
2.2. Design paradigms to address consumer variation
There has been significant research focused on how to extend product variety and meet different consumer needs, as well as general product architecture research. This section discusses previous research that is used for understanding and classifying how consumer variation is addressed. It should be noted that the review of literature here is intended to highlight that which is relevant to addressing consumer variation, and by no means is it intended to be representative of the entire field. The research here is intended to assist designers as they process information prior to conceptual design, such that all these paradigms may be considered as potential solutions to address the consumer variation.
2.2.1. Mass customization
Customer variation provided the foundational need for mass customization that utilizes the idea that providing a product that better satisfies each individual consumer's needs while maintaining affordable prices is a means for a company to be successful (Pine, Reference Pine1993). Further work identified four corporate approaches to mass customization: collaborative, adaptive, cosmetic, and transparent customization (Gilmore & Pine, Reference Gilmore and Pine1997). In order to approach true customization, the argument has been made that mass customizable products should receive direct input in some form from the consumer (Ferguson et al., Reference Ferguson, Olewnik and Cormier2013). As a result, designers must identify what aspects of the system will have the flexibility to be customized (and often what aspects can remain common). However, mass customization may not always be appropriate or economically feasible. In this case, one solution to address some level of consumer variation is to use product families.
2.2.2. Product families
A product family is a group of products that satisfies multiple market segments, yet shares a common core of technology (components, assemblies, processes, etc.), referred to as the product platform (Meyer & Lehnerd, Reference Meyer and Lehnerd1997). There has been a significant amount of research focused on how to realize product families. From a corporate standpoint, Maier and Fadel (Reference Maier and Fadel2001b ) investigated how to create product families based on a product release schedule. From a system standpoint, there are two general approaches to creating product families that have been identified as a module-based approach and a scale-based approach (Simpson, Reference Simpson2004). The modular approach uses the addition or subtraction of modules to or from the platform to differentiate family members (Marion et al., Reference Marion, Freyer, Simpson and Wysk2006). In contrast to this, the scale-based approach leverages a design where parameters can be modified to change the functionality of the product (Simpson et al., Reference Simpson, Maier and Mistree2001). The difference in these two approaches may result in one approach being better suited depending upon what type of consumer variation exists.
To this extent, there has been research that has focused on creating product families to minimize consumer trade-offs. One method investigated is hierarchical product families, which strives to offer better performance while maintaining market coverage (Hernandez et al., Reference Hernandez, Allen and Mistree2002). To accomplish this, multiple levels of commonality are specified, such that commonality is not increased at the expense of performance. The method was extended in Williams et al. (Reference Williams, Allen, Rosen and Mistree2004) to account for nonuniform demand. Regardless of the specific product family approach, designers will need to understand what commonality and diversity exists. An additional way to offer consumers better performing products is through the use of (re)configurable systems.
2.2.3. (Re)configurable systems
A system that can be altered after it has been fielded is said to be configurable; a configurable system in which these alterations can be performed repeatedly and reversibly is said to be reconfigurable (Ferguson et al., Reference Ferguson, Siddiqi, Lewis and de Weck2007). Thus, reconfigurable systems are a subset of configurable systems. Reconfigurability has been identified as a solution to systems requiring multiability, evolution, or survivability (Siddiqi et al., Reference Siddiqi, de Weck and Iagnemma2006). Cormier and Lewis (Reference Cormier and Lewis2010) identified configurability or reconfigurability as a means to resolve different performance and form requirements between users, as well as allow for multiple users or occasion-based use. As such, there is potential to use configurability or reconfigurability to address the identified variation.
2.2.4. Robust design
The principles of robust design are to make a design insensitive to variation (or noise) (Phadke, Reference Phadke1989). This philosophy can be applied to designing for consumer variation, where the varying consumer needs represent the noise, and the system must be designed to satisfy the outlined criteria. The main drawback of robust design is that it could result in a sacrifice of performance for certain users. Similar to robust design, universal design is a concept that started in the field of architecture, and focuses on creating designs that are robust enough to be usable by any individual (Null & Cherry, Reference Null and Cherry1996). Another related approach, design for human variability, looks to improve quality of use for the spectrum of variable users by directly incorporating user information into the design process (Garneau & Parkinson, Reference Garneau and Parkinson2009a ).
2.2.5. Integration of design paradigms
Design for human variability is a field in which engineering design concepts, such as optimization, robust design, and reconfigurable systems, are used to address user variation related to the user's anthropometry (Garneau & Parkinson, Reference Garneau and Parkinson2009a ). This has also been extended to start accounting for preferences as well (Garneau & Parkinson, Reference Garneau and Parkinson2009b ). However, much of this work focuses on the physical design of the system, optimizing an already established conceptual design or product architecture. In general, consumer variation should be considered during conceptual design as a subproblem. In doing so, all potential design paradigms should be considered.
The decision to use robust design, or any of the other methods discussed, is a meta-level design decision. In order to facilitate the selection of a method to address variation, numerical taxonomic approaches are proposed as a means of understanding the variation that is present in a set of consumers. When the needs and characteristics of individual users are considered, there is a significant increase in the amount of information that must be considered. The numerical techniques help designers identify the underlying structure of the information.
2.3. Numerical taxonomy
Classification is defined as the ordering of organisms into groups based on their relationship to one another (Dunn & Everitt, Reference Dunn and Everitt1982). As such, classification is useful for a number of scientific domains. Because the process of classification can be ambiguous, efforts have been made to quantify the classification process; this resulted in the field of research known as numerical taxonomy (Sneath & Sokal, Reference Sneath and Sokal1973).
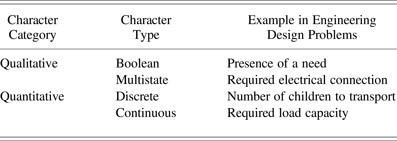
Numerical taxonomy requires the specification of a set of taxonomic characters that describe the object to be classified (Sneath & Sokal, Reference Sneath and Sokal1973); these characters are the abstract representation of the object (similar to the abstraction of a solution to design variables for optimization). A metric used to evaluate the similarity or dissimilarity between objects must also be selected (Sneath & Sokal, Reference Sneath and Sokal1973). Taxonomic characters can be qualitative (Boolean or multistate) or quantitative. Qualitative characters are those characters that cannot be described by numeric values (Dunn & Everitt, Reference Dunn and Everitt1982); these include Boolean characters and multistate characters (i.e., characters that are related but unordered). Quantitative characters vary from one operational taxonomic group to the next on an interval scale, and this variation from group to group may be discrete or continuous (Dunn & Everitt, Reference Dunn and Everitt1982). This range of options provides enough flexibility to capture user characteristics as well as design specifications (examples can be found in Table 1).
Character types with engineering design problem examples

Once the character set and metric have been selected, the method of grouping objects must be selected. To do this, a number of decisions must be made to determine the process for grouping the objects under consideration. Sneath and Sokal (Reference Sneath and Sokal1973) identify the first decision as to whether or not to use an agglomerative or divisive approach, defining them as follows:
-
• Agglomerative techniques start with all individual objects and group them into successively fewer sets by merging individuals, subsets, or a combination.
-
• Divisive techniques start with all entities and separate into more selective sets.
The next decision involves hierarchy. Nonhierarchic approaches are those that do not exhibit ranks in which subsidiary groups become members of larger, more inclusive groups, as is the case with hierarchic approaches (Sneath & Sokal, Reference Sneath and Sokal1973). Hierarchy has the benefit of a higher ranking group summarizing the bulk behavior of subgroups. The decision to allow overlapping groups must also be made. In overlapping approaches, an object may belong to multiple subgroups of the same rank.
A measure of similarity, like optimality, is not a general characteristic; it is necessary to specify the attributes under consideration (character set) and the metric for evaluation (i.e., similarity coefficient). Further, classifications derived via numerical taxonomy cannot be proven to be correct or incorrect. These classifications are dependent on the manner in which similarity is evaluated and the method used to group objects. As such, the usefulness of a classification is determined by its ability to be put into practice (Dunn & Everitt, Reference Dunn and Everitt1982). However, an objective taxonomy is not dependent on the person creating the taxonomy (and thus would be designer independent). A stable taxonomy does not need to change as a result of adding additional samples or characters; thus, if a stable taxonomy could be developed, it would enable the classification of users. This work proposes the use of classification as a means to learn about the group of consumers and their corresponding needs; the classification is a way of organizing a large amount of information in a manner such that designers may use it to inform their design direction. The following section presents the methodology to do this.
3. AFFORDANCE-BASED EVALUATION OF CONSUMER VARIATION
The relational nature of affordance-based design highlights the fact that designers must be concerned with both variation of the user and the required variation of the artifact. As such, designers must explicitly evaluate certain user characteristics and the characteristics of the artifact. Because this method is intended to be used in the early stages of a design process, the artifact is represented by a set of design specifications. Design specifications consist of a metric and a target. The metrics indicate the quantifiable evaluation criteria, while the targets are the desired values for the criteria. These design specifications are specific to a single user within a user role, which again is a derivative of the affordance-based design approach; because the design specification targets are set at the individual level, they inherently maintain the relational nature of affordances (i.e., the design specification is set such that the affordance is realized). Once the information is available, designers can use this information to understand the consumer variation. The method is demonstrated with a case study in Section 4.
3.1. Identify or generate individual consumer information
The first step in evaluating consumer variation is to determine how each consumer will be represented; this is similar to selecting design variables for an optimization process. This information used to establish a (numerical) taxonomy is referred to as the character set, and like the set of design variables, it is intended to be representative of the object it abstracts. Information captured by designers early in the design process consists of consumer characteristics, consumer needs, and design specifications (though this information evolves).
Cormier and Lewis (Reference Cormier and Lewis2015) proposed an affordance-based approach that can be used to develop consumer specific design specifications that capture the influence of consumer characteristics (maintaining the relational nature of affordances). Design specifications capture the influence of consumer characteristics within the context of the artifact. As such, they form the basis of the character set.
User characteristics serve primarily to determine the target values for design specification metrics. However, there are certain instances where user characteristics cannot be mapped to design specifications without specifying aspects of a solution. These user characteristics should be included in the character set. The resulting character set represents the user well and meets the requirements and recommendations outlined in the numerical taxonomy literature.
Sneath and Sokal (Reference Sneath and Sokal1973) identify three types of inadmissible characters that should not be used. Meaningless characters are those that do not reflect the inherent nature of the taxonomic unit (Sneath & Sokal, Reference Sneath and Sokal1973). The design specifications are relevant because they capture important characteristics of the artifact itself and its performance. The subset of user characteristics are relevant because they capture information related to delivering affordances that is not captured by the design specifications. Meaningless characters could potentially arise if all consumer information identified by a design team were included (e.g., raw survey data, which may include information such as a zip code). Designers should only include the consumer characteristics that are directly tied to affordances. Other consumer information can be leveraged when generating the mapping functions (e.g., mapping zip codes to operating temperatures).
Logically correlated characters are defined by Sneath and Sokal (Reference Sneath and Sokal1973) as those characters that can be determined by another character (and are therefore essentially redundant). An example of this is using the diameter and circumference of a circle. In the case of a partial correlation, there a judgment must be made. The partially correlated character may be removed, or if sufficient benefit is expected, it may be included. This is the primary reason that consumer characteristics are not generally included in the character set, unless they are not mapped to a design specification (or their influence on affordances is only weakly captured by design specifications). A consumer characteristic may be considered to be partially correlated if it plays a slight role in influencing a design specification. In this case, designers must determine if it is adequately represented, or if the characteristic itself should also be included. In general, its inclusion will have a slight distortion on overall similarity scores, because it is a slight double counting on one of many characters; however, not including a partially correlated consumer characteristics has the potential to miss an important design observations (often related to consumer anthropometry or knowledge). For this reason, it is recommended that partially correlated consumer characteristics be included.
Invariant characters are defined by Sneath and Sokal (Reference Sneath and Sokal1973) as those that do not vary across the entire sample. In the context of a design problem, there may be design specifications or consumer characteristics that do not vary. In this case, the design specification is still part of the design problem, but it would not be included in the character set. The design information that forms the basis for the character set satisfies the theoretical requirements of numerical taxonomy (Sneath & Sokal, Reference Sneath and Sokal1973); however, the information must also be represented in a manner that enables numerical processing.
Representation of the design information may require a combination of quantitative and qualitative characters. Quantitative characters are referred to as ordered and can be continuous or discrete. Qualitative characters are those that differ in kind and are described as unordered. Qualitative characters are broken into two-state and multistate characters. Two-state characters are those characters where they can be captured by only two options (e.g., presence or absence of a feature). Multistate character have three or more logically related values, but there is no logical order to the values (e.g., a USB interface can be of type A, B, mini A, micro A). Both the user's set of characteristics and the design specifications can be represented using a combination of qualitative and quantitative characters. However, in order for either type of characters to be used in a similarity metric or in a clustering algorithm, this information must be coded.
With regard to coding characters, there are three scenarios that must be considered: two-state qualitative, multistate qualitative, and quantitative.
-
• Two-state characters are coded as Boolean variables. Traditionally, positive or present characters are coded as a one and negative or absent characters are coded as zero. For two state characters that have two arbitrary options, the designer simply assigns the values. Qualitative multistate characters can be represented with a set of two-state characters.
-
• For design specifications that are in the form of a list, designers must determine if only one item from the list is chosen. If this is the case, it is a multistate scenario. If multiple options may be chosen from the list, the list should be represented as a set of Boolean options.
-
• Quantitative characters can be handled directly as a number. Design specifications that are a range can be represented with two quantitative characters, allowing the ends of the range to be captured.
The individualized set of design specifications can be created for a user within a user role. Thus, for all users there is a (potentially) unique value for all design specifications. The design specifications should be generated at the individual user level from unique user characteristics. The presence or quality of an affordance can be evaluated from a user's individual design specifications, while maintaining the relational benefit that is one of the primary benefits of an affordance-based approach. Once design specifications have been generated for each user within each user role, designers can begin to analyze the data for consumer variation.
3.2. Select commonality metric
A number of metrics, often referred to as similarity coefficients, have been created to evaluate the similarity or dissimilarity between two objects; in this approach, the objects being compared are the users. Gower's similarity coefficient works for both qualitative and quantitative comparisons (Sneath & Sokal, Reference Sneath and Sokal1973). As such, this makes it appropriate for evaluating similarity between users that will be compared based on their associated design specifications and potentially certain consumer characteristics, which have the potential to be either qualitative or quantitative. Gower's coefficient is shown in Eq. (1):
 $${S_{\rm G}} = \displaystyle{{\mathop \sum \nolimits_{i = 1}^{\rm \eta} w_i^{{\bi jk}} s_i^{{\bi jk}}} \over {\mathop \sum \nolimits_{i = 1}^{\rm \eta} w_i^{{\bi jk}}}}.$$
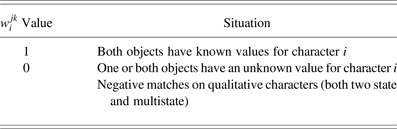
The subscripts j and k denote the two objects being compared; the basis of the comparison is the set of η characters. The current character being evaluated is denoted as character i. The information from character i is only included in the similarity measure if the comparison is considered valid. The decision to include a character as part of the overall dissimilarity measure is handled by the weights
 $w_i^{\,jk} $
shown in Table 2; these weights are used solely to determine if a character is considered valid for comparison, because all valid characters contribute equally to the overall dissimilarity measure. Valid comparisons require that the information for that character is known for both objects and the information being compared is indicative of the objects characteristics (termed a nonnegative match).
Weight values and their uses

In practice, missing information may result if a user is not willing to report certain information (e.g., user weight and age). Negative matches occur when two qualitative features match for the value of absent, none, and so on. For example, if two users do not take the subway (i.e., the zero Boolean match for “subway use”), it would not commonly be counted toward either the similarity or the dissimilarity of those users. The decision to count or not count negative matches is a guideline, and open to exploration for those evaluating the taxonomic resemblance (Sneath & Sokal, Reference Sneath and Sokal1973). The current approach does not count nonnegative matches, and investigation of counting negative matches is an area of future work.
The distance metric
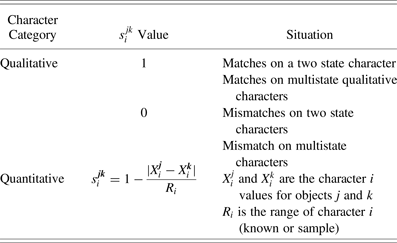
 $s_i^{{\bi jk}} $
for a character state is evaluated according to the information in Table 3. In Equation (1), η is the number of characters being used to compare the two objects; η could be the total number of characters, or it could be a subset (this will be discussed further in the following section). Equation (1) yields the similarity between two consumers; when this information is determined for all consumers, an l × l data matrix can be developed, termed the resemblance or similarity matrix. This similarity matrix is then used to assess the structure of the data, which in this case is looking for groups of similar consumers.
Distance values and their uses

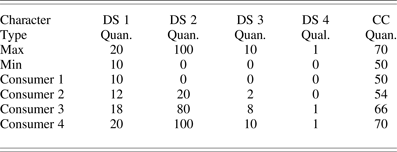
The following calculations demonstrate how to evaluate Gower's similarity coefficient, using the example data from Table 4. For the comparison between Consumers 1 and 2, there is a negative match for the Boolean character. As such, this weight is set to zero. For the comparison between Consumers 3 and 4, there is a positive match for the Boolean character, which is a valid comparison. Evaluating the data, it can be seen that the quantitative differences for these two comparisons (
 $S_{\rm G}^{12} $
and
 $S_{\rm G}^{34} $
) are the same (one-fifth of the range); thus, the difference in similarity values between
 $S_{\rm G}^{12} $
and
 $S_{\rm G}^{34} $
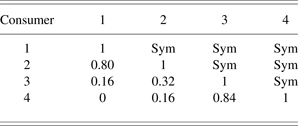
is a result of the Boolean character comparison. The completed similarity matrix can be seen in Table 5.
 $$\hskip0ptS_{\rm G}^{12} = \displaystyle{\matrix{\!\lpar 1 \rpar \left( {1 - \displaystyle{{\vert {10 - 12} \vert } \over {10}}} \right) + \lpar 1 \rpar \left( {1 - \displaystyle{{\vert {0 - 20} \vert } \over {100}}} \right) \hfill \cr \hskip13pt+ \ \lpar 1 \rpar \left( {1 - \displaystyle{{\vert {0 - 2} \vert } \over {10}}} \right) + \lpar 0 \rpar \lpar 1 \rpar + \lpar 1 \rpar \left( {1 - \displaystyle{{\vert {50 - 54} \vert } \over {20}}}\right)\hskip-3.5pt \hfill} \over {1 + 1 + 1 + 0 + 1}} = 0.8\comma$$
 $$\hskip0ptS_{\rm G}^{34} = \displaystyle{\matrix{\!\lpar 1 \rpar \left( {1 - \displaystyle{{\vert {18 - 20} \vert } \over {10}}} \right) + \lpar 1 \rpar \left( {1 - \displaystyle{{\vert {80 - 100} \vert } \over {100}}} \right) \hfill \cr \hskip13pt+ \ \lpar 1 \rpar \left( {1 - \displaystyle{{\vert {8 - 10} \vert } \over {10}}} \right) + \lpar 1 \rpar \lpar 1 \rpar + \lpar 1 \rpar \left( {1 - \displaystyle{{\vert {66 - 70} \vert } \over {20}}} \right)\hskip-3pt \hfill} \over {1 + 1 + 1 + 1 + 1}} = 0.84.$$
Example data to demonstrate similarity coefficient

Similarity matrix for data from Table 4

The similarity matrix contains the pairwise distances between consumers. This matrix is symmetrical, because the distance between consumers does not change based on the initial reference point. Looking at the values in the similarity provides insight on this pairwise similarity. For example, the similarity between Consumers 1 and 4 is zero; this is because they are at opposite ends of the spectrum with regard to range. The similarity matrix allows designers to compare two individuals at a time. To better understand consumer variation, designers must be able to evaluate the entire group of consumers.
3.3. Evaluating consumer variation and commonality
Consumer variation is evaluated through a process that combines clustering and a traditional analysis of the data. Clustering the users also enables the use of visualization tools like dendrograms, which are discussed later in this section. This provides designers with an overview of how much variation is present for a given set of information. When trying to address consumer variation, designers will be concerned with two different situations. The first is understanding consumer variation for the overall design problem. The second situation is understanding consumer variation at the subproblem level (i.e., the realization of individual affordances).
The method of evaluating consumer variation takes the form of an agglomerative, hierarchic clustering approach. Agglomerative approaches take individual consumers (and eventually subgroups) and combine them into new subgroups until all consumers have been formed into a single group. Agglomerative techniques do not leverage a priori assumptions (i.e., how the population should be separated, and in what order). These assumptions would be necessary to use a divisive approach. As such, there is the potential to identify commonality that might otherwise be overlooked. The use of hierarchic groupings is preferred when emphasis is placed on the summarization of the relationships between objects (Sneath & Sokal, Reference Sneath and Sokal1973). Because the intent is to help designers understand the variation within the population, and not pure classification, hierarchy is appropriate. Further, hierarchy information provides additional insight into how subgroups vary, which can be used in the concept generation stage. In the current approach, hierarchical clustering is used, though overlapping between subgroups of the same rank is not allowed.
Hierarchical clustering creates clusters by merging a user or subcluster with another user or subcluster using the known distances between individual users. When checking the distance to another subcluster, the designer must select how he or she chooses to assess the distance. Common options include using the cluster's arithmetic average (average linkage), the nearest individual within the subcluster (single linkage), or the farthest individual within the subcluster (complete linkage). Single linkage approaches are prone to identifying elongated clusters (Sneath & Sokal, Reference Sneath and Sokal1973). Complete linkage approaches tend to form small, compact clusters leaving out dissimilar objects. The proposed approach uses the cluster's average because it strives to create a balanced approach; the dissimilarity between the two clusters (or a cluster and an individual) U α,β is captured with Eq. (2). In Eq. (2), U αβ is the distance between two elements of each cluster, so the summation is the total distance between all elements or each individual cluster. The number of objects in cluster α and β are t α and t β, respectively. If each “subcluster” only contains an individual, this equation reduces down to the general similarity coefficient, in this case Eq. (1).
 $$U_{{\rm \alpha}, {\rm \beta}} = \displaystyle{1 \over {t_{\rm \alpha}t_{\rm \beta}}} {\mathop \sum \limits_{{\rm \alpha} {\rm \beta}} U_{{\rm \alpha} {\rm \beta}}}. $$
The hierarchical clustering process can be visualized with a graph called a dendrogram that shows how the clusters are created (shown in Fig. 1). The clustering process starts with l individuals; for this example, l is equal to eight. The two closest consumers are grouped (Consumers 6 and 7 in Fig. 1). The next two closest users or subgroups are then joined (Consumers 1 and 2 in Fig. 1). This process continues until all users have been grouped into one cluster. The larger the vertical distance between two consumers on the dendrogram, the greater the dissimilarity between them.
Dendrograms demonstrate cluster formation.

To create a set of clusters, a horizontal line is drawn. Each vertical line it intersects represents a cluster. For example, the dotted red line in Figure 1 results in three clusters. Visualizing clusters on a dendrogram has the additional benefit of showing within-cluster variation. Examining the clusters produced by the dotted red line in Figure 1, it can be seen that the difference between the subclusters in the first cluster has almost as much variation as what distinguishes it from the other two clusters. As such, four clusters might be a better option to consider (represented with the dashed orange line).
Once clusters are identified, designers can evaluate the data within the character set. This allows designers to identify the commonality and variation that is present within the cluster, as well as what variation results in the separation between the clusters. As such, the clustering results serve as an attention-directing tool for designers and helps process large data sets. Designers can also study what causes the merges on the dendrogram as they move up the hierarchy, making annotations as needed. For example, designers should consider what causes the split between the first and second clusters produced by the red dotted line. Designers can then use more conventional data analysis tools (max, min, mean, standard deviation, etc.) to represent the different clusters moving forward. This approach is used to evaluate consumer variation at both the artifact and the affordance levels.
3.3.1. Evaluating consumer variation at the artifact level
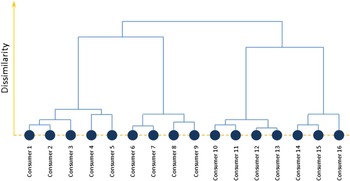
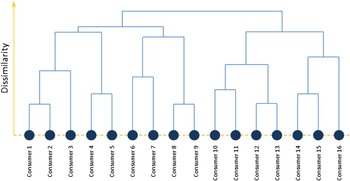
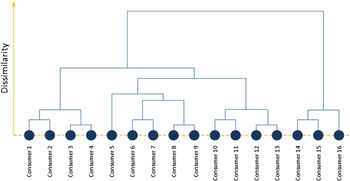
The initial evaluation of consumer variation occurs at the artifact level. As such, the complete character set is used when calculating similarity values between consumers. Evaluation at the artifact level allows designers to see if there are distinct clusters for the overall design problem, or if the population is truly mixed. This can help inform the overall design methodology used to address consumer variation. For example, a number of distinct clusters with clear separation could lead designers to investigate a product family approach (see Fig. 2). If there are no clear clusters for the overall problem (see Fig. 3), designers may investigate a mass-customization strategy. The presence of a small cluster with significant separation could indicate a niche usage scenario, which may represent a unique market opportunity (see Fig. 4).
Dendrograms with distinct clusters.

Dendrograms with no clear clusters.

Dendrograms with an outlier.

3.3.2. Assessing variation at the affordance level
A secondary evaluation of consumer variation occurs at the affordance level. In an affordance-based approach, subproblems consist of the realization of a single affordance. This is similar to the idea of treating functions as subproblems (Bohm et al., Reference Bohm, Vucovich and Stone2008). To develop this understanding, designers need to identify the character set associated with a particular affordance. This information can be identified easily by using an affordance-to-specification matrix, affordance-to-characteristic matrix, and specification-to-characteristics matrix (Cormier & Lewis, Reference Cormier and Lewis2015).
For each affordance, designers must determine the subset of design specifications that drives the realization of that affordance, and determine if there are any consumer characteristics that should also be included. The subset of design specifications that drives the realization of an affordance is indicated in that affordance's row in the affordance-to-specification matrix. To complete the character set, designers can use the specification-to-characteristics matrix to identify any consumer characteristics that are not mapped to design specifications (or were identified as incompletely mapped as discussed earlier). If none of these exist, the character set is complete. If these are identified, designers can use the affordance-to-characteristic matrix to determine if the unmapped consumer characteristics influence that affordance. If there is a connection with the affordance, they are added to the character set; otherwise, the character set is complete. The consumers can now be clustered with the affordance specific character set, following the same approach discussed in the previous section. As such, designers have n subproblems to address.
The artifact level clustering described in the previous section provides an overview of the consumer variation at the artifact level. This is useful in terms of understanding the overall design problem. However, because all design information is considered, it cannot find commonality for the different subproblems. Perhaps the most pragmatic reason to look at variation regarding a single affordance is that many conceptual design techniques focus designers on generating concepts to solve these individual subproblems (e.g., a repository-based approach is proposed by Kim et al., Reference Kim, Shin, Kim, Noh and Kim2012). Further, subproblem solutions are often leveraged when generating overall concepts (e.g., morphological matrix). As such, understanding the consumer variation associated with a subproblem will provide designers with important meta-design information, and has the potential to identify consumer commonality that would not be identified at the artifact level. Understanding consumer variation at both levels will help designers strategically address it. The method is now demonstrated on a child stroller.
4. CASE STUDY OF A CHILD STROLLER
This section demonstrates the methodology outlined in Section 3 as how it would be applied to the design of a child stroller (sometimes referred to as a pram or pushchair). The user characteristics are simulated with the help of information from the US Census as well as data from the 1988 Army Anthropometric Survey data set (Gordon et al., Reference Gordon, Churchill, Clauser, Bradtmiller, McConville, Tebbetts and Walker1989). The case study was created by simulating the user characteristics for 100 users (l = 100).
4.1. Design specifications for the child stroller
This section briefly outlines how the design problem was represented. The simulated user characteristics were used to generate individual design specifications. These design specifications form the basis for the character set. The stroller was represented with the following design specifications:

4.2. Evaluation of consumer variation for the child stroller
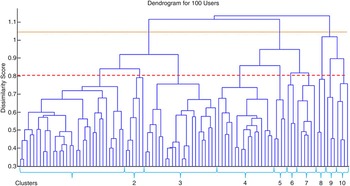
With the complete set of design specifications populated, the amount and type of user variation can now be investigated. The starting point for this is to cluster the user data using the entire character set. The character set for this case study is the set of design specifications, because all consumer characteristics are mapped to design specifications and their influence is adequately captured. The dendrogram shown in Figure 5 shows significant variation at the user level (each of the lowest branches is a single user); however, the hierarchic approach also indicates a number of subgroups. These groups can be explored at varying levels of dissimilarity. By drawing a horizontal line, designers can identify the different clusters of individuals. For example, the orange dotted line results in 3 high-level clusters. The dashed red line results in 10 clusters. The clustering identifies similarities between users that would otherwise be extremely difficult to see given the large data sets that will be used. Once clusters are identified, exploration of the data associated with these subgroups allows designers to identify what commonality exists and how consumers vary.
Dendrogram for 100 stroller users (full character set).

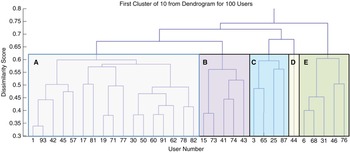
The dashed red line separates a number of lower level clusters, and these clusters will be investigated; to better understand the variation within clusters, designers can look at the design specifications. If designers want to further understand what drives the design values, they can also look at the user characteristics. Consider the first of 10 clusters created by the dashed red line (see Fig. 6 for the Cluster 1 portion of the dendrogram). Roughly one-third of all users fall into this category (32 out of 100). However, there are also subclusters within this group, with Figure 6 being broken up into 5 subclusters.
First cluster (out of 10) of stroller users (full character set).

Overall, the stroller desired by Cluster 1 users can be characterized as a high-capacity, compact stroller. The majority of the users in this cluster leverage mass transportation (though they use different types); as a result, the transportation envelope is small and the required cargo storage is high. While there is significant variation in the amount of cargo to be carried, the common requirement is that cargo transported by the stroller must be able to be stored by the stroller. Most users need to transport one or two children, though there are two individuals who desire to transport three children. Investigation of lower subclusters indicates there is general variation, with no significant apparent trends, with a few exceptions. Users in Cluster B have two older children (capable of standing) and an infant. To summarize, this cluster has commonality with regard to transportation of the stroller, transportation of cargo, and the allowable operating envelope. The single user in Cluster D requires a stroller that has minimal physical requirements to operate. Overall, the variation that needs to be addressed is primarily in the amount of cargo to be stored and the shape of the storage envelope.
The second cluster on the dendrogram (Fig. 5) is relatively similar to the first cluster. The users in this cluster also want a compact, easy to transport stroller; however, the users in this group have more storage space, and thus the storage envelope is larger. This similarity between Clusters 1 and 2 is not too surprising, because the dendrogram indicates that the two clusters eventually are merged.
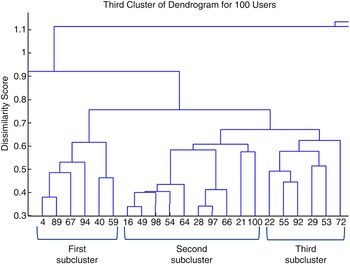
The third subcluster has large allowable operating dimensions; however, the allowable transportation envelope is relatively small, as a result of the use of mass transit. It can also be seen that there are essentially three subclusters within the third cluster (see Fig. 7). The first subcluster distinguishes itself because the children being transported are all older (they all have the capability to stand), the storage envelope is larger than the other subclusters, and the transportation dimensions are larger than the second subcluster. The second subcluster has more restrictive transportation dimensions than the other two subclusters. The third subcluster has the most restrictive storage requirements of all three subclusters.
Third subcluster (out of 10) of stroller users (full character set).

The fourth cluster also requires small operating dimensions like the first and second clusters; however, the fourth cluster has a larger allowable transportation envelope. Like the first cluster, the depth requirement for storage is small, but in the case of the fourth cluster, the other two storage dimensions are not as restrictive. From the user characteristics, it can be determined that this is because users in the fourth cluster will be storing their stroller in a hallway, hung on a door, or behind a couch.
The fifth cluster is a small cluster containing only four users. These users want a stroller with a compact operating envelope, but they have few restrictions on storage or transportation. Users in this cluster all desire the ability to position a tablet device for their use or the use of their child.
The sixth and seven clusters are relatively small, containing three and six users, respectively. These two clusters are similar on a number of attributes. No user in either cluster uses mass transit. This reduces the restrictions on transportation (and as a result, users in these clusters have large transportation envelopes). The operating dimensions are also large, because the users primarily use their strollers outdoors or at large public venues. Main differences between the two clusters focus on storage dimensions and interface dimensions. From the user characteristics, Cluster 7 is predominately female, while Cluster 6 is all male. While user gender was not part of the clustering criteria, the correlation between gender and anthropometry leads to this separation because anthropometry influences the design specifications required to realize certain affordances.
Cluster 8 contains only three users. This cluster requires the ability to transport three to four children, along with a large amount of weight. However, small operating dimensions are still desired; this is a potential conflict that may or may not be able to be resolved. In this instance, the target values may not be achievable, and designers will need to focus on achieving the acceptable operating dimensions. Ultimately, this will not be known until after concept generation has been completed.
Cluster 9 has large allowable dimensions for operating and storing, but has small transportation dimensions. This is again a result of using mass transit. Cluster 10 is similar to Cluster 9, except that it has large allowable dimensions for operating, storage, and transportation.
Upon evaluating the different clusters, it was also observed that, in general, all clusters have significant variation across the allowable physical effort. This is also true for the interface dimensions except where explicitly noted. This is likely a result of the fact that desired usage for the stroller is independent of the characteristics of the user. This observation happened initially by chance. However, in addition to looking at overall trends, designers can treat an affordance as a subproblem. Thus, investigation of the design specifications tied to a single affordance has the potential to provide information regarding the individual affordance design subproblems.
There are nine affordances for which the designers must establish solutions. Investigation of the design specifications associated with each affordance will help designers understand the variation that must be addressed, as well as the commonality, which can help reduce the required variety. Figure 8 is a dendrogram for all users when the character set is limited to the design specifications that influence the affordance of transportation of children. The users are then clustered in the same manner as was used for all design specifications; because the character set is now different, a new set of clusters is created that shows how the users vary with regard to this affordance only.
Dendrogram for all users (transportation of children character set).

The main split that separates users into the two largest clusters is determined by the allowable operating dimensions; the first large cluster is the most restrictive case. The second large cluster is a combination of the larger allowable operating envelopes. Subgroups are then determined based on the number of children and the number of spots required for lying, sitting, and standing. The total load varies within each subcluster. Thus, regardless of how designers choose to address the other variety, they will need to account for this variation in total load; a robust design approach may be the preferred option where the largest load is designed for each subcluster. For the other variation, designers can generate concepts focused on offering the desired variety.
A similar approach can be done for each affordance. Some affordances will expose significant variety as in the previous example (Fig. 8). Other affordances will have only a few well-defined clusters, as in the case for the affordance of transportation of the stroller (see Fig. 9). This dendrogram was created using the design specifications associated with transportation of the stroller as the character set. In the case of this affordance, there are four distinct clusters.
Dendrogram for all users (transportation of stroller character set).

Once designers evaluate the identified clusters for the problem level and affordance level, they can move into conceptual design well informed regarding the desired affordances and consumer variation. This case study demonstrated the benefits of evaluating consumer variation at both the artifact and the affordance levels. At the artifact level, clusters identified groups of consumers with similar design specifications; these clusters were somewhat representative of the strollers that are currently on the market. However, there is nothing specifically in the case study that would drive the method to this solution. As such, the methodology demonstrated that it is capable of evaluating a large group of consumers to identify clusters of commonality within the engineering domain. With a mature market like child strollers, evaluation may not be needed; however, the benefits from the methodology in this case would be that it removes all aspects of current solutions. Thus, the (potentially well-known) segments and their design specifications can be leveraged in conceptual design to generate new concepts to realize them. If the artifact under consideration was not mature, this analysis would provide designers with valuable insights into consumer variation. Evaluation of consumers at the artifact level also provided insights. The information that is developed is not prescriptive; however, given that this occurs prior to conceptual design, this is appropriate.
5. CONCLUSIONS AND FUTURE WORK
This paper builds off previous work in the area of affordance-based design to develop an affordance-based method for evaluating consumer variation and identifying commonality. This method acknowledges the need to assess consumer variation in both the consumer domain and the engineering domain, because both have the potential to identify unique instances of variation. Design specifications are produced for each individual based on the user's unique characteristics (knowledge base, anthropometry, etc.). As such, they formally capture the influence of consumer characteristics on the design specifications. Numerical taxonomic techniques are then applied to help designers identify commonality within the large data set, through the clustering of design specifications or user characteristics. These techniques also allow designers to visualize the variation in the user population, and serve as an attention-directing tool to help designers understand both the overall problem and the subproblems (i.e., realization of individual affordances). Evaluation of the individual clusters allows designers to understand and quantify both the commonality and the variation within the cluster. The information generated by the proposed methodology serves to help designers better understand the metalevel design problem of addressing consumer variation by assisting in the evaluation of user commonality and variation.
Future work will investigate the potential benefits of allowing overlapping clusters. Allowing an individual (or small cluster of individuals) to belong to multiple groups could provide added flexibility to designers during the concept-selection phase. The overlapping of clusters may also help identify pockets of commonality, identifying portions of the system that can be common between clusters. Currently, designers must identify this manually by comparing cluster requirements.
Natural clustering techniques aggregate or divide members by considering all attributes in the character set. Affordances that require multiple attributes (design specifications or user characteristics) to capture have the potential to skew how common users really are. For example, if one affordance is related to three design specifications and another is related to only one design specification, the commonality implied by the design specifications could be significantly different, while from an affordance standpoint, they might be the same. A potential fix for this would be to develop a weighting scheme that balances the influence on commonality.
The method will also be tested with larger and more involved design problems. This will help formalize how the range of different consumer characteristics are worked into the mapping functions, as well as test the effectiveness of the approach for larger data sets. A much broader aspect of future work is formally extending this method to assist with conceptual design, to assist with both concept generation and selection. The integration of consumer variation information into conceptual will help assist designers with the meta-design problem of selecting a design methodology (or combination of them) to address consumer variation.
Phillip Cormier is a Teaching Assistant Professor in the Department of Mechanical and Aerospace Engineering at the University at Buffalo. His research interests include using (re)configurable systems, product families, and mass customization to create innovative systems for satisfying consumer variation. He also works with design firms to incorporate advanced design theory and methodology techniques into their current practices.
Kemper Lewis is a Professor and Chair of the Department of Mechanical and Aerospace Engineering and Site Director of the National Center for e-Design as part of the National Science Foundation's Industry/University Cooperative Research Center (I/UCRC) program at the University at Buffalo–SUNY. Dr. Kemper previously served as Executive Director of the NYS Center for Engineering Design and Industrial Innovation. His research expertise is in the areas of design theory, complex system trade-offs and optimization, and decision modeling. He is a fellow of the American Society of Mechanical Engineers and has served on the National Academies Panel on Benchmarking the Research Competitiveness of the United States in Mechanical Engineering.