


INTRODUCTION
Political scientists often need representative measures of a variable for a geographic unit that available surveys don’t provide. Traditionally, researchers can either (1) combine several surveys and take the average across them or (2) model the outcome using observable covariates and then simulate at the desired geographic unit via post-stratification. The latter method has grown in popularity because of innovations in modeling the outcome, although challenges remain.
The core challenge is the curse of dimensionality. Ideally, researchers would predict the outcome using many covariates such as age, race, education, gender, and church attendance, and extrapolate the outcome to the 50 states. But it is unlikely that the researcher has sufficient observations to generate predictions for each combination of covariates in each state—combinations referred to as “cells.” For example, a nationally representative survey has many observations of 30 to 45-year-old white college-educated men living in California but only few observations of Hispanic women aged older than 65 years with a PhD living in Alaska. Estimating the coefficients for the latter cell can be improved with regularization to obtain stable estimates with good predictive accuracy.
The current gold standard for this type of extrapolation is known as multilevel regression and post-stratification, or MRP. MRP predicts an outcome using a multilevel model which borrows information from richer parts of the covariate space to yield more stable and accurate estimates where the data are sparser (Gelman and Little Reference Gelman and Little1997; Lax and Phillips Reference Lax and Phillips2009). But Buttice and Highton (Reference Buttice and Highton2013) apply MRP to 89 surveys, documenting substantial variability in MRP performance, and argue that there remains room for improvement. In one sense, this variability should not be surprising, given the generic specification applied to a diverse set of opinion data. But there are many alternatives to the multilevel model that may provide more reasonable estimates while relaxing the requirement that the researcher specify the correct linear combination of predictors (Gelman Reference Gelman2018).
In this letter, I replace the multilevel model with Bayesian additive regression trees (BART, or when combined with post-stratification, BARP) and demonstrate its superior performance across the same 89 surveys and using the same predictors discussed in Buttice and Highton (Reference Buttice and Highton2013). BARP’s benefits are two-fold. First, BARP is able to do more with less data, thanks to superior regularization. Second, BARP is fully nonparametric, relaxing the need for the researcher to determine the appropriate functional form a priori. In section 7 of the supporting information, I compare both MRP and BARP to alternative regularization methods concluding that BARP’s improvements over these alternatives are smaller but still notable. I provide an R package which implements BARP for applied researchers.
This letter’s focus on Bayesian additive regression trees is because of its best-in-class performance across comparisons on 89 surveys using only a small set of predictors, although other regularization methods are competitive along certain metrics. My findings demonstrate the opportunities provided by powerful regularization methods although these results should not be interpreted as an indictment of the multilevel model writ large. Multilevel models are competitive when correctly specified and can be augmented to include deep interactions, as demonstrated in Ghitza and Gelman (Reference Ghitza and Gelman2013) and Trangucci et al. (Reference Trangucci, Ali, Gelman and Rivers2018). In addition, there are variants of BART and other nonparametric methods that include a multilevel structure, potentially yielding additional performance gains and representing an area of future research. Nevertheless, I show that a simple application of BARP using only a handful of predictors provides significant improvements on MRP across 89 surveys, highlighting the rich opportunities provided by nonparametric regularization in the field of extrapolating survey data to smaller geographic units.
METHODS
MRP is one of many methods that estimates an opinion as a function of demographic covariates and then simulates the opinion at a certain geographic unit of interest by multiplying the resulting coefficients by the share of the population falling into each covariate cell (post-stratifying). The innovation of MRP is in how it incorporates geographic information, providing more accurate estimates in sparsely populated cells.
A common implementation of MRP models individual i’s outcome y as a function of her characteristics x 1 and x 2 and her geographic area of residence geo:
 $$\Pr \left( {{y_i} = 1} \right) = {\rm{logi}}{{\rm{t}}^{ - 1}}\left( {{\beta _0} + \alpha _{j[i]}^{{x_1}} + \alpha _{k[i]}^{{x_2}} + \alpha _{g[i]}^{geo}} \right).$$
The individual-level effects α j,k are drawn from a normal distribution, with a mean value of 0 and a standard deviation  $\sigma _{j,k}^2$ estimated by the model. The geography-level effect α g is modeled as a function of some geographic-level covariate(s) G 1 and a larger geographic random effect region.
 $$\alpha _g^{geo} \sim N\left( {\alpha _m^{region} + {\beta _1}{G_1},\sigma _{geo}^2} \right),$$
where
 $$\alpha _m^{region} \; \sim\; N\left( {0,\sigma _{region}^2} \right).$$
The multilevel model allows for flexible joint estimation of individual and geography-specific correlations, yielding superior predictive accuracy by partially pooling respondents. This ensures that (1) all individuals contribute to the estimation of the individual-covariate model and that (2) geographic differences that persist after modeling individual-level predictors are not discarded. The resulting model is then used to predict opinions for each cell in census data, and geography-level estimates are calculated as the weighted average of these cells’ predictions with population shares as weights.
Despite numerous validation studies that demonstrate MRP’s superior performance over simple disaggregation (Ghitza and Gelman Reference Ghitza and Gelman2013; Lax and Phillips Reference Lax and Phillips2009; Warshaw and Rodden Reference Warshaw and Rodden2012), a comprehensive review by Buttice and Highton (Reference Buttice and Highton2013) introduces a note of caution. Across 89 surveys, the authors document evidence of substantial variation in MRP performance, finding that the correlation between MRP predictions and true state values is below 0.50 in 33 cases. On the one hand, this is an unfair test of MRP since the authors apply a naive combination of covariates uniformly across 89 surveys. But on the other hand, it may not always be the case that the researcher can easily identify and collect prognostic covariates, or that she can specify the correct functional form a priori.
Nonparametric methods can relieve the researcher of correctly determining the functional form and provide better regularization for estimating relationships in sparsely populated cells. Although these methods are not a silver bullet, I demonstrate that they can do more with less. In this letter, I focus on Bayesian additive regression trees (BART or, when combined with post-stratification, BARP) because of its well-documented predictive capabilities (see Chipman, George, and McCulloch Reference Chipman, George and McCulloch2010; Linero Reference Linero2017), intuitive connection with the post-stratification stage, and rich descriptive results on covariate importance and partial dependence. I compare BARP’s performance with several alternative regularization methods in Section 7 of the Supporting Information, finding that BARP is consistently the best-in-class method in terms of accuracy and is among the best methods in terms of correlation across geographic units.
BART estimates a function f that predicts an outcome using covariates: y = f(x). The unknown function f is approximated by h(x), which is a sum of decision trees. Each decision tree Tj divides the data based on a splitting rule designed to separate observations according to the outcome. The tree proceeds to move recursively across the covariate space and continues until a stopping rule is satisfied, leaving small groups of observations or “leafs.” Each leaf has a parameter value μ b which captures E(Y|x), and are collectively denoted as M. These parameters are assigned to x via g(x; T, M). The full expression that approximates the unknown function f is
 $$y = {{\limits \sum_____{\hskip-7pt j}} {{\hskip-2pt g_j}} \left( {x;{T_j},{M_j}} \right) + \varepsilon ,\quad \quad \varepsilon \; \sim\; N\left( {0,{\sigma ^2}} \right).$$
BART uses Bayesian priors on the structure of the model and on the parameters in the terminal nodes. These priors ensure that no tree is unduly influential, thereby avoiding the overfitting problems facing more brittle tree-based methods. Estimation proceeds through a backfitting algorithm that generates a posterior distribution for all parameters. Draws from this posterior first propose a change to the structure that further protects BART from overfitting.
BARP provides two improvements over MRP. First, BARP allows for deep interactions between prognostic covariates and additive effects without requiring the researcher to specify these functional forms ex ante. Second, BARP provides superior regularization via the ensemble of weak trees that better insulates predictions from the brittleness associated with sparse data. The resulting rich model—built by identifying break points in the covariate space that most cleanly separate individuals by the outcome—maps intuitively on to the share of the population falling into each covariate bin in the post-stratification stage.Footnote 1 In addition, BART provides partial dependency estimates and variable inclusion proportions which may be of substantive interest to applied researchers. BARP can be modified to predict binary, categorical, and continuous outcomes. More details can be found in Section 8 in the Supporting Information.
DATA
To evaluate the relative performance of BARP and MRP, I apply both methods to the same 89 opinions used in Buttice and Highton (Reference Buttice and Highton2013). These opinions range from gay rights to stem cell research to gun control to immigration. They are drawn from five large surveys, including three National Annenberg Election Studies and two Cooperative Congressional Election Studies, with sample sizes for each of the 89 items ranging from 25,000 to more than 60,000 observations. Following Buttice and Highton (Reference Buttice and Highton2013), I treat the disaggregated state averages as the target benchmark and run both MRP and BARP without survey weights, using the covariate strata proportions in the full survey to post-stratify.Footnote 2
I randomly sample the data with replacement, extracting small (1,500), medium (3,000), and large (4,500) sample sizes. Using these random samples, I predict state-level opinion with both MRP and BARP and compare their predictions with the “true” values in terms of both accuracy and interstate correlation. I repeat this process 200 times to assess average performance and variability for both methods. In all comparisons, I implement the multilevel model with the R package lme4, using replication materials provided by Buttice and Highton (Reference Buttice and Highton2013), in which opinions are predicted using a combination of individual-level (sex, race, age, and education) and state-level (presidential vote and religious conservatism) covariates. I use the same covariates in my implementation of BARP, which is built on the bartMachine package (Kapelner and Bleich Reference Kapelner and Bleich2013), as well as the alternative regularization methods discussed in Section 7 of the Supporting Information, implemented using the SuperLearner package (Polley and Van der Laan Reference Polley and Van der Laan2015).
Running these simulations yields a vector of 200 predicted opinions for each state and each method. I characterize the predictive accuracy of each method by comparing these predictions to the true state values in terms of mean absolute error (MAE) and interstate correlation—defined as the correlation between predicted state values and true values in a given simulation. For simulation i predicting opinion y in state s using method m, the MAE (µ) and interstate correlation (ρ) can be written as follows:
 $$\mu _s^m = {1 \over {200}}\sum\nolimits_______{\hskip-7pt i}^^^{\hskip -10pt200} {abs} \left( {y_i^m - y_s^{true}} \right),$$
 $${\rho ^m} = {1 \over {200}}\sum\nolimits_______{\hskip-7pt i}^^^{\hskip -10pt200} {cor} \left( {{\bf{y}}_i^m , {{\bf{y}}^{true}}} \right),$$
where the bold y represents a vector of opinions, one for each state.
These measures capture two important components of opinion data’s construct validity that are of interest to public opinion scholars. MAE captures how accurately each state’s true average opinion is measured. An example of a research question requiring an accurate measure of opinion might be “do states implement policies favored by more than 50% of their population?,” as is commonly the case in studies of congruence, such as Lax and Phillips (Reference Lax and Phillips2012). Interstate correlation captures the relative sentiment across states. An example of a research question related to the latter characteristic might be “do more pro-[OPINION] states elect more pro-[OPINION] Senators?,” as is commonly the case in studies of responsiveness, such as Bartels (Reference Bartels1991).
The results summarized below compare BARP and MRP using these measures. I characterize the substantive impact of method choice by replicating the main results of Hare and Monogan (Reference Hare and Monogan2018) in Section 4 of the Supporting Information, demonstrating that BARP yields more precisely estimated nulls and more significant findings.
RESULTS
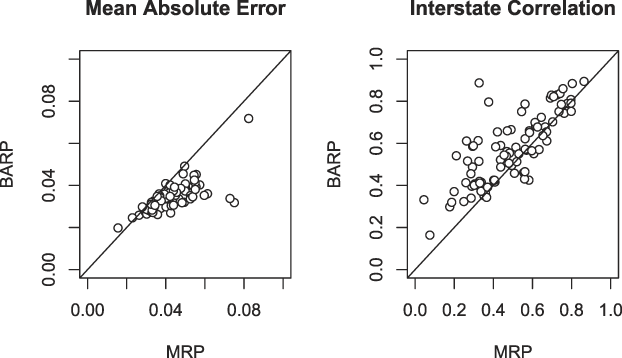
Figure 1 plots the average MAE and interstate correlation across 200 simulations for each of the 89 surveys with sample sizes set to 1,500. Overall, BARP outperforms MRP in terms of both mean absolute error (left plot) and interstate correlation (right plot), as illustrated by points lying below (above) the 45° line for mean absolute error (interstate correlation). Substantively, these plots show that BARP yields predictions of state-level opinions that are closer to the true values and more consistently correlated across simulations. But there is striking evidence that each method’s errors are correlated across surveys, suggesting that BARP is better insulated from prediction errors in more challenging contexts.
Predictive Accuracy
Notes: Predictive accuracy of BARP (y-axes) versus MRP (x-axes) across 89 surveys as measured by mean absolute error (left panel) and interstate correlation (right panel).

I test two explanations for BARP’s superior performance. The first explanation is that BARP’s flexibility better insulates it from specification error. The results above were generated by including the same naive predictors for all 89 surveys, raising the possibility that the errors are due to poorer fits of the particular combination of individual- and state-level covariates in certain contexts. BART’s recursive partitioning of the covariate space may be better suited to overcoming weak predictors than MRP.
To test this explanation, I intentionally “mis-specify” the model by omitting the two state-level covariates: percent religious conservative and previous presidential vote share.Footnote 3 I recalculate the mean absolute error and interstate correlation metrics with these covariates removed and evaluate how much more poorly MRP and BARP perform on each survey via a t-test. Formally:
 $${t^\theta } = {{\bar{\theta } - \bar{\theta }\prime } \over {{\sigma _{\bar{\theta } - \bar{\theta }\prime }}}},$$
where θ represents either the MAE (µ) or interstate correlation (ρ), the ′ superscript indicates the specification with the state-level covariates omitted, and I drop the method m index for visual clarity. If the state-level covariates are important to model accuracy, these differences should be negative for MAE, positive for interstate correlation, and statistically significant.
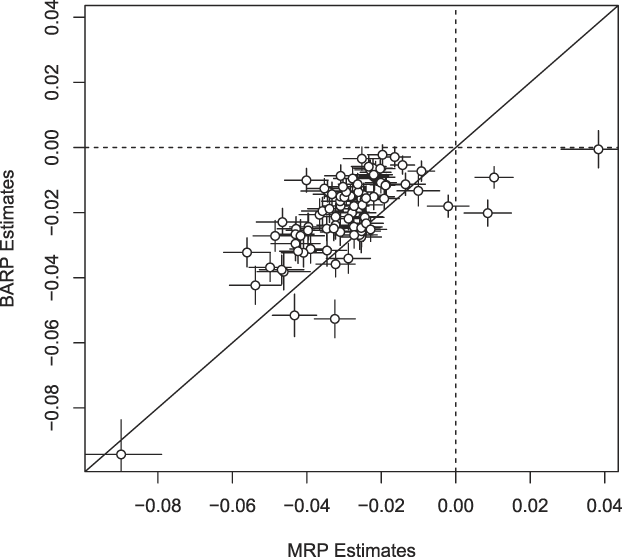
Figure 2 plots these t-test coefficient estimates—which capture the difference in performance between the full and misspecified implementations—for both MRP (x-axes) and BARP (y-axes) as points. The figure illustrates that BARP is substantially more insulated from misspecification, with points lying closer to the horizontal zero line than the vertical zero line in both plots. The 95% confidence intervals, visualized by horizontal and vertical bars, confirm that the performance penalty associated with removing state-level covariates is statistically significant across the majority of surveys. (For differences that cross the null, implying that the missing covariates actually improve method performance, the confidence intervals contain zero.)
Sensitivity to Misspecification
Notes: Difference-in-means estimates (points) and confidence intervals (lines) indicating how much better MRP (x-axes) and BARP (y-axes) perform when the two state-level covariates are included. Negative values on the left-hand plot reflect smaller absolute errors in the full specification, whereas positive values on the right-hand plot reflect larger interstate correlations in the full specification.

The second explanation is that BARP can do more with less data, reflecting its superior regularization abilities. To test this explanation, I regress each method’s mean absolute error on the observed state sample size across the 200 simulations for each survey and plot the coefficients for both MRP (x-axis) and BARP (y-axis) in Figure 3. Again, there is clear evidence that BARP’s performance is less sensitive to the number of observations in a given state (points closer to the horizontal axis), consistent with its superior regularization capabilities.
Method Sensitivity to State Sample Size
Notes: Coefficients (points) for each survey measuring the relationship between mean absolute error and the number of observations in the state for BARP (y-axis) and MRP (x-axis). Negative values indicate that more observations in a state improve improve mean absolute error by the units on the x and y-axes. Two standard errors indicated by horizontal and vertical lines. Values closer to zero (dashed lines) reflect greater insulation from data sparsity.

Despite BARP’s superior performance across 89 surveys with a general set of covariates, there is striking evidence that both BARP and MRP struggle to predict opinion accurately on certain surveys and topics, as illustrated by the positive relationship between the points on the scatter plots in Figure 1. In Section 3 of the Supporting Information, I dig deeper into the data characteristics that drive the variation in method performance. I conclude that MRP and BARP perform almost equally well when the data characteristics are most favorable. In addition, I find that both methods are sensitive to the strength of state-level predictors, echoing the conclusions drawn by Lax and Phillips (Reference Lax and Phillips2009), Hanretty, Lauderdale, and Vivyan (Reference Hanretty, Lauderdale and Vivyan2018), and Buttice and Highton (Reference Buttice and Highton2013). These results indicate that BARP can do more with less data, and do better with worse covariates. But BARP is not immune to data quality issues, nor is it appreciably better than a multilevel model when the researcher has been careful in obtaining good data, selecting the appropriate covariates, and defining the appropriate linear specification.
CONCLUSION
As a discipline, political science is typically more concerned with the substantive implications of regression models than optimizing for predictive accuracy. In the case of extrapolating public opinion, however, predictive accuracy is paramount. In this context, robust regularization methods like Bayesian additive regression trees (BART or, when combined with post-stratification, BARP) can improve on multilevel models (MRP) by implementing fully nonparametric regularization techniques.
In this letter, I have demonstrated the benefits of BARP in terms of mean absolute error and interstate correlation. I find that BARP’s superior performance derives from (1) greater insulation from specification errors and (2) the ability to do more with less data. BARP also exhibits better performance when compared to other machine learning methods that are optimized for predictive accuracy, although the margin of these improvements is smaller than when compared to MRP. To facilitate adoption of the BARP method, I provide an R package that implements BARP.
The improvements to both prediction accuracy and interstate correlation are nontrivial. But these results should not be interpreted as an indictment of multilevel models writ large, nor should BARP be understood as a silver bullet. A properly specified multilevel model is competitive with BARP. Furthermore, both MRP and BARP struggle in similar contexts. The first-best solution is to obtain richer survey data of real individuals (see Caughey and Warshaw Reference Caughey and Warshaw2019 for a discussion of how coefficient magnitudes are impact by regularization). In addition, the researcher should take care when choosing individual- and geography-level covariates, and compare predictions made using MRP with those generated by other methods such as BARP.
Nevertheless, my analysis suggests that nonparametric regularization methods provide reasonable estimates in generic settings, with BARP emerging as the best performer. One avenue of future research might focus on variants of Bayesian additive regression trees that embed a multilevel component, likely providing further improvements as the best of both worlds.
SUPPLEMENTARY MATERIAL
To view supplementary material for this article, please visit https://doi.org/10.1017/S0003055419000480.
Replication materials can be found on Dataverse at: https://doi.org/10.7910/DVN/LMW871.





Comments
No Comments have been published for this article.