

Implications
Adaptation is necessary to respond adequately to climate change, food security and livelihoods needs, and natural resources conservation. The paper highlights the paucity of comprehensive data on the adaptive capacity of breeds and their management but also gives a glimpse of the range of options available in the genetic diversity of the world's livestock. Particularly in today's extreme environments, adaptation traits including tolerance of climatic extremes and adaptation to poor-quality diets can be found on which targeted search for adaptation traits could focus. Better characterization of locally adapted breeds will be a key for adaptation breeding or exchange of genetics.
Introduction
Between 1980 and 2010, the livestock sector has seen impressive production increases, with global output growing by more than 4% annually. The global trends mask high variation in productivity between livestock production systems, both within and between regions. The increase in livestock production in developing countries has come from increases in animal numbers rather than productivity increases. The variations in productivity are larger in ruminants than in monogastric species for which industrial systems prevail in both developed and developing regions. The most revolutionary change is in poultry production, which has an annual growth rate of more than 10%; its share in world meat production increased from 13% in the mid-1960s to 35% in 2010 (FAO, 2010a; FAOSTAT, 2013).
The growing demand for animal food products is met increasingly through industrial systems. Extrapolating the figures of Steinfeld et al. (Reference Steinfeld, Wassenaar and Jutzi2006), industrial systems utilizing sophisticated technology and based on internationally sourced feed and animal genetics produced about 55% of pork, 68% of eggs and 74% of poultry meat globally in 2009. This trend was driven over recent decades by cheap grain and cheap energy, technological advances in animal breeding, biotechnology, feeding and transport, and a policy environment that favoured intensive production (FAO, 2010a). There was a general shift in relative importance from pasture-based to concentrate-dependent diets, from ruminant to monogastric species, from multifunctional to commodity-specific production, from local to globally integrated markets and from dispersed to clustered production.
The global livestock sector is also changing in terms of its contribution to poverty alleviation and income growth. Traditional livestock systems still contribute to the livelihoods of 70% of the world's rural poor (FAO, 2011a). Despite the increasing share of commercial livestock production in global food supply, Herrero et al. (Reference Herrero, Thornton, Notenbaert, Wood, Msangi, Kruska, Dixon, Bossio, van de Steeg, Freeman, Li, Rao and Gerard2012) stress the role of smallholders and mixed crop–livestock systems for food security; they estimate that they produce 75% of the milk and 60% of the meat in developing countries and will continue to be the backbone of pro-poor agricultural growth in developing countries to 2030. The non-food uses of livestock, such as draught power and asset functions, are in decline and are being replaced by modern substitutes. While livestock play multiple roles in the livelihoods of the poor, the poor are vulnerable to environmental hazards and zoonotic diseases (FAO, 2010a; Grace et al., Reference Grace, Mutua, Ochungo, Kruska, Jones, Brierley, Lapar, Said, Herrero, DucPhuc, Bich Tao, Akuku and Ogutu2012).
The current diversity within farm animal species is the result of a long history of human practice; the diversity of breeds is thus closely related to the diversity of production systems and cultures. The breed concept is applied to groups of animals that have similar characteristics that depend on geographical area and origin. The term ‘breed’ originated in Europe and does not have a universally accepted biological or legal definition. It is now applied widely in developing countries, but it tends to refer to a socio-cultural concept rather than a distinct physical or genetic entity. FAO uses a broad breed definition that accounts for social, cultural and economic differences between animal populations.
The State of the World's Animal Genetic Resources for Food and Agriculture (FAO, 2007a) describes the link between livestock biodiversity and food security. In June 2012, 10 712 mammalian and 3482 avian national breed populations were recorded in FAO's Global Databank for Animal Genetic Resources within the Domestic Animal Diversity Information System (DAD-IS). These populations belong to a global total of 8262 reported breeds, 7202 of which are local breeds (reported by one country only) and 1060 of which are transboundary breeds (reported by more than one country; FAO, 2012a). About two-thirds of reported breeds are currently found in developing countries.
Breed diversity has always been dynamic; new breeds have emerged and others have disappeared as environments and societies have changed. Livestock genetic diversity today is rapidly declining globally as specialization in plant and animal breeding and the harmonizing effects of globalization advance (FAO, 2007a and 2009; Convention on Biological Diversity (CBD), 2010; FAO, 2012a). One reason for this is the trade-offs that exist between genetic management at farm or herd level and (a) economic development goals, (b) broader environmental goals and (c) conservation of breeds in the interest of society. These trade-offs are described in more detail in Hoffmann (Reference Hoffmann2011). Population data for 48% of avian and 57% of mammalian breeds are recorded in DAD-IS. According to 2012 data, 1881 breeds (22%) are classified as being at risk and 628 breeds (8%) are classified as extinct. For another 34% of breeds, risk status is unknown (FAO, 2012a). In comparison, the IUCN Red List reports 14% of species with insufficient data and 36% of species threatened with extinction (CBD, 2010).
Genetically diverse livestock populations provide society with a greater range of options for meeting future challenges. They allow farmers to select stocks or develop new breeds in response to changing conditions, including climate change, new or resurgent disease threats, new knowledge of human nutritional requirements, and changing market conditions or changing societal needs. If they are lost, the options for future generations will be severely curtailed.
The paper consists of two parts. On the basis of a literature review, the first part discusses challenges associated with climate change, food security and other drivers of change in livestock production. Drawing on recent discourse in ecology, it presents a framework for assessing livestock species’ and breeds’ vulnerability to climate change. The second part draws on an analysis of data on breed qualities obtained from DAD-IS to explore the adaptive capacity and resilience harboured in today's breed diversity.
Climate change and livestock – a literature review
Livestock, food security and the environment – the global context
World population is projected to surpass 9 billion people by 2050 and 10 billion in 2100 (United Nations Department of Economic and Social Affairs (UN DESA), 2013). Most of the additional people will live in developing countries, while the population of developed regions is expected to remain stable or decrease slightly. Some of the fastest population growth is predicted in areas that are highly dependent on agriculture and already have high rates of food insecurity, mostly in sub-Saharan Africa and South Asia (Alexandratos and Bruinsma, Reference Alexandratos and Bruinsma2012). Average global population density will increase from 51 persons/km2 in 2010 to 74 persons/km2 in 2100, with the highest values in Asia (144) and Africa (118). However, the rural population will decline from 3.4 billion or 50% of the global population in 2012 to 2.9 billion or 30% in 2050 (FAOSTAT, 2013) and rural–urban income gaps will decline.
FAO predicts that also average per-capita food consumption will increase globally. Agricultural production in the next 30 years will therefore present unprecedented challenges; it will need to increase by 60% by 2050 (Bruinsma, Reference Bruinsma2011). Globally, meat consumption per capita per year is projected to increase from 41 kg in 2005 to 52 kg in 2050, reaching an average of 44 kg in developing countries and 95 kg in developed countries (OECD-FAO, 2009; FAO, 2010a; Bruinsma, Reference Bruinsma2011). Growth rates in overall food demand are expected to decelerate as a consequence of the slowing rate of population growth and because a growing share of population will reach medium to high levels of food consumption (Bruinsma, Reference Bruinsma2011).
Increasing urbanization and incomes in developing countries trigger a ‘nutrition transition’ that results in dietary changes from staples to higher-value foods such as fruit, vegetables and livestock products. Disaggregating future demand, FAO (2011b) expect that the majority of demand growth will be driven by urban rather than rural populations and by changing consumption patterns rather than population growth. These demand trends will require production intensification and structural changes to the supply side of the livestock sector.
The decline in the rural population implies that areas where production cannot easily be intensified, such as mountains or rangelands, may continue to host low-external input livestock production in the coming decades, unless such areas are transformed to livestock-free nature reserves. Pastoralists and smallholders as managers of such areas will need support if they are to take advantage of the opportunities provided by an expanding livestock sector.
The degree of smallholder transformation depends on a variety of factors; as a general trend, monogastric production tends to move towards industrial systems faster than dairy production in many developing countries. However, for some systems and commodities, there is a potential for gradual improvement of productivity and growth of smallholder systems (FAO, 2010a and 2010b; Tarawali et al., Reference Tarawali, Herrero, Descheemaeker, Grings and Blümmel2011). Smallholders will also need support in managing the risks associated with liberalized markets, increasing competition and closer linkages to more modern and longer value chains (FAO, 2011a).
Satisfying the growing demand for animal products while at the same time sustaining productive natural resources will be more difficult than in the past and is one of the major challenges for agriculture. Many countries, especially in Africa, and small countries in Asia and Latin America are already struggling to adapt to environmental degradation and climate variability. Growth of crop yields has slowed over the past decade and there are concerns that the lower growth rates, together with limitations to the expansion of the area of arable land and climate change, will mean that production will not be sufficient to meet increased requirements. The availability of stover and crop by-products may become key constraints in ruminant systems by 2030 (Herrero et al., Reference Herrero, Thornton, Notenbaert, Wood, Msangi, Kruska, Dixon, Bossio, van de Steeg, Freeman, Li, Rao and Gerard2012).
Over the past decades, increases in agriculture production have been accompanied by land and water overuse and degradation, overgrazing and deforestation, loss of wild and agricultural biodiversity and degradation of ecosystems, particularly with respect to their regulating and supporting services (Millenium Ecosystem Assessment (MEA), 2005; FAO, 2011d). Competition for natural resources is expected to grow, driven by expanding and intensifying agricultural sectors, but also by growing urban and industrial demand.
The environmental footprint of agriculture, and particularly livestock production – livestock being at a high position in the food web, with associated conversion losses – has raised concerns in global assessments (e.g. MEA, 2005; FAO, 2006a and 2010a; UNEP, 2007, 2010 and 2011; Rockström et al., Reference Rockström, Steffen, Noone, Persson, Chapin, Lambin, Lenton, Scheffer, Folke, Schellnhuber, Nykvist, de Wit, Hughes, van der Leeuw, Rodhe, Sörlin, Snyder, Costanza, Svedin, Falkenmark, Karlberg, Corell, Fabry, Hansen, Walker, Liverman, Richardson, Crutzen and Foley2009; Foresight, 2011; McKinsey Global Institute, 2011; Westhoek et al., Reference Westhoek, Rood, van den Berg, Janse, Nijdam, Reudink and Stehfest2011) and in many studies (e.g. Pelletier and Tyedmers, Reference Pelletier and Tyedmers2010; Kastner et al., Reference Kastner, Ibarrola Rivas, Koch and Nonhebel2012). Livestock production is the biggest land user; it currently uses about 30% of the earth's entire land surface. This is mostly permanent pasture; but 33% of global arable land is used to produce livestock feed. Fischer (Reference Fischer2011) analyzed livestock feed energy balances and found that in 2000 about 55% to 60% of available grassland biomass globally was required for animal feeding. Mekonnen and Hoekstra (Reference Mekonnen and Hoekstra2010) highlighted the water footprint of livestock production on a global scale. A further concern is the sector's contribution to climate change and pollution. The projected need for additional cropland and grassland areas implies further risks of deforestation and other land-use changes such as conversion of semi-natural grasslands. This will most likely not only lead to loss of biodiversity, but also to increasing greenhouse gas (GHG) and nitrogen emissions.
Pelletier and Tyedmers (Reference Pelletier and Tyedmers2010) recommended a shift in production from ruminants towards poultry and intensive systems in order to keep the livestock sector's externalities within the sustainability boundary conditions proposed by Rockström et al. (Reference Rockström, Steffen, Noone, Persson, Chapin, Lambin, Lenton, Scheffer, Folke, Schellnhuber, Nykvist, de Wit, Hughes, van der Leeuw, Rodhe, Sörlin, Snyder, Costanza, Svedin, Falkenmark, Karlberg, Corell, Fabry, Hansen, Walker, Liverman, Richardson, Crutzen and Foley2009). However, when considering GHG emissions from enteric fermentation, account should be taken not only of the gross efficiency of converting feed inputs to human food, but also of differences in species’ ability to use forages and by-products that cannot otherwise be used by humans. Gill and Smith (Reference Gill and Smith2008) propose using ‘human edible return’ as another indicator to assess livestock efficiency. Recalculating efficiencies on the basis of human-edible protein balance indicate higher efficiencies for ruminants and grassland-based systems than for monogastric animals or concentrate-based systems (Council for Agricultural Science and Technology (CAST) 1999; Gill et al., Reference Gill, Smith and Wilkinson2010; FAO, 2011a). More research also needs to be done on the role ecosystem services play in improving or restoring agricultural production systems or where possible ‘tipping points’ of ecosystem functions may occur. Methods to assess and capture the value of ecosystem services need to be further developed. One important ecosystem service is C-sequestration in grasslands, which may partially offset GHG emissions from other components of the production process (Smith et al., Reference Smith, Martino, Cai, Gwary, Janzen, Kumar, McCarl, Ogle, O'Mara, Rice, Scholes, Sirotenko, Howden, McAllister, Pan, Romanenkov, Schneider and Towprayoon2007). Improved rangeland management could also be important for enhancing green water cycles.
Limited land availability for food production, the inefficiencies inherent in biological feed conversion and the recent attention to climate change have triggered a discourse on the importance of consumption and diets (UNEP, 2010 and 2011). Reductions in animal food consumption and in food losses and waste are proposed, mostly for countries and population groups with already high levels of meat consumption (Westhoek et al., Reference Westhoek, Rood, van den Berg, Janse, Nijdam, Reudink and Stehfest2011; Kastner et al., Reference Kastner, Ibarrola Rivas, Koch and Nonhebel2012).
Climate change and the livestock sector
Climate change comes as an additional factor affecting a livestock sector that is already highly dynamic and faces many challenges. The effects of climate change will be most acute in developing countries, where the increase in food demand is expected to be greatest and occurs at a rate faster than increases in production (FAO, 2012c), and where climate change is projected to have its greatest impact. Climate change and the specific associated challenges (high temperatures, modified precipitation regimes, increased frequencies of extreme events, disruptions to feed supplies, disease outbreaks, etc.) are likely to create a number of problems in many areas of animal husbandry (housing, feeding, health care, etc.). In parts of the world it will increase the problem of heat stress in livestock and require adjustments to husbandry and production strategies. Hoffmann (Reference Hoffmann2010a) and FAO (2011c) give a comprehensive overview on the possible impacts of climate change for animal genetic diversity, discussing the relative advantages of different species and breed groups for climate change adaptation and mitigation and differences between developing and developed countries. Thornton (Reference Thornton2010), Hoffmann (Reference Hoffmann2010b) and Gauly et al. (Reference Gauly, Bollwein, Breves, Brügemann, Dänicke, Das, Demeler, Hansen, Isselstein, König, Lohölter, Martinsohn, Meyer, Potthoff, Sanker, Schröder, Wrage, Meibaum, von Samson-Himmelstjerna, Stinshoff and Wrenzycki2013) illustrate the complex interactions between livestock and the environment. Climate change may threaten the sustainability of many livestock production systems and their associated breeds and dependent communities. For example, Jones and Thornton (Reference Jones and Thornton2009) predict that livestock keeping will replace cropping in today's marginal mixed crop–livestock systems as they become ecologically and socially more marginal. Seo and Mendelsohn (Reference Seo and Mendelsohn2008) predict that ruminant numbers in rangelands will increase as long as there is sufficient precipitation to support vegetation growth.
On the positive side, the agricultural sectors offer significant adaptation and mitigation potential (Smith et al., Reference Smith, Martino, Cai, Gwary, Janzen, Kumar, McCarl, Ogle, O'Mara, Rice, Scholes, Sirotenko, Howden, McAllister, Pan, Romanenkov, Schneider and Towprayoon2007). There are potential means by which the sustainable use of animal genetic resources can be integrated within climate change mitigation strategies. Work is emerging on assessing the potential of genetics in reduction of GHG emissions in dairy and beef production of some developed countries (Alford et al., Reference Alford, Hegarty, Parnell, Cacho, Herd and Griffith2006; Gauly et al., Reference Gauly, Bollwein, Breves, Brügemann, Dänicke, Das, Demeler, Hansen, Isselstein, König, Lohölter, Martinsohn, Meyer, Potthoff, Sanker, Schröder, Wrage, Meibaum, von Samson-Himmelstjerna, Stinshoff and Wrenzycki2013; König et al., Reference König, Brügemann and Pimentel2013).
Indirect impacts of climate change may manifest themselves via ecosystem changes that alter the availability of feed resources in land-based production systems or the distribution or epidemiology of animal diseases. Industrial producers can adapt to variations in feed supply by drawing on global feed markets. Traditional production systems tend to have the advantage of keeping animals that are well adapted to harsh conditions and that can thrive without the use of expensive inputs. In many such systems, the livestock keepers are also experienced in dealing with extreme and fluctuating environmental conditions. Nonetheless, their reliance on local natural resources makes them vulnerable to local disasters or problems such as declines in the quantity or quality of forage or the emergence of unfamiliar diseases or parasites. For rangelands, the major uncertainties in quantifying climate change impacts are the CO2 fertilization effect on forage production and quality, species assemblages (competition between grass, shrubs, trees) and the role of woody plants (McKeon et al., Reference McKeon, Stone, Syktus, Carter, Flood, Ahrens, Bruget, Chilcott, Cobon, Cowley, Crimp, Fraser, Howden, Johnston, Ryan, Stokes and Day2009). Changes in fodder quality and diet composition also affect digestibility and rumen functioning (Gauly et al., Reference Gauly, Bollwein, Breves, Brügemann, Dänicke, Das, Demeler, Hansen, Isselstein, König, Lohölter, Martinsohn, Meyer, Potthoff, Sanker, Schröder, Wrage, Meibaum, von Samson-Himmelstjerna, Stinshoff and Wrenzycki2013).
The link between disease risks from various pathogens and climate change has been increasingly recognized, but precise effects of altered disease patterns are difficult to predict. Climate change may affect the spatial distribution of disease outbreaks, and their timing and intensity. Expansion of the range of a pathogen or vector does not necessarily result in wider disease transmission (De la Rocque et al., Reference De La Rocque, Hendrickx and Morand2008); for some diseases, the effects of risk factors, such as land-use and habitat changes, the movement of human and animal populations and drug and pesticide resistance, will remain more important than climate change. The risk of vector-borne diseases will display great local spatial variation and may be more affected by the abundance of competent hosts than climate change (Rogers and Randolph, Reference Rogers and Randolph2006; Randolph, Reference Randolph2009). Hoberg et al. (Reference Hoberg, Polley, Jenkins and Kutz2008) and Patterson and Guerin (Reference Patterson and Guerin2013a and Reference Patterson and Guerin2013b) review predicted responses of complex host–pathogen systems to climate change.
Rapid spread of pathogens or even small spatial or seasonal changes in disease distribution may expose livestock populations that lack resistance or acquired immunity to new diseases. The expected increased and often novel disease pressure will favour genotypes that are resistant or tolerant to the diseases in question (Gauly et al., Reference Gauly, Bollwein, Breves, Brügemann, Dänicke, Das, Demeler, Hansen, Isselstein, König, Lohölter, Martinsohn, Meyer, Potthoff, Sanker, Schröder, Wrage, Meibaum, von Samson-Himmelstjerna, Stinshoff and Wrenzycki2013). Beyond the individual-animal level, the contribution of genetic diversity in populations to the dynamics of pathogen transmission needs further investigation. Mathematical models (Springbett et al., Reference Springbett, MacKenzie, Woolliams and Bishop2003) and evidence from plants (Mitchell et al., Reference Mitchell, Tilman and Groth2002) and animals (Morand and Guégan, Reference Morand and Guégan2008) indicate that high species diversity and high genetic diversity within populations affect both the probability of the occurrence of epidemics and their outcome. This highlights the need to maintain biodiversity in agricultural production systems and landscapes (Hogerwerf et al., Reference Hogerwerf, Wallace, Ottaviani, Slingenbergh, Prosser, Bergmann and Gilbert2010).
Before 2007, there was wide agreement between different models at the global aggregate level that climate change will cause only modest changes to agricultural land use, production and food consumption in the period up to 2050, mostly because of the compensating effect of increased atmospheric CO2 concentrations (CO2 fertilization effect; Fischer, Reference Fischer2011). These models do not, however, take into account climate variability, which is expected to increase over the coming decades and is already an important destabilizing factor. Already during the last decade, a high number of extreme heat waves affected major food crop growing by drought (Fischer, Reference Fischer2011; World Bank, 2012). McKeon et al. (Reference McKeon, Stone, Syktus, Carter, Flood, Ahrens, Bruget, Chilcott, Cobon, Cowley, Crimp, Fraser, Howden, Johnston, Ryan, Stokes and Day2009) observed that in Australia, current year-to-year variability exceeds projected changes in temperature and rainfall, but that climate change is projected to affect forage and animal production and ecosystem functioning.
The models developed by Fischer (Reference Fischer2011) assume full agronomic adaptation by farmers, whereas McKeon et al. (Reference McKeon, Stone, Syktus, Carter, Flood, Ahrens, Bruget, Chilcott, Cobon, Cowley, Crimp, Fraser, Howden, Johnston, Ryan, Stokes and Day2009) foresee challenges for important managerial and enterprise adaptations even in a developed country such as Australia. Vermeulen et al. (Reference Vermeulen, Campbell and Ingram2012) note that low-income producers will be more vulnerable to climate change owing to their limited ability to invest in adaptive institutions and technologies.
More recent models predict higher impacts of climate variability on local and regional crop yields and production in the second half of this century (Fischer, Reference Fischer2011). Lobell et al. (Reference Lobell, Schlenker and Costa-Roberts2011) found that over the past 30 years, temperature increases in some countries already offset a large part of the increases in average maize and wheat yields that occurred because of technological developments, CO2 fertilization and other factors.
Despite the intentions of the United Nations Framework Convention on Climate Change to keep global warming below a 2°C increase above pre-industrial temperatures, a global mean temperature increase of 4°C could occur before 2100 if the current emission pledges and mitigation commitments remain unmet (World Bank, 2012). The World Economic Forum (2013) predicts that ‘This would likely lead to negative impacts including an increase in the frequency of high-intensity tropical cyclones, inundation of coastal cities as sea levels rise, and increased drought severity in several regions. Together, the effects would not only mean significant economic losses but also mass displacement of populations, rising food insecurity and aggravated water scarcity’.
Climate change and biodiversity
So far, anthropogenic drivers such as habitat fragmentation and land-use change, pathogens and invasive alien species have been the main causes of biodiversity losses (MEA, 2005; CBD, 2010). Projections for the 21st century indicate a continuation of existing trends, with accelerated loss of habitats and species, and changes in the distribution and abundance of species and biomes, all of which lead to degradation of the ecosystem services humanity depends upon CBD (2010). Anthropogenic disturbances may still exceed the effects of climate change at local level.
Most assessments of climate change impact on wild and agricultural biodiversity have been based on range, climate envelope or empirical niche models, mostly centered on certain species (Lane and Jarvis, Reference Lane and Jarvis2007; Williams et al., Reference Williams, Shoo, Isaac, Hoffmann and Langham2008; Dawson et al., Reference Dawson, Jackson, House, Prentice and Mace2011). Models rarely deal with both habitat change and population dynamics (Keith et al., Reference Keith, Akcakaya, Thuiller, Midgley, Pearson, Phillips, Regan, Araujo and Rebelo2008). Even for crop species with well-known environmental envelopes, the low resolution of available data and the complexity of agricultural production systems make it difficult to model the effects of climate change (Jarvis et al., Reference Jarvis, Lane and Hijmans2008). Impacts of global change drivers on wild biodiversity are hard to predict, due to the many feedbacks and time-lag effects that lead to ‘tipping points’. Impacts are therefore difficult to control and slow and expensive to reverse (CBD, 2010). Knowledge about changes in wild biodiversity, from forages over pathogens to rumen microbes, are important for the sustainability of the livestock sector, because usually interacting species may have different phenological and evolutionary responses, and differential range expansions may lead to new species relationships and trophic encounters (plant/herbivore, pathogen/host, predator/prey) and new communities. For livestock, breed-level predictions or bio-geographic range models of the implications of climate change are hardly possible with current data. First, several species were domesticated in the same region, implying that they have similar environmental envelopes. Second, today, many breeds of the major livestock species are globally distributed, and occur in several production systems. In addition, detailed data on most breeds’ adaptation traits, including their thermal neutral zones and spatial distribution, are not available.
There is growing evidence for rapid adaptive evolution in response to recent climate change and findings that wild species’ niches and species assemblages are changing over time and space. The emerging ‘evolutionary community ecology’ aims at assessing the impacts of climate change on biodiversity in integrated frameworks that take into consideration ecological interactions in habitat and population processes, species interactions and interactions between demographic and landscape dynamics and, finally, community or ecosystem functioning (Keith et al., Reference Keith, Akcakaya, Thuiller, Midgley, Pearson, Phillips, Regan, Araujo and Rebelo2008; Lavergne et al., Reference Lavergne, Mouquet, Thuiller and Ronce2010). These frameworks thus focus on species vulnerability, which is in turn influenced by species sensitivity and exposure (Williams et al., Reference Williams, Shoo, Isaac, Hoffmann and Langham2008; Dawson et al., Reference Dawson, Jackson, House, Prentice and Mace2011). Dawson et al. (Reference Dawson, Jackson, House, Prentice and Mace2011) define vulnerability as ‘the extent to which a species or population is threatened with decline, reduced fitness, genetic loss, or extinction owing to climate change.’
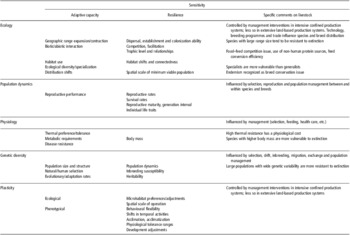
Sensitivity is the ‘degree to which the survival, persistence, fitness, performance, or regeneration of a species or population is dependent on the prevailing climate’ (Dawson et al., Reference Dawson, Jackson, House, Prentice and Mace2011). Species sensitivity is mediated by two components:
• Adaptive capacity, defined as ‘the capacity of a species or constituent populations to cope with climate change by persisting in situ, by shifting to more suitable local microhabitats, or by migrating to more suitable regions’ (Dawson et al., Reference Dawson, Jackson, House, Prentice and Mace2011).
• Resilience, defined as ‘the ability of a species to survive and recover from a perturbation’ (Williams et al., Reference Williams, Shoo, Isaac, Hoffmann and Langham2008).
Both are influenced by species ecology, physiology and genetic diversity. The following table provides an overview of the intrinsic factors influencing either of them.
Reactions and traits listed under physiology and plasticity in Table 1, such as disease resistance, feed requirements, body mass or behavioural flexibility will be most relevant for short-term climate change adaptation. It is noted that trait plasticity may have additive genetic components and may become fixed in populations over time.
Intrinsic factors influencing adaptive capacity and resilience of a species or population to climate change and findings in livestock

Livestock-specific comments by the author.
Adapted from Williams et al. (Reference Williams, Shoo, Isaac, Hoffmann and Langham2008) and Dawson et al. (Reference Dawson, Jackson, House, Prentice and Mace2011).
Exposure depends on the magnitude and rate of climate change in habitats occupied by the species, that is, increases in temperature or precipitation, drought or flooding and related hazards. Micro-habitat buffering is an important yet poorly recognized component in reducing exposure in wild biodiversity (Williams et al., Reference Williams, Shoo, Isaac, Hoffmann and Langham2008). In livestock production generally, management actions can buffer exposure and compensate for losses in animal fitness by modifying the environment. Examples are provisions to alleviate the effects of high temperatures, including the use of cooling systems (shading or sprinkling to reduce excessive heat loads), adjusting the diet to reduce metabolic heat production, or modifications to diurnal practices such as night grazing (Gauly et al., Reference Gauly, Bollwein, Breves, Brügemann, Dänicke, Das, Demeler, Hansen, Isselstein, König, Lohölter, Martinsohn, Meyer, Potthoff, Sanker, Schröder, Wrage, Meibaum, von Samson-Himmelstjerna, Stinshoff and Wrenzycki2013). Access to knowledge, technologies and to capital will determine the ability of producers to protect their herds from the physiological stress of climate change.
Heat stress is an important factor in determining production environments already today (for dairy see Zwald et al., Reference Zwald, Weigel, Fikse and Rekaya2003). The high-output breeds that increasingly dominate global food production are usually not selected for heat stress resistance, but intensive systems are generally quite well able to protect animals from the local-scale effects of climate change; this may allow high-output breeds to be retained. Freitas et al. (Reference Freitas, Misztal, Bohmanova and West2006), for example, found that effects of heat stress were smaller in larger dairy herds, whose owners were more likely to afford high-efficiency cooling devices. However, the heavy reliance on external inputs may make intensive systems vulnerable to rising prices – a problem that may be exacerbated by climate change. Herrero et al. (Reference Herrero, Thornton, Notenbaert, Wood, Msangi, Kruska, Dixon, Bossio, van de Steeg, Freeman, Li, Rao and Gerard2012) predict that due to competing demand, prices of food–feed crops are likely to increase more than the prices of livestock products, and land and water availability will become major constraints to the production of alternative ruminant feeds in intensive systems. Production systems in which non-locally adapted livestock have been introduced without the accompanying support infrastructure or where the supply of external inputs is precarious may be vulnerable to direct and indirect effects of climate change.
In production systems where the use of external inputs is not possible, the importance of well-adapted animals is likely to increase under climate change. In wild species, lower thermal limits differ more among species than upper limits, and acclimatory ability is closely linked to high thermal tolerance. There is little research on adaptation to extreme cold. Shetland ponies modified behaviour in winter, they showed reduced mobility and heart rates and signs of hypometabolism (Brinkmann et al., Reference Brinkmann, Gerken and Riek2013).
Heat tolerance, as an important physiological trait, depends on complex interactions among anatomical and physiological factors. It is influenced by properties of the skin and hair, sweating and respiration capacity, tissue insulation, the relationship between surface area per unit BW or relative lung size, endocrinological profiles and metabolic heat production. It can be modified by factors such as age, nutrition, state of health, reproduction and emotion, physical activity, level of production, acclimatization and management (Bianca, Reference Bianca1961). High thermal resistance has a physiological cost in terms of lower performance in non-stressed environments (Williams et al., Reference Williams, Shoo, Isaac, Hoffmann and Langham2008). The capacity to tolerate elevated temperatures has declined with increasing metabolic heat production related to high milk yield in dairy cattle, and growth rates and leanness in pigs or poultry (Zumbach et al., Reference Zumbach, Misztal, Tsuruta, Sanchez J, Azain, Herring, Holl, Long and Culbertson2008; Dikmen and Hansen, Reference Dikmen and Hansen2009; Gauly et al., Reference Gauly, Bollwein, Breves, Brügemann, Dänicke, Das, Demeler, Hansen, Isselstein, König, Lohölter, Martinsohn, Meyer, Potthoff, Sanker, Schröder, Wrage, Meibaum, von Samson-Himmelstjerna, Stinshoff and Wrenzycki2013).
Beyond thermoregulation, rumen physiology, the ability to walk and reach scarce feed resources, to intake water and rehydrate, to compensate for low feed quality by selecting high-quality diets from different plant components or species, or to respond with increased night-time grazing to high afternoon temperatures, or even genetic aspects of diet selection play a role in adaptation to climate change (Hall, Reference Hall2004; Gauly et al., Reference Gauly, Bollwein, Breves, Brügemann, Dänicke, Das, Demeler, Hansen, Isselstein, König, Lohölter, Martinsohn, Meyer, Potthoff, Sanker, Schröder, Wrage, Meibaum, von Samson-Himmelstjerna, Stinshoff and Wrenzycki2013). Breeds are known to differ with regard to their ability to survive, grow and reproduce in the presence of poor seasonal nutrition as well as parasites and diseases; they vary in their ability to mobilize body resources to cope with periodic underfeeding and cease reproduction at different levels of BW loss. However, research into behavioural, metabolic and reproductive breed differences is in its infancy (Hall, Reference Hall2004; McManus et al., Reference McManus, Prescott, Paludo, Bianchini, Louvandini and Mariante2008).
The genetic diversity of the world's livestock provides a range of options that are likely to be valuable in climate change adaptation, including resistance and tolerance to specific diseases, adaptation to poor-quality diets or to feeding in harsh conditions, and tolerance of climatic extremes. Most locally adapted breeds are, however, not well characterized. Taking genetic diversity and population dynamics, including species and breed shifts, as longer-term responses to climate change and other drivers, the following analysis of breed qualities described in DAD-IS focuses on habitat use and the short-term physiological and plasticity aspects of adaptation.
Analysis of breed data within DAD-IS
Material and methods
For this second part, information on breed characteristics from FAO's Global Databank for Animal Genetic Resources DAD-IS (http://dad.fao.org/) was used. DAD-IS currently contains data on 14 197 breed populations from 182 countries and 37 species; a population of a breed within a country is called a ‘national breed population’. All information about the breed, such as phenotypical description, average performance or population numbers, is entered by the government nominated National Coordinator for Animal Genetic Resources of the respective country.
The analysis includes all species that FAO (2006b) had identified as specifically adapted to drylands (alpaca, ass, camels, cattle, dromedaries, goats, horse, llama, sheep, vicuna, guanaco) along with chickens, buffalo and pigs, in order to also represent all commercially most important species. The analysis is based on 12 345 national breed populations of these selected species, without distinction between national populations of local and transboundary breeds.
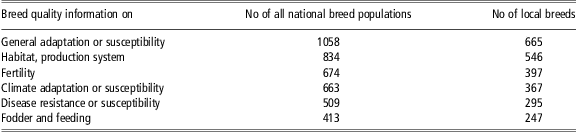
The so-called ‘Breed data sheets’ in DAD-IS include five free-text fields for information on ‘breed qualities’: adaptability to specific environment, specific resistance or tolerance, specific reproductive characteristic, special characteristic of product and other special qualities. Entries describe resistance or susceptibility of the breed to the respective factors and thus provide information on traits related to physiology and plasticity. There is no standardized definition for the terms used, and sometimes descriptions are entered under the wrong heading. Therefore, most commonly used keywords describing a range of adaptations from the breed qualities text fields were identified and then coded and grouped into the following six categories: General adaptation or susceptibility, Habitat and production system, Fertility and reproduction, Climate adaptation or susceptibility, Disease resistance or susceptibility and Fodder and feeding resistance or susceptibility. The highest number of qualities referred to general adaptation, followed by habitat or production system, fertility and climate adaptation (Table 2).
Breed quality information provided in DAD-IS for studied species
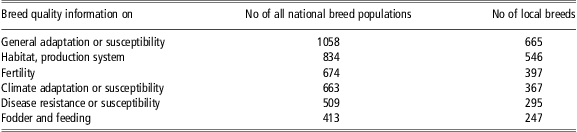
DAD-IS = Domestic Animal Diversity Information System.
Following recommendations by experts on production environment descriptors (FAO/WAAP, 2008), which will in future supersede the breed qualities descriptions, FAO developed global Geographic Information Systems (GIS) layers for DAD-IS. The grids were constructed using high-resolution data sets (monthly averages for the period 1961 to 1990) of 10-min resolution covering all land areas with the exclusion of Antarctica, produced by the Climate Research Unit of the University of East Anglia, Norwich, United KingdomFootnote 1. The following layers were used for the analysis: relative humidity of the hottest month (%), minimum temperature of coldest month (°C) and maximum temperature of hottest month (°C). Aggregating the global raster data at country (GAUL 0) level, averages for maximum temperature (avg_max_temp), relative humidity in the hottest month (avg_rh_hot) and minimum temperature in the coldest month (avg_min_temp) were calculated and grouped into temperature classes. Because of the resolution, climate data for small island states in the Caribbean, Polynesia, Melanesia and Micronesia were not available. A country-level temperature–humidity index (THI) for the hottest month was then calculated as THI = 1.8 × [avg_max_temp]+ 32 − (1.8 × [avg_max_temp] − 26) × (0.55 − 0.0055 ×[avg_rh_hot]) (National Research Council (NRC), 1971).
Results and discussion
At least one quality description was available for 2325 (19%) of all national breed populations of studied species. Owing to the history of data entry in DAD-IS, which started with local breeds and only in recent years received more entries for transboundary breeds, one may assume that the results are biased towards local breeds. Local breeds represent 87% of all breeds currently in DAD-IS. However, only between 55% and 65% of the entries on qualities describe local breeds (Table 2). The underrepresentation of local breeds’ qualities descriptions in the data set confirms their lack of characterization or low level of recognition at national level.
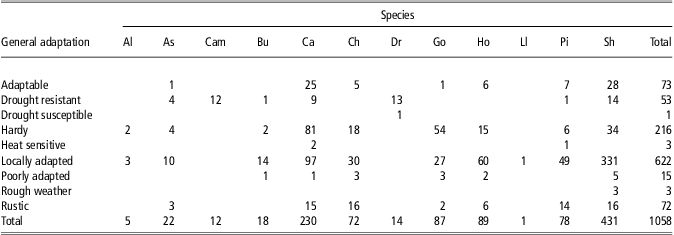
Among the 1058 breed populations with information provided on their general adaptation, 59% are classified as locally adapted, followed by 20% described as hardy. An equal share is said to be rustic or adaptable to a wider range of environments. More breed populations are described as drought resistant than drought sensitive (Table 3).
Number of national breed populations by species and ascribed general adaptation
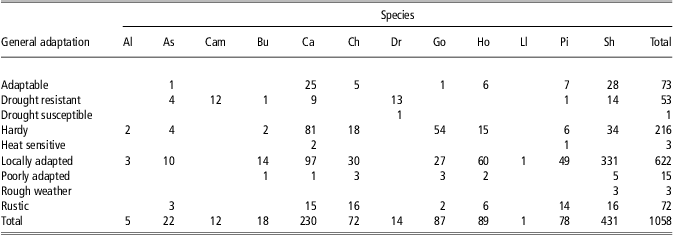
Al = Alpaca; As = Ass; Cam = Bactrian camel; Bu = Buffalo; Ca = Cattle; Ch = Chicke; Dr = Dromedary; Go = Goat; Ho = Horse; Ll = Llama; Pi = Pig; Sh = Sheep.
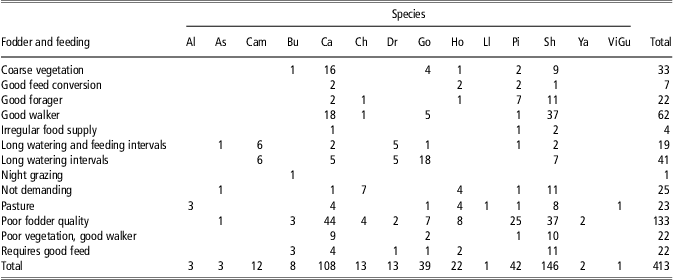
Many qualities describing general adaptation are related to other traits. Most qualities describing the breed's fodder and feeding adaptation refer to low-external input systems. Among the 413 national breed populations with information provided on their fodder and feeding adaptation, 40% of populations are said to cope well with poor fodder quality or coarse vegetation, 26% are described as dealing well with walking and selecting poor quality vegetation or thriving on pastures, and 15% are said to withstand irregular or long feeding or watering intervals, an important physiological trait especially in dry areas (Table 4). Night grazing as reported for one population is a managerial adaptation to buffer heat stress (Reference BayerBayer, 1986; Bayer et al., Reference Bayer, Suleiman, Kaufmann and Waters-Bayer1987). Ayantunde et al. (Reference Ayantunde, Fernandez-Rivera, Hiernaux, van. Keulen and Udo2002) found in the Sahel that during the dry season, night grazing complementary to day grazing increases feed intake. The number of populations described as ‘not demanding’ in their feed requirements is similar to that requiring good feed. The share of local breeds (65%) reported to be adapted to coarse vegetation, poor quality fodder and being a good walker is slightly higher than that of national populations of transboundary breeds (53%).
Number of national breed populations by species and ascribed fodder and feeding adaptation
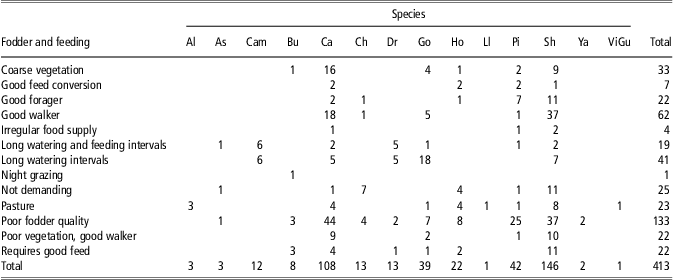
Al = Alpaca; As = Ass; Cam = Bactrian camel; Bu = Buffalo; Ca = Cattle; Ch = Chicke; Dr = Dromedary; Go = Goat; Ho = Horse; Ll = Llama; Pi = Pig; Sh = Sheep; Ya = Yak; ViGu = Vicuña-Guanaco.
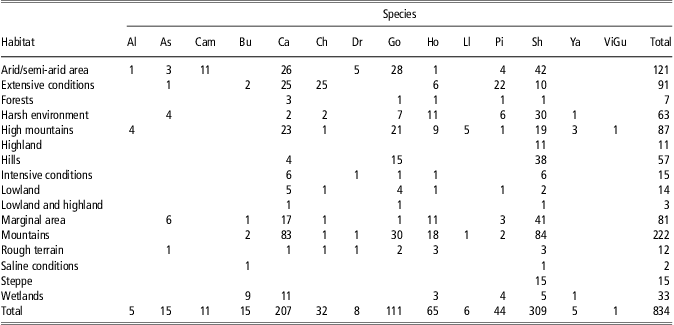
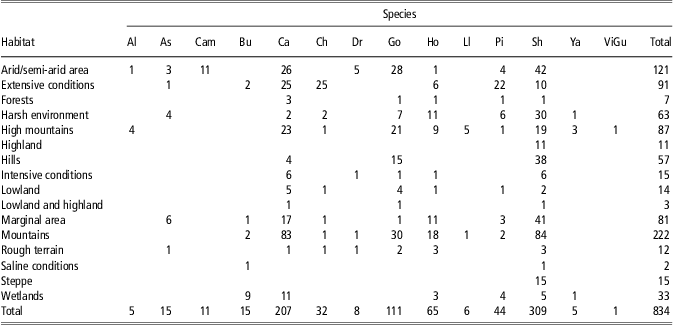
The descriptors of habitats or management systems again mention mostly low-external input systems (Table 5). Worth mentioning is the adaptation of many breeds to altitude. Among the 834 national breed populations with information provided on the habitat, 45% are reported to be adapted to high mountains, mountains, highlands and hills (Table 5); this includes 49% of local breeds and 37% of national populations of transboundary breeds for which this information was provided. All New World camelids, but also 59% of goat, 53% of cattle, 49% of sheep and 41% of horse populations for which this information was available are reported to be adapted to mountainous areas. Sixteen percent of populations across species are described as adapted to arid/semi-arid areas or steppe, these are in particular Old and some New World camelids, goats and asses. According to an earlier study (FAO, 2006b), 1074 breeds were identified as adapted to drylands. In the Near East, 90% of all the region's breeds are kept in the drylands. In Africa, 56% of all breeds are adapted to drylands, 42% in Asia and only 19% in Latin America. On average, 46% of the breeds in the four regions are adapted to drylands, and many of them are transboundary. More than 70% of breeds of ass, around 50% of sheep and goat breeds and 30% of cattle and horse breeds reported are adapted to arid areas (FAO, 2006b).
Number of national breed populations by species and ascribed habitat or management system
Al = Alpaca; As = Ass; Cam = Bactrian camel; Bu = Buffalo; Ca = Cattle; Ch = Chicke; Dr = Dromedary; Go = Goat; Ho = Horse; Ll = Llama; Pi = Pig; Sh = Sheep; Ya = Yak; ViGu = Vicuña-Guanaco.
On the other hand, information is provided for breeds adapted to lowlands, wetlands or saline conditions (Table 5). Nineteen percent of populations are adapted to harsh environments, marginal areas, rough terrain; 9% are said to be kept under extensive conditions. Especially ass, yak, horse and sheep are reported to be adapted to harsh conditions, whereas the ability to adapt to extensive management conditions is mentioned for pigs and chickens. For only 1% was it mentioned that the populations are kept in intensive conditions; this confirms the reporting bias in the data set towards breeds adapted to less favourable environments.
Cross-tabulation (data not shown) allowed a better grasp of the terms used to describe adaptation. Of the 403 populations described as locally adapted with information on habitat, 49% are based in high mountains, mountains, highlands or hills, 24% in harsh and marginal environments and 14% in arid/semi-arid and steppe areas. Of the 147 locally adapted populations with information on fodder, 56% are described as able to deal with poor quality fodder or coarse vegetation, and being good walkers. Ninety-three populations described as hardy are said to be adapted to arid/semi-arid areas (30%), extensive conditions (19%) and mountains (17%); of the 57 hardy populations with information on fodder, 46% are described as able deal with poor quality fodder or coarse vegetation, and being good walkers, and 33% with long feeding or watering intervals. The term rustic applies more to populations kept in extensive conditions (12 out of 31, 38%). Twenty-seven of the 42 populations (88%) described as drought resistant can deal with long feeding and watering intervals.
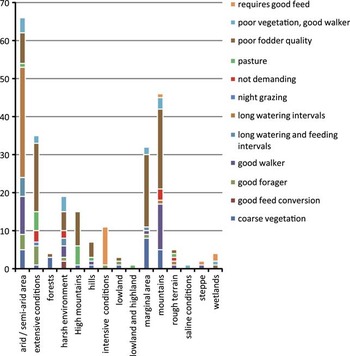
Out of 66 national breed populations reported to be adapted to arid or semi-arid areas with information on fodder, 51% can endure long feeding and watering intervals, and 41% are good walkers and can live off poor fodder and coarse vegetation (Figure 1). One hundred fifty nine populations are reported to be adapted to coarse vegetation and poor quality fodder and are good walkers; these represent 41% of populations in arid/semi-arid areas, 89% of those in mountains and 93% of those in marginal areas. Contrastingly for 86% of populations kept in intensive conditions or in wetlands, the requirement for good feed is reported.
Number of national breed populations of studied species by ascribed habitat and fodder/feeding adaptation (n = 251).

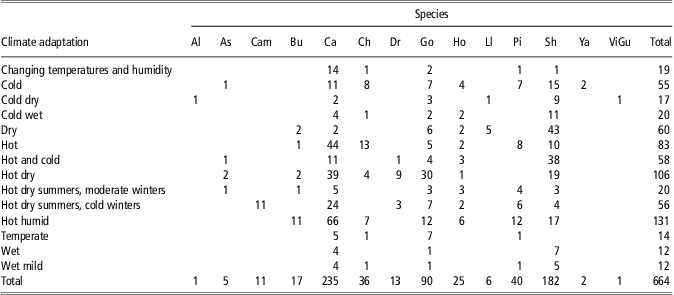
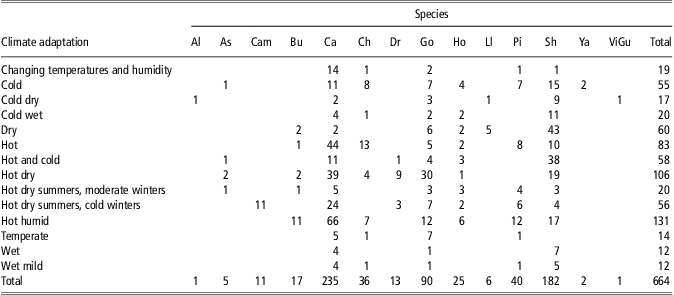
The ascribed climate adaptation covers a wide range of climates (Table 6). Among the 664 national breed populations with information provided on their climate adaptation, 16% are said to be adaptable to changing temperatures and humidity or to both hot and cold temperatures, and another 8% of populations support hard continental climate with hot summers and cold winters. Thirty-eight percent of populations are adapted to dry, hot and hot dry, 20% to hot humid climates. On the other hand, 14% are adapted to cold climate, either dry or wet.
Number of national breed populations by species and ascribed climate adaptation
Al = Alpaca; As = Ass; Cam = Bactrian camel; Bu = Buffalo; Ca = Cattle; Ch = Chicke; Dr = Dromedary; Go = Goat; Ho = Horse; Ll = Llama; Pi = Pig; Sh = Sheep; Ya = Yak; ViGu = Vicuña-Guanaco.
Of the 135 populations kept in arid/semi-arid areas, steppe or marginal areas, 81% are described to be adapted to dry or hot climate, or hot summers and cold winters. Fifty-three percent of 108 populations adapted to high mountains, highlands and mountainous areas are said to be adapted to cold and hot-and-cold climates.
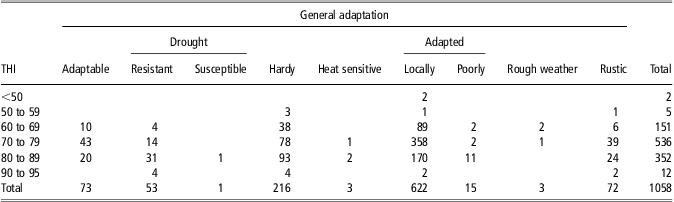
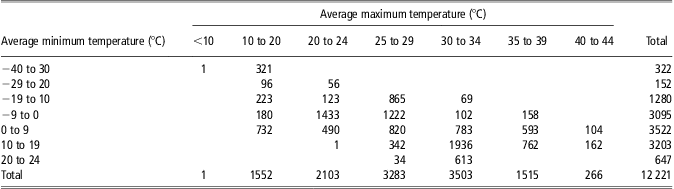
The ascribed climate adaptation of national breed populations was matched with country-level temperature and humidity data. Among the 1058 national breed populations with information provided on their general adaptation, the highest share (61%) of 983 populations described as adaptable, locally adapted, hardy and rustic occurs at a range of 25°C to 34°C average maximum temperature in the hottest month. Only 53 populations are described as drought resistant, among those 72% occur between 30°C and 44°C average maximum temperature. A total of 18 populations are reported to be poorly adapted and heat-sensitive, among those 67% occur at 30°C to 34°C average maximum temperature.
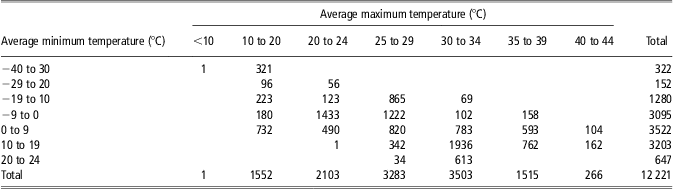
The ability to cope with extreme weather conditions will become increasingly important. Table 7 shows the impressive temperature range in which breeds occur, for example 158 populations can continue to function at average monthly temperatures ranging from −9°C to 39°C, and the temperature range of 104 populations spans from 0°C to 44°C. Obviously, average monthly climate data at national level, especially in large countries or countries with long north-south axes, mask considerable local variation.
Number of national breed populations by average minimum temperature of the coldest and average maximum temperature of the hottest month in the respective country, across studied species
Climate data for small island countries were not available.
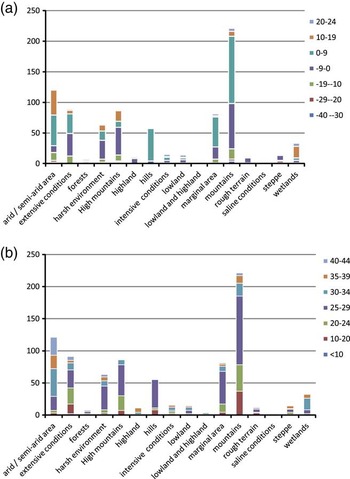
The ability to resist temperatures below −20°C is pronounced for populations in high mountains, mountains, arid/semiarid areas and steppe. On the other side of the temperature range, many populations adapted to arid/semiarid areas and mountains, marginal areas and harsh environments are able to resist temperatures higher than 40°C (Figure 2).
Number of national breed populations by average minimum temperature of the coldest month and average maximum of the hottest month, and ascribed habitat, across studied species (n = 833) (a) average minimum temperature of the coldest month (°C) and (b) average maximum temperature of the hottest month (°C).

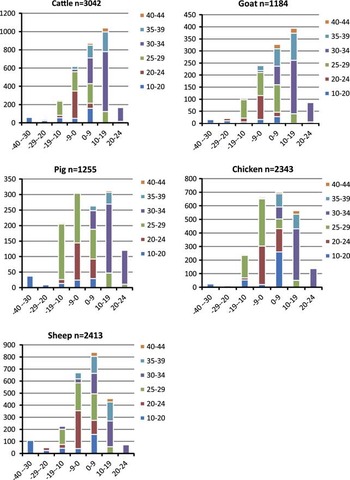
The five most important commercial species (cattle, chicken, goat, pig and sheep) differ slightly with regard to their temperature range. Countries with the wide temperature range from −9°C to +39°C harbor 20% of cattle and goat, 24% of pig, 27% of sheep and 28% of chicken populations. Furthermore, 27% of goats, 28% of cattle, 28% of chicken and 34% of sheep populations live in countries with a range of 0°C to 44°C. Tropical countries with their more uniformly warm temperatures require adaptation to a lower temperature range between 20°C and 34°C (Figure 3).
Number of national breed populations by average minimum temperature of the coldest month and average maximum of the hottest month (°C), by species. One sheep population with temperature range from −40°C to −10°C not included.

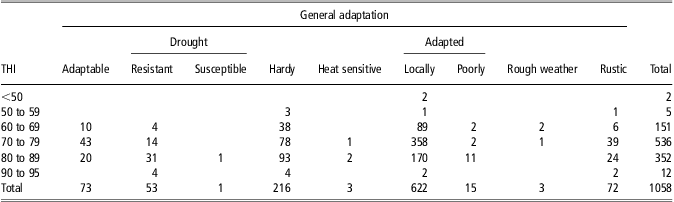
A THI of higher than 70 is commonly assumed to be the onset of physiological heat stress (Bohmanova et al., Reference Bohmanova, Misztal and Cole2007; Dikmen and Hansen, Reference Dikmen and Hansen2009). Consequently, among the 1058 national breed populations with information provided on their general adaptation, all populations described as heat sensitive and drought susceptible, and 86% of poorly adapted occur in countries where the average THI of the hottest month is higher than 70 (Table 8). The majority of these populations (75%) belong to transboundary breeds, implying that transboundary breeds of temperate origin get stressed in environments with high THI. On the other hand, more than 80% of populations described as hardy, locally adapted, drought resistant and rustic occur in countries with a THI between 70 and 95, implying that they are able to cope with high THI.
Number of national breed populations by average THI of the hottest month in the respective country and by ascribed general adaptation, across studied species
THI = temperature–humidity index.
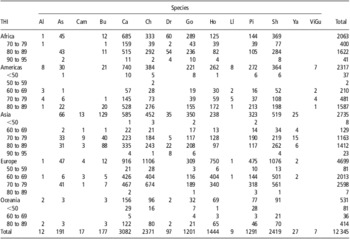
A total of 9748 national breed populations of studied species (79%) live in countries where the average THI of the hottest month exceeds 70; in Africa and Asia there are even 64 populations in countries with average THI exceeding 90 (Table 9). It needs to be kept in mind that the country-level THI of the hottest month used for the analysis, derived from average temperature and humidity, can only be considered a rough approximation, as it masks daily and regional variation.
Number of national breed populations by species and average THI of the hottest month in the respective country, by continent

THI = temperature–humidity index; Al = Alpaca; As = Ass; Cam = Bactrian camel; Bu = Buffalo; Ca = Cattle; Ch = Chicke; Dr = Dromedary; Go = Goat; Ho = Horse; Ll = Llama; Pi = Pig; Sh = Sheep; Ya = Yak; ViGu = Vicuña-Guanaco.
Despite the methodological imperfection, the results imply that countries with high THI offer potential for selection of heat-resistant animals. So far, only a few countries with well-developed breeding institutions, research, extension and artificial insemination services have commercially relevant tropical cattle breeds, tropically adapted taurine, indicine or composites (e.g. Australia, Brazil, Kenya, South Africa and United States of America), and even fewer countries have commercially significant breeding programmes for adapted breeds of the other species (Madalena, Reference Madalena2008). Most selection relevant to climate adaptation is undertaken in developed countries with commercial breeds, most of which are of temperate origin. Considerable genetic variance caused by heat stress was related to high daily THI in Jersey and Holstein Friesian dairy cattle (Ravagnolo and Misztal, Reference Ravagnolo and Misztal2002; Hayes et al., Reference Hayes, Bowman, Chamberlain, Savin, van Tassell, Sonstegard and Goddard2009). Therefore, selection for heat tolerance in high-output breeds based on rectal temperature measurements and inclusion of a THI in genetic evaluation models is promising. Hayes et al. (Reference Hayes, Bowman, Chamberlain, Savin, van Tassell, Sonstegard and Goddard2009) also identified genetic markers associated with sensitivity of milk production to feeding level, a trait that may become important assuming that future dairy systems become more reliant on pasture than grain feeding.
Conclusions and recommendations
By the time the Global Plan of Action for Animal Genetic Resources was adopted in 2007 (FAO, 2007b), climate change had been widely recognized as a major challenge for agriculture, food security, ecosystems and societies. Today it seems likely that the international target to limit temperature increase to 2°C will not be met, placing even more emphasis on climate change adaptation than stressed in earlier papers.
The analysis showed a wide range of resilience and plasticity across breeds, indicating that genetic diversity of the world's livestock provides a range of options that are likely to be valuable in climate change adaptation, including tolerance of climatic extremes such as hot temperatures, adaptation to poor-quality diets or to feeding in harsh conditions and resistance and tolerance to specific diseases. The analysis, though country level and descriptive only, resulted in a first mapping of ascribed adaptation traits of national breed populations. It allowed to explore what National Coordinators understand by locally adapted and other terms that describe general adaptation, to better understand the habitat, fodder and temperature range of each species and shed light on the environments in which targeted search for adaptation traits could focus, for example steppe, mountainous and arid/semi-arid areas for wide temperature range and the ability to cope with poor quality fodder. Obviously, the data set is biased insofar that breed qualities entered in DAD-IS focus more on successful adaptation across local and transboundary breeds than describing a lack of adaptation in either breed groups. Equally, the data set provides more information on adaptation in extensive systems and marginal environments than in intensive systems.
The launch of the production environment descriptor module in DAD-IS will allow National Coordinators to delineate the spatial distribution of breed populations and enter location-specific adaptation and performance. The use of standardized production environment descriptors will reduce the vagueness and subjectivity of breed qualities descriptions in text fields and will improve the knowledge of breeds’ current geographical distributions. It will also allow to better describe a lack of adaptation of a breed in a specific environment. Then, GIS-based analyses including modeling the future distribution and characteristics of production environments could be undertaken, to support the assessment of threats and the identification of areas that may be suitable for particular breeds in the future.
Also, because it was recognized that the local and transboundary breed classification is not best suited to describe adaptation as it simply refers to geographical occurrence, an additional classification, ‘locally adapted’ v. ‘exotic’ breeds, will be introduced in DAD-IS in the future (FAO, 2012b).
The underrepresentation of local breeds’ qualities descriptions in the data set stresses the well-known fact that most local breeds are not well characterized and their adaptation, including heat tolerance, their ability to survive, grow and reproduce in the presence of poor seasonal nutrition as well as parasites and diseases is not well understood.
It is therefore very important to develop methods for characterizing adaptive traits relevant to climate-change adaptation and comprehensively evaluate performance and use of animals in specific production environments, and for describing these production environments in a standard way. Such techniques should be included in phenotypic characterization studies and breed surveys. As management (e.g. night grazing) influences exposure, relevant local and indigenous knowledge needs to become a topic of research. Local knowledge of how to cope with harsh and fluctuating production environments also needs to be integrated within climate-change adaptation strategies.
Breeding strategies to improve animals’ abilities to cope with several climate-change-related problems are possible and are likely to become increasingly important in the future. Breeding goals may have to be adjusted to account for the effects of climate change such as higher temperatures, lower quality diets and greater disease challenge. Many breeds are already well adapted to high temperatures and harsh environments, but the wider diffusion of such breeds or their incorporation into breeding programmes is restricted by the limited extent to which they have been characterized and improved in structured breeding programmes (Madalena, Reference Madalena2008) and trade constraints (Gollin et al., Reference Gollin, Van Dusen and Blackburn2008). However, adaptation traits are more difficult to study and to record than production traits, have lower heritability, higher levels of non-additive genetic variation and phenotypic variance, and are more susceptible to genotype-by-environment interaction (Frankham, Reference Frankham2009).
The speed of climate change may outstrip the ability of breeds to adapt genetically or that of their keepers to adjust their management strategies. In places, this may break the link of adaptation between local livestock and their production environments. If such effects occur, adapting production systems and animal genetic resources management will be a major challenge and may increase the need for moving better-suited species and breeds into new areas.
It will be critical to ensure that plans to introduce new breeds take into account climatic and other agro-ecological and socio-economic conditions and their predicted future trends. Breeds introduced to new geographical areas should have a range of advantageous traits, as introductions of breed considering only one trait have not been successful (Blackburn and Gollin, Reference Blackburn and Gollin2008). Furthermore, access to inputs and livestock services relevant to climate-change adaptation need to be improved.
Areas with low or medium population densities, harbouring pastoral, agropastoral and crop–livestock systems with low agricultural potential and poor market access will continue to provide livelihoods depending mostly on ruminant livestock. Such traditional low-external input systems are often already under a variety of pressures, many of which may be exacerbated by climate change. Economically challenged livestock keepers therefore need support in adapting to climate change. The continuing urbanization and the projected decline of rural populations offer opportunities for breeds that are able to thrive in marginal areas, either highlands or drylands, and under extensive management. They have the additional advantage that there is no human-livestock food–feed competition: livestock convert non-human edible protein into food. However, production will be low because of the high physiological costs of adaptation.
Many of today's marginal areas offer a potential for nature rehabilitation and conservation. For the sustainable use of such areas and the improved livelihood of their managers, the potential for the introduction of payments for environmental services (PES) need to be explored. Herrero et al (Reference Herrero, Grace, Njuki, Johnson, Enahoro, Silvestri and Rufino2013) note that opportunities for grazing and mixed crop–livestock systems to access PES schemes are mainly driven by carbon markets schemes but also include biodiversity and water conservation and hydrological services. PES could contribute to promoting ecological and socio-economic sustainability in grazing systems and hence the maintenance of the associated breeds. For most PES programmes, the income generated from the environmental benefit will remain small compared with the income from livestock production (FAO, 2007c). On the other hand, improved rangeland management also leads to improved livestock productivity.
We therefore need to explore options for increasing carbon sequestration and biodiversity management through better grazing management, the role of breeds in such measures, and the potential that they may offer for integrated approaches to climate-change mitigation, livelihood objectives, conservation of wild biodiversity and sustainable use of animal genetic resources (CBD, 2009).
Given the potential for significant future changes in production conditions and in the objectives of livestock production, it is essential that the functions and values provided by animal genetic diversity are secured. At the policy level, the Global Plan of Action provides the global framework. It is in line with climate change adaptation strategies that relate to the conservation of wild biodiversity and the tools used by conservationists, such as natural resource planning, monitoring, ecological restoration, agri-environment schemes, species movements, breeding and conservation programmes and regulation or legislation (Mawdsley et al., Reference Mawdsley, O'Malley and Ojima2009; Joost et al., Reference Joost, Colli, Bonin, Biebach, Allendorf, Hoffmann, Hanotte, Taberlet and Bruford2011). Specifically for animal genetic diversity, this requires better characterization of breeds, production environments and the associated knowledge; the compilation of more complete breed inventories; improved mechanisms to monitor and respond to threats to genetic diversity; genetic improvement programmes targeting adaptive traits in high output and performance traits in locally adapted breeds; more effective in situ and ex situ conservation measures; increased support for developing countries in their management of animal genetic resources; and wider access to genetic resources and associated knowledge.
Acknowledgements
The author is grateful to her colleagues from the Animal Genetic Resources Branch of the Food and Agriculture Organization for their invaluable support during the preparation of this paper: to Mateusz Wieczorek for data extraction and processing from DAD-IS, to Paul Boettcher for support in data coding and review of the paper, and to Dafydd Pilling and Roswitha Baumung for their comments on earlier versions of the paper. She would also like to thank two anonymous reviewers for their valuable comments. The author is grateful to the Government of Sweden and the European Commission who have supported DAD-IS development over the past years through an FAO trust fund and two EU-Genres projects (EFABIS and FABIS-net). Content and errors are exclusively the author's responsibility.
This paper was published as part of a supplement to animal, publication of which was supported by the Greenhouse Gases & Animal Agriculture Conference 2013. The papers included in this supplement were invited by the Guest Editors and have undergone the standard journal formal review process. They may be cited. The Guest Editors appointed to this supplement are R. J. Dewhurst, D. R. Chadwick, E. Charmley, N. M. Holden, D. A. Kenny, G. Lanigan, D. Moran, C. J. Newbold, P. O'Kiely, and T. Yan. The Guest Editors declare no conflict of interest.
Disclaimer
The views expressed in this publication are those of the author(s) and do not necessarily reflect the views or policies of the Food and Agriculture Organization of the United Nations. Also the designations employed and the presentation of material in this information product do not imply the expression of opinion whatsoever on the part of the Food and Agriculture Organization of the United Nations concerning the legal status of any country, territory, city or area or of its authorities, or concerning the delimitation of its frontiers or boundaries. Content and errors are exclusively the responsibility of the author.