

1. Introduction
In recent years, methods for modelling and managing the risk borne by major companies has become a prominent topic. This is especially the case for firms whose liabilities are only covered minimally by shareholders’ participations, such as banks or insurance companies. Regulators, all around the world, are taking measures to encourage or even force such companies to build accurate models of the risks they face. This is not only to enable accurate assessment of their solvency and (similarly) determine appropriate levels of capitalisation, but also to encourage active management and mitigation of the firms’ individual risks. Examples include Solvency II (in Europe) for insurance companies (with similar systems being developed around the world) and Basel III for banks. When considering scenarios for the financial situation of such financial institutions, it is not reasonable to assume that all the risks that are involved are independent, especially when considering those scenarios with adverse effects on the company’s financial position (and which really are the ones of interest). Many circumstances will lead to strong dependence between risks or lines of business. Examples include the nature itself of the core business of the company (such as a major hurricanes or earthquakes which would lead to substantial claims in different lines of insurance business), or major operational problems (such as an IT system failure or confidentiality breach in a bank).
The increased need for dependence modelling solutions led to many developments in the past few decades. Notably, copulas have been increasingly popular and are now well-known tools for modelling dependence between random variables (see, for instance, Frees & Valdez, Reference Frees and Valdez1998; Nelsen, Reference Nelsen1999; McNeil et al., Reference McNeil, Frey and Embrechts2005; McNeil & Nešlehová, Reference McNeil and Nešlehová2009). Copulas present many advantages, such as allowing for a very wide range of dependence structures and being formulated such that dependence structures and marginal distributions can be considered separately. The actual implementation of copula models can, however, present some challenges in practice. For instance, there is no way to determine the t-year copula that is equivalent to the s-year copula (s ≠ t) in general. This means that in the context introduced above, considering different time horizon scenarios requires copulas to be fit as many times as the number of time horizons that are considered. This can be a significant problem: for instance, 10 years of data will provide only 10 or less data points for time horizons of 1 year and above, which is arguably too small to ensure a reliable fit.
An alternative approach is to consider losses not only at the aggregate level for a given time horizon (the random variable approach), but dynamically as a loss process (the stochastic process approach). This makes full use of the individual data that are typically available nowadays in large companies (for instance, insurance companies might have hundreds of thousands of claims data points in a single year). With this alternative approach, 6 months of data may be enough to specify a whole stochastic process, which can subsequently be considered as a random variable at any needed time horizon (considering a random increment of the fitted process over that period of time, provided, of course, it is stationary). The challenge is then to specify and fit a dependence structure between multiple stochastic processes, a task for which copulas are inappropriate as they relate to random variables, not stochastic processes (note that we will now refer to them exclusively as “distributional copulas” for that specific reason).
Fortunately, one can adopt a stochastic process approach and still retain most of the desirable features offered by the distributional copulas. If the modeller is prepared to restrict the set of candidate processes to that of Lévy processes – arguably a reasonable step as the main assumption is one of stationarity which we need anyway for further application of the model – then dependence can be introduced with the help of Lévy copulas, first introduced by Tankov (Reference Tankov2003); see also Cont & Tankov (Reference Cont and Tankov2004), Barndorff-Nielsen & Lindner (Reference Barndorff-Nielsen and Lindner2004), Kallsen & Tankov (Reference Kallsen and Tankov2006), Farkas et al. (Reference Farkas, Reich and Schwab2006) and Barndorff-Nielsen & Lindner (Reference Barndorff-Nielsen and Lindner2007). The mechanism by which Lévy copulas work is similar to that of distributional copulas: a function (the Lévy copula) “couples” or “assembles” the Lévy generator of the marginal processes (which fully specifies a Lévy process, akin to distribution functions which fully specify random variables) into a joint, multivariate Lévy generator (which then incorporates the desired dependence structure). Further details and benefits are discussed in Böcker & Klüppelberg (Reference Böcker and Klüppelberg2008) or Avanzi et al. (Reference Avanzi, Cassar and Wong2011).
The literature involving Lévy copulas is developing quickly and has recently been applied to insurance, operational risk and finance problems. Bäuerle & Blatter (Reference Bäuerle and Blatter2011) studied the optimal reinvestment and reinsurance problems for a multiline insurer, whereas Bregman & Klüppelberg (Reference Bregman and Klüppelberg2005) used a Clayton Lévy copula to capture multivariate dependence and estimate the probability of ruin under this model; see also Eder & Klüppelberg (Reference Eder and Klüppelberg2009). In the area of operational risk modelling, applications of Lévy copulas between operational risk cells is discussed in Böcker & Klüppelberg (Reference Böcker and Klüppelberg2008) and Böcker & Klüppelberg (Reference Böcker and Klüppelberg2010); see also Biagini & Ulmer (Reference Biagini and Ulmer2009). Esmaeili & Klüppelberg (Reference Esmaeili and Klüppelberg2010) and Avanzi et al. (Reference Avanzi, Cassar and Wong2011) discussed and illustrated the fitting of Lévy copulas to data. Non-parametric inference is considered in Bücher & Vetter (Reference Bücher and Vetter2013).
The main concern of this paper is to facilitate the specification of non-exchangeable dependence structures. Such dependence arises when the associations between risks are not identical between all risks that are involved. The term “exchangeable” comes from the fact that if all dependence relationships are identical, then the dependence structure is valid for any permutation of the risks without need of any adjustment (the “exchangeability”). Obviously, this is very unlikely to be observed in reality. Furthermore, while there exists some “elementary” distributional (potentially non-exchangeable) copulas (such as the Gaussian copula) to tackle this problem in the realm of random variables, there is no such “elementary” Lévy copula, and some simple method still needs to be developed. Indeed, most of the current Lévy copula literature either focusses on the bivariate case, or, when considering multivariate models, exchangeable dependence structures. Inspired by recent developments with distributional copulas (specifically, nested structures and vines; see Joe, Reference Joe1997; McNeil, Reference McNeil2008; Aas & Berg, Reference Aas and Berg2009; McNeil & Nešlehová, Reference McNeil and Nešlehová2009), this paper develops ideas first presented in Tao (Reference Tao2011), who introduced the concept of nested Archimedean Lévy copulas, which allows for partial non-exchangeability. We provide a detailed analysis of the nesting procedure and derive conditions under which valid multivariate Lévy copulas are obtained. Pair construction of Lévy copulas was recently discussed in Grothe & Nicklas (Reference Grothe and Nicklas2013). (While this paper was under review, Grothe & Hofert (Reference Grothe and Hofert2015) was published. Their work also explored the concept of nested Archimedean Lévy copulas, and in particular developed an efficient sampling scheme under the assumption of completely monotone (combined) Archimedean Lévy generators.)
The structure of the paper is as follows. In the next section we review the relevant literature and summarise how Lévy copulas model dependence between multivariate spectrally positive Lévy processes, with particular emphasis on the class of Archimedean Lévy copulas. Section 3 contains the main theoretical contributions. Section 3 introduces the nesting procedure and presents the conditions that must be satisfied for resulting models to be valid. Trivariate and quadvariate nested Archimedean Lévy copulas are analysed in detail, and generalisation of our results to any dimension is also discussed. Simulation and parameter estimation are considered in section 4, whereas further illustration using Danish fire data is presented in section 5. To ensure readability, some formal definitions are given in Appendix A and detailed proofs are provided in Appendix B.
2. Dependence Modelling Using Lévy Copulas
This section is a brief, illustrated collection of the fundamental definitions and results about Lévy copulas. It provides an introduction to Lévy copulas and explains how they are able to capture multivariate dependence between loss processes. Note that loss processes have jumps which are positive, in contrast to general Lévy processes which can have jumps in the positive and/or negative domains. Hence, we restrict ourselves to positive Lévy copulas in this paper.
Note that all definitions, lemmas, theorems and examples mentioned in a given subsection are provided only at the end of that subsection to improve readability.
2.1. Introduction to positive Lévy copulas
Consider a multivariate Lévy process with positive jumps, S(t), representing a multivariate loss process (see e.g. Sato, Reference Sato1999, for a formal definition). Each of the marginal processes of S(t) represents the losses from one line of business, and is itself a univariate Lévy process with positive jumps. Common examples of such Lévy processes include the compound Poisson process with positive jumps, the gamma process and the inverse Gaussian process (see e.g. Bertoin, Reference Bertoin1998; Cont & Tankov, Reference Cont and Tankov2004).
When modelling multivariate distributions, the “bottom-up” model-building approach enabled by Sklar’s theorem is intuitively appealing (see e.g. McNeil et al., Reference McNeil, Frey and Embrechts2005): assumptions are first made about the (typically well-known) margins, which are then pulled together with an appropriate distributional copula. Fortunately, the same approach is possible with Lévy copulas. However, instead of joining up the probability distribution functions of (marginal) random variables, we will need to join up the tail integrals of the (marginal) Lévy processes. The tail integral of a multivariate Lévy process (see formal definitions in e.g. Tankov, Reference Tankov2003; Cont & Tankov, Reference Cont and Tankov2004) with Lévy measure ν(…)
 $$U(x_{{\rm 1}} ,\:\,\ldots\,\:,\,x_{d} )=\nu ([x_{{\rm 1}} ,\,\infty){\times}\,\ldots\,{\times}[x_{d} ,\,\infty)),\quad x_{{\rm 1}} ,\:\,\ldots\,\:,\,x_{d} \in [0,\,\infty)^{d} $$
has margins that are defined similarly to the margins of distribution functions. When all components of the tail integral are 0 except for the kth element, one obtains the marginal tail integral
 $$U_{k} (x_{k} )=U(0,\:\,\ldots\,\:,\,0,\,x_{k} ,\,0,\:\,\ldots\,\:,\,0)$$
The Lévy copula (see formal definitions in e.g. Kallsen & Tankov, Reference Kallsen and Tankov2006; Bäuerle & Blatter, Reference Bäuerle and Blatter2011) simply provides the link between the multivariate tail (2.1) and its margins (2.2), via Sklar’s theorem for Lévy copulas (see e.g. Tankov, Reference Tankov2003; Cont & Tankov, Reference Cont and Tankov2004; Kallsen & Tankov, Reference Kallsen and Tankov2006).
2.2. Archimedean Lévy copulas
In a way similar to the construction of the Archimedean class of distribution copulas, it is possible to create a class of parametric Lévy copulas using some generator ψ (Definition 2.1); see Definition 2.2. Note that in this framework the generators ψ are defined slightly differently from that in the distribution copula framework; in particular, a convenient property is that the inverse ψ −1 always exists (because ψ is strictly decreasing and continuous).
It is important to note that additional conditions are required for an Archimedean Lévy generator to generate a valid Lévy copula. Lemma 2.1 below (from Bäuerle & Blatter, Reference Bäuerle and Blatter2011, under different notations) provides a necessary and sufficient condition. Recall that a function with derivatives up to order d is called d-monotone if its derivatives alternate in sign, starting with a negative first derivative; a formal definition can be found in Appendix B, Definition B.1.
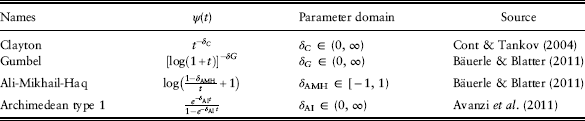
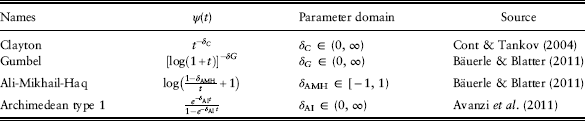
Table 1 summarises the Archimedean Lévy generators proposed in the literature, as well as their parameter domains. The Archimedean Lévy generators presented there are in general not the same as the distributional Archimedean generators with the same name. For instance, a Clayton Archimedean generator is a different function to the Clayton Archimedean Lévy generator. Furthermore, note that the domain and range of the Archimedean Lévy generators are both [0, ∞], whereas the domain and range of Archimedean generators are [0, 1] and [0, ∞], respectively.
Archimedean Lévy generators.
Definition 2.1 (Archimedean Lévy generator, Cont & Tankov, Reference Cont and Tankov2004; Bäuerle & Blatter, Reference Bäuerle and Blatter2011) An Archimedean Lévy generator is a strictly decreasing and continuous function ψ: [0, ∞]→[0, ∞] which satisfies the conditions ψ(0)=∞ and ψ(∞)=0.
Definition 2.2 (Archimedean Lévy copula, Cont & Tankov, Reference Cont and Tankov2004) A d-dimensional Lévy copula  $\raster="fx1"$
is called Archimedean if and only if it can be represented in the form
 $$\raster="fx1"(u_{{\rm 1}} ,\:\,\ldots\,\:,\,u_{d} )=\psi ^{{\minus}} ^{{\rm ^1}} (\psi (u_{{\rm 1}} ){\plus}\,\ldots\,{\plus}\psi (u_{d} )),\quad u_{i} \in [0,\,\infty]^{d} \quad i\in \{ {\rm 1},\,{\rm 2},\:\,\ldots\,\:,\,d\} $$
for some Archimedean Lévy generator  $\psi $
.
Lemma 2.1 The d-dimensional Archimedean construction in (2.3) yields a valid Lévy copula if and only if  $\psi ^{{{\minus}1}} $
is d-monotone on (0, ∞).
2.3. Marginal Lévy copulas
When considering a multivariate stochastic process with Lévy copula dependence, association between any subset of the processes is described by (a reduced version of) that same Lévy copula. For example, consider a trivariate loss process S(t)=(S 1(t), S 2(t), S 3(t)) with trivariate Lévy copula  $\raster="fx1"$
. The bivariate Lévy copula specifying the dependence between S 1(t) and S 2(t) is then given by
 $$\raster="fx1"(u_{{\rm 1}} ,\,u_{{\rm 2}} ,\,\infty)=\nu ([x_{{\rm 1}} ,\,\infty){\times}[x_{{\rm 2}} ,\,\infty){\times}[0,\,\infty))=U_{{{\rm 12}}} (x_{{\rm 1}} ,\,x_{{\rm 2}} )=\raster="fx1"_{{{\rm 12}}}\!\! {.}(u_{{\rm 1}} ,\,u_{{\rm 2}} )$$
This follows from Sklar’s theorem along with the definition and properties of the tail integral. Note that this is similar for the dependence structure between S 1(t) and S 3(t) and between S 2(t) and S 3(t) and for higher dimensions as well.
2.4. Exchangeable Lévy copulas
Exchangeable Lévy copulas are defined in Definition 2.3 (see McNeil et al. (Reference McNeil, Frey and Embrechts2005) for an analogous definition in the distributional copula literature). Such copulas are useful for modelling dependence between a set of loss processes, any pair of which exhibits very similar dependence characteristics. Arguably, this is unlikely to happen in our fields of interest, especially for high-dimensional systems.
Example 2.1 provides an illustration of a trivariate process with exchangeable dependence structure. Importantly, the Clayton Lévy copula is not the only Archimedean Lévy copula that is exchangeable. In fact, a closer look at (2.3) informs us that any Archimedean Lévy copula, of any dimension, will always be exchangeable (as any permutation of a straight sum yields the same result).
Definition 2.3 (Exchangeable Lévy copula) A Lévy copula is called an exchangeable Lévy copula if
 $$\raster="fx1"(u_{{\rm 1}} ,\:\,\ldots\,\:,\,u_{d} )=\raster="fx1"\left( {v_{{\rm 1}} ,\:\,\ldots\,\:,\,v_{d} } \right)$$
for any permutation (v 1, … , v d) of (u 1, … , u d).
Example 2.1 For a trivariate compound Poisson process {S 1(t), S 2(t), S 3(t)}, with trivariate Lévy copula  $\raster="fx1"$
, we want to consider the dependence in frequency and severity between S 1(t) and S 2(t). The joint tail integral U 12(x 1, x 2) measures those jumps which are common to S 1(t) and S 2(t), including jumps which are common to all three processes. This is different to those jumps described by
 $$U_{{12}}^{\parallel} (x_{1} ,\,x_{2} )=v([x_{1} ,\,\infty){\times}[x_{2} ,\,\infty){\times}\{ 0\})$$
, which considers common jumps between the two processes only. Expressing U 12(x 1, x 2) in terms of a Lévy measure (see (2.1)) yields
 $$U_{{{\rm 12}}} (x_{{\rm 1}} ,\,x_{{\rm 2}} )=\nu ([x_{{\rm 1}} ,\,\infty){\times}[x_{{\rm 2}} ,\,\infty){\times}[0,\,\infty))$$
Using Sklar’s theorem for Lévy copulas and the fact that U i(0)=∞ for i∈{1, 2, 3} yields
 $$U_{{{\rm 12}}} (x_{{\rm 1}} ,\,x_{{\rm 2}} )=\,\raster="fx1"\!\left( {U_{{\rm 1}} (x_{{\rm 1}} ),\,U_{{\rm 2}} (x_{{\rm 2}} ),\,\infty} \right)$$
Hence, the marginal Lévy copula  $$\raster="fx1"_{{12 \cdot }} $$
12., specifying dependence between S 1(t) and S 2(t), can be expressed in terms of the trivariate Lévy copula
 $\raster="fx1"$
 $$\raster="fx1"_{{{\rm 12}\cdot}} (u_{{\rm 1}} ,\,u_{{\rm 2}} )=\,\raster="fx1"\!(u_{{\rm 1}} ,\,u_{{\rm 2}} ,\,\infty)$$
Similar expressions for  $\raster="fx1"_{{1\cdot3}} $
and
 $\raster="fx1"_{ \cdot } {_{23}} $
, specifying the dependence structure between S 1(t) and S 3(t) and between S 2(t) and S 3(t), respectively, can be derived analogously.
For the trivariate Clayton Lévy copula
 $$\raster="fx1"(u_{{\rm 1}} ,\,u_{{\rm 2}} ,\,u_{{\rm 3}} )=(u_{{\rm 1}}^{{{\minus}\delta }} {\plus}u_{{\rm 2}}^{{{\minus}\delta }} {\plus}u_{{\rm 3}}^{{{\minus}\delta }} )^{{{\minus}{1 \over \delta }}} $$
the marginal bivariate Lévy copulas are given by
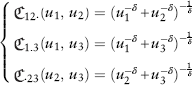 $$\left\{ \matrix{ \raster="fx1"_{{{\rm 12} \cdot }} (u_{{\rm 1}} ,\,u_{{\rm 2}} )=(u_{{\rm 1}}^{{{\minus}\delta }} {\plus}u_{{\rm 2}}^{{{\minus}\delta }} )^{{{\minus}{{\rm 1} \over \delta }}} \hfill \cr \raster="fx1"_{{1.3}} (u_{{\rm 1}} ,\,u_{3} )=(u_{{\rm 1}}^{{{\minus}\delta }} {\plus}u_{3}^{{{\minus}\delta }} )^{{{\minus}{{\rm 1} \over \delta }}} \hfill \cr \raster="fx1"_{{ \cdot 23}} (u_{2} ,\,u_{3} )=(u_{2}^{{{\minus}\delta }} {\plus}u_{3}^{{{\minus}\delta }} )^{{{\minus}{{\rm 1} \over \delta }}} \hfill \cr} \right.$$
Note that the marginal bivariate Lévy copulas above, providing information regarding the dependence between different pairwise combinations, are identical. Hence, the Lévy copula (2.9) is exchangeable.
3. Nested Archimedean Lévy Copulas
An important limitation of the multivariate Archimedean Lévy copulas presented in the previous section is their exchangeability. For a group of loss processes with homogeneous dependence structure, exchangeable Lévy copulas are adequate. However, when more complex dependence structures arise, such as those with varying pairwise structures, exchangeable Lévy copulas can become problematic.
In this section, we will show that a nesting approach (such as in the distributional literature, see, for instance, Kurowicka & Joe, Reference Kurowicka and Joe2011) can lead to valid multivariate, non-exchangeable Lévy copula models, under certain conditions. Namely, we develop and introduce nested Archimedean Lévy copulas. Such an approach allows for non-exchangeability while still retaining the tractability of the Archimedean construction. We highlight the key ideas and present the technical conditions required for a nested Archimedean Lévy copula to be valid. For readability, proofs are included in Appendix B.
3.1. Construction of nested Archimedean Lévy copulas
In this section we present three theorems which describe the conditions under which the nesting procedure produces valid Lévy copulas. These three results correspond to the trivariate, quadvariate fully nested and quadvariate partially nested cases, respectively. As discussed in section 3.1.2, the move from two to three and then four dimensions is easily generalised to higher dimensions.
3.1.1. Trivariate nested Archimedean Lévy copula
The nesting procedure is quite intuitive. The idea is to associate models in a pairwise fashion in a given sequential order. For instance, processes 1 and 2 can be first associated, and the result subsequently associated to the third process. This is illustrated in Figure 1, where the tail integrals u 1 and u 2 are first combined through the bivariate Lévy copula  $$\raster="fx1"_{{11}} $$
. The next step is to then combine the resulting model (
 $\raster="fx1"_{{11}} $
) with u 3 with another bivariate Lévy copula
 $\raster="fx1"_{{21}} $
. A direct remark is that one has three choices of pairs to start with. As we will illustrate later, this choice may be restricted if one wants the resulting model to be valid.
Three-dimensional fully nested Archimedean Lévy copula.

Of course, if  $\raster="fx1"_{{11}} $
and
 $\raster="fx1"_{{21}} $
are not the same Lévy copulas, then the dependence between the three processes is not exchangeable. In fact, in the example of Figure 1, processes 1 and 2 are associated in a certain way (according to
 $\raster="fx1"_{{11}} $
), which is different from that associates process 3 with both processes 1 and 2 (according to
 $\raster="fx1"_{{21}} $
). In other words, the loss processes corresponding to the tail integrals u i for i=1, 2 will have marginal Lévy copula corresponding to the Archimedean Lévy copula generator
 $\psi _{{11}} $
, whereas the loss process between the pairs (u 1, u 3) and (u 2, u 3) will both possess the same marginal Lévy copula – the one that corresponds to the Archimedean Lévy copula generator
 $\psi _{{21}} $
.
Theorem 3.1 spells out the structure of the trivariate Lévy copula yielded by the nesting approach described above, and sets sufficient conditions for this structure to be valid. To understand the conditions, recall that a function is in class C d if it is continuously differentiable to order d. Furthermore, a C d function is d-monotone if its derivatives alternate in sign, up to the order d (see Definition B.1 in Appendix B for a formal definition).
Theorem 3.1 (Trivariate fully nested Archimedean Lévy copula) A trivariate fully nested Archimedean Lévy copula
 $$\raster="fx1"_{{11}} {\rm (}u_{1} ,\,u_{2} ,\,u_{3} )=\psi _{{21}}^{{{\minus}1}} (\psi _{{21}} \circ\psi _{{11}}^{{{\minus}1}} (\psi _{{11}} (u_{1} ){\plus}\psi _{{11}} (u_{2} )){\plus}\psi _{{21}} (u_{3} ))$$
with Archimedean Lévy generators  $$\psi _{{11}} $$
and
 $$\psi _{{21}} $$
, where
1.
 $\psi _{{21}}^{{{\minus}1}} \in C^{3} $
, and is 3-monotone on (0, ∞),
2.
$\psi _{{21}} \circ\psi _{{11}}^{{{\minus}1}} \in C^{2} $
, and has a derivative which is 1-monotone on (0, ∞) and3.
$\psi _{{11}} \in C^{1} $
and
$\psi _{{21}} \in C^{1} $


is a valid Lévy copula.
A full proof is provided in Appendix B.1.
3.1.2. Quadvariate and multivariate nested Archimedean Lévy copulas
With dimensions higher than 3, there is not only a choice of which processes to nest first, but also of how to nest them (different structures are available, even when the order of the pairing is determined). We distinguish two alternative approaches:
1. One can follow the nesting procedure as described in the previous section and perform the additional step by nesting the trivariate process with a fourth one – this leads to a fully nested structure. This is illustrated in Figure 2.
2. Alternatively, one can pair processes in a non-sequential way, and nest the resulting sub-nested models – this leads to a partially nested structure. This is illustrated in Figure 3.
Four-dimensional fully nested Archimedean Lévy copula.
Four-dimensional partially nested Archimedean Lévy copula.
These constructions will not always be valid. In particular, their validity will depend on the monotonicity properties of the composite Lévy generator stemming from the nesting procedure. In the remainder of this section, we illustrate and examine these two approaches in the quadvariate case. Note that the constructions and proofs can naturally be extended to higher dimensions.
Theorem 3.2 examines the case of the fully nested quadvariate construction depicted in Figure 2. Under this construction, the loss processes corresponding to the tail integrals u i for i=1, 2 will have marginal Lévy copula corresponding to the Archimedean Lévy copula generator  $\psi _{{11}} $
, whereas the loss process between the pairs (u 1, u 3) and (u 2, u 3) will both possess the same marginal Lévy copula and corresponds to the Archimedean Lévy copula generator
 $\psi _{{21}} $
.
Theorem 3.3 is concerned with the partially nested structure in Figure 3. There, the tail integrals of u 1 and u 2 are first coupled through the bivariate Lévy copula  $$\raster="fx1"_{{11}} $$
and u 3 and u 4 through
 $$\raster="fx1"_{{12}} $$
. The construction subsequently joins together
 $$\raster="fx1"_{{11}} $$
and
 $$\raster="fx1"_{{12}} $$
with
 $$\raster="fx1"_{{21}} $$
to complete the construction.
Which of the fully or partially nested approaches should be used depends on the characteristics of the data. Specifically, pairwise association exhibited in the data should be examined with consideration of (i) which of the pairwise associations are significantly different or similar, but also of (ii) which type of nesting, once fitted, will yield a valid model. The former is important because of the partial exchangeability of the structures described above. The latter will become clearer in the next section, where the conditions for validity (found in the theorems) are translated into interpretable conditions for some exemplary models. Both considerations are further discussed and illustrated in section 5.
Theorem 3.2 (Quadvariate fully nested Archimedean Lévy copula) A quadvariate fully nested Archimedean Lévy copula
 $${\raster="fx1"(}u_{1} ,u_{2} ,u_{3} ,u_{4} )=\psi _{{31}}^{{{\minus}1}} (\psi _{{31}} \circ\psi _{{21}}^{{{\minus}1}} (\psi _{{21}} \circ\psi _{{11}}^{{{\minus}1}} (\psi _{{11}} (u_{1} ){\plus}\psi _{{11}} (u_{2} )){\plus}\psi _{{21}} (u_{3} )){\plus}\psi _{{31}} (u_{4} ))$$
with Archimedean Lévy generators  $\psi _{{11}} $
,
 $\psi _{{21}} $
and
 $\psi _{{31}} $
, where
1.
$\psi _{{31}}^{{{\minus}1}} \in C^{4} $
, and is 4-monotone on (0, ∞),2.
$\psi _{{31}} \circ\psi _{{21}}^{{{\minus}1}} \in C^{3} $
, and has a derivative which is 2-monotone on (0, ∞),3.
$\psi _{{21}} \circ\psi _{{11}}^{{{\minus}1}} \in C^{2} $
, and has a derivative which is 1-monotone on (0, ∞), and4.
$\psi _{{11}} \in C^{1} ,\,\psi _{{21}} \in C^{1} $
and
$\psi _{{31}} \in C^{1} $




is a valid Lévy copula.
Theorem 3.2 adds a dimension to that of Theorem 3.1 and hence has a similar proof. However, a sketch of proof is still provided in Appendix B.2 in order to illustrate how to generalise these results to any dimension.
Theorem 3.3 (Quadvariate partially nested Archimedean Lévy copula) A quadvariate partially nested Archimedean Lévy copula
 $${\raster="fx1"(}u_{1} ,u_{2} ,u_{3} ,u_{4} )=\psi _{{21}}^{{{\minus}1}} (\psi _{{21}} \circ\psi _{{11}}^{{{\minus}1}} (\psi _{{11}} (u_{1} ){\plus}\psi _{{11}} (u_{2} )){\plus}\psi _{{21}} \circ\psi _{{12}}^{{{\minus}1}} (\psi _{{12}} (u_{3} ){\plus}\psi _{{12}} (u_{4} )))$$
with Archimedean Lévy generators  $\psi _{{11}} $
,
 $\psi _{{12}} $
and
 $\psi _{{21}} $
,where
1.
$\psi _{{21}}^{{{\minus}1}} \in C^{4} $
, and is 4-monotone on (0, ∞),2.
$$\psi _{{21}} \circ\psi _{{11}}^{{{\minus}1}} \in C^{2} $$
, and has a derivative which is 1-monotone on (0, ∞),3.
$$\psi _{{21}} \circ\psi _{{12}}^{{{\minus}1}} \in C^{2} $$
, and has a derivative which is 1-monotone on (0, ∞), and4.
$$\psi _{{11}} \in C^{1} $$
and
$$\psi _{{12}} \in C^{1} $$


is a valid Lévy copula.
The approach to proving Theorem 3.3 is similar to that for Theorem 3.1. A full proof of Theorem 3.3 can be found in Appendix B.3.
As in the trivariate case, one can study the marginal Lévy copulas implied by a quadvariate Lévy copula. This is illustrated in Figure 4, which displays the Lévy generators corresponding to the marginal couples in both cases of full nesting (on the left hand side) and partial nesting (on the right hand side).
Bivariate Lévy copulas implied by a quadvariate fully and partially nested Lévy copula, on the left and right hand sides, respectively.
3.2. Examples of nested models
By examining carefully the conditions that the various Lévy generators must satisfy, the approach of nesting a construction to capture non-exchangeability can be extended to any dimension d. However, the number of ways that a nested Archimedean Lévy copula can be constructed will increase with increasing dimensions. For instance, the trivariate case in section 3.1.1 has one distinct construction and the quadvariate case in section 3.1.2 has two distinct constructions.
Notwithstanding, validity of the Archimedean Lévy generators needs to be checked on a case-by-case basis. We illustrate below the effect of these conditions with some of the Lévy copulas of Table 2.
Restrictions for various trivariate fully nested Lévy copulas.

3.2.1. Trivariate fully nested Clayton
Selecting a Clayton Lévy generator for both levels of nesting results in the trivariate fully nested Clayton Lévy copula which leads to
 $${\raster="fx1"(}u_{1} ,u_{2} ,u_{3} )=((u_{1}^{{{\minus}\delta _{C,11}}} {\plus}u_{2}^{{{\minus}\delta _{C,11}}} )^{{{{\delta _{C,21}} \over {\delta _{C,11}}}}} {\plus}u_{3}^{{{\minus}\delta _{C,11}}} )^{{{\minus}{1 \over {\delta _{C,21}}}}} $$
where δ C,11 and δ C,21 are the parameters of the two (bivariate) Clayton Lévy copulas used in the construction. Restrictions apply on the choice of parameters δ C,11 and δ C,21. The composite Lévy generator of the trivariate nested Clayton Lévy copula,  $f(t)=\psi _{{21}} \circ\psi _{{11}}^{{{\minus}1}} (t)$
, takes the form
 $$f(t)=t^{{{{\delta _{C,21}} \over {\delta _{C,11}}}}} ,\quad t\,\gt \,0$$
For the trivariate case, a valid Lévy copula results if this composite function has a derivative which is 1-differentiable and 1-monotone. The first derivative of this function is
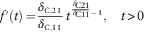 $$f'(t)={{\delta _{C,21}} \over {\delta _{C,11}}}\,t \, {^{{{\delta _{C,21}} \over {\delta _{C,11}}}}\,^{{\minus}1}} ,\quad t\,\gt\, 0$$
The first derivative in (3.6) is always non-negative. However, for this derivative to be 1-differentiable and 1-monotone, the power of t must be non-positive, so the second derivative is non-positive. Hence
 $${{\delta _{C,21} } \over {\delta _{C,11}} }}{\minus}1\leq 0\Leftrightarrow\,\delta _{C,21}} \leq \delta _{C,11}} $$
which leads to the restriction
 $$\delta _{C,11}} \geq \delta _{C,21}} \,\gt \,0$$
Remark 3.1 In fact, when δ C,11 ≥ δ C,21, the trivariate fully nested Clayton composite generator has a completely monotone derivative. This is because the power of t will always be negative after the first derivative, causing each successive differentiation to alternate in sign.
Remark 3.2 In the case where the two parameters are equal, that is δ C,11=δ C,21, we retrieve the exchangeable trivariate Clayton Lévy copula.
An important implication of this restriction when building a model with Clayton trivariate nested Lévy copula dependence is that the Lévy processes with a dependence captured by a larger parameter must be coupled first, and the component with dependence captured by a smaller parameter must be on the outer level of the nesting. This is similar to what was mentioned for the distributional copula case in Aas & Berg (Reference Aas and Berg2009) and Hofert (Reference Hofert2008).
Example 3.1 For the Clayton–Clayton fully nested Lévy copula as applied to a trivariate compound Poisson process, the implied survival copula can be derived for the jumps common to all components. If a form exists for the implied distributional copula, techniques in copula literature, which are much more developed than Lévy copulas, can be used for modelling and simulation of Lévy processes.
Let λ i denote the marginal intensity for process i, and  $\lambda _{{123}}^{\parallel} $
denote the intensity for jumps occurring to all three processes simultaneously. The Clayton–Clayton fully nested Lévy copula has an implied distributional survival copula
 $\hat{C}_{N} $
given by
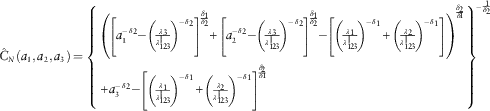 $$\hat{C}_{N} (a_{1} ,a_{2} ,a_{3} )=\left\{ \matrix{ \left( {\left[ {a_{1}^{{{\minus}\delta _{2} }} {\minus}\left( {{{\lambda _{3} } \over {\lambda _{{123}}^{\parallel} }}} \right)^{{{\minus}\delta _{2} }} } \right]^{{{{\delta _{1} } \over {\delta _{2} }}}} {\plus}\left[ {a_{2}^{{{\minus}\delta _{2} }} {\minus}\left( {{{\lambda _{3} } \over {\lambda _{{123}}^{\parallel} }}} \right)^{{{\minus}\delta _{2} }} } \right]^{{{{\delta _{1} } \over {\delta _{2} }}}} {\minus}\left[ {\left( {{{\lambda _{1} } \over {\lambda _{{123}}^{\parallel} }}} \right)^{{{\minus}\delta _{1} }} {\plus}\left( {{{\lambda _{2} } \over {\lambda _{{123}}^{\parallel} }}} \right)^{{{\minus}\delta _{1} }} } \right]} \right)^{{{{\delta _{2} } \over {\delta 1}}}} \hfill \cr {\plus}a_{3}^{{{\minus}\delta _{2} }} {\minus}\left[ {\left( {{{\lambda _{1} } \over {\lambda _{{123}}^{\parallel} }}} \right)^{{{\minus}\delta _{1} }} {\plus}\left( {{{\lambda _{2} } \over {\lambda _{{123}}^{\parallel} }}} \right)^{{{\minus}\delta _{1} }} } \right]^{{{{\delta _{2} } \over {\delta 1}}}} \hfill \cr} \right\}^{{{\minus}{1 \over {\delta _{2} }}}} $$
where a 1, a 2 and a 3 are marginal survival functions; see Appendix B.4. This is in contrast to the trivariate (plain vanilla) exchangeable case, where the survival copula  $\hat{C}_{E} $
is
 $$\hat{C}_{E} (a_{1} ,a_{2} ,a_{3} )=(a_{1}^{{{\minus}\delta }} {\plus}a_{2}^{{{\minus}\delta }} {\plus}a_{3}^{{{\minus}\delta }} {\minus}2)^{{{\minus}{1 \over \delta }}} $$
see Cassar (Reference Cassar2010: 90–91). Comparison of (3.9) with (3.10) also illustrates how the nesting procedure affects dependence not only in frequency, but also in severity.
3.2.2. Other same family nested models
Selecting the same Archimedean Lévy generator for both levels of nesting allows us to construct alternative trivariate fully nested Lévy copulas, such as the trivariate fully nested Gumbel Lévy copula. With a similar approach to the Clayton trivariate fully nested Lévy copula in section 3.2.1, the associated restrictions for an Archimedean Lévy generator can be found by analysing the derivative properties of the composite Lévy generators. Table 2 summarises the parameter (sufficient) restrictions for the various trivariate fully nested Lévy copulas.
Remark 3.3Table 2 raises some questions. Is there usually a clear relationship between the level of the different parameters δ and the level of dependence induced by the associated model? Unfortunately the answer is not obvious as the concept of dependence between stochastic processes requires some care. Consider, for instance, the case of compound Poisson processes. There, both dependence in frequency and severity have to be considered. Recall that there is a direct relationship between the Lévy copula and the amount of “common jumps” between processes: the larger the Lévy copula, the higher the intensity of common jumps (the Lévy copula function maps marginal intensities into a common jump intensity). In other words, the larger the Lévy copula, the stronger the dependence in frequency. For instance, if we consider bivariate Archimedean Lévy copulas (such as in Table 2), and examine
 $${d \over {d\delta }}\,\raster="fx1"(u_{1} ,u_{2} )={d \over {d\delta }}(\psi ^{{{\minus}1}} (\psi (u_{1} ){\plus}\psi (u_{2} ))={{\psi '_{\delta } (u_{1} ){\plus}\psi '_{\delta } (u_{2} )} \over {\psi '_{\delta } (\psi ^{{{\minus}1}} (\psi (u_{1} ){\plus}\psi (u_{2} )))}}$$
 $$\quad\quad\quad\quad\quad\quad\quad\quad\quad\quad\quad\quad\quad\quad\quad\ \ {\rm where}\quad\quad\quad\, \psi '_{\delta } ( \cdot )={d \over {d\delta }}\psi ( \cdot )$$
we see that higher δ’s will always lead to a higher dependence level in frequency for Archimedean Lévy copulas, as long as the generator  $$\psi $$
is monotone in δ. General conclusions about dependence in severity are more difficult to draw. In some cases, such as in (3.10), the relationship is clear and well known from the distributional copula literature. Other cases may not be as clear, and may need to be checked on a case-by-case basis.
3.2.3. Mixed family nested models
Mixing generators for a nested Archimedean Lévy copula is possible, such as using the Clayton for the inner level of nesting and the Gumbel for the outer level of nesting. However, more complicated restrictions apply to the choice of parameters.
As an example, consider the trivariate fully nested Clayton–Gumbel Lévy copula, where ψ 11 is a Clayton Lévy generator and  $\psi _{{21}} $
is a Gumbel Lévy generator. It takes the form
 $$\raster="fx1"(u_{1} ,u_{2} ,u_{3} )=\exp \,\left[ {\left( {[\log (1{\plus}(u_{1}^{{{\minus}\delta _{{C,11}} }} {\plus}u_{2}^{{\delta _{{C,11}} }} )^{{{\minus}{1 \over {\delta _{{C,11}} }}}} )]^{{{\minus}\delta _{{G,21}} }} {\plus}[\log (1{\plus}u_{3} )]^{{{\minus}\delta _{{G,21}} }} } \right)^{{{\minus}{1 \over {\delta _{{G,21}} }}}} } \right]{\minus}1$$
where δ C,11 is the parameter of the Clayton Lévy generator and δ G,21 is the parameter of the Gumbel Lévy generator, which are subject to restrictions we will now explore.
The composite generator,  $f(t)=\psi _{{21}} \circ\psi _{{11}}^{{{\minus}1}} (t)$
of the Clayton–Gumbel trivariate fully nested Lévy copula is
 $$f(t)=\left[ {\log \left( {1{\plus}t^{{{\minus}{1 \over {\delta _{{C,11}} }}}} } \right)} \right]^{{{\minus}\delta _{{G,21}} }} ,\quad t\geq 0$$
Now the first and second derivatives of this function are given as
 $$f'(t)={{\delta _{{G,21}} } \over {\delta _{{C,21}} }}\left[ {\log \left( {1{\plus}t^{{{\minus}{1 \over {\delta _{{C,11}} }}}} } \right)} \right]^{{{\minus}\delta _{{G,21}} {\minus}1}} {1 \over {t{\plus}t^{{{1 \over {\delta _{{C,11}} }}{\plus}1}} }}\geq 0\;{\rm and}$$
 $$\eqalignno{ f''(t)= & {{\delta _{{G,21}} } \over {\delta _{{C,21}} }}\left[ {\log \left( {1{\plus}t^{{{\minus}{1 \over {\delta _{{C,11}} }}}} } \right)} \right]^{{{\minus}\delta _{{G,21}} {\minus}2}} {1 \over {\left( {t{\plus}t^{{{1 \over {\delta _{{C,11}} }}{\plus}1}} } \right)^{2} }} \cr & {\times}\left[ {{{\delta _{{G,21}} {\plus}1} \over {\delta _{{C,21}} }}{\minus}\left[ {\log \left( {1{\plus}t^{{{\minus}{1 \over {\delta _{{C,11}} }}}} } \right)} \right]\left( {1{\plus}\left( {{1 \over {\delta _{{C,11}} }}{\plus}1} \right)t^{{{1 \over {\delta _{{C,11}} }}}} } \right)} \right] $$
The first derivative (3.15) is always non-negative. The second derivative (3.16) needs to be non-positive for the composite generator condition to be satisfied. This will be the case if and only if
 $$\delta _{{G,21}} \leq \mathop{{\min }}\limits_{t} \left\{ {\delta _{{C,11}} \left[ {\log \left( {1{\plus}t^{{{\minus}{1 \over {\delta _{{C,11}} }}}} } \right)} \right]\left( {1{\plus}\left( {{1 \over {\delta _{{C,11}} }}{\plus}1} \right)t^{{{1 \over {\delta _{{C,11}} }}}} } \right){\minus}1} \right\}$$
This inequality must hold for all values of t≥0, so the minimum of the term in the curly braces with respect to t is the upper bound for δ G,21. Unlike same family generators, there is no simple relationship between δ G,21 and δ C,11. Accordingly, this is not a straightforward restriction and as a result, the Clayton–Gumbel construction may yield a valid Lévy copula with limited choices of parameters.
Remark 3.4 Mixing generators in Lévy copula constructions of higher dimensions will be even more restricted. In most cases, checking the validity of a general d-dimensional multivariate constructions will involve the analysis of derivatives beyond f′′(t). As can be seen with Clayton–Gumbel trivariate nested Lévy copula, the second derivative of the composite Lévy generator is already a complicated expression. Differentiating this further will become increasingly tedious.
3.2.4. Quadvariate partially nested Lévy copulas
As an example, consider the Clayton quadvariate partially nested Lévy copula. This Lévy copula is constructed by selecting a Clayton Lévy generator for  $\psi _{{11}} $
,
 $\psi _{{12}} $
and
 $\psi _{{21}} $
in (3.3) and can be expressed as
 $$\raster="fx1"(u_{1} ,u_{2} ,u_{3} ,u_{4} )=\left( {\left( {u_{1}^{{{\minus}\delta _{{C,11}} }} {\plus}u_{2}^{{{\minus}\delta _{{C,11}} }} } \right)^{{{{\delta _{{C,21}} } \over {\delta _{{C,11}} }}}} {\plus}\left( {u_{3}^{{{\minus}\delta _{{C,12}} }} {\plus}u_{4}^{{{\minus}\delta _{{C,12}} }} } \right)^{{{{\delta _{{C,21}} } \over {\delta _{{C,12}} }}}} } \right)^{{{\minus}{1 \over {\delta _{{C,21}} }}}} $$
where δ C,11, δ C,12 and δ C,21 are parameters.
A valid quadvariate partially nested Lévy copula requires that both composite generators,  $$\psi _{{21}} \circ\psi _{{11}}^{{{\minus}1}} $$
and
 $\psi _{{21}} \circ\psi _{{12}}^{{{\minus}1}} $
have derivatives which are 1-differentiable and 1-monotone. Drawing from results obtained in section 3.2.1 for the Clayton trivariate nested Lévy copula, the parameter restrictions are
 $$\delta _{{C,21}} \leq \delta _{{C,11}} \,{\rm and}$$
 $$\delta _{{C,21}} \leq \delta _{{C,12}} $$
4. Simulation and Parameter Estimation
Simulation schemes for univariate and bivariate Lévy processes (with Lévy copulas) were developed in Cont & Tankov (Reference Cont and Tankov2004) and Esmaeili & Klüppelberg (Reference Esmaeili and Klüppelberg2010). In this section we use the algorithm of Tao (Reference Tao2011, appendix B) for trivariate nested Archimedean Lévy copulas and perform a similar analysis to that of Esmaeili & Klüppelberg (Reference Esmaeili and Klüppelberg2011). This allows us to draw some conclusions on the performance of maximum likelihood estimation of model parameters, using simulated sample paths of a trivariate compound Poisson process.
Let (S 1, S 2, S 3) be a trivariate compound Poisson process with marginal intensities λ 1, λ 2, λ 3>0, exponentially distributed marginal severities given by  $\bar{F}\left( {x_{i} } \right)=e^{{{\minus}\theta _{i} x}} ,\,x\,\gt\, 0$
for i∈{1, 2, 3}, and a structure specified by a Clayton trivariate fully nested Lévy copula
 $\raster="fx1"$
with parameters δ C,11≥ δ C,21>0.
We simulated 100 paths of a trivariate exponential fully nested Clayton model, with the parameters λ 1=100, λ 2=80, λ 3=50, θ 1=1, θ 2=2, θ 3=3 and different δ over the time interval [0, 1].
The results of the maximum likelihood estimates based on the simulated paths are summarised in the tables below.
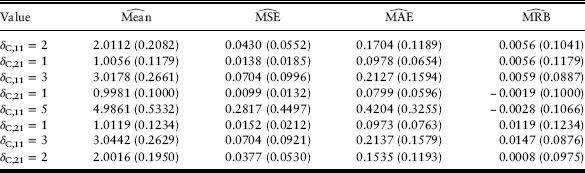
The results in Table 3 assume that the marginal parameters are known, but that the parameters of the Lévy copula are unknown. The table shows the means of maximum likelihood estimates  $\hat{\delta }$
of δ, as well as
 $$\widehat{{{\rm MSE}}}={1 \over {100}}\mathop{\sum}\limits_{i=1}^{100} {\left( {\hat{\delta }_{i} {\minus}\delta } \right)^{2} ;\;} \widehat{{{\rm MAE}}}={1 \over {100}}\mathop{\sum}\limits_{i=1}^{100} {\left| {\hat{\delta }_{i} {\minus}\delta } \right|} ;\;{\rm and}\;\widehat{{{\rm MRB}}}={1 \over {100}}\mathop{\sum}\limits_{i=1}^{100} {{{\hat{\delta }_{i} {\minus}\delta } \over \delta }} $$
the mean square error, mean absolute error and mean relative bias, respectively. All estimations achieve good results, with the maximum MRB being 1.5% approximately.
 $\widehat{{{\rm Mean}}}$
,
 $\widehat{{{\rm MSE}}}$
,
 $\widehat{{{\rm MAE}}}$
and
 $ \widehat{{{\rm MRB}}}$
(and s.d. in brackets) for 100 maximum likelihood estimations of the Lévy copula parameters of the trivariate exponential fully nested Clayton model.
Note: Each estimate is calculated from an observed simulated sample path with λ 1=100, λ 2=80, λ 3=50, θ 1=1, θ 2=2, θ 3=3 (assumed to be known) and unknown Lévy copula parameters δ C,i1 for i ∈ {1, 2}.
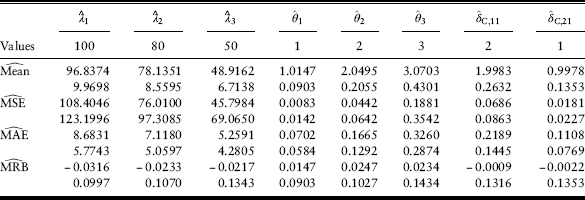
The result in Table 4 is similar to Table 3, but assumes all parameters are unknown. Figure 5 displays the relative biases in Table 4. The mean relative bias remains around 0 for all parameters in both Table 3 and Table 4 indicating a reasonably accurate estimation.
Boxplots of relative bias for the estimates of the trivariate exponential fully nested Clayton model with parameter values in Table 4.
Estimated  $\widehat{{{\rm Mean}}}$
,
 $\widehat{{{\rm MSE}}}$
,
 $\widehat{{{\rm MAE}}}$
and
 $ \widehat{{{\rm MRB}}}$
(and s.d. in brackets) of 100 maximum likelihood estimates of a trivariate exponential fully nested Clayton model.
Remark 4.1 The simulation algorithm that has been used becomes exponentially untractable for higher dimensions. The simulation algorithm developed in Grothe & Hofert (Reference Grothe and Hofert2015) addresses this issue, and should be preferred for higher dimensions. This dimension problem carries over to the estimation procedure. To the extent of our knowledge, this has not been addressed in the literature yet, and is left for future research.
5. Illustration with Danish Fire Data
In this section, we illustrate the fitting of a non-exchangeable dependence structure using the very well-known Danish fire data set. Some short notes on the actual programming involved in this section are provided in Appendix C.
5.1. The Danish data set
The Danish fire insurance data is composed of insurance claims from the beginning of 1980 until the end of 1990, which have been adjusted to 1985 values for inflation. The same data set was considered in Esmaeili & Klüppelberg (Reference Esmaeili and Klüppelberg2010) in the bivariate setting by dropping the Profits line of insurance. Nadarajah & Bakar (Reference Nadarajah and Bakar2014) use composite models to model the payments between two lines. The Danish data is a trivariate data set of 2,167 fire losses expressed in millions of Danish Kroner, in the lines of Building, Contents and Profits. Claims are only recorded where the total loss is larger than a million. That is, when the combined loss of Building, Contents and Profits exceeds one million, it is recorded.
As a result of the truncated nature of the data, an artificial negative dependence is introduced between Buildings and Contents. To ensure that this artificial dependence does not interfere with the fitting procedure, we have limited our analysis to claims, which are greater than one million Danish Kroner in all three components. In this case, the size of a claim in a given line does not bear any information about claims in the other lines, as the sum is necessarily more than a million already.
Furthermore, the data does not exhibit a homogeneous arrival process, which is necessary for fitting a trivariate compound Poisson process. A transformation was applied to the arrival processes to ensure homogeneity, following the approach in Mikosch (Reference Mikosch2006). This transformation was successful and yielded processes that look homogeneous, except perhaps for the “Profits” line. However, perfect homogenisation of the “Profits” line cannot be expected due to a very small sample size. Overall, we consider the results reasonable for our illustrative purposes.
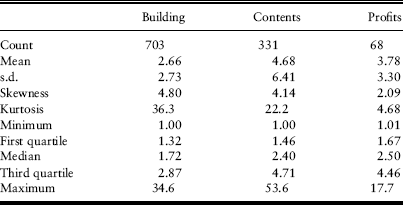
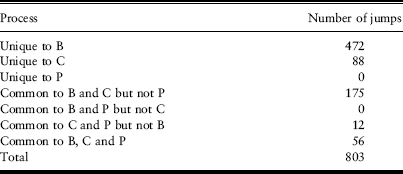
After these adjustments and removal of two outliers (the two largest observations), the data is reduced to 803 fire losses. The common (synchronous) claims in this set of data are directly observable as the claims data specifies the time of a claim, and claim severity across the three lines of insurance. When a claim amount is specified as 0, we assume no (Poisson) arrival in that class as there is no claim. The descriptive statistics for the reduced Danish fire data are shown in Table 5.
Descriptive statistics for Danish data.
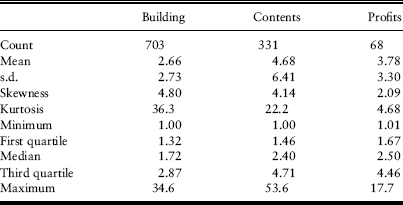
The Building and Contents components have a significantly higher number of jumps compared with those in Profits. As such, there has been a primary focus on those two components in existing literature (see, for instance Esmaeili & Klüppelberg, Reference Esmaeili and Klüppelberg2010). We extend those studies by including the third line available in the data set, “Profits”.
5.2. Dependence between the three processes
Here dependence can manifest itself in either frequency (events leading to claims in more than one process) or severity (claim amounts varying in sympathy with each others).
Dependence in frequency is obvious from Table 6, which shows a decomposition of the total number of Poisson arrivals in each process. Processes include jumps that are unique to one component, jumps that are common to two components but not the third and jumps that are common across all lines of business. Here, B denotes the Building component, C denotes the Contents component and P denotes Profit. P claims, although scarce (presumably because of the truncation of the data) never occur alone (unsurprisingly). Furthermore, every single P claim occurs with a C claim, which makes this pair strongly “frequency dependent”. On the other hand, only about a third of the B claims are common with claims in either P or C.
Total number of jumps in each process.
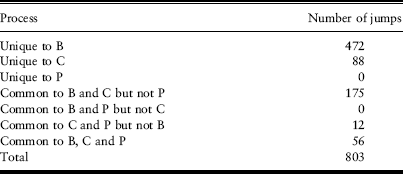
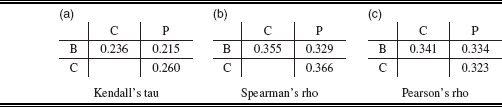
With respect to severity, Figure 6 shows the empirical copulas for the severity of common jumps between pairwise components. Pairwise components include the process with jumps common to two processes and not the third, as well as the process with jumps common to all components. These plots suggest some moderate positive dependence, which is confirmed by standard indicators, shown in Table 7.
Empirical severity copula of common jumps between: Contents and Profits (left), Contents and Building (middle), and Profits and Building (right).
Some standard indicators on the severities of bivariate marginal jumps.
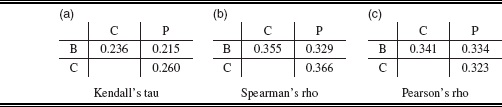
Overall, the three processes seem to be positively dependent, with the main source of dependence being common events (frequency), and with some positive dependence in severity as well. This is encouraging, as it makes the use of dependent multivariate Poisson processes an appropriate approach.
5.3. Fitting the marginal univariate processes
The fitting of the marginal Danish fire data processes has been studied extensively in the past literature. However, our adjustments, as well as consideration of the Profits line, require us to allocate a few lines on this step.
The estimates we obtained for the unit intensities of the three homogenised processes were 0.88, 0.41 and 0.09 (claims per day) for processes B, C and P, respectively.
We tried to fit the log of the marginal claim amounts with Lognormal, gamma, Weibull and Pareto distributions. For the C and P lines, the Weibull distribution yielded the best goodness-of-fit according to likelihood, Kolmogorov–Smirnoff and Andersen–Darling criteria. For the B line, the results were inconclusive between gamma (which had a better Andersen–Darling result) and Weibull (which had a slightly better likelihood result). In what follows, we will thus use the Weibull distribution for the C and P lines, and will defer our choice between gamma and Weibull to the trivariate likelihood fitting.
5.4. Fitting the trivariate process
When constructing a multivariate nested structure, one must choose which pairs to “couple” first. This important choice is not trivial. Obviously, it will affect how good the fit will be, but also an inappropriate order of nesting could lead to an invalid structure (see Table 2). Often, the most strongly dependent processes must be coupled first (a similar observation was made in the distributional copula literature); see also Remark 3.3.
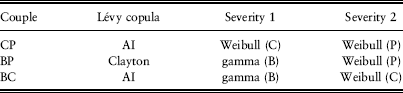
In order to choose a structure, we examined the goodness-of-fit of three candidate Lévy copulas (AI, Clayton and Gumbel) on the three marginal bivariate processes (using the approach suggested in Avanzi et al., Reference Avanzi, Cassar and Wong2011; Esmaeili & Klüppelberg, Reference Esmaeili and Klüppelberg2013). We ranked results using the overall maximum (full) likelihood. Initial values for the parameters were obtained using an Inference Functions of Margins method (see chapter 10 of Joe, Reference Joe1997); further details about the computation of the results are available in Appendix C. Results are provided in Table 8. Note that the best severity distributions were consistent (also for sub-optimal choices of Lévy copulas): Weibull for P and C, gamma for B. Furthermore, we should note that AI wins for the couple BC only by a tiny margin; the Clayton fit was practically as good.
Best fits for the marginal bivariate processes.
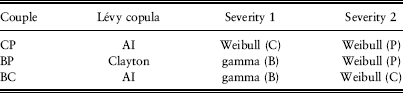
As a consequence we considered structures with AI and/or Clayton Lévy copulas. In both cases, the bivariate process with the highest dependence parameter should be coupled first. In the results of the bivariate fits, this consistently proved to be that of the pair CP, which could be expected from our analysis in section 5.2.
Remember that the remaining two dependence relationships can be different from the first, but must necessarily be described by the same Lévy copula (see the left hand side figure in Figure 4 without the third line for a description of the trivariate fully nested structure). Thus, we investigated the choices of either AI or Clayton for the outer layer. The Clayton option did not yield reasonable results, and we finally retained fully nested trivariate AI structure with the following maximum likelihood frequency parameters
 $$\hat{\lambda }_{{\rm B}} =0.88\quad ({\rm with}\;{\rm s}{\rm .e}{\rm .}\;0.03)$$
 $$\hat{\lambda }_{{\rm C}} =0.42\quad ({\rm with}\;{\rm s}{\rm .e}{\rm .}\;0.02)$$
 $$\hat{\lambda }_{{\rm P}} =0.10\quad ({\rm with}\;{\rm s}{\rm .e}{\rm .}\;0.01)$$
whereas the empirical frequencies were 0.88, 0.41 and 0.09, respectively. The fitted AI parameters are  $\hat{\delta }_{1} =10.28$
and
 $\hat{\delta }_{2} =10.55$
, respectively. The claims severities of the processes B, C and P are gamma (1.25 (s.e. 0.06), 1.58 (s.e. 0.08)), Weibull (1.11 (s.e. 0.05), 1.26 (s.e. 0.06)) and Weibull (1.27 (s.e. 0.12), 1.50 (s.e. 0.12)), respectively.
The maximum likelihood severity parameters changed from the marginal fits performed in section 5.3 due to the inherent trade-off, during the maximisation process, between the goodness-of-fit of frequency, severity and dependence in all three processes. In this case, the fit of the severities is best illustrated with plots, which are provided in Figures 7, 8 and 9 for the processes B, C and P, respectively. The fit is quite good for B and C and slightly off for P. The latter can be explained by the relative low frequency of P claims. The other two processes carried so much weight in the maximisation process (the trade-off described above) that comparatively more concessions had to be made in the P process. Given we have only few data points for that process we believe the goodness-of-fit of this final solution is still acceptable.
Goodness-of-fit of the Building claims process. (a) Empirical (dots) versus theoretical (solid line) tail integrals; (b) severities of all jumps; (c) severities of unique jumps; (d) severities when common with C but not P; (e) severities when common with P but not C; (f) severities when common with C and P.
Goodness-of-fit of the Contents claims process. (a) Empirical (dots) versus theoretical (solid line) tail integrals; (b) severities of all jumps; (c) severities of unique jumps; (d) severities when common with B but not P; (e) severities when common with P but not B; (f) severities when common with B and P.
Goodness-of-fit of the Profits claims process. (a) Empirical (dots) versus theoretical (solid line) tail integrals; (b) severities of all jumps; (c) severities of unique jumps; (d) severities when common with B but not C; (e) severities when common with C but not B; (f) severities when common with B and C.
Acknowledgements
The authors are grateful to anonymous reviewers for comments, as well as to colleagues who attended the 16th International Congress on Insurance: Mathematics and Economics in June 2012 in Hong Kong, and who provided useful insights about the fitting procedure. This research was supported under an Australian Actuarial Research Grant provided by the Actuaries Institute, as well as under Australian Research Council’s Linkage Projects funding scheme (project number LP130100723). Jamie Tao acknowledges financial support from the Brian Gray (Honours) scholarship, provided by APRA and RBA. Xinda Yang acknowledges financial support from an Australian Postgraduate Award, as well as supplementary scholarships provided by the Australian School of Business, UNSW. The views expressed herein are those of the authors and are not necessarily those of the supporting organisations.
Appendix A: Spectrally Positive Lévy Processes
Definition A.1 (Lévy process, Sato, Reference Sato1999) A stochastic process S(t) on  ${\Bbb R}^{d} $
is a Lévy process if
1. For every s, t≥0, the increment of the process
${\bf S}\left( {t{\plus}s} \right){\minus}{\bf S}\left( t \right)$
is independent of the process
$\left( {{\bf S}\left( v \right),0\leq v\leq t} \right)$
2. The distribution of
${\bf S}\left( {t{\plus}s} \right){\minus}\,{\bf S}\left( t \right)$
is the same as S(s) (or stationary)3.
${\rm Pr}\left( {{\bf S}_{0} ={\bf 0}} \right)={\rm 1}$
4. It is stochastically continuous.


Lévy measures are measurements of jumps which characterise a particular Lévy process, with the exception of the Wiener process. The Lévy measure is defined as follows.
Definition A.2 (Lévy measure) For a Lévy process S(t), the Lévy measure ν is defined by
 $$\nu \left( A \right)=E\left[ {\,\#\,\{ t\,\in \,} \right[0,{\rm 1}\left] {:\,\Delta {\bf S}\left( t \right) \,\ne\,\,0,\Delta {\bf S}\left( t \right)\,\in \,A\} } \right],\quad A\,\in \,B\left( {{\Bbb R}^{d} } \right)$$
where ν(A) is the expected number of jumps whose size belongs to A (for 1 unit of time), the expected number of jumps of size 0 are excluded (as this will result in an undefined Lévy measure), and where B represents the Borel set.
Appendix B: Detailed Proofs
The validity of any Lévy copula construction relies on whether or not it satisfies the properties of a Lévy copula. Recall from its formal definition (see e.g. Tankov, Reference Tankov2003; Cont & Tankov, Reference Cont and Tankov2004) that these properties are (1) grounded; (2) uniform margins; and (3) d-increasing.
For the purpose of this paper, a formal proof will be completed for the trivariate and quadvariate nested Lévy copulas. Applying the same ideas as we present, the proof can readily be extended to any dimension, but the proof becomes more tedious with increasing dimensions. First, we need the following definitions.
Definition B.1 (Monotonicity, McNeil & Nešlehová, Reference McNeil and Nešlehová2009; Bäuerle & Blatter, Reference Bäuerle and Blatter2011)
1. A real function f is said to be d-monotone on (a, b), where
$$a,b\,\in \,{\Bbb R}$$
and d≥2, if it is differentiable on (a, b) up to order d−2 and the derivatives satisfy(B.1)for any
$$\left( {{\minus}{\rm 1}} \right)^{k} \,f^{{(k)}} \,\left( x \right)\geq 0, \quad k\,\in \,\{ 0,\,{\rm 1},\:\,\ldots\,\:,\,d{\minus}{\rm 2}\} $$
$x\,\in \,(a,b)$
and further if
$({\minus}1)^{{d{\minus}}} {^{\rm 2}} \,f^{{(d{\minus}{\rm 2})}} $
is non-increasing and convex in (a, b).2. For d=1, f is called 1-monotone in (a, b) if it is non-negative and non-increasing in (a, b).
3. If f has derivatives of all orders on (a, b) and if
$({\minus}1)^{k} \,f^{{(k)}} \,\geq 0$
for any x in (a, b), then f is said to be completely monotone.


Definition B.2 (d-increasing, Nelsen, Reference Nelsen1999) A d-variate function F is called d-increasing if and only if for all choices  $$B=[a_{1} ,b_{1} ]{\times}\:\,\ldots\,\:{\times}[a_{d} ,b_{d} ]$$
in the domain of F, where
 $a_{i} \leq b_{i} \,{\rm for}\,i\,\in \,\{ 1,\:\,\ldots\,\:,d\} $
,
 $$V_{F} (B)\geq 0$$
where V F(B), the F-volume of B is given by dth order difference
 $$\eqalignno{ V_{F} (B)\,=\, & \Delta _{{a1}}^{{b1}} \cdots \Delta _{{ad}}^{{bd}} F(u_{1} ,\:\,\ldots\,\:\:,u_{d} ) \cr = & \mathop{\sum}\limits_{i_{1} =1}^2 \cdots \mathop{\sum}\limits_{i_{d} =1}^2 {({\minus}1)^{{i_{1} {\plus}\,\ldots\,{\plus}i_{d} }} F(u_{{1i_{1} }} ,\:\,\ldots\,\:\:,u_{{di_{d} }} )} $$
where  $u_{j} {_{\rm 1}} \,=\,a_{j} $
and
 $u_{j} {_{\rm 2}} \,=b_{j} $
for all
 $j\,\in \,\{ 1,\:\:\,\ldots\,\:,d\} $
.
Before we can formally prove the validity of the nested construction, we will require the following ancilliary result.
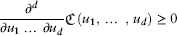
Lemma B.1 (Non-negativity of partial derivative to difference 2) Suppose that  ${{\partial ^{d} } \over {\partial u_{1} \:\,\ldots\,\:\partial u_{d} }}\,{\raster="fx1"}\,(u_{1} ,\:\,\ldots\,\:,\,u_{d} )$
exists and is continuous. Then, for any choice of a d-box
 $B=[a_{1} ,b_{1} ]\,{\times}\:\,\ldots\,\:{\times}\,[a_{d} ,b_{d} ]$
in the domain of
 $\raster="fx1"$
, where
 $a_{i} \,\leq \,b_{i} $
, we have, for all
 $i\,\in \,\,\{ 1,\:\,\ldots\,\:,\,d\} $
 $$\Delta _{{a_{1} }}^{{b_{1} }} \,\ldots\,\Delta _{{a_{d} }}^{{b_{d} }} \,\raster="fx1"\,(u_{1} ,\:\,\ldots\,\:,\,u_{d} )\geq 0$$
if and only if
 $${{\partial ^{d} } \over {\partial u_{1} \:\,\ldots\,\:\partial u_{d} }}\,\raster="fx1"\,(u_{1} ,\:\,\ldots\,\:,\,u_{d} )\geq 0$$
Proof. For d=2 the result is well known and can be found in, for example, Ross (Reference Ross1983, proposition 4.2). Extending to the case of d>2, if  $${{\partial ^{d} } \over {\partial u_{1} \:\,\ldots\,\:\partial u_{d} }}\,\raster="fx1"\,(u_{1} ,\:\,\ldots\,\:,\,u_{d} )\geq 0$$
then for
 $a_{i} \,\leq \,b_{i} $
for all
 $i\,\in \,\{ {\rm 1},\:\,\ldots\,\:,\,d\} $
 $$\eqalignno{ & \mathop{\int}\nolimits_{a_{1} }^{b_{1} } { \cdots \mathop{\int}\nolimits_{a_{{d{\minus}1}} }^{b_{{d{\minus}1}} } {\mathop{\int}\nolimits_{a_{d} }^{b_{d} } {\,{{\partial ^{d} } \over {\partial u_{1} \:\,\ldots\,\:\partial u_{d} }}\,\raster="fx1"\,(u_{1} ,\:\,\ldots\,\:,\,u_{{d{\minus}1}} ,u_{d} )du_{d} \geq 0} } } \cr & \mathop{\int}\nolimits_{a_{1} }^{b_{1} } { \cdots \,\mathop{\int}\nolimits_{a_{{d{\minus}1}} }^{b_{{d{\minus}1}} } {\,{{\partial ^{{d{\minus}1}} } \over {\partial u_{1} \:\,\ldots\,\:\partial u_{{d{\minus}1}} }}} } (\Delta _{{a_{d} }}^{{b_{d} }} \,\raster="fx1"\,(u_{1} ,\:\,\ldots\,\:,\,u_{{d{\minus}1}} ,u_{d} ))du_{{d{\minus}1}} \geq 0 \cr & \hskip 19pc \vdots \cr\Delta _{{a_{1} }}^{{b_{1} }} \:\,\ldots\,\:\Delta _{{a_{d} _{{_{\minus 1}}} }}^{{b_{{d{\minus}1}} }} \Delta _{{a_{d} }}^{{b_{d} }} \,\raster="fx1"\,(u_{1} ,\:\,\ldots\,\:,\,u_{{d{\minus}1}} ,u_{d} )\geq 0 $$
To go the other way, assume that  $$\Delta _{{a_{1} }}^{{b_{1} }} \:\,\ldots\,\:\Delta _{{a_{d} _{{_{\minus 1}}} }}^{{b_{{d{\minus}1}} }} \Delta _{{a_{d} }}^{{b_{d} }} \,\raster="fx1"\,(u_{1} ,\:\,\ldots\,\:,\,u_{{d{\minus}1}} ,u_{d} )\geq 0$$
. Then for
 $$a_{i} \,\leq \,b_{i} $$
for all
 $$i\,\in \,\{ {\rm 1},\:\,\ldots\,\:,\,d\} $$
 $${{\Delta _{{a_{1} }}^{{b_{1} }} \:\,\ldots\,\:\Delta _{{a_{d} _{{_{\minus 1}}}}}^{{b_{{d{\minus}1}} }} \,\raster="fx1"\,(u_{1} ,\:\,\ldots\,\:,u_{{d{\minus}1}} ,b_{d} )} \over {\Delta _{{a_{1} }}^{{b_{1} }} \,\,\ldots\,\,\Delta _{{a_{d} _{{_{\minus 1}}} }}^{{b_{{d{\minus}1}} }} (u_{1} \,{\times}\:\,\ldots\,\:{\times}\,u_{{d{\minus}1}} )}}\,\geq \,{{\Delta _{{a_{1} }}^{{b_{1} }} \:\,\ldots\,\:\Delta _{{a_{d} _{{_{\minus 1}}} }}^{{b_{{d{\minus}1}} }} \,\raster="fx1"(u_{1} ,\:\,\ldots\,\:,u_{{d{\minus}1}} ,a_{d} )} \over {\Delta _{{a_{1} }}^{{b_{1} }} \:\,\ldots\,\:\Delta _{{a_{d} _{{_{\minus 1}}} }}^{{b_{{d{\minus}1}} }} (u_{1} \,{\times}\:\,\ldots\,\:{\times}\,u_{{d{\minus}1}} )}}$$
Now let b 1 converge to a 1 to obtain
 $${\partial \over {\partial u_{1} }}\left( {{{\Delta _{{a_{2} }}^{{b_{2} }} \:\,\ldots\,\:\Delta _{{a_{d} _{{_{\minus 1}}} }}^{{b_{{d{\minus}1}} }} \,\raster="fx1"\,(u_{1} ,\:\,\ldots\,\:,\,u_{{d{\minus}1}} ,b_{d} )} \over {\Delta _{{a_{2} }}^{{b_{2} }} \:\,\ldots\,\:\Delta _{{a_{d} _{{_{\minus 1}}} }}^{{b_{{d{\minus}1}} }} (u_{2} \,{\times}\:\,\ldots\,\:{\times}\,u_{{d{\minus}1}} )}}} \right)\,\geq \,{\partial \over {\partial u_{1} }}\left( {{{\Delta _{{a_{2} }}^{{b_{2} }} \:\,\ldots\,\:\Delta _{{a_{d} _{{_{\minus 1}}} }}^{{b_{{d{\minus}1}} }} \,\raster="fx1"\,(u_{1} ,\:\,\ldots\,\:,\,u_{{d{\minus}1}} ,a_{d} )} \over {\Delta _{{a_{2} }}^{{b_{2} }} \:\,\ldots\,\:\Delta _{{a_{d} _{{_{\minus 1}}} }}^{{b_{{d{\minus}1}} }} (u_{2} \,{\times}\:\,\ldots\,\:{\times}\,u_{{d{\minus}1}} )}}} \right)$$
Then let b 2 converge to a 2, … , b d−1 converge to a d−1 to obtain
 $${{\partial ^{d-1} } \over {\partial u_{1} \,\ldots\,\partial u_{{d{\minus}1}} }}({\raster="fx1"}\,(u_{1} ,\,\,\ldots\,,u_{{d{\minus}1}} ,b_{d} )\,)\,\geq \,{{\partial ^{d-1} } \over {\partial u_{1} \,\ldots\,\partial u_{{d{\minus}1}} }}\,({\raster="fx1"}\,(u_{1} ,\,\,\ldots\,,u_{{d{\minus}1}} ,a_{d} ))$$
implying that
 $${{\partial ^{d} } \over {\partial u_{1} \:\,\ldots\,\:\partial u_{d} }}\,\raster="fx1"(u_{1} ,\:\,\ldots\,\:,\,u_{d} )\,\geq \,0$$
B.1. Proof of Theorem 3.1
(Grounded)
The property of being grounded means that  ${\raster="fx1"}(u_{1} ,\,u_{2} ,\,u_{3} )=0$
whenever u i=0 for at least one
 $i\,\in \,\{ {\rm 1},\,{\rm 2},\,{\rm 3}\} $
.
If u 1=0
 $$\eqalignno{ {\raster="fx1"}(0,u_{2} ,u_{3} )\, & =\,\psi _{{21}}^{{{\minus}1}} (\psi _{{21}} \circ\psi _{{11}}^{{{\minus}1}} (\psi _{{11}} (0){\plus}\psi _{{11}} (u_{2} ))\,{\plus}\psi _{{21}} (u_{3} )) \cr & =\,\psi _{{21}}^{{{\minus}1}} (\psi _{{21}} \circ\psi _{{11}}^{{{\minus}1}} (\infty){\plus}\psi _{{21}} (u_{3} )) =\,\psi _{{21}}^{{{\minus}1}} (\infty)\,=\,0 $$
The result for u 2 has a similar proof.If u 3=0
 $$\eqalignno{ \raster="fx1"(u_{1} ,u_{2} ,0)\, & =\,\psi _{{21}}^{{{\minus}1}} (\psi _{{21}} \circ\psi _{{11}}^{{{\minus}1}} (\psi _{{11}} (u_{1} ){\plus}\psi _{{11}} (u_{2} ))\,{\plus}\psi _{{21}} (0)) =\,\psi _{{21}}^{{{\minus}1}} (\infty)\,=\,0 $$
(Uniform margins)The margin for u 1 is given by
 $$\eqalignno{ \raster="fx1"(u_{1} ,\infty,\infty)\, & =\,\psi _{{21}}^{{{\minus}1}} (\psi _{{21}} \circ\psi _{{11}}^{{{\minus}1}} (\psi _{{11}} (u_{1} ){\plus}\psi _{{11}} (\infty))\,{\plus}\psi _{{21}} (\infty)) \cr & =\,\psi _{{21}}^{{{\minus}1}} (\psi _{{21}} (u_{1} ){\plus}0)\,=\,u_{1} $$
The margin for u 2 has a similar proof.The margin for u 3 is given by
 $$\eqalignno{ \raster="fx1"(\infty,\infty,u_{3} )\, & =\,\psi _{{21}}^{{{\minus}1}} (\psi _{{21}} \circ\psi _{{11}}^{{{\minus}1}} (\psi _{{11}} (\infty){\plus}\psi _{{11}} (\infty))\,{\plus}\psi _{{21}} (u_{3} )) \cr =\,\psi _{{21}}^{{{\minus}1}} (0{\plus}\psi _{{21}} (u_{3} ))\,=\,u_{3} $$
(3-increasing)Let us denote  $$\psi _{{21}}^{{{\minus}1}} $$
as g and
 $$\psi _{{21}} \circ\psi _{{11}}^{{{\minus}1}} $$
as h for notational simplicity, so (3.1) can be expressed as
 $$\raster="fx1"(u_{1} ,u_{2} ,u_{3} )\,=\,g(h(\psi _{{11}} (u_{1} )\,{\plus}\,\psi _{{11}} (u_{2} ))\,{\plus}\,\psi _{{21}} (u_{3} ))$$
If g is 3-continuously differentiable and 3-monotone on (0, ∞), then for all  $$</tex-math>
</alternatives>
</inline-formula>, <italic>g</italic>′(<italic>u</italic>)<italic>≤</italic>0, <italic>g</italic>″(<italic>u</italic>)<italic>≥</italic>0 and <italic>g″′</italic>(<italic>u</italic>)<italic>≤</italic>0. If <italic>h</italic> has a derivative which is 1-continuously differentiable and 1-monotone on (0, ∞), then for all <italic>u></italic>0: <italic>h</italic>(<italic>u</italic>)<italic>≥</italic>0, <italic>h</italic>′(<italic>u</italic>)<italic>≥</italic>0 and h″(<italic>u</italic>)<italic>≤</italic>0. Furthermore, as <inline-formula>
<alternatives>
<inline-graphic xlink:href="S1748499515000135_eqnU178" xlink:type="simple" mime-subtype="gif" mimetype="image" xmlns:xlink="http://www.w3.org/1999/xlink"/>
<tex-math>
<![CDATA[$\psi \,_{{11}} $
and
 $\psi _{{21}} $
are Archimedean Lévy generators, they are continuous and decreasing functions on (0, ∞) by definition, so for all
 $u\,\gt\, 0\!:\psi _{i1} \left( u \right)\geq 0$
and
 $\psi '_{{i1}} (u)\leq 0$
for i ∈ {1, 2}. Hence
 $${{\partial ^{3} } \over {\partial u_{1} \partial u_{2} \partial u_{3} }}\raster="fx1"(u_{1} ,u_{2} ,u_{3} )\,\,=\,\psi '_{{11}} (u_{1} )\psi '_{{11}} (u_{2} )\psi '_{{21}} (u_{3} )[g'''( \cdot )(h'( \cdot ))^{2} {\plus}g''( \cdot )h''( \cdot )]\geq 0$$
which is continuous, and by Lemma B.1, the nested construction has a non-negative third-order difference. Thus, a construction subject to the conditions specified in Theorem 3.1 is 3-increasing and the construction yields a valid Lévy copula□
B.2. Proof of Theorem 3.2
(Grounded)If u 1=0
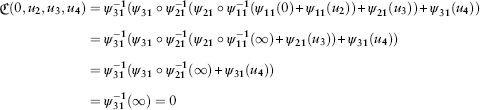 $$\eqalignno{ \raster="fx1"(0,u_{2} ,u_{3} ,u_{4} ) & =\psi _{{31}}^{{{\minus}1}} (\psi _{{31}} \circ\psi _{{21}}^{{{\minus}1}} (\psi _{{21}} \circ\psi _{{11}}^{{{\minus}1}} (\psi _{{11}} (0){\plus}\psi _{{11}} (u_{2} )){\plus}\psi _{{21}} (u_{3} )){\plus}\psi _{{31}} (u_{4} )) \cr & =\psi _{{31}}^{{{\minus}1}} (\psi _{{31}} \circ\psi _{{21}}^{{{\minus}1}} (\psi _{{21}} \circ\psi _{{11}}^{{{\minus}1}} (\infty){\plus}\psi _{{21}} (u_{3} )){\plus}\psi _{{31}} (u_{4} )) \cr & =\psi _{{31}}^{{{\minus}1}} (\psi _{{31}} \circ\psi _{{21}}^{{{\minus}1}} (\infty){\plus}\psi _{{31}} (u_{4} )) \cr=\psi _{{31}}^{{{\minus}1}} (\infty)=0 $$
The result for u 2 has a similar proof.If u 3=0
 $$\eqalignno{ \raster="fx1"(u_{1} ,u_{2} ,0,u_{4} ) & =\psi _{{31}}^{{{\minus}1}} (\psi _{{31}} \circ\psi _{{21}}^{{{\minus}1}} (\psi _{{21}} \circ\psi _{{11}}^{{{\minus}1}} (\psi _{{11}} (u_{{_{1} }} ){\plus}\psi _{{11}} (u_{2} )){\plus}\psi _{{21}} (0)){\plus}\psi _{{31}} (u_{4} )) \cr & =\psi _{{31}}^{{{\minus}1}} (\psi _{{31}} \circ\psi _{{21}}^{{{\minus}1}} (\infty){\plus}\psi _{{31}} (u_{4} )) \cr=\psi _{{31}}^{{{\minus}1}} (\infty)=0 $$
If u 4=0
 $$\eqalignno{ \raster="fx1"(u_{1} ,u_{2} ,u_{3} ,0) & =\psi _{{31}}^{{{\minus}1}} (\psi _{{31}} \circ\psi _{{21}}^{{{\minus}1}} (\psi _{{21}} \circ\psi _{{11}}^{{{\minus}1}} (\psi _{{11}} (u_{{_{1} }} ){\plus}\psi _{{11}} (u_{2} )){\plus}\psi _{{21}} (u_{3} )){\plus}\psi _{{31}} (0)) \cr & =\psi _{{31}}^{{{\minus}1}} (\infty)=0 $$
(Uniform margins)The margin for u 1 is given by
 $$\eqalignno{ \raster="fx1"(u_{1} ,\infty,\infty,\infty) & =\psi _{{31}}^{{{\minus}1}} (\psi _{{31}} \circ\psi _{{21}}^{{{\minus}1}} (\psi _{{21}} \circ\psi _{{11}}^{{{\minus}1}} (\psi _{{11}} (u_{1} ){\plus}\psi _{{11}} (\infty)){\plus}\psi _{{21}} (\infty)){\plus}\psi _{{31}} (\infty)) \cr & =\psi _{{31}}^{{{\minus}1}} (\psi _{{31}} \circ\psi _{{21}}^{{{\minus}1}} (\psi _{{21}} (u_{1} ){\plus}0){\plus}0) \cr=\psi _{{31}}^{{{\minus}1}} (\psi _{{31}} (u_{1} ))=u_{1} $$
The margin for u 2 has a similar proof.The margin for u 3 is given by
 $$\eqalignno{ \raster="fx1"(\infty,\infty,u_{3} ,\infty) & =\psi _{{31}}^{{{\minus}1}} (\psi _{{31}} \circ\psi _{{21}}^{{{\minus}1}} (\psi _{{21}} \circ\psi _{{11}}^{{{\minus}1}} (\psi _{{11}} (\infty){\plus}\psi _{{11}} (\infty)){\plus}\psi _{{21}} (u_{3} )){\plus}\psi _{{31}} (\infty)) \cr & =\psi _{{31}}^{{{\minus}1}} (\psi _{{31}} \circ\psi _{{21}}^{{{\minus}1}} (0{\plus}\psi _{{21}} (u_{3} ){\plus}0) \cr =\psi _{{31}}^{{{\minus}1}} (\psi _{{31}} (u_{3} ))=u_{3} $$
The margin for u 4 is given by
 $$\eqalignno{ \raster="fx1"(\infty,\infty,\infty,u_{4} ) & =\psi _{{31}}^{{{\minus}1}} (\psi _{{31}} \circ\psi _{{21}}^{{{\minus}1}} (\psi _{{21}} \circ\psi _{{11}}^{{{\minus}1}} (\psi _{{11}} (\infty){\plus}\psi _{{11}} (\infty)){\plus}\psi _{{21}} (\infty)){\plus}\psi _{{31}} (u_{4} )) \cr & =\psi _{{31}}^{{{\minus}1}} (\psi _{{31}} (u_{4} ))=u_{4} $$
(4-increasing)
Let us denote  $$\psi _{{31}}^{{{\minus}1}} $$
as
 $$g{\rm ,}\,\psi _{{31}} \circ\psi _{{21}}^{{{\minus}1}} $$
as h 2 and
 $$\psi _{{21}} \circ\psi _{{11}}^{{{\minus}1}} $$
as h 1 for notational simplicity, so (3.2) can be expressed as
 $$\raster="fx1"(u_{1} ,u_{2} ,u_{3} ,u_{4} )=g(h_{2} (h_{1} (\,\psi _{{11}} (u_{1} ){\plus}\psi _{{11}} (u_{2} )){\plus}\psi _{{21}} (u_{3} )){\plus}\psi _{{31}} (u_{4} ))$$
If g is 4-continuously differentiable and 4-monotone on (0, ∞), then for all u>0: g(u)≥0, g′(u)≤0, g″(u)≥0, g″′(u)≤0 and g″″(u)≥0. If h 2 has a derivative which is 2-continuously differentiable and 2-monotone on (0, ∞), then for all  $u\,\gt\, 0\!\!:h_{2} (u)\geq 0,\,\,h'_{2} (u)\geq 0,\,\,h''_{2} (u)\leq 0\,{\rm and}\,h'''_{2} (u)\geq 0$
. If h 1 has a derivative which is 1-continuously differentiable and 1-monotone on (0, ∞), then for all
 $u\,\gt\, 0:h_{1} (u)\geq 0,\,\,h'_{1} (u)\geq 0,\,\,h''_{1} (u)\leq 0$
. Furthermore, as
 $\psi _{{11}} ,\,\psi _{{21}} \,{\rm and}\,\psi _{{31}} $
are Archimedean Lévy generators, they are continuous and decreasing functions on (0, ∞) by definition, so for all u>0: ψ i1(u)≥0 and
 $\psi{\prime}\!_{{i1}} (u)\leq 0$
for i ∈ {1, 2, 3}.Hence
 $$\eqalignno{ {{\partial ^{4} } \over {\partial u_{1} \partial u_{2} \partial u_{3} \partial u_{4} }}\raster="fx1"(u_{1} ,u_{2} ,u_{3} ,u_{4} )= \,\,& \psi '_{{11}} (u_{1} )\psi '_{{11}} (u_{2} )\psi '_{{21}} (u_{3} )\psi '_{{31}} (u_{4} )[g''''( \cdot )(h'_{2} ( \cdot ))^{3} (h'_{1} ( \cdot ))^{2} \cr & {\plus}2g'''( \cdot )h'_{2} ( \cdot )h''_{2} ( \cdot )(h'_{1} ( \cdot ))^{2} {\plus}g'''( \cdot )h''_{2} ( \cdot )h'_{2} ( \cdot )(h'_{1} ( \cdot ))^{2} \cr & {\plus}g''( \cdot )h'''_{2} ( \cdot )(h'_{1} ( \cdot ))^{2} {\plus}g'''( \cdot )(h'_{2} ( \cdot ))^{2} h''_{1} ( \cdot ) \cr & {\plus}g''( \cdot )h''_{2} ( \cdot )h''_{1} ( \cdot )]\geq 0 $$
which is continuous, and by Lemma B.1, the nested construction has a non-negative fourth-order difference. Thus, a construction subject to the conditions specified in Theorem 3.2 is 4-increasing and the construction yields a valid Lévy copula.
Remark B.1 Note proof of Theorem 3.2 (quadvariate fully nested) is similar to that of Theorem 3.1 (trivariate fully nested), but is included here to illustrate how to generalise results to any dimensions. However, the proofs may become more tedious the larger the Lévy copula model.
B.3. Proof of Theorem 3.3
(Grounded)
If u 1=0
 $$\eqalignno{ \raster="fx1"(0,u_{2} ,u_{3} ,u_{4} ) & =\psi _{{21}}^{{{\minus}1}} (\psi _{{21}} \circ\psi _{{11}}^{{{\minus}1}} (\psi _{{11}} (0){\plus}\psi _{{11}} (u_{2} )){\plus}\psi _{{21}} \circ\psi _{{12}}^{{{\minus}1}} (\psi _{{12}} (u_{3} ){\plus}\psi _{{12}} (u_{4} ))) \cr & \quad=\psi _{{21}}^{{{\minus}1}} (\psi _{{21}} \circ\psi _{{11}}^{{{\minus}1}} (\infty){\plus}\psi _{{21}} \circ\psi _{{12}}^{{{\minus}1}} (\psi _{{12}} (u_{3} ){\plus}\psi _{{12}} (u_{4} ))) =\psi _{{21}}^{{{\minus}1}} (\infty)=0 $$
The result for u 2 has a similar proof.If u 3=0
 $$\eqalignno{ \raster="fx1"(u_{1} ,u_{2} ,0,u_{4} ) & =\psi _{{21}}^{{{\minus}1}} (\psi _{{21}} \circ\psi _{{11}}^{{{\minus}1}} (\psi _{{11}} (u_{1} ){\plus}\psi _{{11}} (u_{2} )){\plus}\psi _{{21}} \circ\psi _{{12}}^{{{\minus}1}} (\psi _{{12}} (0){\plus}\psi _{{12}} (u_{4} ))) \cr & \quad=\psi _{{21}}^{{{\minus}1}} (\psi _{{21}} \circ\psi _{{11}}^{{{\minus}1}} (\psi _{{11}} (u_{1} ){\plus}\psi _{{11}} (u_{2} )){\plus}\psi _{{21}} \circ\psi _{{12}}^{{{\minus}1}} (\infty)) =\psi _{{21}}^{{{\minus}1}} (\infty)=0 $$
The result for u 4 has a similar proof.
(Uniform margins)
The margin for u 1 is given by
 $$\eqalignno{ \raster="fx1"(u_{1} ,\infty,\infty,\infty) & =\psi _{{21}}^{{{\minus}1}} (\psi _{{21}} \circ\psi _{{11}}^{{{\minus}1}} (\psi _{{11}} (u_{1} ){\plus}\psi _{{11}} (\infty)){\plus}\psi _{{21}} \circ\psi _{{12}}^{{{\minus}1}} (\psi _{{12}} (\infty){\plus}\psi _{{12}} (\infty))) \cr & \quad=\psi _{{21}}^{{{\minus}1}} (\psi _{{21}} \circ\psi _{{11}}^{{{\minus}1}} (\psi _{{11}} (u_{1} )){\plus}0)=u_{1} $$
The margin for u 2 has a similar proof.
The margin for u 3 is given by
 $$\eqalignno{ \raster="fx1"(\infty,\infty,u_{3} ,\infty) & =\psi _{{21}}^{{{\minus}1}} (\psi _{{21}} \circ\psi _{{11}}^{{{\minus}1}} (\psi _{{11}} (\infty){\plus}\psi _{{11}} (\infty)){\plus}\psi _{{21}} \circ\psi _{{12}}^{{{\minus}1}} (\psi _{{12}} (u_{3} ){\plus}\psi _{{12}} (\infty))) \cr & =\psi _{{21}}^{{{\minus}1}} (0{\plus}\psi _{{21}} \circ\psi _{{12}}^{{{\minus}1}} (\psi _{{12}} (u_{3} )))=u_{3} $$
The margin for u 4 has a similar proof.
(4-increasing)
Let us denote  $$\psi _{{21}}^{{{\minus}1}} $$
as g,
 $\psi _{{21}} \circ\psi _{{12}}^{{{\minus}1}} $
as h 2 and
 $\psi _{{21}} \circ\psi _{{11}}^{{{\minus}1}} $
as h 1 for notational simplicity, so (3.3) can be expressed as
 $$\raster="fx1"(u_{1} ,u_{2} ,u_{3} ,u_{4} ) & =g(h_{1} (\psi _{{11}} (u_{1} ){\plus}\psi _{{11}} (u_{2} )){\plus}h_{2} (\psi _{{12}} (u_{3} ){\plus}\psi _{{12}} (u_{4} )))$$
If g is 4-continuously differentiable and 4-monotone on (0, ∞), then for all u>0: g(u)≥0, g′(u)≤0, g′′(u)≥0, g′′′(u)≤0 and g′′′′(u)≥0. If h i has a derivative which is 1-continuously differentiable and 1-monotone on (0, ∞), then for all u>0: h i(u)≥0,  $h'_{i} (u)\geq 0,\,h''_{i} (u)\leq 0$
for i ∈ {1, 2}. Furthermore, as
 $\psi _{{11}} $
,
 $\psi _{{12}} $
and
 $\psi _{{21}} $
are Archimedean Lévy generators, they are continuous and decreasing functions on (0, ∞) by definition, so for all u>0:
 $\psi _{{ij}} (u)\geq 0$
and
 $\psi '_{{ij}} (u)\leq 0$
for i, j ∈ {1, 2} and i+j<4. Hence
 $$\eqalignno{ {{\partial ^{4} } \over {\partial u_{1} \partial u_{2} \partial u_{3} \partial u_{4} }}\raster="fx1"(u_{1} ,u_{{2,}} u_{3} ,u_{4} )= &\, \psi '_{{11}} (u_{1} )\psi '_{{11}} (u_{2} )\psi '_{{12}} (u_{3} )\psi '_{{12}} (u_{4} )[g''''( \cdot )(h'_{1} ( \cdot ))^{2} (h'_{2} ( \cdot ))^{2} \cr & {\plus}g'''( \cdot )(h'_{1} ( \cdot ))^{2} h''_{2} ( \cdot ){\plus}g'''( \cdot )(h'_{2} ( \cdot ))^{2} h''_{1} ( \cdot ) \cr {\plus}g''( \cdot )h''_{1} ( \cdot )h''_{2} ( \cdot )]\geq 0 $$
which is continuous, and by Lemma B.1, the partially nested construction has a non-negative fourth-order difference. Thus, a construction subject to the conditions specified in Theorem 3.3 is 4-increasing and the construction yields a valid Lévy copula.□
B.4. Proof of (3.9)
The joint survival function of a trivariate compound Poisson process, derived by Avanzi et al. (Reference Avanzi, Cassar and Wong2011) is given by
 $$\bar{F}_{{123}}^{\parallel} (x_{1} ,x_{2} ,x_{3} )={1 \over {\lambda _{{123}}^{\parallel} }}\raster="fx1"(\lambda _{1} \bar{F}_{1} (x_{1} ),\,\lambda _{2} \bar{F}_{2} (x_{2} ),\,\lambda _{3} \bar{F}_{3} (x_{3} ))$$
where  $$\raster="fx1"$$
is a trivariate Lévy copula,
 $\lambda _{{123}}^{\parallel} ={\raster="fx1"}(\lambda _{1} ,\lambda _{2} ,\lambda _{3} )$
is the arrival intensity of 3-common jumps,
 $\lambda _{i} $
is the arrival intensity parameter and
 $\bar{F}_{i} $
is the survival function of marginal component i, for i ∈ {1, 2, 3}.By selecting the trivariate nested Lévy copula in (3.1) for
 $$\raster="fx1"$$
, the joint survival and marginal survival functions for the 3-common jumps can be written as
 $$\bar{F}_{{123}}^{\parallel} (x_{1} ,x_{2} ,x_{3} )={1 \over {\lambda _{{123}}^{\parallel} }}\psi _{{21}}^{{{\minus}1}} \left( {\psi _{{21}} \circ\psi _{{11}}^{{{\minus}1}} (\psi _{{11}} (\lambda _{1} \bar{F}_{1} (x_{1} )){\plus}\psi _{{11}} (\lambda _{2} \bar{F}_{2} (x_{2} ))){\plus}\psi _{{21}} (\lambda _{3} \bar{F}_{3} (x_{3} ))} \right)$$
 $$\bar{F}_{{1;123}}^{\parallel} (x_{1} )={1 \over {\lambda _{{123}}^{\parallel} }}\psi _{{21}}^{{{\minus}1}} \left( {\psi _{{21}} \circ\psi _{{11}}^{{{\minus}1}} (\psi _{{11}} (\lambda _{1} \bar{F}_{1} (x_{1} )){\plus}\psi _{{11}} (\lambda _{2} )){\plus}\psi _{{21}} (\lambda _{3} )} \right)$$
 $$\bar{F}_{{2;123}}^{\parallel} (x_{2} )={1 \over {\lambda _{{123}}^{\parallel} }}\psi _{{21}}^{{{\minus}1}} \left( {\psi _{{21}} \circ\psi _{{11}}^{{{\minus}1}} (\psi _{{11}} (\lambda _{1} ){\plus}\psi _{{11}} (\lambda _{2} \bar{F}_{2} (x_{2} ))){\plus}\psi _{{21}} (\lambda _{3} )} \right)$$
 $$\bar{F}_{{3;123}}^{\parallel} (x_{3} )={1 \over {\lambda _{{123}}^{\parallel} }}\psi _{{21}}^{{{\minus}1}} \left( {\psi _{{21}} \circ\psi _{{11}}^{{{\minus}1}} (\psi _{{11}} (\lambda _{1} ){\plus}\psi _{{11}} (\lambda _{2} )){\plus}\psi _{{21}} (\lambda _{3} \bar{F}_{3} (x_{3} ))} \right)$$
where  $\lambda _{{123}}^{\parallel} =\psi _{{21}}^{{{\minus}1}} \left( {\psi _{{21}} \circ\psi _{{11}}^{{{\minus}1}} (\psi _{{11}} (\lambda _{1} ){\plus}\psi _{{11}} (\lambda _{2} )){\plus}\psi _{{21}} (\lambda _{3} )} \right)$
and
 $\psi _{{11}} $
,
 $\psi _{{21}} $
are Archimedean Lévy generators that meet the relevant restrictions.
Deriving the survival copula for the severity of 3-common jumps involves finding a relationship between the joint survival function in (B.32) and the marginal survival functions in (B.33)–(B.35). This can be done as follows. From  $\bar{F}_{{1;123}}^{\parallel} (x_{1} )$
and
 $\bar{F}_{{2;123}}^{\parallel} (x_{2} )$
, we have
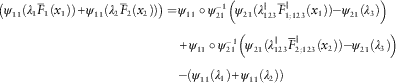 $$\eqalignno{ \left( {\psi _{{11}} (\lambda _{1} \bar{F}_{1} (x_{1} )){\plus}\psi _{{11}} (\lambda _{2} \bar{F}_{2} (x_{2} ))} \right)=\, \psi _{{11}} \circ\psi _{{21}}^{{{\minus}1}} \left( {\psi _{{21}} (\lambda _{{123}}^{\parallel} \bar{F}_{{1;123}}^{\parallel} (x_{1} )){\minus}\psi _{{21}} (\lambda _{3} )} \right) \cr & {\plus}\psi _{{11}} \circ\psi _{{21}}^{{{\minus}1}} \left( {\psi _{{21}} (\lambda _{{123}}^{\parallel} \bar{F}_{{2;123}}^{\parallel} (x_{2} )){\minus}\psi _{{21}} (\lambda _{3} )} \right) \cr{\minus}\left( {\psi _{{11}} (\lambda _{1} ) {\plus}\psi _{{11}} (\lambda _{2} )} \right) $$
From  $\bar{F}_{{3;123}}^{\parallel} (x_{3} )$
, we have
 $$\psi _{{21}} (\lambda _{{123}}^{\parallel} \bar{F}_{{3;123}}^{\parallel} (x_{3} )){\minus}\psi _{{21}} \circ\psi _{{11}}^{{{\minus}1}} (\psi _{{11}} (\lambda _{1} ){\plus}\psi _{{11}} (\lambda _{2} ))=\psi _{{21}} (\lambda _{3} \bar{F}_{3} (x_{3} ))$$
Hence
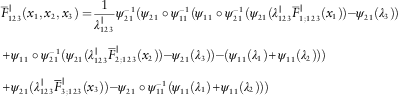 $$\eqalignno{ & \bar{F}_{{123}}^{\parallel} (x_{1} ,x_{2} ,x_{3} )={1 \over {\lambda _{{123}}^{\parallel} }}\psi _{{21}}^{{{\minus}1}} (\psi _{{21}} \circ\psi _{{11}}^{{{\minus}1}} (\psi _{{11}} \circ\psi _{{21}}^{{{\minus}1}} (\psi _{{21}} (\lambda _{{123}}^{\parallel} \bar{F}_{{1;123}}^{\parallel} (x_{1} )){\minus}\psi _{{21}} (\lambda _{3} )) \cr & {\plus}\psi _{{11}} \circ\psi _{{21}}^{{{\minus}1}} (\psi _{{21}} (\lambda _{{123}}^{\parallel} \bar{F}_{{2;123}}^{\parallel} (x_{2} )){\minus}\psi _{{21}} (\lambda _{3} )){\minus}(\psi _{{11}} (\lambda _{1} ){\plus}\psi _{{11}} (\lambda _{2} ))) \cr & {\plus}\psi _{{21}} (\lambda _{{123}}^{\parallel} \bar{F}_{{3;123}}^{\parallel} (x_{3} )){\minus}\psi _{{21}} \circ\psi _{{11}}^{{{\minus}1}} (\psi _{{11}} (\lambda _{1} ){\plus}\psi _{{11}} (\lambda _{2} ))) $$
Rearranging (B.38) and substituting in the Clayton Archimedean Lévy generators yields the desired result.□
Appendix C: Details on the Data Fitting Programmes
The software we used for fitting a model to the Danish fire data in section 5 is R (version 2.15.3) with packages stats4 and moments. Maximum likelihood estimation was used for estimating parameters. The likelihood function of a bivariate Lévy copula model has been discussed in existing literature (see e.g. Avanzi et al., Reference Avanzi, Cassar and Wong2011). The likelihood function of a trivariate Lévy copula model with three marginal compound Poisson process is
$$\eqalignno{ & \log \,L(\lambda _{1} ,\lambda _{2} ,\lambda _{3} ,\bitheta _{1} ,\bitheta _{2} ,\bitheta _{3} ,\bidelta ) \cr & =n_{1} \,\log \,\lambda _{1} {\plus}n_{2} \,\log \,\lambda _{2} {\plus}n_{3} \,\log \,\lambda _{3} {\minus}T\lambda \cr & {\plus}\mathop{\sum}\limits_{i=1}^{n_{1} } {\log \,f_{1} (x_{{1,i}} \!\mid\!\bitheta _{{\bf 1}} ){\plus}} \mathop{\sum}\limits_{i=1}^{n_{2} } {\log \,f_{2} (x_{{2,i}} \!\mid\!\bitheta _{{\bf 2}} ){\plus}\mathop{\sum}\limits_{i=1}^{n_{3} } {\log \,f_{3} (x_{{3,i}} \!\mid\!\bitheta _{{\bf 3}} )} } \cr & {\plus}\mathop{\sum}\limits_{i=1}^{n_{{123}}^{\parallel} } {\log {{\partial ^{3} \raster="fx1"(u_{{1,i}} ,u_{{2,i}} ,u_{{3,i}} \!\mid\!\bidelta )} \over {\partial u_{1} \partial u_{2} \partial u_{3} }}} \left| _{_{{u_{{j,i}} =}} _{\vskip2pt{{\lambda _{j} \bar{F}_{j} }} {{(x_{{j,i}}^{{\parallel\,123}} \!\mid\,\bitheta _{j} ),\,j=1,2,3}} }} \right. \cr & {\plus}\mathop{\sum}\limits_{i=1}^{n_{{12}}^{\parallel} } {\log \left( {{{\partial ^{2} \raster="fx1"(u_{{1,i}} ,u_{{2,i}} ,\infty\!\mid\!\bidelta )} \over {\partial u_{1} \partial u_{2} }}{\minus}{{\partial ^{2} \raster="fx1"(u_{{1,i}} ,u_{{2,i}} ,\lambda _{3} \!\mid\!\bidelta )} \over {\partial u_{1} \partial u_{2} }}} \right)} \left| _{_{{u_{{j,i}} =}} _{\vskip2pt{{\lambda _{j} \bar{F}_{j} }} {{(x_{{j,i}}^{{\parallel\,12}} \!\mid\,\bitheta _{j} ),\,j=1,2}} }} \right. \cr & {\plus}\mathop{\sum}\limits_{i=1}^{n_{{13}}^{\parallel} } {\log \left( {{{\partial ^{2} \raster="fx1"(u_{{1,i}} ,\infty,u_{{3,i}} \!\mid\!\bidelta )} \over {\partial u_{1} \partial u_{3} }}{\minus}{{\partial ^{2} \raster="fx1"(u_{{1,i}} ,\lambda _{2} ,u_{{3,i}} \!\mid\!\bidelta )} \over {\partial u_{1} \partial u_{3} }}} \right)} \left| _{_{{u_{{j,i}} =}} _{\vskip2pt{{\lambda _{j} \bar{F}_{j} }} {{(x_{{j,i}}^{{\parallel\,13}} \!\mid\,\bitheta _{j} ),\,j=1,3}} }} \right. \cr & {\plus}\mathop{\sum}\limits_{i=1}^{n_{{23}}^{\parallel} } {\log \left( {{{\partial ^{2} \raster="fx1"(\infty,u_{{2,i}} ,u_{{3,i}} \!\mid\!\bidelta )} \over {\partial u_{2} \partial u_{3} }}{\minus}{{\partial ^{2} \raster="fx1"(\lambda _{1} ,u_{{2,i}} ,u_{{3,i}} \!\mid\!\bidelta )} \over {\partial u_{2} \partial u_{3} }}} \right)} \left| _{_{{u_{{j,i}} =}} _{\vskip2pt{{\lambda _{j} \bar{F}_{j} }} {{(x_{{j,i}}^{{\parallel\,23}} \!\mid\,\bitheta _{j} ),\,j=2,3}} }} \right. \cr & {\plus}\mathop{\sum}\limits_{i=1}^{n_{1}^{ \bot } } {\log \left( {1{\plus}{{{\rm d\,\raster="fx1"}(u_{1} ,\lambda _{2} ,\lambda _{3} \!\mid\!\bidelta )} \over {du_{1} }}{\minus}{{{\rm d\,\raster="fx1"}(u_{1} ,\lambda _{2} ,\infty\!\mid\!\bidelta )} \over {du_{1} }}{\minus}{{{\rm d\,\raster="fx1"}(u_{1} ,\infty,\lambda _{3} \!\mid\!\bidelta )} \over {du_{1} }}} \right)} \left| _{_{{u_{{1,i}} =}} _{\vskip2pt{{\lambda _{j} \bar{F}_{j} }} {{(x_{{1,i}}^{ \bot } \,\mid\,\bitheta _{j} )}} }} \right. \cr & {\plus}\mathop{\sum}\limits_{i=1}^{n_{2}^{ \bot } } {\log \left( {1{\plus}{{{\rm d\,\raster="fx1"}(\lambda _{1} ,u_{2} ,\lambda _{3} \!\mid\!\bidelta )} \over {du_{2} }}{\minus}{{{\rm d\,\raster="fx1"}(\lambda _{1} ,u_{2} ,\infty\!\mid\!\bidelta )} \over {du_{2} }}{\minus}{{{\rm d\,\raster="fx1"}(\infty,u_{2} ,\lambda _{3} \!\mid\!\bidelta )} \over {du_{2} }}} \right)} \left| _{_{{u_{{2,i}} =}} _{\vskip2pt{{\lambda _{2} \bar{F}_{2} }} {{(x_{{2,i}}^{ \bot } \,\mid\,\bitheta _{j} )}} }} \right. \cr & {\plus}\mathop{\sum}\limits_{i=1}^{n_{3}^{ \bot } } {\log \left( {1{\plus}{{{\rm d\,\raster="fx1"}(\lambda _{1} ,\lambda _{2} ,u_{3} \!\mid\!\bidelta )} \over {du_{3} }}{\minus}{{{\rm d\,\raster="fx1"}(\lambda _{1} ,\infty,u_{3} \!\mid\!\bidelta )} \over {du_{3} }}{\minus}{{{\rm d\,\raster="fx1"}(\infty,\lambda _{2} ,u_{3} \!\mid\!\bidelta )} \over {du_{3} }}} \right)} \left| _{_{{u_{{3,i}} =}} _{\vskip2pt{{\lambda _{j} \bar{F}_{j} }} {{(x_{{3,i}}^{ \bot } \,\mid\,\bitheta _{j} )}} }} \right. $$
where T is the total length of observation; n j the number of observations in the jth marginal process, j=1, 2, 3;  $$\lambda =\lambda _{{123}}^{\parallel} {\plus}\lambda _{{12}}^{\parallel} {\plus}\lambda _{{13}}^{\parallel} {\plus}\lambda _{{23}}^{\parallel} {\plus}\lambda _{1}^{ \bot } {\plus}\lambda _{2}^{ \bot } {\plus}\lambda _{3}^{ \bot } $$
; λ j the marginal Poisson intensity of the jth process, j=1, 2, 3;
 $\bar{F}_{j} ( \cdot \!\mid\!\bitheta _{j} )$
and
 $f_{j} ( \cdot \!\mid\!\bitheta _{j} )$
the survival and probability density function of the jth process with a parameter vector θ j, j=1, 2, 3;
 ${\raster="fx1"}(u_{1} ,u_{2} ,u_{3} \!\mid\!\delta )$
the trivariate Lévy copula with a parameter vector δ;
 $x_{{j,i}}^{{{\rm type}}} $
the ith jump size of the jth process of a certain type, where ⊥ denotes unique jump and || denotes common jump, j=1, 2, 3; and
 $n_{j}^{ \bot } $
the number of unique jumps in the jth marginal process j=1, 2, 3.
Parameters are estimated by using the mle function, which searches for the parameters that minimise a given negative likelihood function. The benefit of using the mle function is that one can easily obtain the parameter errors by using the vcov function. In the case of fitting a trivariate process by using a nested Lévy copula, one needs to consider the constraints of parameters of the two Archimedean Lévy copula generators to ensure valid construction of a Lévy copula. Here reparameterisation is used with the method L-BFGS-B. In particular, the Lévy copula is reparameterised such that the parameters of a Lévy copula are (θ 2, ∆) instead of (θ 1, θ 2), where
 $$\Delta =\delta _{1} {\minus}\delta _{2} $$
Then the constraint Δ ≥ 0 is applied which ensures that the sufficient conditions for a valid Lévy copula are always satisfied. Please note that one needs to add an upper bound and a lower bound for all parameters that are involved.
In situations where one cannot find simple expressions for the constraints or the L-BFGS-B method cannot successfully minimise the negative likelihood function, one can use the BFGS method to estimate the parameters. The second situation happens in this study where a trivariate nested AI–AI Lévy copula model is adopted with the couple “Contents” and “Profits” being nested first. As the BFGS method does not allow for explicit incorporation of parameters constraints, one has to manually check whether the estimated parameters satisfy the constraints when this method is selected. One can refer to Table 2 for constraints of some trivariate nested Archimedean copulas.
It is worth mentioning that one can also use other optimisation functions in R. For example, one can consider the function constrOptim which allows for linear constraints therefore reparameterisation is not necessary. However, one needs to estimate the parameter errors separately.