

1 Introduction
Nowadays, telematics car driving data becomes vital to general insurance companies. Classical car insurance pricing is typically based on generalised linear models using covariate information like age of driver, gender of driver, type of car, price of car, power of engine, etc. This conventional covariate information is not directly related to driving styles and driving habits, but it is rather brought in as proxy information for missing information about driving styles and skills. Of course, this raises some issues because these proxies only describe typical representatives of covariate characteristics, and an individual driver might be quite different from a typical driver. Moreover, recently, concerns have been raised about discrimination as certain protected variables are not allowed to serve as proxies, for instance, gender under European law is not allowed to be used as an explanatory variable in regression models (European Commission, 2012). In contrast, telematics car driving data is much closer to the ground truth of driving style and driving skills because it continuously registers driving behaviour and maneouvres.
However, telematics car driving data poses big challenges itself, one being the massive amount of data that it creates and another one being the accuracy telematics data that it typically has. For these reasons, there is a vastly growing literature on telematics data that aims at making it useful for understanding and pricing car insurance policies. Needless to say that new car insurance products should also aim at improving driving styles by continuously giving feedback to the customers about their driving. We briefly review recent developments on telematics car driving data.
Some studies aim to identify indicators of driving risk which can help insurers to obtain better risk profiles for individual car drivers. Driving distance is one factor that has been widely explored (Lemaire et al., Reference Lemaire, Park and Wang2016; Boucher et al., Reference Boucher, Côté and Guillen2017; Verbelen et al., Reference Verbelen, Antonio and Claeskens2018), and other methods aim at evaluating driving risk based on extracting behaviour variables from usage-based insurance data that go beyond driving distance (Ayuso et al., Reference Ayuso, Guillen and Pérez-Marín2016a, Ayuso et al., Reference Ayuso, Guillen and Pérez-Marín2016b, 2018; Denuit et al., Reference Denuit, Guillen and Trufin2019). Carfora et al. (Reference Carfora, Martinelli, Mercaldo, Nardone, Orlando, Santone and Vaglini2019) propose an indicator of driver aggressiveness based on cluster analysis results. More recently, generalised linear models are built based on the internet of vehicles data to identify risky drivers, see Sun et al. (Reference Sun, Bi, Guillen and Pérez-Marín2020). Another direction of research is to study driving cycles which are usually represented by speed–time profiles. By studying such driving patterns in different cities, one can evaluate energy and emissions in road transportation (Hung et al., Reference Hung, Tong, Lee, Ha and Pao2007; Kamble et al., Reference Kamble, Mathew and Sharma2009; Ho et al., Reference Ho, Wong and Chang2014).
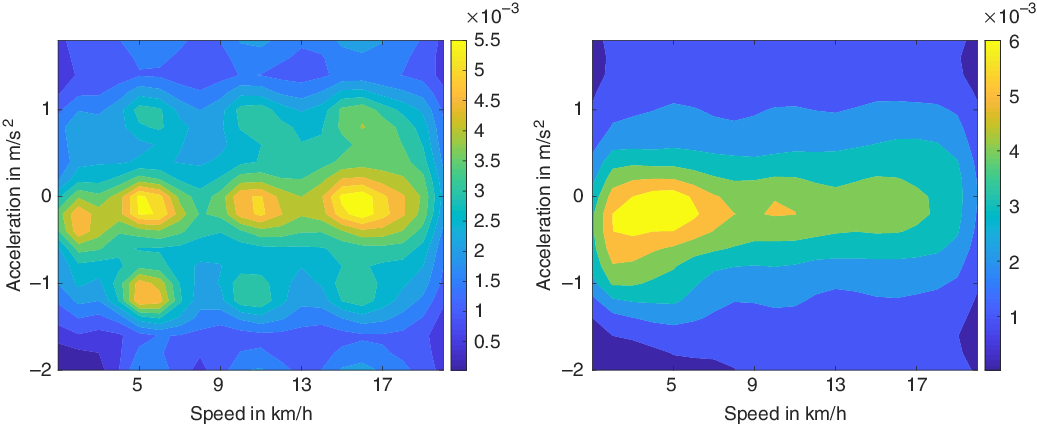
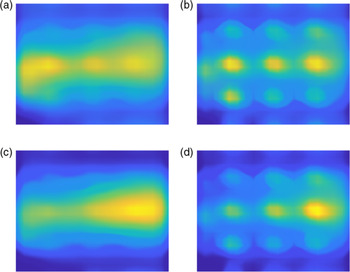
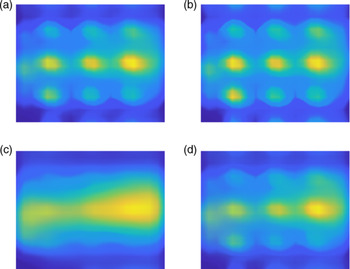
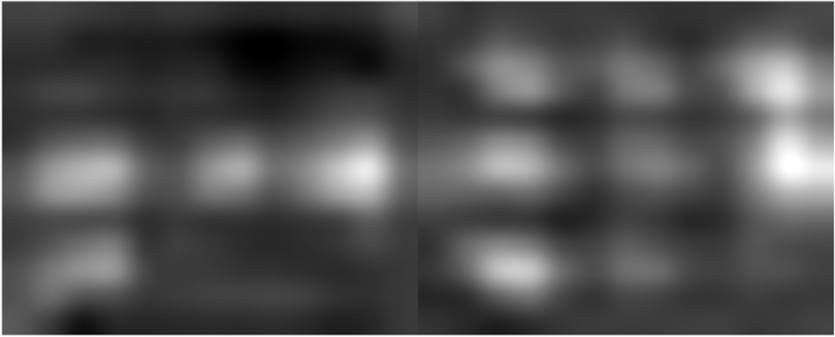
Since telematics car driving data and, in particular, GPS location data second by second result in a massive amount of data, these data need to be compressed or summarised in a suitable way to make them useful for insurance pricing. Of course, this aggregation should be done at a minimal loss of information. One way of aggregation is to build so-called speed–acceleration (v-a) heatmaps which is a two-dimensional summary statistics of a speed versus acceleration pattern, see Wüthrich (Reference Wüthrich2017). This approach can reduce the large amount of telematics data while keeping key information of individual driving patterns. The corresponding v-a heatmap is generated from the telematics data for each individual driver. Figure 1 shows two examples of v-a heatmaps in the (5, 20] (km/h) speed interval. The x axis shows speed v in km/h, while the y axis shows acceleration a in m/s
 $^2$
for an individual driver. The v-a heatmap then gives the distribution of the time spent by a driver at each (v, a) location. From Figure 1, it is obvious that the two illustrated drivers have quite different speed–acceleration behaviour.
Two examples of v-a heatmaps.

Our goal here is to analyse different driving patterns based on these v-a heatmaps. One direction is to study whether there are clusters of similar heatmaps, so that we can cluster customers to different categories of driving styles. Given that the heatmaps are not labelled, this provides us with a cluster analysis problem (section 10.3 in James et al., Reference James, Witten, Hastie and Tibshirani2013). Wüthrich (Reference Wüthrich2017) proposes to explore this direction by K-means clustering that divides data to K non-overlapping subgroups, and it is assumed that data points within each subgroup are similar to each other. Thus, the car drivers that are clustered to one subgroup by the K-means algorithm are believed to share a similar driving style. In a further study, Gao & Wüthrich (Reference Gao and Wüthrich2018) extract low-dimensional features from v-a heatmaps that can be used in regression models for car insurance pricing. Of course, at this stage, it is not clear whether such a clustering provides any predictive power for car frequency prediction. Gao et al. (Reference Gao, Meng and Wüthrich2019) provide evidence on a small data set that, indeed, clustering of v-a heatmaps can extract feature information from telematics car driving data that has predictive power for claim frequency prediction. However, their analysis is based on less than 2,000 drivers; therefore, bigger portfolios and more analysis are needed to receive more support for this approach. Weidner et al. (Reference Weidner, Transchel and Weidner2017) also cluster driving styles to evaluate driving behaviour. Different from the above approaches, their study uses a hierarchical clustering method based on three variables: vehicle velocity, acceleration and deceleration.
We note that there are two aspects that can be improved in the above approaches. First, from the v-a heatmaps in Figure 1, we can observe that within a small local area the values in each heatmap are close to each other, which suggests a smoothness property or a spatial structure that can be explored in the heatmap. This spatial structure has not been considered in Wüthrich (Reference Wüthrich2017) and Gao & Wüthrich (Reference Gao and Wüthrich2018) because the entire heatmap has been stacked into a one-dimensional vector in these two studies. Considering this spatial property may improve the clustering results. Second, all heatmaps are unlabelled suggesting that this is a difficult clustering task. Involving supervised information from other classification problems may improve the clustering results.
In this paper, we propose to enhance the above two aspects via transfer learning with the pre-trained AlexNet on heatmap images to extract discriminative features that can bring supervised information to our clustering task. First, we propose to process heatmaps as two-dimensional RGB images rather than treating them as one-dimensional vectors to preserve the local geometry. Machine learning algorithms in image processing have been well developed by considering the local smoothness property of images. Thus, our task becomes to cluster the heatmap RBG images rather than the one-dimensional vectors of Wüthrich (Reference Wüthrich2017). Second, the pre-trained models in image classification tasks can be utilised to bring supervised information to our clustering task. Here, we select the AlexNet model (Krizhevsky et al., Reference Krizhevsky, Sutskever and Hinton2012) that is trained on the ImageNet database. From the pre-trained AlexNet, we can extract discriminative features from the heatmaps that are informative to distinguish between different image classes. More specifically, we feed the heatmap images to the pre-trained AlexNet and extract discriminative features that can distinguish between different heatmap patterns. These features are then used in the K-means algorithm for clustering. By borrowing the discriminative or supervised information contained in the pre-trained AlexNet, which has been trained on a different classification task, we still expect that our clustering results are improved, that is, similar images can be clustered together. This is one example of transfer learning within the machine learning community, which aims to transfer knowledge learned from one specific task to a similar but different task (Pan & Yang, Reference Pan and Yang2009). Note that the feature extraction process proposed here is different from that in Gao & Wüthrich (Reference Gao and Wüthrich2018). This is because our feature extraction process involves supervised information from ImageNet classification task, while the one in Gao & Wüthrich (Reference Gao and Wüthrich2018) is purely unsupervised. We recognise that there are many different ways to perform such classification tasks. AlexNet used here is based on convolutional neural networks. These networks have been designed to find common structure at different locations in images. Alternatively, one may try, for instance, density-based clustering which allows to discover clusters of arbitrary shapes.
The rest of the paper is organised as follows. Section 2 describes v-a heatmap. Section 3 shows the details of K-means algorithm and AlexNet. Section 4 compares the clustering results of driving styles on our data. Section 5 presents some concluding remarks.
2 The v-a Heatmap
To generate v-a heatmaps, we follow the steps in Gao & Wüthrich (Reference Gao and Wüthrich2018). We select speed range (5, 20] km/h and acceleration range
 $[{-}2,2]$
m/s
 $^2$
. We divide both the speed range (5, 20] and the acceleration range
 $[{-}2,2]$
to, say, 20 equidistant intervals. Thus, we partition the two-dimensional space of
 $(5,20] \times [{-}2,2]$
to 400 congruent subregions
 $R_j$
,
 $j=1,2,\ldots,400$
. Note that we could choose the numbers of equidistant intervals differently, but we select the fixed number of 20, here, to fix ideas and also because this will be in line with our numerical analysis. Next, we record the relative amount of time spent in each subregion
 $R_j$
,
 $x_{ij}$
, for driver i,
 $i=1,2,\ldots,N$
.
 $x_{ij}$
satisfies the following probability constraints:
 $x_{ij} \geq 0$
for all j and
 $\sum^{400}_{j=1} x_{ij} = 1$
. This allows us to draw a heatmap based on these data for each individual driver. For driver i, the heatmap data are represented by a vector
 $\mathbf{x}_i=[x_{i1},x_{i2},\ldots,x_{i400}]^T$
of probability weights, see Figure 1 for its two-dimensional illustration.
3 Methodology
In this section, we first introduce the K-means clustering algorithm that can be applied to cluster heatmaps to subgroups. Then, we discuss two feature extraction approaches that can be applied before the K-means algorithm, the unsupervised principal component analysis (PCA) and the supervised pre-trained AlexNet. There are two advantages of applying feature extraction beforehand. First, we usually extract fewer features from the original data when the dimensionality is large, for example, 400 variables to describe one heatmap in our task, in order to reduce the redundant information contained in the data. Second, the extracted features are usually good representations of the original data and can provide the useful information for the clustering task.
3.1 K-means clustering
K-means clustering (section 10.3.1 in James et al., Reference James, Witten, Hastie and Tibshirani2013) is a clustering technique that aims to find non-overlapping K clusters such that the within-cluster variation of all K clusters is minimised.
Given N car drivers
 $\{1,2,\ldots,N \}$
, the within-cluster variation
 $S_k$
of the kth cluster,
 $C_k$
, is defined as:
 \begin{equation}S_k= \frac{1}{N_k} \sum_{i,i^{\prime} \in C_k} (\mathbf{x}_i-\mathbf{x}_{i^{\prime}})^T(\mathbf{x}_i-\mathbf{x}_{i^{\prime}})\end{equation}
where
 $N_k$
denotes the number of drivers in the kth cluster with
 $\sum^K_{k=1} N_k = N$
. Note that here we use the squared Euclidean distance between drivers to measure the within-cluster variation. Hence, K-means clustering aims to solve the following optimisation problem:
 \begin{equation}\min_{C_1,C_2,\ldots,C_K} \sum_{k=1}^K \sum_{i,i^{\prime} \in C_k} (\mathbf{x}_i-\mathbf{x}_{i^{\prime}})^T(\mathbf{x}_i-\mathbf{x}_{i^{\prime}})\end{equation}
such that
 $C_1, C_2, \ldots,C_K$
provides a partition of all drivers
 $\{1,2,\ldots,N \}$
.
Given that there are
 $K^N$
ways to divide N drivers to K subgroups, the following algorithm is usually used to find an approximate solution (local minimum) of (2) with less computational cost.
-
Step 1: Randomly assign each driver to one of the K groups as initialisation step.
-
Step 2: Calculate the cluster mean for each cluster.
-
Step 3: Assign each driver to the cluster with the closest cluster mean (w.r.t. the squared Euclidean distance).
-
Step 4: Iterate steps 2 and 3 until the assignment does not change.
Note that this algorithm has monotonically decreasing total within-cluster variation and therefore converges to a local minimum of (2). When using K-means clustering, we need to specify the number of clusters K, which acts as a hyper-parameter. An optimal selection can be done by various methods, such as the elbow method (James et al., Reference James, Witten, Hastie and Tibshirani2013) that plots the sum of within-cluster variations against K and selects K where an elbow appears in the graph.
3.2 Feature extraction before applying K-means
In this section, we present feature extraction before applying the K-means algorithm. These feature extraction techniques may be understood as representation learning techniques, and we apply the K-means algorithm only to the learned representations. Interestingly, the K-means algorithm does not use any information about the spatial structure of the heatmaps because all information is stacked into a one-dimensional vector
 $\mathbf{x}_i$
; however, the second method presented in this section reflects spatial information in the learned representation and, thus, the K-means results will have an implicit spatial component.
3.2.1 Principal component analysis
PCA (Jolliffe, Reference Jolliffe1986) is a simple, yet, effective way to extract features that contain the most variation information in data.
Given N drivers, we have a data matrix
 $\mathbf{X} \in \mathbb{R}^{N \times 400}$
that contains all information
 $\mathbf{x}_i$
of the drivers
 $i=1,2,\ldots,N$
on the rows of
 $\mathbf{X}$
. To obtain the first few principal components (PCs), we first subtract the column means from
 $\mathbf{X}$
to obtain the mean-centred
 $\mathbf{X}^c$
. We then apply the reduced singular value decomposition to
 $\mathbf{X}^c$
:
 \begin{equation} \mathbf{X}^c = \mathbf{U} \mathbf{D} \mathbf{V}^T,\end{equation}
where
 $\mathbf{U} \in \mathbb{R}^{N \times q}$
and
 $\mathbf{V} \in \mathbb{R}^{400 \times q}$
are two matrices with columns of left and right singular vectors, and
 $\mathbf{D} \in \mathbb{R}^{q \times q}$
is a diagonal matrix with singular values
 $d_1 \geq d_2 \geq \cdots \geq d_q \ge 0$
.
In PCA, the columns of
 $\mathbf{V}$
are known as PCs and the rows of
 $\mathbf{T}=\mathbf{U} \mathbf{D}$
are known as PC scores. In practice, we usually select the first r (
 $r \leq q$
) PCs that can explain most of the variation of the data, for example, 75%, to provide a good representation of the original dataset. Note that PCA is a purely unsupervised dimension reduction method because we do not involve any label information during the whole process. Moreover, it does not use the geometric structure of the heatmaps.
3.2.2 Transfer learning with the pre-trained AlexNet
From the previous section, we can see that the heatmap for each individual driver is simply treated as a row vector in
 $\mathbf{X}$
. This approach ignores the geometric structure of the heatmaps, that is, that the values of a small local area in the heatmap are similar to each other. To make use of this property, we propose to treat the heatmaps as RGB images rather than single vectors
 $\mathbf{x}_i$
. Another advantage of treating the heatmaps as RGB images is that there is a rich literature and many algorithms in well-develped areas of image processing, in order to improve the clustering of driving styles.
Instead of using the purely unsupervised PCA, we propose to extract features with supervised information for better clustering via transfer learning. Transfer learning has attracted quite some attention in the machine learning community in recent years (Pan & Yang, Reference Pan and Yang2009; Torrey & Shavlik, Reference Torrey and Shavlik2010; Shin et al., Reference Shin, Roth, Gao, Lu, Xu, Nogues, Yao, Mollura and Summers2016). It aims to transfer the knowledge learned from source tasks to a similar but different target task. In our task, there is a lack of supervised information for the heatmap images, that is, we do not have labels of driving styles for the heatmaps, which makes the clustering task difficult. This is the typical problem in common in clustering tasks. We aim to solve this problem by borrowing supervised information learned from other image classification tasks. For example, we can utilise the deep convolutional neural network, AlexNet (Krizhevsky et al., Reference Krizhevsky, Sutskever and Hinton2012), that is, trained on the ImageNet data (Deng et al., Reference Deng, Dong, Socher, Li, Li and Li2009) to classify images to 1000 classes. Hence, the features extracted by AlexNet contain supervised information that is useful to differentiate images from different classes. If we feed our heatmaps to AlexNet, then the features extracted by AlexNet may also be good to distinguish between heatmap images with different patterns, that is, different driving styles. More specifically, we transfer the supervised information from the source task, classifying ImageNet images, to our target task, classifying heatmap images. Using these extracted features, we can expect an improvement in the clustering results.
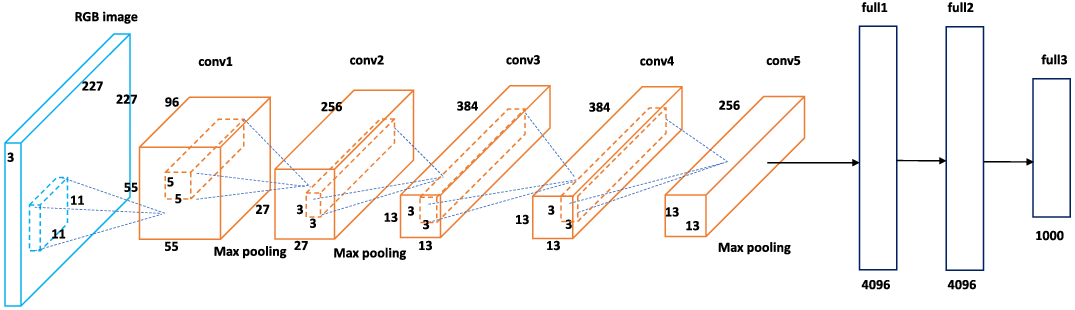
AlexNet is the most popular deep convolutional neural network developed in the past decade. AlexNet has eight learned network layers with five convolutional layers and three fully connected layers. The architecture of AlexNet is shown in Figure 2, where the light blue cube shows the input RGB image, the orange cubes show the five convolutional layers and the black rectangles show the three fully connected layers. In our task, we understand the v-a heatmaps now as RGB images, and we feed these RGB images into the pre-trained AlexNet. Note that RGB images are represented by three-dimensional arrays representing the red, green or blue colour channels.
The architecture of AlexNet.

4 Data Analysis
In the following data analysis, we compare the clustering performances of (a) K-means, (b) K-means on PCA features and (c) K-means on AlexNet features. We have performed this analysis on heatmaps coming from real telematics car driving data and on simulated data. Our results did not differ on the two datasets. Therefore, we have decided to present the results on the simulated data, because these simulated data are publicly available which allows one to replicate our results. We remark that the data generator for the simulated data is based on bottleneck neural networks that have been trained on real telematics car driving data, for more details we refer to Gao & Wüthrich (Reference Gao and Wüthrich2018).
4.1 Simulated data
The simulated heatmap data are obtained from the heatmap simulation machine (Gao & Wüthrich, Reference Gao and Wüthrich2018)Footnote
1
with default parameter settings and seeds. This simulation machine provides heatmaps of 2,000 drivers. The heatmap data are represented by a matrix
 $\mathbf{X} \in \mathbb{R}^{2,000 \times 400}$
.
4.2 K-means clustering
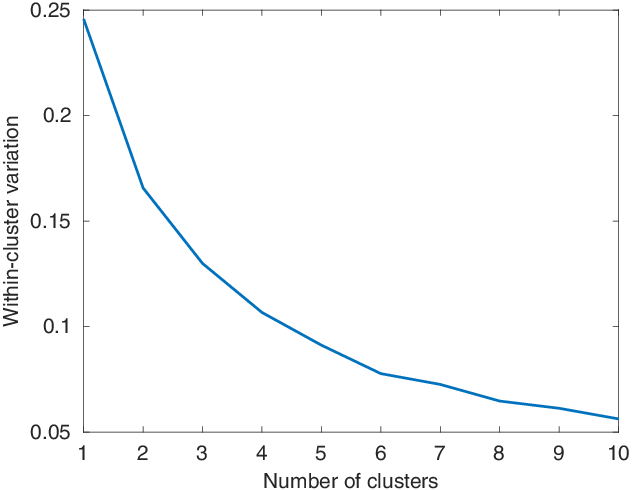
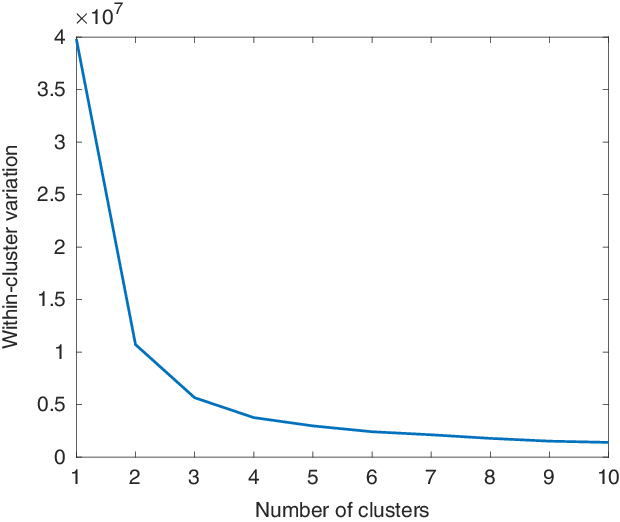
We first show the results of applying K-means clustering to the heatmap data directly. Figure 3 shows the scree plot of K-means clustering when we use the original heatmap data
 $\mathbf{X}$
as input. From this plot, it is not obvious which number of clusters we should choose as there is no clear elbow in the picture. Based on Figure 3, we may need to set K to a large number, for example, larger than 10. However, we usually do not aim to set K to a very large number because this may lead to over-fitting, and because for insurance pricing we prefer categorical variables with only a few levels. When K is set to the total number of drivers, we receive the smallest within-cluster variation of zero; however, no drivers are clustered in this case. This is why we would like to see a scree plot with an elbow where the within-cluster variation decreases quickly before the elbow while slowly after the elbow, which gives us a natural selection criterion for K.
The scree plot of K-means.

4.3 K-means clustering on PCA features
In this section, we show how the clustering results improve when we extract features from the original data by PCA. The first two principal components (PCs) are used, which explain 74% of the total variation in the data. Thus, we represent
 $\mathbf{x}_i$
by a two-dimensional vector, and we apply K-means clustering on the two extracted PCA features.
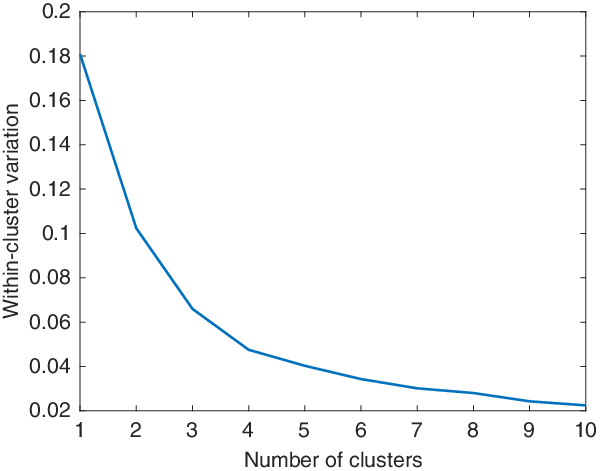
Figure 4 shows the scree plot of K-means clustering on PCA features. Compared to Figure 3 on the original data, there is a clear elbow shown around
 $K=4$
in Figure 4 (with PCA features). This suggests that
 $K=4$
is a good choice for the number of clusters, that is, this result gives us a natural candidate for hyper-parameter K. Note that the PCA extraction reduces the noise in the data because it focuses only on the most relevant PCs, and the learned representations then allow for a more clear clustering picture.
The scree plot of K-means on PCA features.

The cluster means, that is, the average heatmap images of each cluster, are shown in Figure 5 when setting
 $K=4$
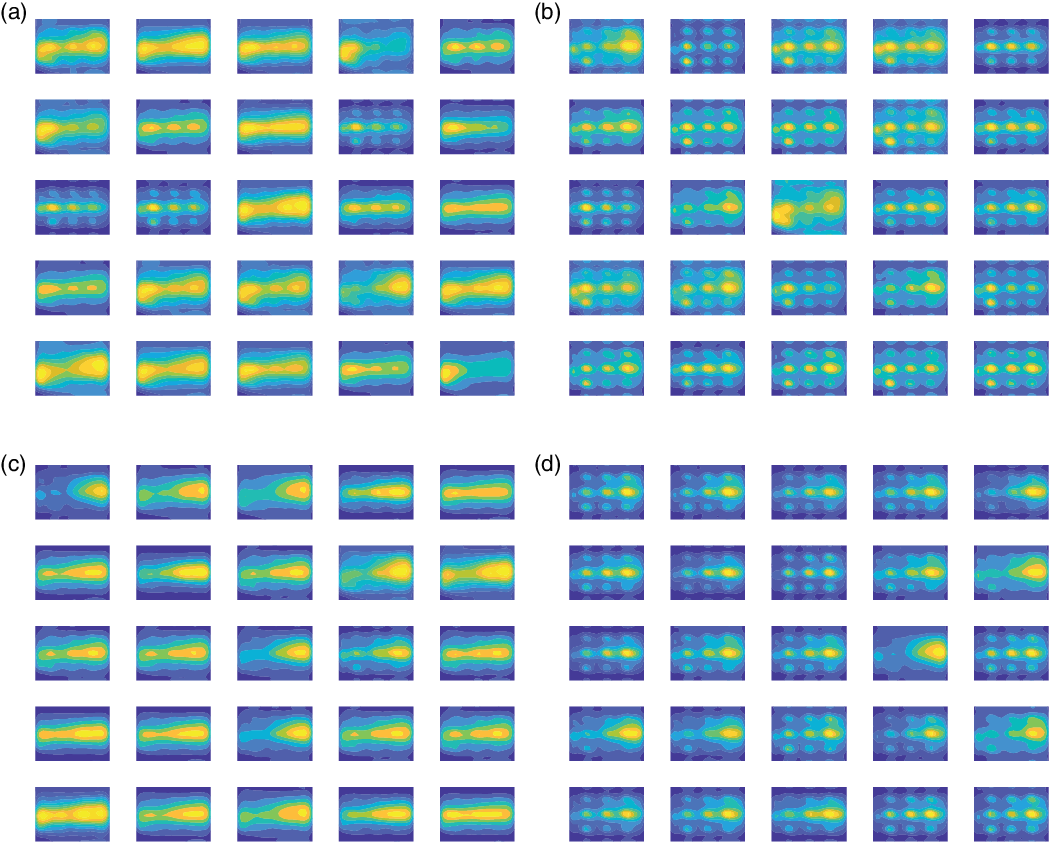
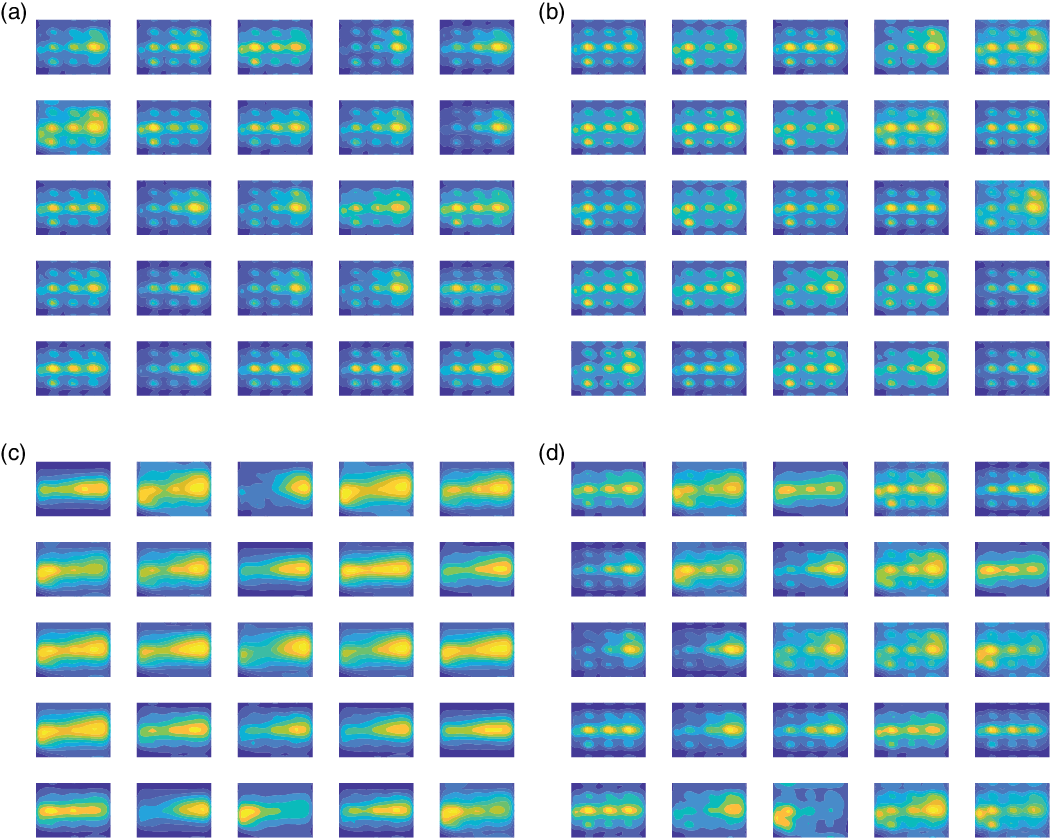
(on PCA features). Figure 5 shows that different driving styles are presented in different clusters. For example, Cluster 2 shows a non-smooth driving style with a lot of time spent at high speeds and low speeds without any acceleration. The drivers in this cluster also tend to spend quite some time at low speeds and negative acceleration (braking). Cluster 4 shows a different non-smooth driving style where the drivers spend a large amount of time at high speeds and zero acceleration. Cluster 3 shows a smooth driving style. Cluster 1 seems to be a combination of both smooth and non-smooth driving styles because the middle part of the mean image is smooth to an extent but not as smooth as that of Cluster 3. We suspect that Cluster 1 contains both driving styles. Figure 6 shows individual drivers in each of the four clusters. This gives us some evidence that Cluster 1 contains different driving behaviours, that is, it is not as homogeneous as the other clusters. For example, the first one on the second column of Figure 6(a) is very smooth, while the third one on the first column of Figure 6(a) is obviously non-smooth. This indicates that there is room for improvement of the clustering results of K-means on PCA features, for example, making the clusters purer.
The cluster means of the four clusters identified by K-means on PCA features. (a) Cluster 1 (b) Cluster 2 (c) Cluster 3 (d) Cluster 4.

Example heatmap images of the four clusters identified by K-means on PCA features, cluster means are provided in Figure 5. (a) Cluster 1 (b) Cluster 2 (c) Cluster 3 (d) Cluster 4.

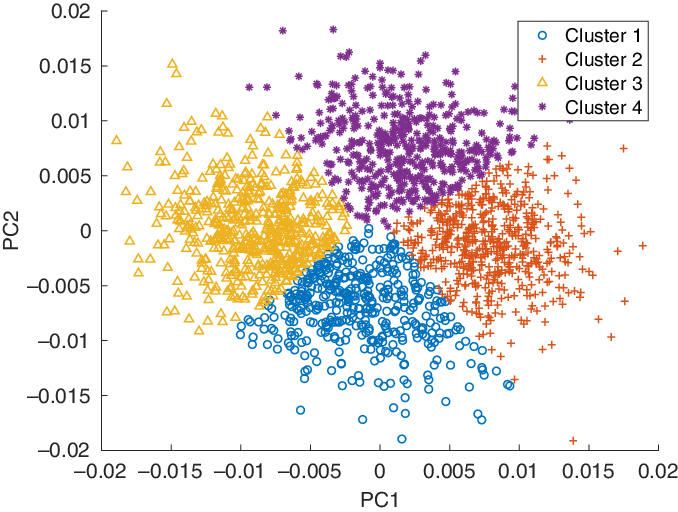
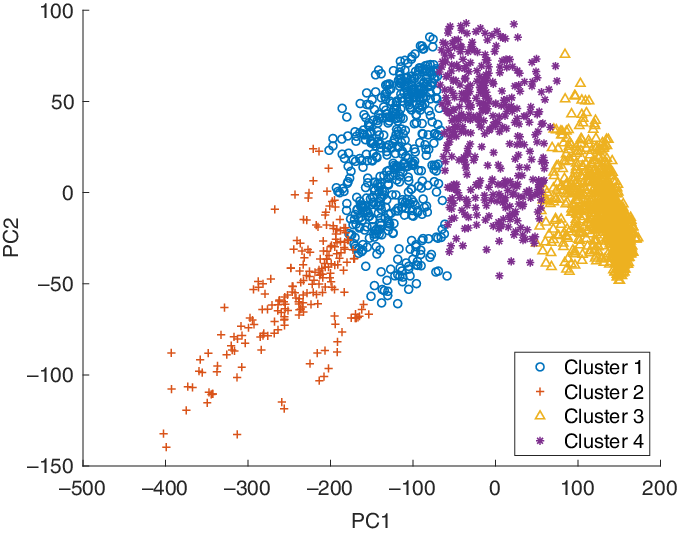
To have a further investigation of the physical meanings of PCs, we visualise the heatmaps via the scatter plot with the first two PCs in Figure 7, where the four clusters are labelled with different symbols. It seems that the first PC, that is, PC1 in Figure 7, indicates the smoothness of the driving style. Clusters 3 with relatively smooth driving style has small values in PC1, while Clusters 2 with relatively non-smooth driving style has large values in PC1.
The scatter plot of heatmaps with the first two PCs. The clusters are labelled by K-means on PCA features.

4.4 K-means clustering on AlexNet features
Here, we show the clustering results of K-means on AlexNet features. Different from the previous two experiments where the input is the data matrix
 $\mathbf{X}$
, we export the heatmaps as RGB images (in.png format) and use these RGB images as input to the pre-trained AlexNet in MatlabFootnote
2
. The high-level features from the fully connected layer “fc7” in Matlab are extracted from the pre-trained AlexNet. Because this layer provides a large number of 4,096 extracted features, we reduce this dimension first by PCA, that is, we apply PCA on the 4,096 features extracted by AlexNet and then use these “AlexNet
 $+$
PCA” features as input to the K-means algorithm. In the rest of this paper, we call these “AlexNet
 $+$
PCA” features as “AlexNet” features in short. The first two PCs are used which explain 79% of the total variation of the AlexNet features.
Similarly to the previous analysis, we first show the scree plot of the K-means algorithm based on AlexNet features in Figure 8. Compared to Figure 3 with the original data and Figure 4 with PCA features, Figure 8 with AlexNet features shows a much clearer elbow. Here we conclude that
 $K=4$
is a good choice for the number of clusters, because the reduction of within-cluster variation becomes much smaller when the number of clusters is larger than 4.
The scree plot of K-means on AlexNet features.

The four cluster means are shown in Figure 9. It seems that Clusters 1, 2 and 3 in Figure 9 with AlexNet features correspond to Clusters 4, 2 and 3 in Figure 5 with PCA features. The major difference is between Cluster 4 in Figure 9 with AlexNet features and Cluster 1 in Figure 5 with PCA features. The plots show that the smooth driving styles are clustered to Cluster 3 by AlexNet features. Cluster 4 in Figure 9(d) shows non-smooth driving styles with a certain degree of smoothness in the middle right part, compared with Clusters 1 and 2. We can also observe that the smoothness of driving styles decreases in the order of Clusters 2, 1, 4 and 3.
The cluster means of the four clusters identified by K-means on AlexNet features. (a) Cluster 1 (b) Cluster 2 (c) Cluster 3 (d) Cluster 4.

The improvement in cluster pureness using AlexNet features is clearer in Figure 10 of example heatmap images. Cluster 4 examples in Figure 10(d) show heatmaps with a certain degree of non-smoothness. We cannot observe a clear mixture of smooth and non-smooth driving styles as in Cluster 1 with PCA features in Figure 6(a).
Example heatmap images of the four clusters identified by K-means on AlexNet features, cluster means are provided in Figure 9. (a) Cluster 1 (b) Cluster 2 (c) Cluster 3 (d) Cluster 4.

The visualisation of the heatmap images are also shown as the scatter plot with the first two PCs of AlexNet features in Figure 11. We can see that PC1 also indicates the smoothness of the driving styles. The values of PC1 increase as the driving styles become smoother.
The PC plot of K-means on AlexNet features.

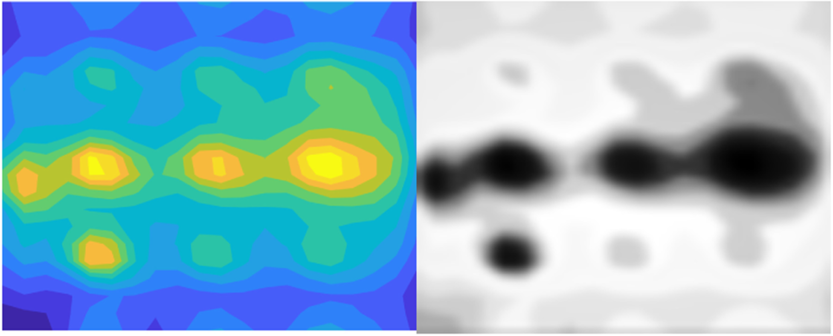
To have a closer look at the features extracted by AlexNet, we show the activation images of two layers for the heatmap image of the first driver. Each layer in AlexNet is consisting of many two-dimensional arrays which are called channels. By visualising the channels, we can examine which parts of the image are strongly activated or which features are extracted by the channel. Usually, the channels in early layers extract simple features, for example, colour or edge, while those in latter layers extract deep features, for example, eyes in face recognition. For the heatmap image of driver 1, the strongest activation channel in the first convolutional layer, conv1, is shown in Figure 12. The white part indicates the area that is positively activated, while the black part indicates the area that is negatively activated. It is clear that this layer extracts the features represented by the light blue area in the heatmap. Figure 13 shows the 14th and 99th channels in the fifth convolutional layer, conv5, for the first driver. These two channels extract features representing the non-smoothness of the heatmap image.
The strongest activation channel in the first convolutional layer, conv1, of driver 1.

The 14th and 99th channels in the fifth convolutional layer, conv5, of driver 1.

4.5 Quantitative measurement of clustering results
In previous sections, we have shown the improvement of using AlexNet features by visualising the elbow plots, the cluster mean images and the example images of each cluster. Here, we aim to quantitatively measure this improvement. Given the fact that we do not have the ground truth labels of the heatmaps, it is not possible to compute the purity of the clustering results. Instead of using purity, we choose the average silhouette value (Rousseeuw, Reference Rousseeuw1987) as our metric, which does not require the knowledge of ground truth labels. The average silhouette value measures how similar the heatmaps are to their own clusters and how dissimilar the heatmaps are to other clusters. The higher the average silhouette value, the better the clustering results.
After applying K-means, we assign each heatmap to one of the clusters
 $C_1,C_2, \ldots, C_K$
, where K is the predefined number of clusters and in our experiments it has chosen to be
 $K=4$
. For the ith heatmap that is assigned to the sth cluster, we calculate its average distance to all other heatmaps assigned to the same cluster:
 \begin{equation}a_i=\frac{1}{|C_s| - 1} \sum_{j \in C_s, j \neq i} d(i ,j)\end{equation}
where
 $|C_s|$
denotes the number of heatmaps in cluster
 $C_s$
. Thus,
 $a_i$
measures how similar the ith heatmap is to its own cluster. Here, we use the Euclidean distance between heatmaps i and j to measure the dissimilarity between them. We assume that two heatmaps with a small Euclidean distance have a high similarity, while those with a large Euclidean distance have a high dissimilarity. To measure how dissimilar the ith heatmap is to other clusters, we calculate
 \begin{equation}b_i= \min_{k \neq s} \;\; \frac{1}{|C_k|} \sum_{l \in C_k} d(i, l)\end{equation}
where
 $k=1,2,\ldots,K$
.
The silhouette value of the ith heatmap is now defined as:
 \begin{equation}s_i=\frac{b_i - a_i}{\max \{a_i, b_i \}}\end{equation}
We can see that
 $s_i$
takes values between
 $[{-}1,1]$
. The larger the value of
 $s_i$
, the higher the dissimilarity between the ith heatmap and other clusters, while the higher the similarity between the ith heatmap and its own cluster. Thus, a large value of
 $s_i$
indicates better clustering of the ith heatmap.
To measure how well the clustering results are for all heatmaps, we can simply take the average silhouette value of all heatmaps:
 \begin{equation}s_{all}= \frac{1}{N} \sum^N_{i=1} s_i\end{equation}
where N is the total number of heatmaps, and in our experiment it is
 $N=2,000$
.
We show
 $s_{all}$
for the clustering results of K-means with
 $K=4$
using the pure K-means, PCA features and AlexNet features in Table 1. This silhouette value shows a clear increase from the original K-means to the AlexNet extracted K-means method, indicating that we receive much more purity when appropriately pre-processing the heatmaps before applying the K-means algorithm.
The average silhouette values of all heatmaps when clustering by K-means with
 $K=4$

5 Conclusion
Clustering driving styles by analysing speed–acceleration v-a heatmaps is one interesting topic in studying telematics car driving data. In this study, we propose to process the heatmaps as images and involve supervised information via transfer learning in our clustering task. More specifically, we propose to extract features with supervised information from the pre-trained AlexNet for image classification tasks and conduct clustering based on these features. Experiments on both simulated data and real data show the improvement of clustering results compared with using original data and PCA features. This is verified by comparing the corresponding silhouette values that clearly prefer the pre-trained AlexNet features.