

1. Introduction
The Actuarial Profession requires projections of future mortality for pricing and valuing benefits dependent on death or survival. Gallop (Reference Gallop2008) identifies the following main approaches for projecting future mortality: extrapolative approaches based on identifying past trends and extrapolating them into the future; targeting approaches where mortality rates are assumed to approach a target level over time; explanatory approaches which use causal methods based on economic and/or environmental variables to forecast future mortality, and process based methods that use a bio-medical approach to model the factors that determine death. Much actuarial research on mortality projections has focussed on extrapolative approaches. Early approaches included extrapolating past mortality rates by mathematical formula and also extrapolating parameter values from mathematical formulae fitted to mortality data. More recently Sithole et al. (Reference Sithole, Haberman and Verrall2000) investigated the use of parametric models in the framework of generalized linear and non-linear models for projecting future mortality while the Continuous Mortality Investigation (CMI) interim cohort projections (CMI, 2002) extrapolate mortality trends for the cohort of CMI assured lives born a few years either side of 1926. Wong-Fupuy & Haberman (Reference Wong-Fupuy and Haberman2004) provide a detailed overview of recent UK and US mortality projection methodologies that are extrapolative in nature.
In 2002, the CMI sponsored research into two extrapolation based methods to investigate their suitability for projecting future improvements for CMI mortality data – namely the “2-Dimensional Penalised Spline (P-Spline)” (Currie et al., Reference Currie, Durban and Eilers2004) and the “Lee-Carter” (Lee & Carter, Reference Lee and Carter1992) methods. This ultimately led to the CMI publishing version 1.0 of the “Library of Mortality Projections” in July 2007. The library contains the results of (amongst others) the P-Spline and Lee-Carter methods applied to CMI assured lives and the UK Office of National Statistics (ONS) data for both males and females over a range of years. The user guide (CMI, 2007c) accompanying the library includes illustrative values for annuities and expectation of life calculated using the projected mortality improvement rates contained in the library. This paper considers the suitability of generalized additive models (GAMs) for projecting future mortality rates by comparing them with the CMI P-Spline and Lee-Carter models in version 1.0 of the CMI Library of Mortality Projections. The generalized additive models are then applied to Irish population data to project future Irish mortality improvements and annuity rates using these improvements.
The generalized additive models considered here use age, period (year of death) and cohort (year of birth) as possible factors to project future mortality. The classical age + period + cohort (APC) models (Holford, Reference Holford1983) effectively describe past changes in mortality. However, given the non-parametric nature of these models they are unsuitable for making projections outside the range of fitted data. Various alterations have been proposed to the classical age-period-cohort model to extrapolate results outside of the fitted region. Bray (Reference Bray2002) describes a Bayesian APC model with an autoregressive prior on the age, period and cohort terms. A similar model was applied by Bashir & Esteve (Reference Bashir and Esteve2001) for projecting cancer incidence and mortality in Finland, and by Cleries et al. (Reference Cleries, Ribes, Esteban, Martinez and Borras2006) for projecting breast cancer mortality in Spain.
Generalized additive models are widely used in time-series studies of mortality and air pollution. Dominici et al. (Reference Dominici, McDermott, Zeger and Samet2002) discuss the use of GAMs for modelling relative rates of mortality and morbidity in such cases. Mortality projections using GAMs are described by Clements et al. (Reference Clements, Armstrong and Moolgavkar2005) who compare a GAM age + period, age + cohort, age + period + cohort and a 2-dimensional age-period model with a Bayesian APC model for predicting female cancer mortality rates in several countries.
The layout of the remainder of the paper is as follows: section 2 describes the data to which the models are applied, section 3 introduces the GAM models, section 4 presents the results of applying the GAMs to the data, section 5 compares the GAMs with the CMI “P-Spline” and “Lee-Carter” models, section 6 discusses the relative suitability of the GAM models for mortality projections, and section 7 concludes by applying the GAMs to Irish population data for males and females.
2. Data Sources
The CMI Male Assured Lives data (1947 to 2005) is used for comparing the GAMs relative to the CMI P-Spline and Lee-Carter models. This dataset provides a count of the number of deaths and corresponding central exposed-to-risk for ages 42 to 90 for each year between 1947 and 2005.
For projecting Irish mortality rates, the number of deaths and census figures for the population of males and females were obtained from the Central Statistics Office (CSO) for ages 40 to 90 in the following years: 1961, 1966, 1971, 1979, 1981, 1986, 1991, 1996, 2002 and 2006. The death and census data use the age definition “age last birthday” and I have assumed that the census figures for each age and year approximate the central exposed to risk at 30th June for that age and year. The CSO data is much sparser and irregularly spaced, relative to the Assured Lives data.
3. Generalized Additive Models
Generalized additive models extend Generalized Linear Models (GLMs) (Nelder & Wedderburn, Reference Nelder and Wedderburn1972) which model a linear relationship between a response y and a set of predictors x1, …., xn where the response y is non normally distributed. The basic form of a GLM is:

where μ = E(y) and g is referred to as the link function. The Poisson distribution can be used to model the number of deaths occurring over an interval, and the Poisson GLM has been used extensively to describe the relationship between the expected number of deaths and predictors such as age, period (year of death), cohort (year of birth) and lifestyle factors such as smoking status, income, location, etc. However, the linearity assumption may not apply in practice and for complex data structures with large numbers of covariates, the parametric nature of GLMs heightens the risk of model mis-specification with consequent problems for inference and prediction.
GAMs relax the linearity assumption of GLMs and allow the linear predictor to include smooth functions of the covariates. By replacing detailed parametric relationships with smooth functions, GAMs allow complex relationships to be implemented while still retaining a simple linear relationship amongst the predictor variables. The basic form of a GAM is:

where as before μ = E(y) and fm + 1, …., fm +n are smooth non-parametric functions.
In this paper Poisson GAMs using thin plate regression splines as the smooth functions are used to model past mortality rates and to project future rates. Consider a set of observations  where Dx,t is the number of deaths aged x in year t and
 is the corresponding central exposed-to-risk. The number of deaths is assumed to follow a Poisson distribution where
 where μx,t is the force of mortality at age x in year t. The generalized additive models take the form
 with linear predictor η = log μx,t and
 is treated as an offset. The GAMs discussed are the 1-dimensional age and period (A + P) and age and cohort (A + C) models with respective linear predictors:


and the 2-dimensional age-period (AP) and age-cohort (AC) models with respective linear predictors:


Model projections are based on extrapolating (Clements et al., 2005) the smooth functions and evaluating at the required values of age, period and cohort. If the smooth functions are thought of as modelling past trends of the impact of covariates on the response, then GAMs provide a simple method of prediction based on extrapolating past trends for each of the covariates.
The generalized additive models are implemented using the R (R Development Core Team, 2009) version 2.9.0 package mgcv (Wood, Reference Wood2001), version 1.5–2, which provides functions for fitting generalized additive models, generating confidence intervals and predicting future values. The models are fitted using penalized maximum likelihood where the model likelihood is modified by the addition of a penalty for each smooth function penalizing its “wiggliness”. Each penalty is multiplied by an associated smoothing parameter which controls the trade-off between goodness of fit and smoothness. The smoothing parameters are estimated automatically using Unbiased Risk Estimation (UBRE). The application of the penalties during fitting reduces the degrees of freedom to yield the effective degrees of freedom for the smooth functions. The degrees of freedom in the model specification place an upper limit on the flexibility of a smooth function while the smoothing parameters determine the effective degrees of freedom within that limit.
Smooth functions vary from a completely smooth straight line to zero smoothness. When specifying a GAM, care must be taken when choosing the degrees of freedom for each smooth function to ensure a balance between a sufficiently high degree of freedom to correctly capture variations in the data and a low degree of freedom to allow the overall trend in the data to be modelled. What is an appropriate degree of freedom for modelling the underlying trend obviously depends on the data, knowledge of the process being modelled and the purpose of the model. Fewster et al. (Reference Fewster, Buckland, Siriwardena, Baillie and Wilson2000) discussed the choice of model degrees of freedom when using generalized additive models to analyse population trends for birds. They suggested using a low number of degrees of freedom for modelling long term trends.
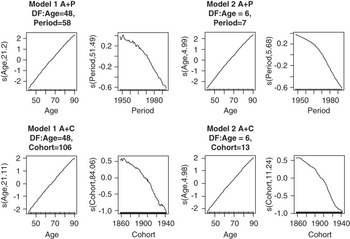
To illustrate the effect of choice of degrees of freedom, Figure 1 presents the smooth functions of age, period and cohort as a result of fitting the generalized additive A + P and A + C models to the assured lives dataset with different degrees of freedom for the smooth functions of age and period and cohort. The degrees of freedom are set via the basis dimension parameter, k, of the gam function in the mgcv library and are equal to k−1. For “Model 1” the degrees of freedom for each predictor are set equal to the maximum allowable. For “Model 2” the degrees of freedom are one-eighth those of “Model 1”. The y-axis label shows the effective degrees of freedom for each smooth term.
Plots of smooth functions of age, period and cohort from fitting the A + P and A + C model using various degrees of freedom. The y-axes are labelled with the resulting effective degrees of freedom of the smooth functions.

As can be seen with increasing degrees of freedom the smooth functions exhibit increasing fluctuation. For models 1, with the maximum allowable degrees of freedom for the smooth functions of age, period and cohort, the period and cohort effects fluctuate significantly and no overall trend for extrapolation can be identified. In the case of model 2 however, with one-eighth of the degrees of freedom for the smooth functions of age, period and cohort, the smooth functions of period and cohort exhibit much lower volatility and decrease smoothly over time.
The smooth functions are implemented using thin plate regression splines – further details on this approach can be found in Wood (Reference Wood2003) and Wood (Reference Wood2006). Predictions of future mortality are based on extrapolating the spline fits and as a result the eventual predictions of future mortality will depend on the degrees of freedom chosen for the covariates. When using GAMs to model past trends for extrapolation purposes the degrees of freedom chosen should be the minimum necessary to capture any trends in the data ignoring random fluctuations.
4. Models and Results
4.1. 1-Dimensional GAMs
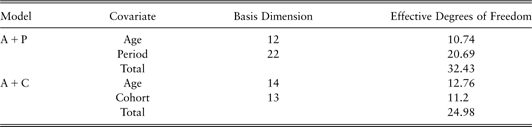
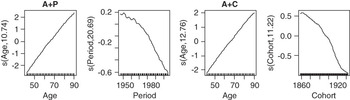
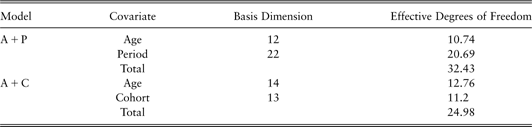
The 1-dimensional generalized additive A + P and A + C models were fitted to the full assured lives dataset (ages 42–90 and years 1947–2005). The choice of basis dimension for each of the covariates, age, period and cohort, was checked for appropriateness using the method described by (Wood, Reference Wood2006). In summary the models were repeatedly fitted to the data with increasing degrees of freedom for each of the covariates. The deviance residuals for the fitted models were extracted and smoothed with respect to each of the covariates in the model but using a significantly increased basis dimension to see if there was a pattern in the residuals that could be explained by increasing the basis dimension. The basis dimensions were chosen to be the minimum necessary to ensure that the residuals did not exhibit any unexplained variation that could be removed by increasing the basis dimension. Table 1 presents the resulting generalized additive A + P and A + C models. Figure 2 plots the smooth functions of the covariates for the A + P and A + C models in table 1.
1-dimensional generalized additive A + P and A + C models fitted to Assured Lives Data.
Plots of smooth functions for the 1-dimensional generalized additive A + P and A + C models.

For illustration Figure 3 displays the projected values of log(μ) for the A + P and A + C models for ages 65, 75 and 85 together with their 95% confidence intervals from 2005 to 2035. From Figure 3. we can see that both models predict similar improvements in mortality over the 30 year period. The A + P model predicts slightly lower values of log(μ) at ages 65 and 75 than the A + C model and vice versa at age 85.
Projected values of log(μ) 2005 to 2035 for the generalized additive A + P and A + C model.

4.2. 2-Dimensional GAMs
The 2-dimensional generalized additive AP and AC models were fitted to the full assured lives data and the appropriate basis dimension was chosen in a similar manner to the 1-dimensional models by repeatedly increasing the basis dimension in steps of 5 until the residuals exhibited no variation that could be explained by increasing the basis dimension further. Table 2 presents the resulting generalized additive AP and AC models.
2-dimensional generalized additive AP and AC models fitted to Assured Lives Data.

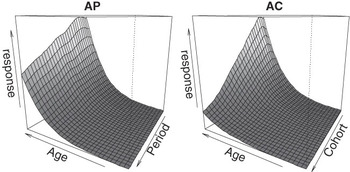
Figure 4 displays perspective plots of the fitted values for the AP and AC models respectively. From the plots it can be seen that in both cases the predictors increase smoothly with age and decrease smoothly with period or cohort.
Plots of the fitted values for the 2-dimensional generalized additive AP and AC models.

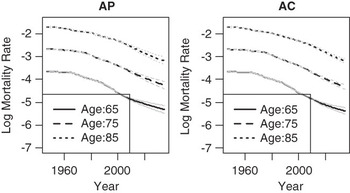
For illustration Figure 5 displays the projected values of log(μ) for the AP and AC models for ages 65, 75 and 85 together with their 95% confidence intervals from 2005 to 2035. From Figure 5 we can see that both models predict similar improvements in mortality over the 30 year period at the ages shown. Comparing with the projected values for the 1-dimensional models the 2-dimensional models predict slightly faster improvements in mortality for the ages shown over the 30 year period 2005 to 2035.
Projected values of log(μ) 2005 to 2035 for the generalized additive AP and AC models.

5. Model Comparisons
As discussed in section 1 two models for modelling and projecting future mortality are the P-Spline and Lee-Carter models. The P-Spline model (Currie et al., Reference Currie, Durban and Eilers2004) fits penalized 2-dimensional cubic splines to mortality and exposure data and projects future mortality rates by extrapolating these splines into the future. The dimensions of the splines can be age and year of death (age-period model) or age and year of birth (age-cohort model). The level of smoothing depends on the choice of penalty for the 2-dimensional splines. The Lee-Carter method (Lee & Carter, Reference Lee and Carter1992) uses a time series model to project future mortality rates. The general form of the Lee-Carter method is as follows:

where α(x) is the average level of the log(μ(x,t)) surface over time for age x, k(t) is the overall change in mortality over time, b(x) are the deviations from k(x) by age and z(x,t) are the random deviations.
The CMI published its assessment of the P-Spline method in Working Paper 20 (CMI, 2006a) and the Lee-Carter method in Working Paper 25 (CMI, 2007a). The CMI also made software available for applying the P-Spline and Lee-Carter models described in these papers to mortality and exposure data. Version 3.0 of the CMI P-Spline and Lee-Carter software is used to generate the results for the P-Spline and Lee-Carter models in this paper. The parameters of the P-Spline models are those listed in Appendix B of the CMI user guide to version 1.0 of the CMI Library of Mortality Projections (CMI, 2007c). The 1 and 2 dimensional generalized additive models are compared to the P-Spline and Lee-Carter models by comparing past and future predictions for the CMI male assured lives. To assess the accuracy of the models “back testing” is used where the models are fitted to a subset of the assured lives data and the projected deaths in future years are compared with the actual deaths observed. The accuracy of the projections are assessed using the Root Mean Square Error. Future predictions are compared using annuity values based on each models’ predictions of future mortality.
5.1. Back Testing using the Root Mean Square Error (RMSE)
The Root Mean Square Error (RMSE) is used to assess the accuracy of the model predictions in the age range 60 to 90. The RMSE quantifies the difference between the number of deaths predicted by the model and the actual number of deaths observed and is defined as:

where n = i × j, di,j is the expected number of deaths  and D i,j is the actual number of deaths observed at age i in year j.
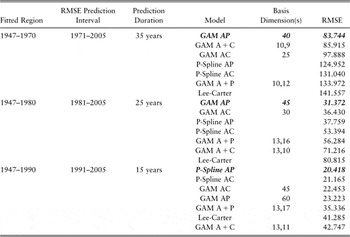
The accuracy of the predictions were assessed over various intervals. The models were fitted to the subsets listed in table 3. using the method described in sections 4.1 and 4.2 and the RMSE was calculated for ages 60–90 using the projected values of log(μ) for the corresponding intervals shown. All models were fitted to the age range 42 to 90.
Root Mean Square Error intervals for assessing accuracy of model predictions.

The RMSE of each model’s predictions over various intervals are presented in table 4. and are ranked according to their RMSE. In each case the RMSE was calculated from the end of the fitted region to 2005. The 1-dimensional A + P and the 2-dimensional AP and AC GAMs perform well relative to the CMI P-Spline and Lee-Carter models with the GAM AP model having the lowest RMSE in the prediction intervals 1971 to 2005 and 1981 to 2005. The 2-dimensional GAMs perform better than the P-Spline models over the longer prediction durations of 35 (1971 to 2005) and 25 (1981 to 2005) years. Over the shortest prediction interval 1991 to 2005 (15 years) the P-Spline models and 2-dimensional GAMs have similar RMSEs. The 1-dimensional generalized additive A + P model performs better than the Lee-Carter model over each of the 3 prediction intervals. The 1-dimensional generalized additive A + C model performs well over the longest prediction interval 1971 to 2005 but performs poorly over the remaining two prediction intervals. The Lee-Carter model performs poorly with the highest RMSE in the prediction intervals 1971 to 2005 and 1981 to 2005 and the second highest RMSE in the prediction interval 1991 to 2005.
Root Mean Square Error of model predictions over various intervals.

5.2. Annuity Values using Projected Mortality Rates
Annuity values in 2007 for ages 60, 65, 70 and 80 are calculated using each models’ predictions. The annuity values are calculated using the method described in Working Paper 20, section 6 (CMI, 2006a). Firstly, projected mortality rates for each age, x, in year t are calculated from the projected values of log(μ) as follows:

Annual mortality improvements are then calculated and applied to 100% of the base mortality table PCMA00 in 2007. There is no explicit allowance for mortality improvements between 2000 and 2007. Mortality improvements after age 90 are assumed to be equal to those at age 90. The annuity rates are calculated assuming an interest rate of 5% p.a. and no escalation.
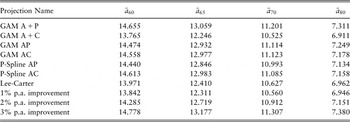
The generalized additive and CMI models were fitted to the age range 42 to 90 for years 1947 to 2005. Table 5 presents the annuity values calculated using the generalized additive model projections and the P-Spline and Lee-Carter projections applied to the base table PCMA00 in 2007. Annuity values assuming a 1%, 2% and 3% per annum compound improvement in mortality are also shown. Based on the results in table 5. the 2-dimensional generalized additive and P-Spline models result in similar annuity values at the ages shown. The GAM AP model predicts slightly higher annuity values than the P-Spline AP models and the P-Spline AC model predicts slightly higher annuity values at the earlier ages (60 and 65) than the GAM AC model and vice versa at the later ages (70 and 80). The Lee-Carter and the generalized additive A + C models predict the lowest annuity values at the ages shown. The annuity values shown for the generalized additive models lie in the range of a 2% to 3% per annum compound improvement in mortality with the exception of the A + C model which yields lower annuity values in the range of a 0% to 1% per annum compound improvement in mortality at the ages shown.
Comparison of annuity values at ages 60, 65, 70 and 80 using each models’ predictions of future mortality.

6. Discussion
Generalized additive models provide an intuitively simple method of modelling past mortality and projecting future mortality. By modelling smooth function(s) of covariates we can develop flexible mortality models without the need to specify detailed parametric relationships between the covariates. Thin plate regression splines are used as the smoothing function in this paper but alternative smoothing functions can be chosen. Unlike other spline based smoothing functions thin plate regression splines avoid the need to choose “knot locations” although as shown care is needed when specifying the model degrees of freedom in order to provide sufficient flexibility to model actual changes in trends whilst ignoring any random fluctuations in the underlying trend. However, the ability to choose the degrees of freedom for the model does allow a user to apply their own judgment or expertise when choosing an appropriate model for a particular situation. The final model should always be checked for reasonableness prior to use.
Relative to the CMI P-Spline and Lee-Carter mortality models the predictive accuracy (measured using the RMSE) of the 1-dimensional A + P and 2-dimensional AP and AC GAMs are comparable over intervals of 15, 25 and 35 years with the 2-dimensional generalized additive AP model performing best over 35 years and over 25 years. Extrapolating the period and cohort effects into the future these GAMs yield consistent annuity values in 2007 at ages 60, 65, 70 and 80.
Generalized additive models can easily be fitted using the R (R Development Core Team, 2008) package, mgcv. The mgcv package provides a choice of smoothing functions in both one and multiple dimensions as well as useful diagnostic tools and graphing facilities for visualizing the output of models. However, it should be noted that there were problems fitting the 2-dimensional GAMs to very large datasets and as a result the age range used was restricted to ages 42 to 90. The mgcv software allows for quick and easy implementation of a range of generalized additive models and hopefully will result in more widespread use of such models for analyzing mortality data. In conclusion, the 1 and 2-dimensional generalized additive models discussed in this paper provide a simple but flexible method of projecting future mortality which compare well with the CMI P-Spline and Lee-Carter methods in terms of prediction accuracy.
7. Mortality Projections for the Irish Population
The Central Statistics Office in Ireland generates projections of future Irish mortality using a targeting approach where mortality rates in future years are based on a combination of observed short term trends and an estimate of long term mortality improvements – see Whelan (Reference Whelan2008) for full details. In contrast the generalized additive models discussed in this paper project future mortality by identifying past trends and extrapolating these trends into the future. The 1 and 2-dimensional generalized additive models were applied to the Irish CSO data described in section 2. An additional term allowing for the interaction between age and sex was added to the models to allow for the joint modelling of male and female mortality. The interaction term was also implemented as a smooth function. The models were chosen using the approach outlined in section 4.1.
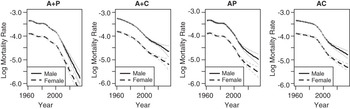
Figure 6 illustrates the predicted values of log(μ) at age 65 over the thirty year period from 2005 to 2035 together with their 95% confidence limits for both males and females using each of the generalized additive models. From the diagrams it can be seen that the A + P model predicts the fastest improvements in mortality for both males and females while the A + C model predicts the slowest improvements. The 2-dimensional AP and AC models predict similar improvements in mortality over the 30 year period.
Generalized additive model projections of log(μ) at age 65 for Irish population data for males and females.

7.1. Comparison with CMI Library of Mortality Projections
The “00” series tables published by the CMIB in 2006 (CMI, 2006b) do not include any explicit mortality projections. Instead actuaries should now consider a range of scenarios when projecting future mortality and the CMIB has made available sample projections in v1.0 of the “CMI Library of Mortality Projections” for this purpose. The user guide accompanying the library contains illustrative annuity values at ages 60, 65, 70 and 80 in 2007 using the sample projections contained in the library applied to the base table PCMA00 for males or PCFA00 for females as appropriate.
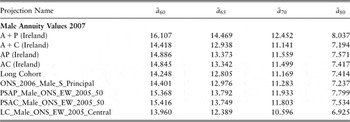
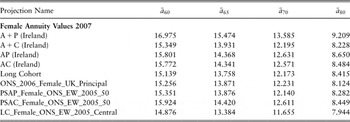
Tables 6 and 7 present for males and females respectively, annuity values calculated using Irish mortality improvements and improvements calculated using the following sample projections from v1.0 of the CMI Library of Mortality Projections: the CMI interim long cohort projections, the UK Office of National Statistics (ONS) 2006-based National Population Projections and the P-Spline and Lee-Carter projections for England and Wales ONS data for 2005. The UK annuity values are those quoted in section 7, Illustrative Values, of the user guide accompanying the library. Irish annuity values are calculated using the mortality improvements derived from the generalized additive models mortality projections for the CSO data. The projected values of log(μ) are converted to mortality rates using the formula q(x,t) = 1−exp(−(μ(x,t))) for ages x = 40 to 90 and for each future year t. As described in section 5.2, mortality improvements are subsequently derived from these rates and applied to the base tables PCMA00 and PCFA00 for males and females respectively. In all cases the annuities are calculated assuming an interest rate of 5% per annum, no escalation and 100% of the appropriate base mortality table in 2007.
Male annuity values using projected mortality improvements from the GAMs applied to the Irish CSO data and from the CMI P-Spline and Lee-Carter models applied to UK ONS data.

Female annuity values using projected mortality improvements from the GAMs applied to the Irish CSO data and from the CMI P-Spline and Lee-Carter models applied to UK ONS data.

Based on the results in tables 6 and 7 the generalized additive models, with the exception of the A + P model result in Irish annuity values at the ages shown in the range of annuity values calculated assuming a 2% to 4% annual compound improvement in mortality for males and females respectively. For both males and females the generalized additive A + P and AP models result in higher annuity values than the A + C and AC models. From the results in table 6 the generalized additive A + C, AP and AC models predict higher future Irish mortality for Irish males than the P-Spline models do for UK males. Similarly, based on the results in table 7 the P-Spline AC model predicts lower future mortality for UK females than the generalized additive A + C, AP and AC models predict for Irish females at ages 60 and 65. Comparing the average of the annuity values calculated using the 2-dimensional GAMs and the P-Spline models the difference between the annuity values for Irish and UK females is smaller than the difference between the annuity values for Irish and UK males at the ages shown.
7.2. Conclusion
The 1 and 2-dimensional generalized additive models predict further declines in Irish mortality for both males and females. Based on past mortality experience we would not expect UK mortality to exceed Irish mortality and on this basis the projections from the 1-dimensional A + P model appear over-optimistic. Whilst projections based on past data are always liable to error, the dramatic changes which occurred in the Irish population between 1961 and 2005 mean that any future projections based on extrapolations of trends during this period must be treated with even more caution than usual. In particular Ireland experienced unprecedented levels of inward migration during the “Celtic Tiger” years of the 1990’s and the first half of the 21st century. The impact of such levels of inward migration on the population will only become evident with time and this should be borne in mind whenever projections of future Irish mortality are discussed. Nevertheless the generalized additive models described here provide a useful starting point for Irish mortality analysis.
Acknowledgements
The author wishes to thank the CMI Bureau, UK, for providing the Assured Lives data and the Central Statistics Office, Ireland, for providing the Irish population data.