


1. Introduction
Deep neural networks have recently emerged as a promising technique for use in tasks across the various traditional disciplines of actuarial science, including pricing, reserving, experience analysis, and mortality forecasting. Moreover, deep learning has been applied in emerging areas of actuarial practice, such as analysis of telematics data, natural language processing, and image recognition. These techniques provide significant gains in accuracy compared to traditional methods, while maintaining a close connection of these models to the generalized linear models (GLMs) currently used in the non-life insurance industry for pricing policies and reserving for claims not yet settled.
On the other hand, one seeming disadvantage of neural network models is that the output from these models may exhibit undesirable characteristics for actuarial purposes. The first issue is that predictions may vary in a rough manner with changes in insurance risk factors. In some contexts, such as general insurance pricing, this may be problematic to explain to customers, intermediaries, or other stakeholders or may indicate problems with data credibility. For example, consider a general insurance pricing model that uses driver age as a risk factor. Usually, from a commercial perspective, as a customer ages, it is expected that her insurance rates would change smoothly. However, unconstrained output from neural networks may produce rates that vary roughly with age. It is difficult to explain to customers why rates might increase one year and then decrease the next, and, moreover, extra costs might arise from needing to address these types of queries. A second issue is that actuaries often wish to constrain predictions from models to increase (or decrease) in a monotonic manner with some risk factors, for example, increasing sums insured should lead, other things being equal, to higher average costs per claim and worsening bonus-malus scores should imply higher expected frequencies of claims. Although constraining GLM parameters relating to insurance risk factors to be smooth or exhibit monotonicity is trivial, since the coefficients of GLMs can be modified directly, methods to introduce these constraints into deep neural networks have not yet been developed. Thus, a significant barrier for the adoption of neural networks in practice exists.
Typical practice when manually building actuarial models is that actuaries will attempt to enforce smoothness or monotonicity constraints within models by modifying model structure or coefficients manually, as mentioned before, by applying relevant functional forms within models, such as parametric functions, regularization, or by applying post hoc smoothing techniques; we mention, e.g., Whittaker–Henderson smoothing (Whittaker, Reference Whittaker1922; Henderson, Reference Henderson1924) which adds regularization to parameters. In the case of GLMs for general insurance pricing, the simple linear structure of these models is often exploited by, firstly, fitting an unconstrained GLM, then specifying some simplifications whereby coefficients are forced to follow the desired functional form or meet smoothness criteria. In more complex models, such as neural networks, operating directly on model coefficients or structure is less feasible.
To overcome this challenge, we present methods for enforcing smoothness and monotonicity constraints within deep neural network models. The key idea can be summarized as follows: as a first step, insurance risk factors that should be constrained are identified, and then, the datasets used for model fitting are augmented to produce pseudo-data that reflect the structure of the identified variables. In the next step, we design a multi-input/multi-output neural network that can process jointly the original observation as well as the pseudo-data. Finally, a joint loss function is used to train the network to make accurate predictions while enforcing the desired constraints on the pseudo-data. We show how these models can be trained and provide example applications using a real-world general insurance pricing dataset.
The method we propose can be related to the Individual Conditional Expectation (ICE) model interpretability technique of Goldstein et al. (Reference Goldstein, Kapelner, Bleich and Pitkin2015). Therefore, we call our proposal the ICEnet, to emphasize this connection. To enable the training of neural networks with constraints, the ICEnet structures networks to output a vector of predictions derived from the pseudo-data input to the network; these predictions derived from the network for the key variables of interest on the pseudo-data are exactly equivalent to the outputs used to derive an ICE plot. The selected constraints then constrain these ICEnet outputs from the network to be as smooth or monotonic as required. For this purpose, we will use fully connected networks (FCNs) with embedding layers for categorical variables to perform supervised learning, and, in the process, create the ICEnet outputs for the variables of interest.
Literature review. Practicing actuaries often require smoothed results of experience analyses in both general and life insurance, usually on the assumption that outputs of models that do not exhibit smoothness are anomalous. For example, Goldburd et al. (Reference Goldburd, Khare, Tevet and Guller2016) and Anderson et al. (Reference Anderson, Feldblum, Modlin, Schirmacher, Schirmacher and Thandi2007) discuss manual smoothing methods in the context of general insurance pricing with GLMs. In life insurance, two main types of techniques are used to graduate (i.e., smooth) mortality tables; in some jurisdictions, such as the United Kingdom and South Africa, combinations of polynomial functions have often been used to fit mortality data directly, see, for example, Forfar et al. (Reference Forfar, McCutcheon and Wilkie1987), whereas post hoc smoothing methods such as Whittaker–Henderson smoothing (Whittaker, Reference Whittaker1922; Henderson, Reference Henderson1924) have often been used in the United States. The use of splines and generalized additive models (GAMs) have also been considered for these purposes, see Goldburd et al. (Reference Goldburd, Khare, Tevet and Guller2016) in the context of general insurance and Debón et al. (Reference Debón, Montes and Sala2006) in the context of mortality data.
More recently, penalized regression techniques have been utilized for variable selection and categorical level fusion for general insurance pricing. These are often based on the Least Absolute Shrinkage and Selection Operator (LASSO) regression of Tibshirani (Reference Tibshirani1996) and its extensions (Hastie et al., Reference Hastie, Tibshirani and Wainwright2015); here, we mention the fused LASSO which produces model coefficients that vary smoothly, see Tibshirani et al. (Reference Tibshirani, Saunders, Rosset, Zhu and Knight2005), which is particularly useful for deriving smoothly varying models for ordinal categorical data. In the actuarial literature, example applications of the constrained regression approach are Devriendt et al. (Reference Devriendt, Antonio, Reynkens and Verbelen2021), who propose an algorithm for incorporating multiple penalties for complex general insurance pricing data, and Henckaerts et al. (Reference Henckaerts, Antonio, Clijsters and Verbelen2018), who provide a data-driven binning approach designed to produce GLMs which closely mirror smooth GAMs.
Within the machine and deep learning literature, various methods for enforcing monotonicity constraints within gradient boosting machines (GBM) and neural network models have been proposed. Monotonicity constraints are usually added to GBMs by modifying the process used to fit decision trees when producing these models; an example of this can be found in the well-known XGBoost library of Chen & Guestrin (Reference Chen and Guestrin2016). Since these constraints are implemented specifically by modifying how the decision trees underlying the GBM are fit to the data, the same process cannot be applied for neural network models. Within the deep learning literature, monotonicity constraints have been addressed by constraining the weights of neural networks to be positive, see, for example, Sill (Reference Sill1997) and Daniels & Velikova (Reference Daniels and Velikova2010), who generalize the earlier methods of Sill (Reference Sill1997), or by using specially designed networks, such as the lattice networks of You et al. (Reference You, Ding, Canini, Pfeifer and Gupta2017). In the finance literature, Kellner et al. (Reference Kellner, Nagl and Rösch2022) propose a method to ensure monotonicity of multiple quantiles output from a neural network, by adding a monotonicity constraint to multiple outputs from the network; this idea is similar to what we implement below. Another approach to enforcing monotonicity involves post-processing the outputs of machine learning models with a different algorithm, such as isotonic regression; see Wüthrich & Ziegel (Reference Wüthrich and Merz2023) for a recent application of this to ensure that outputs of general insurance pricing models are autocalibrated.
On the other hand, the machine and deep learning literature seemingly has not addressed the issue of ensuring that predictions made with these models vary smoothly, and, moreover, the methods proposed within the literature for monotonicity constraints cannot be directly applied to enforce smoothness constraints. Thus, the ICEnet proposal of this paper, which adds flexible penalties to a specially designed neural network, fills a gap in the literature by showing how both monotonicity and smoothness constraints can be enforced with the same method in deep learning models.
Structure of the manuscript. The rest of the manuscript is structured as follows. Section 2 provides notation and discusses neural networks and machine learning interpretability. Section 3 defines the ICEnet, which is applied in a simulation study in Section 4 and to a French Motor Third Party Liability data in Section 5. A local approximation to the ICEnet is presented in Section 6. Discussion of the results and conclusions are given in Section 7. The supplementary provides the code and further results and numerical analysis of the ICEnet.
2. Neural networks and individual conditional expectations
We begin by briefly introducing supervised learning with neural networks, expand these definitions to FCNs using embedding layers, and discuss their training process. With these building blocks, we then present the ICEnet proposal in the next section.
2.1 Supervised learning and neural networks
We work in the usual setup of supervised learning. Independent observations
 $y_n \in{\mathbb{R}}$
of a variable of interest have been made for instances (insurance policies)
 $1 \le n \le N$
. In addition, covariates
 ${\boldsymbol{x}}_n$
have been collected for all instances
 $1\le n \le N$
. These covariates can be used to create predictions
 $\widehat{y}_n \in{\mathbb{R}}$
of the variable of interest. In what follows, note that we drop the subscript from
 ${\boldsymbol{x}}_n$
for notational convenience. The covariates in
 $\boldsymbol{x}$
are usually of two main types in actuarial tasks: the first of these are real-valued covariates
 ${\boldsymbol{x}}^{[r]} \in{\mathbb{R}}^{q_r}$
, where the superscript
 $[\cdot ]$
represents the subset of the vector
 $\boldsymbol{x}$
,
 $r$
is the set of real-valued covariates and where there are
 $q_r$
real-valued variables. The second type of covariates are categorical, which we assume to have been encoded as positive integers; we represent these as
 ${\boldsymbol{x}}^{[c]} \in{\mathbb N}^{q_c}$
, where the set of categorical covariates is
 $c$
. Thus,
 ${\boldsymbol{x}} = ({\boldsymbol{x}}^{[r]},{\boldsymbol{x}}^{[c]})$
. In actuarial applications, often predictions are proportional to a scalar unit of exposure
 $v_n \in{\mathbb{R}}^+$
, thus, each observation is a tensor
 $(y,{\boldsymbol{x}}^{[r]},{\boldsymbol{x}}^{[c]}, v) \in{\mathbb{R}} \times{\mathbb{R}}^{q_r} \times{\mathbb N}^{q_c} \times{\mathbb{R}}^+$
.
In this work, we will use deep neural networks, which are efficient function approximators, for predicting
 $y$
. We represent the general class of neural networks as
 $\Psi _W({\boldsymbol{x}})$
, where
 $W$
are the network parameters (weights and biases). Using these, we aim to study the regression function
 \begin{equation*} \Psi _W \;:\; {\mathbb {R}}^{q_r} \times {\mathbb N}^{q_c} \to {\mathbb {R}}, \qquad {\boldsymbol{x}} \, \mapsto \, \widehat {y} = \Psi _W({\boldsymbol{x}})\,v. \end{equation*}
We follow Chapter 7 of Wüthrich & Merz (Reference Wüthrich and Merz2023) for the notation defining neural networks. Neural networks are machine learning models constructed by composing non-linear functions (called layers) operating on the vector
 $\boldsymbol{x}$
, which is the input to the network. A network consisting of only a single layer of non-linear functions has depth
 $d=1$
and is called a shallow network. More complex networks consisting of multiple layers with depth
 $d \ge 2$
are called deep networks. We denote the
 $i$
-th layer by
 $\boldsymbol{z}^{(i)}$
. These non-linear functions (layers) transform the input variables
 $\boldsymbol{x}$
into new representations, which are optimized to perform well on the supervised learning task, using a process called representation learning. Representation learning can be denoted as the composition
 \begin{equation*} {\boldsymbol{x}}\, \mapsto \, \boldsymbol{z}^{(d:1)}({\boldsymbol{x}})\, \stackrel {{\mathsf {def}}}{=}\, \left (\boldsymbol{z}^{(d)} \circ \dots \circ \boldsymbol{z}^{(1)} \right )({\boldsymbol{x}}) \, \in \, {\mathbb {R}}^{q_d}, \end{equation*}
where
 $d \in{\mathbb N}$
is the number of layers
 $\boldsymbol{z}^{(i)}$
of the network and
 $q_i \in{\mathbb N}$
are the dimensions of these layers for
 $1\le i \le d$
. Thus, each layer
 $\boldsymbol{z}^{(i)}\; :\; {\mathbb{R}}^{q_{i-1}} \to{\mathbb{R}}^{q_i}$
transforms the representation at the previous stage to a new, modified representation.
FCNs define the
 $j$
-th component (called neuron or unit) of each layer
 $\boldsymbol{z}^{(i)}$
,
 $1\le j \le q_i$
, as the mapping
 \begin{equation} \boldsymbol{z}=(z_1,\ldots, z_{q_{i-1}})^\top \in{\mathbb{R}}^{q_{i-1}} \quad \mapsto \quad z^{(i)}_j(\boldsymbol{z}) = \phi \left (\sum _{k = 1}^{q_{i-1}} w^{(i)}_{j,k} z_k + b^{(i)}_j \right ), \end{equation}
for a non-linear activation function
 $\phi \;:\;{\mathbb{R}}\to{\mathbb{R}}$
, and where
 $z^{(i)}_j(\!\cdot\!)$
is the
 $j$
-th component of layer
 $\boldsymbol{z}^{(i)}(\!\cdot\!)$
,
 $w^{(i)}_{j,k}\in{\mathbb{R}}$
is the regression weight of this
 $j$
-th neuron connecting to the
 $k$
-th neuron of the previous layer,
 $z_k=z^{(i-1)}_k$
, and
 $b^{(i)}_j\in{\mathbb{R}}$
is the intercept or bias for the
 $j$
-th neuron in layer
 $\boldsymbol{z}^{(i)}$
. It can be seen from (2.1) that the neurons
 $z^{(i)}_j(\!\cdot\!)$
of a FCN connect to all of the neurons
 $z^{(i-1)}_k(\!\cdot\!)$
in the previous layer
 $\boldsymbol{z}^{(i-1)}$
through the weights
 $w^{(i)}_{j,k}$
, explaining the description of these networks as “fully connected.”
Combining these layers, a generic FCN regression function can be defined as follows
 \begin{equation} {\boldsymbol{x}} \, \mapsto \, \Psi _W({\boldsymbol{x}}) \, \stackrel{{\mathsf{def}}}{=}\, g^{-1} \left ( \sum _{k=1}^{q_d} w^{(d+1)}_k z_k^{(d:1)}({\boldsymbol{x}}) + b^{(d+1)}\right ), \end{equation}
where
 $g^{-1}(\!\cdot\!)$
is a suitably chosen inverse link function that transforms the outputs of the network to the scale of the observations
 $y$
. The notation
 $W$
in
 $\Psi _W({\boldsymbol{x}})$
indicates that we collect all the weights
 $w^{(i)}_{j,k}$
and biases
 $ b^{(i)}_j$
in
 $W$
, giving us a network parameter of dimension
 $(q_{d}+1) + \sum _{i=1}^d (q_{i-1}+1)q_i$
, where
 $q_0$
is the dimension of the input
 $\boldsymbol{x}$
.
For most supervised learning applications in actuarial work, a neural network of the form (2.1)–(2.2) is applied to the covariate
 $\boldsymbol{x}$
to create a single prediction
 $\widehat{y} = \Psi _W({\boldsymbol{x}})v$
. Below, we will define how the same network
 $\Psi _W(\!\cdot\!)$
can be applied to a vector of observations to produce multiple predictions, which will be used to constrain the network.
State-of-the-art neural network calibration is performed using a Stochastic Gradient Descent (SGD) algorithm, performed on mini-batches of observations. To calibrate the network, an appropriate loss function
 $L(\cdot, \cdot )$
must be selected. For general insurance pricing, the loss function is often the deviance loss function of an exponential family distribution, such as the Poisson distribution for frequency modeling or the Gamma distribution for severity modeling. For more details on the SGD procedure, we refer to Goodfellow et al. (Reference Goodfellow, Bengio and Courville2016), and for a detailed explanation of exponential family modeling for actuarial purposes, see Chapters 2 and 4 of Wüthrich & Merz (Reference Wüthrich and Merz2023).
2.2 Pre-processing covariates for FCNs
For the following, we assume that the
 $N$
instances of
 ${\boldsymbol{x}}_n$
,
 $1\le n \le N$
, have been collected into a matrix
 $X = [X^{[r]},X^{[c]}] \in{\mathbb{R}}^{N \times (q_r+q_c)}$
, where
 $X^{[\cdot ]}$
represents a subset of the columns of
 $X$
. Thus, to select the
 $j$
-th column of
 $X$
, we write
 $X^{[j]}$
and, furthermore, to represent the
 $n$
-th row of
 $X$
, we will write
 $X_n ={\boldsymbol{x}}_n$
. We also assume that all of the observations of
 $y_n$
have been collected into a vector
 $\boldsymbol{y}=(y_1,\ldots, y_N)^\top \in{\mathbb{R}}^N$
.
2.2.1 Categorical covariates
The types of categorical data comprising
 $X^{[c]}$
are usually either qualitative (nominal) data with no inherent ordering, such as type of motor vehicle, or ordinal data with an inherent ordering, such as bad-average-good driver. Different methods for pre-processing categorical data for use within machine learning methods have been developed, with one-hot encoding being a popular choice for traditional machine learning methods. Here, we focus on the categorical embedding technique (entity embedding) of Guo & Berkhahn (Reference Guo and Berkhahn2016); see Richman (Reference Richman2021) and Delong & Kozak (Reference Delong and Kozak2023) for a brief overview of other options and an introduction to embeddings. Assume that the
 $t$
-th categorical variable, corresponding to column
 $X^{[c_t]}$
, for
 $ 1 \leq t \leq q_c$
, can take one of
 $K_t \geq 2$
values in the set of levels
 $\{a^t_1, \dots, a^t_{K_t} \}$
. An embedding layer for this categorical variable maps each member of the set to a low-dimensional vector representation of dimension
 $b_t \lt K_t$
, i.e.,
 \begin{equation} {\boldsymbol{e}}\;:\; \{a^t_1, \dots, a^t_{K_t} \} \to{\mathbb{R}}^{b_t}, \qquad a^t_k \, \mapsto \,{\boldsymbol{e}}(a^t_k) \stackrel{{\mathsf{def}}}{=}{\boldsymbol{e}}^{t(k)}, \end{equation}
meaning to say that the
 $k$
-th level
 $a^t_k$
of the
 $t$
-th categorical variable receives a low-dimensional vector representation
 ${\boldsymbol{e}}^{t(k)}\in{\mathbb{R}}^{b_t}$
. When utilizing an embedding layer within a neural network, we calibrate the
 $K_tb_t$
parameters of the embedding layer as part of fitting the weights
 $W$
of the network
 $\Psi _W({\boldsymbol{x}})$
. Practically, when inputting a categorical covariate to a neural network, each level of the covariate is mapped to a unique natural number; thus, we have represented these covariates as
 ${\boldsymbol{x}}^{[c]} \in{\mathbb N}^{q_c}$
, and these representations are then embedded according to (2.3) which can be interpreted as an additional layer of the network; this is graphically illustrated in Fig. 7.9 of Wüthrich & Merz (Reference Wüthrich and Merz2023).
2.2.2 Numerical covariates
To enable the easy calibration of neural networks, numerical covariates must be scaled to be of similar magnitudes. In what follows, we will use the min-max normalization, where each raw numerical covariate
 $\dot{X}^{[r_t]}$
is scaled to
 \begin{equation*} X^{[r_t]} = \frac {\dot {X}^{[r_t]} - \min\!(\dot {X}^{[r_t]})}{\max\!(\dot {X}^{[r_t]}) - \min\!(\dot {X}^{[r_t]})}, \end{equation*}
where
 $\dot{X}^{[r_t]}$
is
 $t$
-th raw (i.e., unscaled) continuous covariate and the operation is performed for each element of column
 $\dot{X}^{[r_t]}$
of the matrix of raw continuous covariates,
 $\dot{X}^{[r]}$
.
We note that the continuous data comprising
 $\dot{X}^{[r]}$
can also easily be converted to ordinal data through binning, for example, by mapping each observed covariate in the data to one of the quantiles of that covariate. We do not consider this option for processing continuous variables in this work; however, we will use quantile binning to discretize the continuous covariates
 $X^{[r]}$
for the purpose of estimating the ICEnets used here.
2.3 Individual conditional expectations and partial dependence plots
Machine learning interpretability methods are used to explain how a machine learning model, such as a neural network, has estimated the relationship between the covariates
 $\boldsymbol{x}$
and the predictions
 $\widehat{y}$
; for an overview of these, see Biecek & Burzykowski (Reference Biecek and Burzykowski2021). Two related methods for interpreting machine learning models are the Partial Dependence Plot (PDP) of Friedman (Reference Friedman2001) and the Individual Conditional Expectations (ICE) method of Goldstein et al. (Reference Goldstein, Kapelner, Bleich and Pitkin2015). The ICE method estimates how the predictions
 $\widehat{y}_n$
for each instance
 $1 \leq n \leq N$
change as a single component of the covariates
 ${\boldsymbol{x}}_n$
is varied over its observed range of possible values, while holding all of the other components of
 ${\boldsymbol{x}}_n$
constant. The PDP method is simply the average over all of the individual ICE outputs of the instances
 $1\le n \le N$
. By inspecting the resultant ICE and PDP outputs, the relationship of the predictions with a single component of
 $\boldsymbol{x}$
can be observed; by performing the same process for each component of
 $\boldsymbol{x}$
, the relationships with all of the covariates can be shown.
To estimate the ICE for a neural network, we now consider the creation of pseudo-data that will be used to create the ICE output of the network. We consider one column of
 $X$
, denoted as
 $X^{[j]}$
,
 $1\le j \le q_r+q_c$
. If the selected column
 $X^{[j]}$
is categorical, then, as above, the range of values which can be taken by each element of
 $X^{[j]}$
are simply the values in the set of levels
 $\{a^j_1, \dots, a^j_{K_j} \}$
. If the selected column
 $X^{[j]}$
is continuous, then we assume that a range of values for the column has been selected using quantile binning or another procedure, and we denote the set of these values using the same notation, i.e.,
 $\{a^j_1, \dots, a^j_{K_j} \}$
, where
 $K_j\in{\mathbb N}$
is the number of selected values
 $a_u^j \in{\mathbb{R}}$
, and where we typically assume that the continuous variables in
 $\{a^j_1, \dots, a^j_{K_j} \}$
are ordered in increasing order.
We define
 $\tilde{X}^{[j]}(u)$
as a copy of
 $X$
, where all of the components of
 $X$
remain the same, except for the
 $j$
-th column of
 $X$
, which is set to the
 $u$
-th value of the set
 $\{a^j_1, \dots, a^j_{K_j} \}$
,
 $1 \leq u \leq K_j$
. By sequentially creating predictions using a (calibrated) neural network applied to the pseudo-data,
 $\Psi _W(\tilde{X}^{[j]}(u))$
(where the network is applied in a row-wise manner), we are able to derive the ICE outputs for each variable of interest, as we vary the value of
 $1\le u \le K_j$
. In particular, by allowing
 $a_u^j$
to take each value in the set
 $\{a^j_1, \dots, a^j_{K_j} \}$
, for each instance
 $1\le n \le N$
separately, we define the ICE for covariate
 $j$
as a vector of predictions on the artificial data,
 $\widetilde{\boldsymbol{y}}^{[j]}_n$
, as
 \begin{equation} \widetilde{\boldsymbol{y}}^{[j]}_n = \left [\Psi _W(\tilde{{\boldsymbol{x}}}_n^{[j]}(1))v_n, \ldots, \Psi _W(\tilde{{\boldsymbol{x}}}_n^{[j]}(K_j))v_n \right ], \end{equation}
where
 $\tilde{{\boldsymbol{x}}}_n^{[j]}(u)$
represents the vector of covariates of instance
 $n$
, where the
 $j$
-th entry has been set equal to the
 $u$
-th value
 $a_u^j$
of that covariate, which is contained in the corresponding set
 $\{a^j_1, \dots, a^j_{K_j} \}$
.
The PDP can then be derived from (2.4) by averaging the ICE outputs over all instances. We set
 \begin{equation} \widehat{{\mathbb{E}}}[\widetilde{\boldsymbol{y}}^{[j]}_n] = \left [\frac{\sum _{n = 1}^{N}{\Psi _W(\tilde{{\boldsymbol{x}}}_n^{[j]}(1))v_n}}{N}, \ldots, \frac{\sum _{n = 1}^{N}{\Psi _W(\tilde{{\boldsymbol{x}}}_n^{[j]}(K_j))v_n}}{N} \right ] \in{\mathbb{R}}^{K_j}. \end{equation}
This can be interpreted as an empirical average, averaging over all instances
 $1\le n \le N$
.
3. ICEnet
3.1 Description of the ICEnet
We start with a colloquial description of the ICEnet proposal before defining it rigorously. The main idea is to augment the observed data
 $(y_n,{\boldsymbol{x}}_n, v_n)_{n=1}^N$
with pseudo-data, so that output equivalent to that used for the ICE interpretability technique (2.4) is produced by the network, for each variable that requires a smoothness or monotonicity constraint. This is done by creating pseudo-data that varies for each possible value of the variables to be constrained. For continuous variables, we use quantiles of the observed values of the continuous variables to produce the ICE output while, for categorical variables, we use each level of the categories. The same neural network is then applied to the observed data, as well as each of the pseudo-data. Applying the network to the actual observed data produces a prediction that can be used for pricing, whereas applying the network to each of the pseudo-data produces outputs which vary with each of the covariates which need smoothing or require monotonicity to be enforced. The parameters of the network are trained (or fine-tuned) using a compound loss function: the first component of the loss function measures how well the network predicts the observations
 $y_n$
,
 $1\le n \le N$
. The other components ensure that the desired constraints are enforced on the ICEs for the constrained variables. After training, the progression of predictions of the neural network will be smooth or monotonically increasing with changes in the constrained variables. A diagram of the ICEnet is shown in Fig. 1.
Diagram explaining the ICEnet. The same neural network
 $\Psi _W$
is used to produce both the predictions from the model, as well as to create predictions based on pseudo-data. These latter predictions are constrained, ensuring that the outputs of the ICEnet vary smoothly or monotonically with changes in the input variables
 $\boldsymbol{x}$
. In this graph, we are varying variable
 $x_1$
to produce the ICEnet outputs which are
 $\Psi _W(\tilde{{\boldsymbol{x}}}^{[1]}(\!\cdot\!))$
.

3.2 Definition of the ICEnet
To define the ICEnet, we assume that some of the variables comprising the covariates
 $X\in{\mathbb{R}}^{N\times (q_r+q_c)}$
have been selected as requiring smoothness and monotonicity constraints. We collect all those variables requiring smoothness constraints into a set
 $\mathcal{S}\subset \{1,\ldots, q_r+q_c\}$
with
 $S$
members of the set and those variables requiring monotonicity constraints into another set
 $\mathcal{M}\subset \{1,\ldots, q_r+q_c\}$
, with
 $M$
members of the set. As we have discussed above, we will rely on FCNs with appropriate pre-processing of the input data
 $\boldsymbol{x}$
for predicting the response
 $y$
with
 $\widehat{y}$
.
For each instance
 $n \in \{1, \ldots, N\}$
, the ICEnet is comprised of two main parts. The first of these is simply a prediction
 $\widehat{y}_n=\Psi _W({\boldsymbol{x}}_n)v_n$
of the outcome
 $y_n$
based on covariates
 ${\boldsymbol{x}}_n$
. For the second part of the ICEnet, we now will create the pseudo-data using the definitions from Section 2.3 that will be used to create the ICE output of the network for each of the columns requiring constraints. Finally, we assume that the ICEnet will be trained with a compound loss function
 $L$
, that balances the good predictive performance of the predictions
 $\widehat{y}_n$
together with satisfying constraints to enforce smoothness and monotonicity.
The compound loss function
 $L$
of the ICEnet consists of three summands, i.e.,
 $L = L_1 + L_2 + L_3$
. The first of these is set equal to the deviance loss function
 $L^D$
that is relevant for the considered regression problem, i.e.,
 $L_1 \stackrel{{\mathsf{set}}}{=} L^D(y_n, \widehat{y}_n)$
.
The second of these losses is a smoothing constraint applied to each covariate in the set
 $\mathcal{S}$
. For smoothing, actuaries have often used the Whittaker–Henderson smoother (Whittaker, Reference Whittaker1922; Henderson, Reference Henderson1924), which we implement here as the square of the third difference of the predictions
 $\widetilde{\boldsymbol{y}}^{[j]}_n$
given in (2.4). We define the difference operator of order 1 as
 \begin{equation*} \Delta ^1(\Psi _W(\tilde {{\boldsymbol{x}}}_n^{[j]}(u))) = \Psi _W(\tilde {{\boldsymbol{x}}}_n^{[j]}(u)) - \Psi _W(\tilde {{\boldsymbol{x}}}_n^{[j]}(u-1)), \end{equation*}
and the difference operator of a higher order
 $\tau \geq 1$
recursively as
 \begin{equation*} \Delta ^\tau (\Psi _W(\tilde {{\boldsymbol{x}}}_n^{[j]}(u))) = \Delta ^{\tau -1}(\Psi _W(\tilde {{\boldsymbol{x}}}_n^{[j]}(u))) - \Delta ^{\tau -1}(\Psi _W(\tilde {{\boldsymbol{x}}}_n^{[j]}(u-1))). \end{equation*}
Thus, the smoothing loss
 $L_2$
for order 3 is defined as
 \begin{equation} L_2(n) \,\stackrel{{\mathsf{def}}}{=}\, \sum _{j \in\mathcal{S}} \sum _{u=4}^{K_j} \lambda _{s_j}\left [\Delta ^3(\Psi _W(\tilde{{\boldsymbol{x}}}_n^{[j]}(u)))\right ]^2, \end{equation}
where
 $\lambda _{s_j}\ge 0$
is the penalty parameter for the smoothing loss for the
 $j$
-th member of the set
 $\mathcal{S}$
.
Finally, to enforce monotonicity, we add the absolute value of the negative components of the first difference of
 $\widetilde{\boldsymbol{y}}^{[j]}_n$
to the loss, i.e., we define
 $L_3$
as:
 \begin{equation} L_3(n) \,\stackrel{{\mathsf{def}}}{=} \,\sum _{j \in\mathcal{M}} \sum _{u=2}^{K_j} \lambda _{m_j}\max \left [\delta _j\Delta ^1(\Psi _W(\tilde{{\boldsymbol{x}}}_n^{[j]}(u))),0\right ], \end{equation}
where
 $\lambda _{m_j}\ge 0$
is the penalty parameter for the smoothing loss for the
 $j$
-th member of the set
 $\mathcal{M}$
, and where
 $\delta _j = \pm 1$
depending on whether we want to have a monotone increase (
 $-1$
) or decrease (
 $+1$
) in the
 $j$
-the variable of
 $\mathcal{S}$
.
Assumption 3.1 (ICEnet architecture). Assume we have independent responses and covariates
 $(y_n,{\boldsymbol{x}}_n^{[r]},{\boldsymbol{x}}_n^{[c]}, v_n)_{n=1}^N$
as defined in Section 2.1, and we have selected some covariates requiring constraints into sets
 $\mathcal{S}$
and
 $\mathcal{M}$
. Assume we have a neural network architecture
 $\Psi _W$
as defined in (2.2) having network weights
 $W$
. For the prediction part of the ICEnet, we use the following mapping provided by the network
 \begin{equation*} {\boldsymbol{x}}_n \, \mapsto \, \widehat {y}_n = \Psi _W({\boldsymbol{x}}_n)v_n, \end{equation*}
which produces the predictions required for the regression task. In addition, the ICEnet also produces the following predictions made with the same network on pseudo-data defined by
 \begin{equation} \tilde{{\boldsymbol{x}}}_n \, \mapsto \, \left [\widetilde{\boldsymbol{y}}_n^{[s_1]}, \ldots, \widetilde{\boldsymbol{y}}_n^{[s_S]}, \widetilde{\boldsymbol{y}}_n^{[m_1]}, \ldots, \widetilde{\boldsymbol{y}}_n^{[m_M]} \right ], \end{equation}
where all definitions are the same as those defined in Section 2.3 for
 $s_l \in\mathcal{S}$
and
 $m_l \in\mathcal{M}$
, respectively. Finally, to train the ICEnet, we assume that a compound loss function, applied to each observation
 $n \in \{1,\ldots, N\}$
individually, is specified as follows
 \begin{equation} L(n) \,\stackrel{{\mathsf{def}}}{=} \, L^D(y_n, \widehat{y}_n) + L_2(n) + L_3(n), \end{equation}
for smoothing loss
 $L_2(n)$
and monotonicity loss
 $L_3(n)$
given in (3.1) and (3.2), respectively, and for non-negative penalty parameters collected into a vector
 $\boldsymbol{\lambda } = (\lambda _{s_1}, \ldots,\lambda _{s_S}, \lambda _{m_1}, \ldots,\lambda _{m_M})^\top$
.
We briefly remark on the ICEnet architecture given in Assumptions 3.1.
Remark 3.2.
-
To produce the ICE outputs from the network under Assumptions 3.1, we apply the same network
 $\Psi _W(\!\cdot\!)$
multiple times to pseudo-data that have been modified to vary for each value that a particular variable can take, see (3.3). Applying the same network multiple times is called a point-wise neural network in Vaswani et al. (Reference Vaswani, Shazeer, Parmar, Uszkoreit, Jones, Gomez, Kaiser and Polosukhin2017), and it is called a time-distributed network in the Keras package; see Chollet et al. (Reference Chollet and Allaire2017). This application of the same network multiple times is also called a one-dimensional convolutional neural network.
-
Common actuarial practice when fitting general insurance pricing models is to consider PDPs to understand the structure of the fitted coefficients of a GLM and smooth these manually. Since we cannot smooth the neural network parameters
$W$
directly, we have rather enforced constraints (3.1) for the ICE produced by the network
$\Psi _W(\!\cdot\!)$
; this in particular applies if we smooth ordered categorical variables. -
Enforcing the same constraints as those in (3.4) in a GLM will automatically smooth/constrain the GLM coefficients similar to LASSO and fused LASSO regularizations; we refer to Hastie et al. (Reference Hastie, Tibshirani and Wainwright2015). We also mention that similar ideas have been used in enforcing monotonicity in multiple quantile estimation; see Kellner et al. (Reference Kellner, Nagl and Rösch2022).
-
Since the PDP of a model is nothing more than the average over the ICE outputs of the model for each instance
$n$
, enforcing the constraints for each instance also enforces the constraints on the PDP. Moreover, the constraints in (3.4) could be applied in a slightly different manner, by first estimating a PDP using (2.5) for all of the observations in a batch and then applying the constraints to the estimated PDP. -
We have used a relatively simple neural network within the ICEnet; of course, more complex network architectures could be used.
-
It is important to note that using the ICEnet method does not guarantee smoothness or monotonicity if the values of the penalties
$\boldsymbol{\lambda }$
are not chosen appropriately.


3.3 Selecting the value of the penalty parameters
To apply the ICEnet, it is important to choose the penalty parameters in
 $\boldsymbol{\lambda }$
appropriately. When applying penalized regression in a machine learning context, cross-validation or an independent validation set is often used to select parameters that are expected to minimize out-of-sample prediction errors. Following this approach, one can select the values within
 $\boldsymbol{\lambda }$
so as to minimize the prediction error on a validation set; see Section 5.4 for choosing the values of the penalty parameters using this approach, where a search over a validation set was used to select a single optimal value for all components of
 $\boldsymbol{\lambda }$
. More complex procedures to select optimal values of these penalties could also be considered; we mention here Bayesian optimization, which has been applied successfully to select optimal hyper-parameters for machine learning algorithms and which could be applied similarly here, see, for example Bergstra et al. (Reference Bergstra, Bardenet, Bengio and Kégl2011).
On the other hand, within actuarial practice, when applying smoothing, often the extent of the smoothing is chosen using judgment to meet the actuary’s subjective expectations of, for example, how smooth the outputs of a GLM should be w.r.t a certain covariate. Similarly, the penalty coefficient of the Whittaker–Henderson smoother is often chosen subjectively by inspecting the graduated mortality rates and modifying the penalty until these are deemed appropriate. A more subjective approach may be especially important when commercial or regulatory considerations need to be taken into account, i.e., since these are hard to quantify numerically. In these cases, to select the values of the penalty parameters, PDP and ICE plots can be used to determine whether the outputs of the network are suitably smooth and monotonic. For examples of these plots, see Section 5.3 and the appendix. We emphasize that considering these across many different sample insurance policies is important to ensure that the constraints have produced suitable results. This can be done by evaluating the smoothness and monotonicity of, for example, the ICE outputs across many sample policies (see Fig. 10 for an example). In conclusion, we have found that a combination of analytical and subjective approaches supported by graphical aids to selecting the penalty parameters
 $\boldsymbol{\lambda }$
works well.
The relative importance of the smoothness and monotonicity components of the ICEnet loss (3.4) will be determined by the choices of each individual penalty parameter in
 $\boldsymbol{\lambda }$
. To modify the importance given to each of these components, the ICEnet loss could be modified to
 $L^{mod}(n) \,\stackrel{{\mathsf{def}}}{=} \,L^D(y_n, \widehat{y}_n) + a_1\, L_2(n) + a_2\, L_3(n)$
with weights
 $a_1\gt 0$
and
 $a_2\gt 0$
selected either through user judgment or using a validation set, as mentioned above.
Connected to this, we note that selecting values of the smoothness and monotonicity constraints that produce values of the constraint losses
 $L_2(n)$
and
 $L_3(n)$
that are small relative to the prediction error component of (3.4),
 $L^D(y_n, \widehat{y}_n)$
, will mean that the predictions from the ICEnet will likely not be suitably smooth and monotonic. In other words, to strictly enforce the constraints, it is usually necessary to ensure that the values in
 $\boldsymbol{\lambda }$
are large enough such that the constraint losses
 $L_2(n)$
and
 $L_3(n)$
are comparably large relative to the prediction error component. For extremely large values of a smoothing or monotonicity component of
 $\boldsymbol{\lambda }$
, i.e., as
 $\lambda _i \to \infty$
for the
 $i$
-th element of
 $\boldsymbol{\lambda }$
, we would expect that the predictions of the network w.r.t. the
 $i$
-th constrained variable will be either constant or strictly monotonic. We verify this last point in Section 5.4.
3.4 Time complexity analysis of the ICEnet
Relative to training and making predictions with a baseline neural network architecture
 $\Psi _W$
for a dataset, the introduction of pseudo-data and constraints in the ICEnet will increase the time complexity of training and evaluating the ICEnet algorithm. We briefly note some of the main considerations when considering the computational costs of training a network using a naive implementation (without parallel processing) of the ICEnet algorithm. For each variable
 $s \in \mathcal{S}$
and
 $m \in \mathcal{M}$
, the ICEnet will evaluate the FCN
 $\Psi _W$
on the pseudo-data. The time complexity associated with these operations is linear both with respect to the number of different levels in the pseudo-data chosen for each variable and with respect to the number of variables in both of the sets
 $\mathcal{S}$
and
 $\mathcal{M}$
. The smoothing loss computation (3.1), involving third differences, will scale linearly as levels of each variable are added and also will scale linearly for each variable in
 $\mathcal{S}$
; this is similar for the monotonic loss computation (3.2). Thus, the addition of constraints in ICEnet imposes an additive linear complexity relative to the baseline neural network
 $\Psi _W$
, contingent on the number of variables in
 $\mathcal{S}$
and
 $\mathcal{M}$
and the number of levels used within the pseudo-data used for enforcing these constraints. On the other hand, when considering making predictions with a network trained using the ICEnet algorithm, we remark that once the ICEnet has been trained, there is no need to evaluate the FCN
 $\Psi _W$
on the pseudo-data. Thus, the time complexity will be the same as the baseline network architecture.
A highly important consideration, though, is that modern deep learning frameworks allow neural networks to be trained while utilizing the parallel processing capabilities of graphical processing units (GPUs). This means that the actual time taken to perform the calculations needed for training the ICEnet will be significantly lower than the theoretical analysis above. We verify this point in the sections that follow, for example, by showing the time taken to train the ICEnet scales in a sub-linear manner with the amount of pseudo-data used when training the ICEnet.
4. Simulation study of the ICEnet
4.1 Introduction
We now study the application of the ICEnet to a simulated example to verify that the proposal works as intended. Eight continuous covariates were simulated from a multivariate normal distribution, on the assumption that the covariates were uncorrelated, except for the second and eighth of these, which were simulated assuming a correlation coefficient of
 $0.5$
. The covariates are represented as
 ${\boldsymbol{x}} \in{\mathbb{R}}^8$
. The mean of the response,
 $\mu$
, is a complex function of the first six of these covariates, i.e., the last two covariates are not actually used directly in the model. Finally, responses
 $y$
were then simulated from a normal distribution with mean
 $\mu$
and a standard deviation of
 $1$
. The mean response
 $\mu$
is defined as:
 \begin{equation} \mu = \frac{x_1}{2} - \frac{{x_2}^2}{4} + \frac{|x_3| \sin\!(2x_3)}{2} + \frac{x_4 \, x_5}{2} + \frac{{x_5}^2 \, x_6}{8}. \end{equation}
Since the true relationships between the covariates and the responses are known, we do not perform an exploratory analysis here but rather show the PDPs estimated by applying Equation (4.1). PDPs for each of the covariates in
 $\boldsymbol{x}$
are shown in Fig. 2. The PDPs for covariates
 $x_4$
,
 $x_5$
, and
 $x_6$
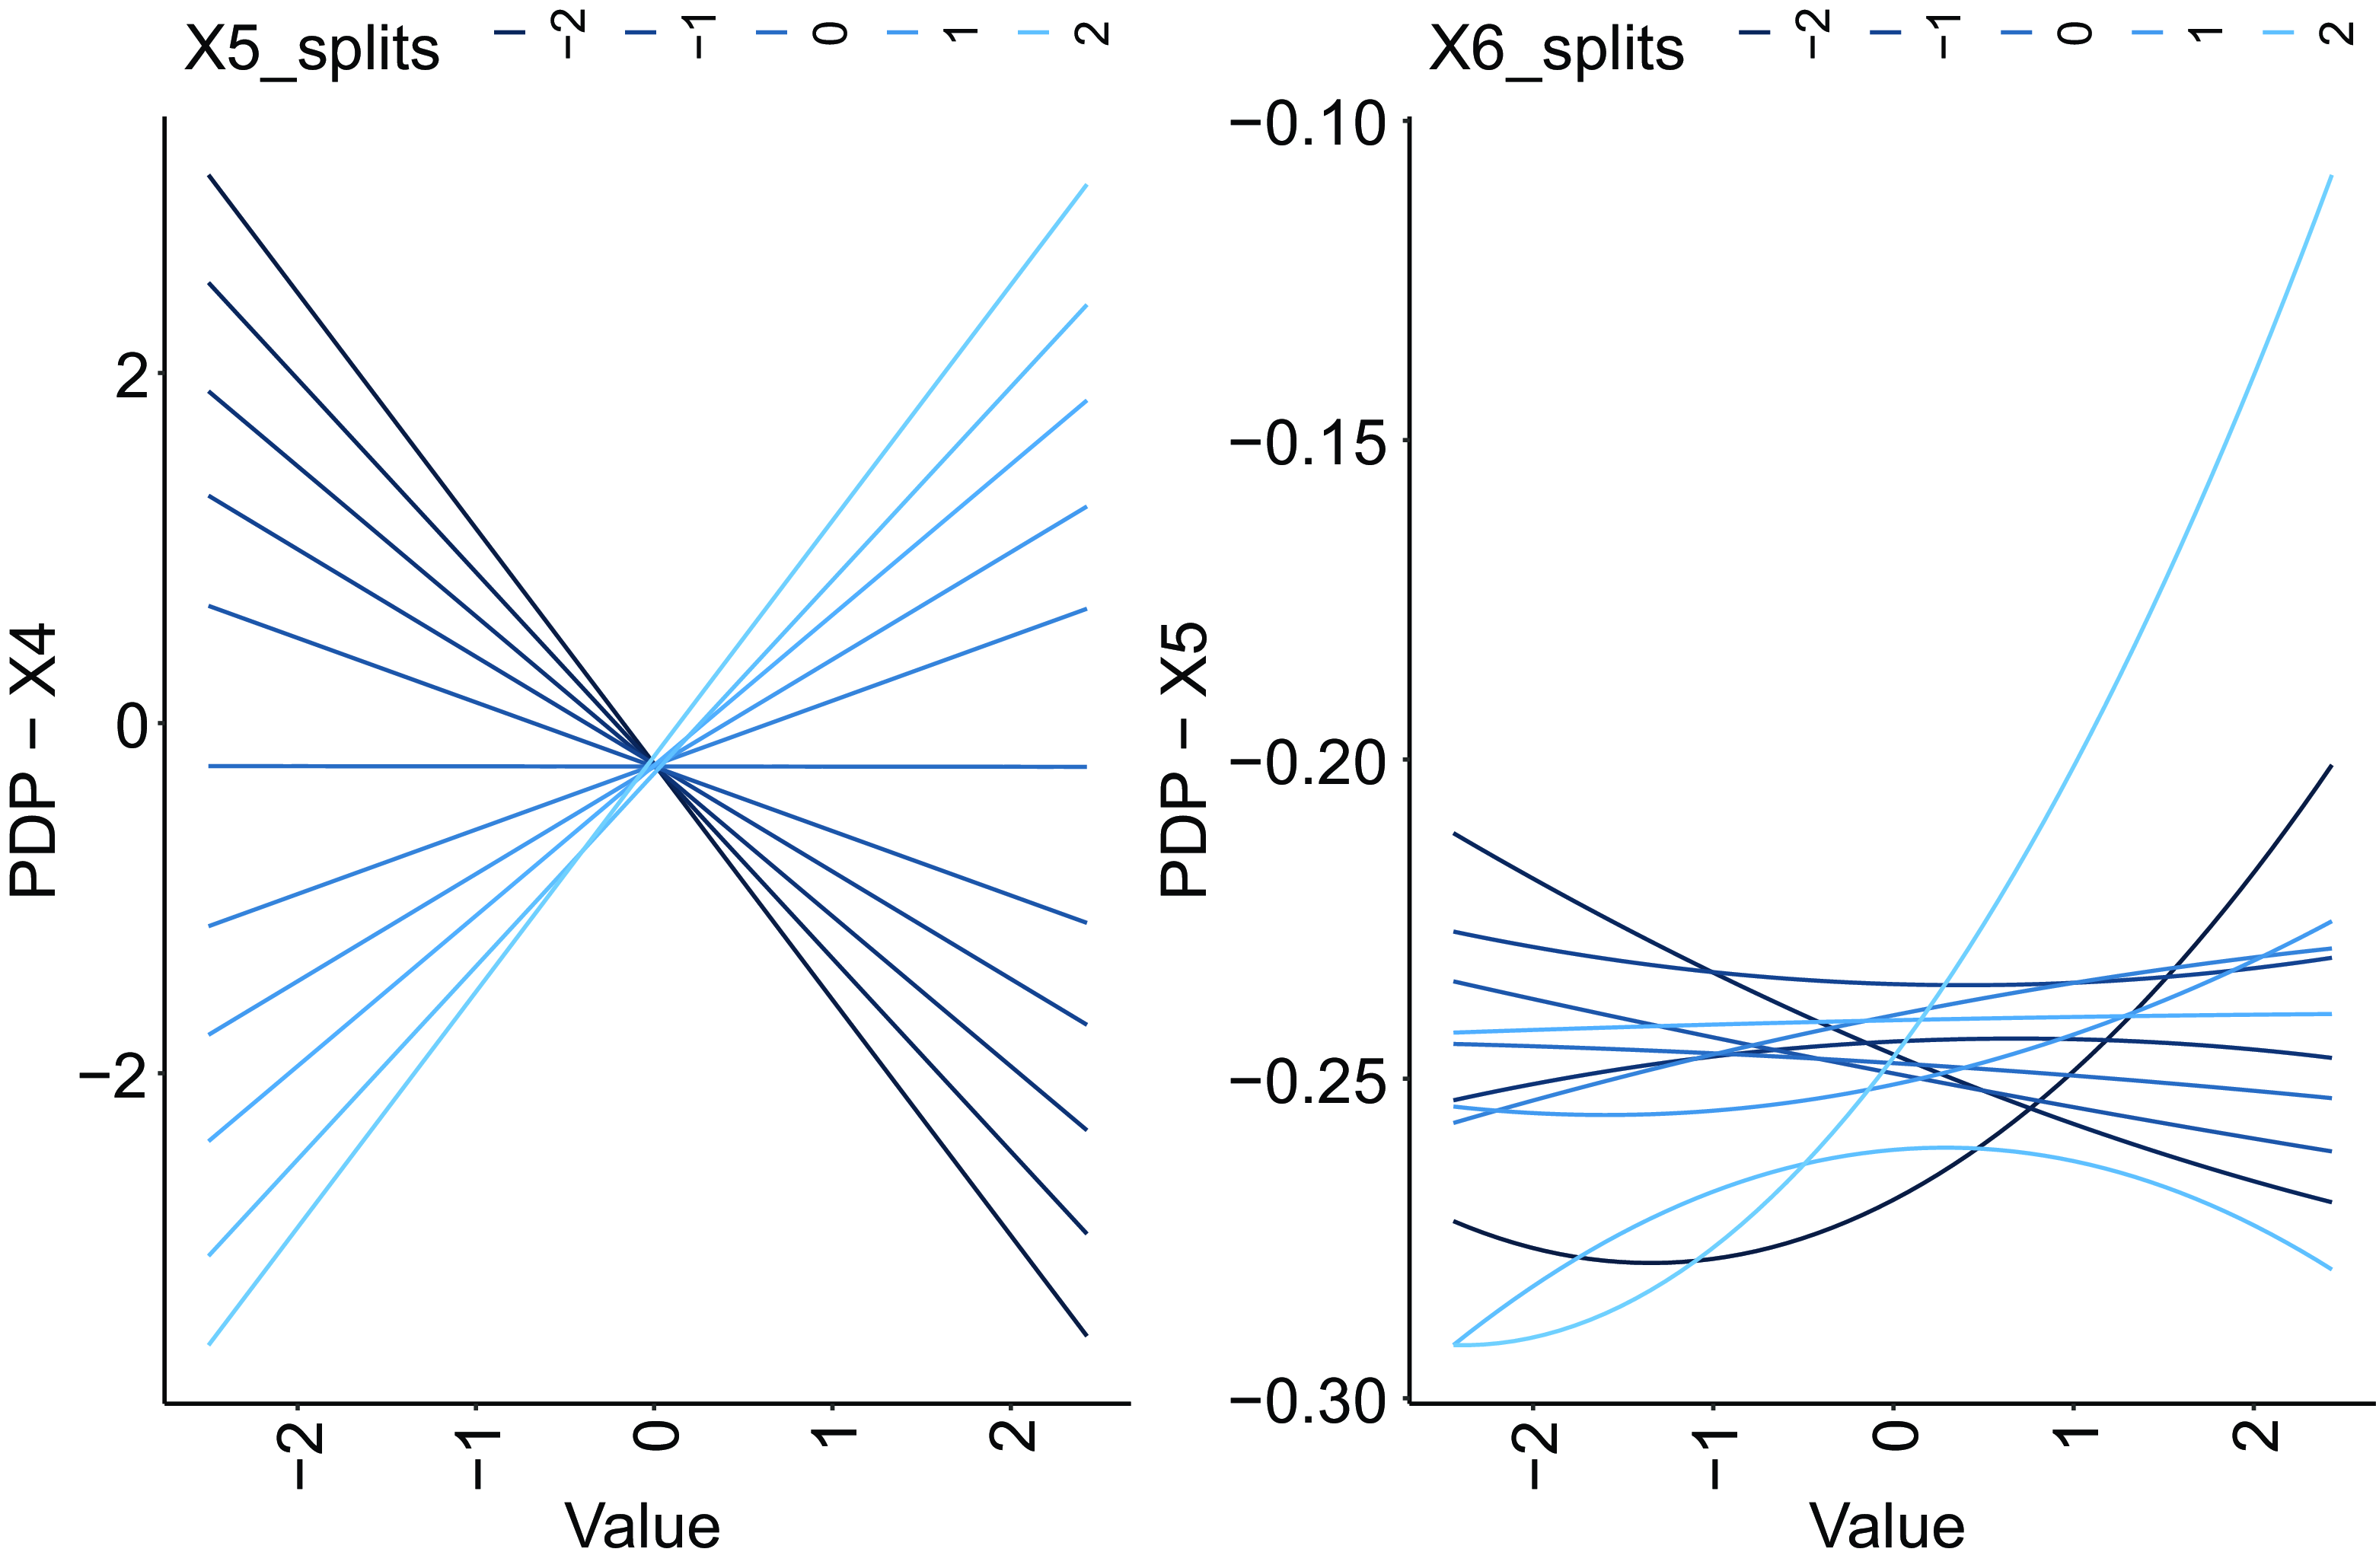
do not capture the correct complexity of the effects for these covariates, since these only enter the response as interactions; thus, two-dimensional PDPs estimated to show the interactions correctly are shown in Fig. 3, which shows that a wide range of different relationships between the covariates and the responses are produced by the interactions in (4.1). Finally, we note that the PDPs for covariates
 $x_7$
and
 $x_8$
are flat, since these variables do not enter from the simulated response directly, which is as expected.
PDPs for each of the components in
 $\boldsymbol{x}$
.

Two-dimensional PDPs for covariates
 $x_4$
and
 $x_5$
(left panel, with
 $x_4$
as the main variable) and
 $x_5$
and
 $x_6$
(right panel, with
 $x_5$
as the main variable). The color of the lines varies by the value of the covariate with which the first variable interacts.
The simulated data were split into training and testing sets (in a 9:1 ratio) for the analysis that follows.
4.2 Fitting the ICEnet to simulated data
We select a simple
 $d=3$
layer neural network for the FCN component of the ICEnet, with the following layer dimensions
 $(q_1 = 32, q_2 = 16, q_3 = 8)$
and set the activation function
 $\phi (\!\cdot\!)$
to the rectified linear unit (ReLU) function. The link function
 $g(\!\cdot\!)$
was set to the identity function, i.e., no output transformations were applied when fitting the network to the simulated data. To regularize the network using early-stopping, the training set was split once again into a new training set
 $\mathcal{L}$
, containing 95% of the original training set, and a relatively small validation set
 $\mathcal{V}$
, containing 5% of the original training set. No transformations of the input data were necessary for this relatively simple simulated data.
The FCN was trained for a single training run using the Adam optimizer for 100 epochs, with a learning rate of
 $0.001$
and a batch size of
 $1024$
observations. The network training was early stopped by selecting the epoch with the best out-of-sample score on the validation set
 $\mathcal{V}$
. The mean squared error (MSE) was used for training the network, and, in what follows, we assign the MSE as the first component of the loss function (3.4). The ICEnet was trained in the same manner as the FCN, with the additional smoothing and monotonicity loss components of (3.4) added to the MSE loss. The values of the penalty parameters were chosen as shown in Table 1. To create the ICE outputs on which the smoothing and monotonicity losses are estimated, the empirical percentiles of the covariates in
 $\boldsymbol{x}$
were estimated and these were used as the pseudo-data for the ICEnet. Thus, the ICEnet applies the FCN
 $\Psi _W$
 $801$
times for each record in the training data (once to estimate predictions and another
 $800$
times for the
 $8$
variables times the
 $100$
percentiles).
Smoothing and monotonicity constraints applied within the ICEnet for the simulated data

The FCN and the ICEnet were fit using the Keras in the R programming language; for the Keras package see Chollet et al. (Reference Chollet and Allaire2017). Training the FCN took about 1.5 minutes and training the ICEnet took about 6 minutes.Footnote 1 Since the ICEnet requires many outputs to be produced for each input to the network – in this case,
 $800$
extra outputs – the computational burden of fitting this model is quite heavy (as shown by the time taken to fit the model). Nonetheless, this can be done easily using a graphics processing unit (GPU) and the relevant GPU-optimized versions of deep learning software. As mentioned above in Section 3.4, due to the parallel processing capabilities of a GPU, the time taken to perform the ICEnet calculations does not scale linearly with the number of variables and the amount of pseudo-data.
The FCN and ICEnet results are on Lines 1-2 of Table 2, showing the results of the single training run.
MSE loss for the FCN and the ICEnet, training, and testing losses
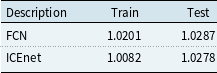
The results show that the ICEnet (with the penalty parameters set to the values in Table 1) performs slightly better than the FCN on both the training and testing sets; we do not attempt to optimize this further.
We now briefly show whether the ICEnet has performed as we would expect, by first considering the global effect of applying the ICEnet constraints. In Fig. 4 we show the PDPs derived from the FCN and ICEnet models, where the PDPs are shown with red lines are the true PDPs derived using Equation (4.1) directly (i.e., these are the same as those in Fig. 2), with green lines for the FCN and with blue lines for the ICEnet.
PDPs for each of the variables in
 $\boldsymbol{x}$
, test set only. Red lines are the true PDPs from Equation (4.1), green lines are PDPs from the FCN (unsmoothed) and blue lines are PDPs from the ICEnet (smoothed). Note that the scale of the
 $y$
-axis varies between each panel.
 $x$
-axis shows ordinal values of the pseudo-data on which the PDP is evaluated.

ICE plots of the output of the FCN and the ICEnet for
 $3$
instances in the test set chosen to be the least monotonic based on the monotonicity score evaluated for each instance in the test set on the outputs of the FCN. Note that the smoothed model is the ICEnet and unsmoothed model is the FCN.
 $x$
-axis shows ordinal values of the pseudo-data on which the ICE is evaluated.

ICE plots of the output of the FCN and the ICEnet for instance
 $1240$
in the test set among the least smooth based on the smoothness score evaluated for each instance in the test set on the outputs of the FCN. Note that the smoothed model is the ICEnet and unsmoothed model is the FCN.
 $x$
-axis shows ordinal values of the pseudo-data on which the ICE is evaluated.

For some of the variables, it can be seen that all of the PDPs are quite similar; nonetheless, the PDPs from the ICEnet are significantly smoother and less jagged than those from the FCN at the most extreme values of each of the variables, and, in some cases, match the true PDPs better. It can be observed that for variable
 $x_7$
– which does not enter the model at all – both the FCN and the ICEnet estimate a PDP that is not flat, i.e., variable selection ideally needs to be performed before applying the ICEnet.
We now show some examples of the effect of the constraints on individual observations. Figs. 5 and 6 show ICE plots for several instances within the test set, which have been specially chosen as those that are the least monotonic and smooth instances. This choice was based on the monotonicity and smoothness scores evaluated for each observation in the test set on the outputs of the FCN only (see more detail on this in Section 5). These figures show that, in general, the ICE plots of predictions from the ICEnet conform to the constraints added within the ICEnet. In Fig. 5, the predictions from the ICEnet on
 $3$
different instances preserve monotonicity across the range of covariate
 $x_1$
, whereas those from the FCN do not.
In Fig. 6, we have selected a single instance from the training set. In this case, the predictions from the ICEnet are significantly smoother for all of the covariates in
 $\boldsymbol{x}$
.
4.3 Experimenting with the ICEnet
Here, we discuss two experiments performed on the synthetic dataset. First, to assess the scalability of the ICEnet proposal, we increase the pseudo-data volume by a factor of two during the ICEnet fitting process. This is achieved by evaluating equally spaced quantiles, each representing 0.5% of the empirically observed range of each variable in
 $\boldsymbol{x}$
, and then refitting the ICEnet using the same assumptions as before. Thus, the FCN component of the ICEnet,
 $\Psi _W$
, is evaluated
 $1601$
times for each record. In this case, it takes about 9 minutes to fit the ICEnet, which is approximately a 50% increase on the previous fitting time, i.e., the increase in processing time is sub-linear. We conclude that, although more experimentation would be helpful, nonetheless large amounts of pseudo-data can easily be accommodated when fitting the ICEnet using a GPU.
Second, we assess what happens if a significant monotonicity constraint is applied to a variable where the assumption of monotonicity is not supported by the relationships within the data. For this purpose, we select
 $x_3$
and set the value of the monotonicity constraint (arbitrarily) to
 $100$
, which is a large value relative to the MSE loss, and then, we refit the ICEnet. We evaluate the MSE on the training and testing sets using predictions from this modified ICEnet and show these results in Table 3. It can be observed that the ICEnet performs significantly worse due to this improperly applied constraint.
MSE loss for the FCN and the ICEnet, training, and testing losses, constraint for variable
 $x_3$
set to
 $100$

PDPs for variable
 $x_3$
, test set only. Blue lines are the PDP from the FCN (unsmoothed) and red line is the PDP from the modified ICEnet (smoothed). The constraint for variable
 $x_3$
was set to
 $100$
.
 $x$
-axis shows ordinal values of the pseudo-data on which the PDP is evaluated.

Moreover, in Fig. 7 we show the PDPs for variable
 $x_3$
produced by the original FCN and the modified ICEnet. The PDP shows that the modified ICEnet predictions are dramatically different from those of the original ICEnet and that, indeed, monotonicity has been achieved across the range of variable
 $x_3$
.
We draw some conclusions from this simulation study. First, the ICEnet performs as we would expect, by modifying predictions to be smoother and more monotonic than an unconstrained model. Second, due to the parallel processing capabilities of GPUs, it is possible both to use the ICEnet with significant amounts of pseudo-data, and increasing the amount of pseudo-data results only in a sub-linear increase in processing time. Finally, we conclude that the ICEnet constraints can be used to force a model to learn a monotonic relationship even if this is not supported by the data on which the model is fit.
5. Applying the ICEnet to non-life pricing
5.1 Introduction and exploratory analysis
In this section, we apply the ICEnet to a French Motor Third Party Liability (MTPL) dataset included in the CASdatasets package in the R language (Dutang & Charpentier, Reference Dutang and Charpentier2020), with the aim of predicting claims frequency. We follow the same data pre-processing, error correction steps, and splitting of the data into training and testing sets (in a 9:1 ratio), as those described in Appendix B of Wüthrich & Merz (Reference Wüthrich and Merz2023), to which we also refer for an exploratory data analysis of this dataset. Table 4 shows the volumes of data in each of the training and testing sets, illustrating that the observed claims rate is quite similar between the two sets.
The MTPL data contain both unordered and ordinal categorical covariates, as well as continuous covariates. To apply the ICEnet, we select all of the ordinal categorical and continuous covariates in the dataset for constraints; these are the Bonus-Malus, Density, Driver Age, Vehicle Age, and Vehicle Power fields. Fig. 8 shows the empirical claims frequency in the training set, considering each field in turn, i.e., this is a univariate (marginal) analysis. Note that for the continuous density variable, we are showing the frequency and exposure calculated at the percentiles of this variable. It can be seen that the empirical frequency varies with each variable somewhat erratically, especially in those parts of the domain of the variable when there is small exposure. In particular, for the bonus-malus and density variables, there is quite a significant vertical spread of empirical frequencies, indicating that the univariate analysis presented here may not suitably capture the relationships between the covariates and the response and that we need a more complex model to make predictions on this data.
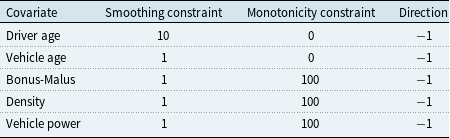
In what follows, we impose the following constraints on these variables. Smoothing constraints are applied to all five of the variables. Among these five smoothed variables, ensuring that smoothness is maintained for driver age, vehicle age, and bonus-malus will be the most important constraints needed in this model from a commercial perspective, since the values of these variables will likely be updated each year that a policy is in force. Since we expect that claims frequency will increase with increasing bonus-malus scores, density, and vehicle power, we also apply constraints to ensure that the model predicts monotonically increasing claims frequency for each of these variables. Table 5 shows these penalty parameters for each variable. These constraint values were selected heuristically by experimenting with different values until acceptably smooth and monotonic ICE outputs were produced, however, the impact on predictive performance was not considered when selecting these. Note that the table includes a direction column to show that we are enforcing monotonically increasing constraints to
 $\delta _j=-1$
; setting the direction parameter to
 $\delta _j=1$
would produce monotonically decreasing constraints (see Listing 1 in Appendix A). Of course, these parameters could also be selected to produce optimal predictive performance using, for example, an out-of-sample validation set, or
 $K$
-fold cross-validation.
Number of records, total exposure, and observed claims frequency in the French MTPL dataset, split into training and testing sets

Empirical claims frequency (top panel) and observed exposures (bottom panel) in the French MTPL dataset for each of the Bonus-Malus, Density, Driver Age, Vehicle Age and Vehicle Power covariates (univariate analysis only), training set only. Note that the
 $y$
-scales for each variable are not comparable.

We remark that the pseudo-data for the ICEnet are comprised of each observed level of the covariates, which are Bonus-Malus (
 $111$
levels), Density (
 $100$
percentiles), Driver Age (
 $83$
levels), Vehicle Age (
 $77$
levels), and Vehicle Power (
 $12$
levels). Thus, for each record in the MTPL dataset, the ICEnet evaluates the FCN
 $\Psi _w$
384 times. Put another way, we augment the
 $610,206$
observations in the training set with another
 $233,708,898$
pseudo-observations. Despite the large volume of pseudo-data, the ICEnet can easily be trained on a GPU.
5.2 Fitting the ICEnet
We select a
 $d=3$
layer neural network for the FCN component of the ICEnet, with the following layer dimensions
 $(q_1 = 32, q_2 = 16, q_3 = 8)$
and set the activation function
 $\phi (\!\cdot\!)$
to the Rectified Linear Unit (ReLU) function. The inverse link function
 $g(\!\cdot\!)$
was set to the exponential function (which gives the canonical link of the Poisson model). To perform early-stopping to regularize the network, we further split the training set into a new training set
 $\mathcal{L}$
, containing 95% of the original learning set, and a small validation set
 $\mathcal{V}$
, containing 5% of the original training set. We assign an embedding layer to each of the unordered categorical variables (Vehicle Gas, Vehicle Brand, Region, and Area Code) and, for simplicity, select the dimension of the real-valued embedding to be
 $b=5$
for each of these variables. For the rest of the variables, we apply min-max scaling (see Section 2.2) and then directly input these into the FCN; this explains how the vector of covariates
 $\boldsymbol{x}$
has been constructed.
Smoothing and monotonicity constraints applied within the ICEnet
Poisson deviance loss for the FCN and the ICEnet, training, and testing losses. For multiple runs, the average and standard deviation (in parentheses) are reported

For comparison with the ICEnet, we begin with training several simple FCNs for comparison; 10 training runs of these were performed. This was fit using the Adam optimizer for 50 epochs, using a learning rate of
 $0.001$
and a batch size of
 $1024$
observations. The network training was early stopped by selecting the epoch with the best out-of-sample score on the validation set
 $\mathcal{V}$
. To train this FCN network, we use only the deviance loss
 $L^D$
, i.e., the first component of the loss function (3.4). Since neural network training involves some randomness arising from the random initialization of the network weights
 $W$
and the random selection of training data to comprise each mini-batch, the results of each training run will vary in terms of predictive performance; furthermore the exact relationships learned between the covariates and the predictions will vary by training run. To provide an accurate evaluation of the performance of the FCNs and the ICEnet, we consider two metrics in the first two lines of Table 6: first, we show the average of the Poisson deviance loss and, in addition, we show the Poisson deviance loss produced using the nagging predictor of Richman & Wüthrich (Reference Richman and Wüthrich2020), which is the ensemble predictor produced by averaging over the outputs of several neural network training runs. In practice, a stable set of predictions from machine learning models, which are not affected by randomness in the training process are required for regulatory and risk management reasons. Thus, we evaluate the FCNs and the ICEnet proposal using the nagging predictor which stabilizes the predictions from neural network models as the number of training runs used increases; see Richman & Wüthrich (Reference Richman and Wüthrich2020) for more details. The standard deviation of the Poisson deviance loss across training runs is shown in the table in parentheses.
The ICEnet was then fit using the Keras in the R programming language.Footnote 2 The implementation of the ICEnet is explained in more detail in Appendix A in the supplementary material. Similar to the FCNs, 10 training runs of the ICEnet were performed. As already noted, since the ICEnet requires many outputs to be produced for each input to the network, the computational burden of fitting this model is quite heavy, nonetheless, this can be done using a Graphics Processing Unit (GPU) and the relevant GPU-optimized versions of deep learning software. The ICEnet results are on Lines 3-4 of Table 6, showing the average results and the nagging predictor, respectively. We note that training runs of the FCN and ICEnet take about 3 and 12 minutes to complete, respectively, the former running without a GPU and the latter running on a GPU.
It can be observed that adding smoothing and monotonicity constraints to the ICEnet has resulted in only marginally worse performance of the model on both the training and testing set, compared to the FCN results. Interestingly, although the FCN has a relatively large performance gap between the training and testing sets (both on average and when comparing the nagging predictor), the ICEnet has a smaller gap, implying that these constraints are regularizing the network, at least to some extent. Finally, while the nagging predictor improves the performance of both the FCN and the ICEnet, the performance improvement is somewhat larger for the former than the latter, which can be explained by the nagging predictor performing regularization over the different fitting runs. Although we favor using the Poisson deviance to measure the performance of the FCN and the ICEnet, since this metric is most appropriate for the count data which are being predicted, we also provide an evaluation of the performance of the networks using the MSE and the Mean Absolute Error (MAE) in Table 11 in Appendix B. The conclusions drawn here are equally appropriate when evaluating the FCN and the ICEnet using the MSE and the MAE criteria.
We approximately decompose the reduction in performance between the smoothness constraints on the one hand, and the monotonicity constraints on the other, by refitting the ICEnet with the smoothing constraints only, and then with the monotonicity constraints only. These results are shown in Table 7.
Poisson deviance loss for the ICEnet, training, and testing sets. For multiple runs, the average and standard deviation (in parentheses) are reported. Constraints are varied as described in the relevant column

PDPs for each of the Bonus-Malus, Density, Driver Age, Vehicle Age, and Vehicle Power fields shown in separate panels, test set only. Blue lines are PDPs from the FCNs (unsmoothed), and red lines are PDPs from the ICEnet (smoothed). Bold lines relate to the PDPs from the first of 10 runs; the lighter lines relate to the remaining runs. Note that the scale of the
 $y$
-axis varies between each panel.
 $x$
-axis shows ordinal values of the pseudo-data on which the PDP is evaluated.

Density plots of the difference between the monotonicity and smoothness components of the ICEnet loss function (3.4) (differences are shown on the
 $x$
-axis) evaluated for each observation in the test set.

ICE plots of the output of the FCN and the ICEnet for two instances chosen to be among the least monotonic based on the monotonicity score evaluated for each instance in the test set on the outputs of the FCN. Note that the smoothed model is the ICEnet and unsmoothed model is the FCN.
 $x$
-axis shows ordinal values of the pseudo-data on which the ICE is evaluated.

The results show that the smoothing constraints are the primary cause of the decline in performance of the ICEnet, compared with the FCN. The monotonicity constraints, on the other hand, improve the out-of-sample performance of the ICEnet to surpass the FCN, whether on average, or when using the nagging predictor. Furthermore, the small gap between the training and testing results for the ICEnet with monotonicity constraints only, shows that these successfully regularize the model. These results suggest that adding monotonicity constraints to actuarial deep learning models based on expert knowledge can lead to enhanced performance. Whether the somewhat decreased performance of a model that produces smoothed outputs is acceptable will depend on whether these constraints are necessary for commercial purposes. Moreover, the values of the penalty parameters could be (further) varied so that an acceptable tradeoff of smoothness and performance is achieved; for an example of this, see Section 5.4, below.
5.3 Exploring the ICEnet predictions
We start with considering the global impact of applying constraints within the ICEnet by considering the PDPs derived from the FCN and ICEnet models in each of the 10 training runs of these models. The ICE outputs were constrained when fitting the network by using loss function (3.4) applied to each of the observations in the training set. The PDPs are shown in Fig. 9 with blue lines for FCN and red lines for ICEnet.
The PDPs from the unconstrained FCNs models exhibit several undesirable characteristics: for the bonus-malus, density, and vehicle age covariates, these exhibit significant roughness which would translate into unacceptable changes in rates charged to policyholders as, for example, bonus-malus scores are updated, or as the policyholder’s vehicle ages. Also, in some parts of the PDPs, it can be observed that monotonicity has not been maintained by the FCNs. Finally, the PDPs for the driver age and vehicle power covariates exhibit different shapes over the different runs, meaning that the FCNs have learned different relationships between the covariates and the predictions. On the other hand, the PDPs from the ICEnets are significantly smoother for all of the variables and runs, appear to be monotonically increasing in all cases, and finally exhibit more similar shapes across the different runs. Interestingly, the relationships learned by the constrained ICEnets are quite different for the bonus-malus, vehicle age, and driver age variables than those learned by the FCN, with the PDPs of the ICEnet for the first two variables arguably more commercially reasonable than the those from the FCN.
We remark that, in particular, the smoothed PDP for the Bonus-Malus covariate takes a very different form than the unsmoothed PDP, i.e., it is much flatter. This is due to two main factors: first, the very jagged unsmoothed PDP increases almost vertically for the largest values of the covariate, which will lead to very large values of the smoothing loss (3.1). Second, there is relatively little data at the largest values of the Bonus-Malus covariate; thus, when applying the full ICEnet, significant smoothing of the ICE outputs is performed at these extreme values. Of course, if required, the exact form of the penalty applied to this particular curve could be modified if a particular shape of the smoothed curve was required.
Focusing on the first training run of the FCNs and the ICEnets, we now show some examples of the effect of the constraints on individual observations. To estimate the monotonicity and smoothness of the ICE outputs of the FCN and ICEnets, these components of the ICEnet loss function (3.4) were evaluated for each observation in the test set. Fig. 10 shows density plots of the difference (smoothed model minus unsmoothed model) between these scores for each of these models, for each variable separately.
ICE plots of the output of the FCN and the ICEnet for two instances chosen to be among the least smooth based on the smoothness score evaluated for each instance in the test set on the outputs of the FCN. Note that the smoothed model is the ICEnet and unsmoothed model is the FCN.
 $x$
-axis shows ordinal values of the pseudo-data on which the ICE is evaluated.

All of these densities have a long left tail, meaning to say, that the ICE outputs produced by the ICEnet are significantly more monotonic and smooth than those produced by the FCN. Also, the densities usually peak around zero, meaning to say that adding the constraints has generally not significantly “damaged” outputs from the FCN that already satisfied the monotonicity or smoothness constraints. For the densities of the monotonicity scores for the bonus-malus and density variables, it can be seen that there is a short right tail as well, which we have observed to occur when the original FCN model produces some outputs that are already monotonic and these are altered somewhat by the ICEnet.
Figs. 11 and 12 show ICE plots for several instances
 $n$
, which have been specially chosen to be among those that are the least monotonic and smooth ones, based on the monotonicity and smoothness scores evaluated for each observation in the test set on the outputs of the FCN only. These figures show that, in general, the ICE plots of predictions from the ICEnet are more reasonable. For example, for instance
 $n=4282$
in Fig. 11, it can be seen that the FCN produces predictions that decrease with density, whereas the opposite trend is produced by the ICEnet; another example is instance
 $n = 41,516$
where the FCN predictions decrease with vehicle power and the ICEnet reverses this. Moreover, in Fig. 12, it can be seen that the predictions from the ICEnet for
 $n = 14,039$
are much smoother. A nice side effect of the constraints is that some of the exceptionally large predictions produced by the FCN, for example, for instance
 $n = 16,760$
in Fig. 12, are reduced significantly by the ICEnet; in general, it would be highly unlikely to underwrite policies with such an elevated frequency of claim. We refer also to the figures in Appendix 4 for more examples.
5.4 Varying the ICEnet constraints
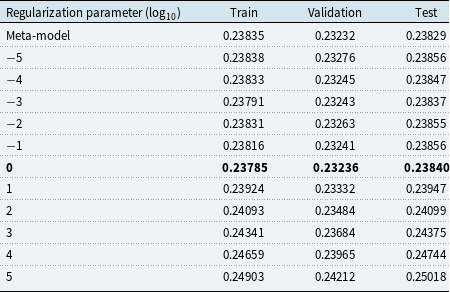
We end this section by investigating how the PDPs of the ICEnets change as the strength of the penalty parameters is varied over a wide range. To provide a baseline starting point, a meta-network (or, using the terminology of machine learning, a distillation network Hinton et al., Reference Hinton, Vinyals and Dean2015) was fit to the nagging predictor derived from the FCNs in Section 5.2; this was done by fitting exactly the same FCN as before, with the same covariates, but with the aim of approximating the nagging predictor derived using the 10 FCN predictions. Then, the weights of the meta-network were used as a starting point for fitting an ICEnet, where a single penalty parameter was used for all the constraints applied in the model and where the strength of this single penalty parameter was varied over a wide range from
 $10^{-5}$
to
 $10^5$
. The results of fitting these models, as well as the PDPs from the meta-model and the ICEnets are shown in Table 8 and Fig. 13, respectively.
Poisson deviance loss for the ICEnet, training, validation, and testing sets. The magnitude of the constraints is varied as described in the first column; “meta-model” denotes the results of the meta-model with no constraints applied
PDPs of the meta-model and ICEnets with the penalty parameters varied from
 $10^{-5}$
to
 $10^5$
. The PDPs of the meta-model are in black and the PDP of the optimal model – with smoothing parameters set equal to
 $1$
– based on the validation set is shown in red.
 $x$
-axis shows ordinal values of the pseudo-data on which the PDP is evaluated.

The minimum value of the test set Poisson deviance loss is reached when setting the value of the constraints equal to
 $10^{-3}$
, however, the validation set minimum is reached when setting the value of the constraints to unity; in this case, the validation set identifies an almost optimal value of the constraints as measured by the test set performance. It can also be seen that the highest value of the constraints leads to models with a poor test and validation set performance. The PDPs show that the ICEnet with the optimal value of the constraints maintains many of the features of the PDPs of the meta-model, while being smoother and less extreme than the meta-model. The ICEnets with the most extreme values of the penalty parameters become much flatter for the bonus-malus, vehicle age, and density variables, whereas the PDPs for driver age and vehicle power maintain significant variation over the range of these variables. For even larger values of the penalty parameters, we would expect the PDPs for driver age and vehicle power also to flatten out. This is an empirical demonstration of the theory mentioned in Section 3.3.
Here, we have considered quite simple variations of the penalty parameters by varying the constraints for all variables together; as noted above, using other techniques, one could also attempt to find an optimal set of constraints where the values of these differed by variables and type of constraint.
6. Local approximations to the ICEnet
In the previous section, the constraints on the network have been enforced by creating ICE outputs from the FCN for each value that the covariates with constraints can take, see Assumptions 3.1. However, this creates quite some computational overhead when fitting the ICEnet. Thus, we now explore a local approximation to the ICEnet, where the ICE outputs from the FCN are created only for a small subset of the values that the covariates with constraints can take. In particular, we define a window size parameter
 $\omega$
and only produce the ICE outputs in a window of
 $\frac{\omega -1}{2}$
around the actual value of each covariate. To ensure that the third difference used for smoothing remains defined, we set the window parameter to have a value of
 $\omega = 5$
in what follows. To define the Local ICEnet approximation, all that is needed is to modify the ICEnet to produce outputs for an observation to return outputs only in the window around the actual observed value. Furthermore, for instances that are at the extremes of the observed value of
 $j$
-th covariate, e.g., for the youngest drivers, we produce outputs from the ICEnet for only the first or last
 $\omega$
observations of the set
 $\{a^j_1,\ldots, a^j_{K_j} \}$
. Since the Local ICEnet needs to produce significantly fewer outputs than the global ICEnet presented earlier, the computational burden of fitting this model is dramatically decreased and the model can be fit without a GPU.
A Local ICEnet was fit to the same data as above. To enforce the constraints more strongly over the range of the constrained variables, slightly stronger values for these were found to work well; these are shown in Table 9. A Local ICEnet takes about 12 minutes to run without a GPU; this is similar to the global ICEnet running on a GPU.
Smoothing and monotonicity constraints applied within the local ICEnet

The results of fitting the Local ICEnet are shown in Table 10. In this case, the ICEnet outperforms the FCN, both on average and for the nagging predictor, and, comparing these results to those in Table 6, it appears that the Local ICEnet allows constraints to be enforced with a smaller loss of predictive performance than the global ICEnet shown above.
Poisson deviance loss for an FCN and the local ICEnet, training, and testing sets. For multiple runs, the average and standard deviation (in parentheses) are reported

We show plots of the outputs of the Local ICEnet in Appendix D of the supplementary material. From Fig. 16 it can be seen that the global effect of applying the Local ICEnet is quite similar to that of the global ICEnet, however, the PDPs shown in this figure are a little less smooth than those of the global ICEnet. In Fig. 17 it can be seen that the Local ICEnet approximation has been moderately successful at enforcing the required constraints with most of the variables showing improved monotonicity and smoothness scores, except for the bonus-malus and density covariates. The examples shown in Figs. 18 and 19 illustrate that for the most extreme examples of the non-monotonic and rough results produced by the FCN, the Local ICEnet appears to produce outputs that are similar to the global ICEnet.
7. Conclusions
We have presented a novel approach, the ICEnet, to constrain neural network predictions to be monotonic and smooth using the ICE model interpretability technique. We have shown how the global ICEnet can be approximated using a less computationally intensive version, the Local ICEnet, that enforces constraints on locally perturbed covariates. We have verified that the ICEnet proposal works as expected using a simulation study, which also showed that, for suitably large values of the penalty parameters, it is possible to force a neural network to learn a monotonic relationship between a covariate and predictions, even if this is not supported by the data. Fitting these models to a real-world open-source dataset has shown that the monotonicity constraints enforced when fitting the ICEnet can improve the out-of-sample performance of actuarial models, while fitting models with a combination of smoothing and monotonic constraints allows the models to produce predicted frequencies of claim that accord with intuition and are commercially reasonable.
An important finding is that, whereas we would expect the time taken to fit an ICEnet to scale linearly with the amount of pseudo-data used, nonetheless, due to the parallel processing capabilities of GPUs, an ICEnet with an extremely large amount of pseudo-data compared to the actual observations can easily be fit in a reasonable amount of time. Thus, we conclude that the ICEnet can likely be applied practically to real-world personal lines pricing problems.
In this work, we have focused on smoothing the predictions of networks with respect to individual observations; as we have noted above it is easy to rather impose constraints on the global behavior of networks instead. Moreover, other formulations of smoothing constraints could be imposed, for example, instead of squaring the third difference of model outputs, which will lead to minimizing the larger deviations from smoothness, rather absolute differences could be smoothed.
One limitation of the ICEnet proposal as presented here is how the constraints have been chosen. While we have suggested using more advanced methods such as Bayesian optimization to select optimal values of the penalty parameters, it would be valuable to explore this proposal more fully in future research. Another limitation is that we have focused on a simulated example with noise derived from a Gaussian distribution, as well as a real-world non-life pricing example focusing on estimating frequency. Future work could verify that the ICEnet also performs well when estimating claim severity or pure premium. Finally, it would be valuable to compare the performance of the ICEnet to a GLM that has been manually adjusted to enforce monotonicity and smoothness.
Supplementary material
The supplementary material for this article can be found at http://dx.doi.org/10.1017/S174849952400006X.
Acknowledgments
We thank the editor, associate editor, and reviewers for their thorough review of the manuscript and their valuable feedback.
Data availability statement
The non-life pricing data used in this work are freely available from the CASdatasets package. The R code used to fit the ICEnet has been provided in the supplementary material.



