

1. Introduction
Throughout the history of mankind the study and measurement of mortality risk has been very important. Nowadays, it is essential to have a way to measure this in the valuation of insurance, contingent rentals, and management of social security systems and pensions. Since the solvency and financial stability of institutions depends, among other things, of the availability of suitable tools that reflect a proper measurement of the sinister rate, they will face possible deviations. Moreover, mortality rates play an important role in calculus of risk premium and risk reserves.
Studies on the behaviour of mortality in humans is traced back to the early 17th century. Halley (Reference Halley1693) built the first annuity table based on the lifespan. On another hand, Moivre (Reference Moivre1725) proposed the first mathematical mortality model, and as Craik (Reference Craik2002) mentioned, in the 19th century E. Sang proposed a model based on that the number of survivors in a group must decrease geometrically together with a different age factor.
However, it was not until Gompertz (Reference Gompertz1825) proposed that a law of geometric progression pervades in mortality after a certain age. He obtained the following expression known as the Gompertz equation:
 $$\mu _{x} {\,\equals\,}\alpha e^{{\beta x}} $$
where μ x denotes the mortality rate at age x, and α and β are constants. This equation represents a force of mortality that increases progressively with the age in such a manner that logμ x grows linearly. In this equation α is known as the baseline mortality and the term β describes the ageing rate.
Makeham (Reference Makeham1860) extended the Gompertz model by adding a constant:
 $$\mu _{x} {\,\equals\,}\sigma {\plus}\alpha e^{{\beta x}} $$
where σ represents all random factors non-senescent deaths, e.g., accidents, epidemics, etc. This model is known as Gompertz–Makeham law of mortality.
In 1980, Heligman & Pollard (Reference Heligman and Pollard1980) proposed the following formula that fits Australian mortality rates fairly well at all ages:
 $${{q_{x} } \over {1{\,\minus\,}q_{x} }}{\,\equals\,}A^{{(x{\plus}\alpha )^{\beta } }} {\plus}D\,{\rm exp}\left[ {{\minus}E\left\{ {{\rm log}\left( {{x \over F}} \right)} \right\}^{2} } \right]{\plus}GH^{x} $$
where q x is the probability that a person at aged x will die within a year. This model reflects the exponential pattern of mortality at adult ages, the hump at age 23 that is found in many mortality tables, and the fall in mortality during childhood.
Currently, actuaries use mortality tables as a basic tool to describe mortality through an age structure, and based on that do the premium calculation. However, a mortality table is only an option when there is no mathematical law available, in this case a stochastic process that models the time to death or the death probability in a determined time interval can be used. Several factors can alter the probability of death, the most considered factor is the age, but there are other important characteristics such as sex, medical history, smoking, age policy, etc. Therefore, it is important to have a model that includes these factors in the calculation of the mortality rate.
Actuaries have used two mortality models widely, the Heligman–Pollard model and Lee–Carter model (see Lee & Carter, Reference Lee and Carter1992), however, in these models, we cannot determine the distribution of the time of death explicitly. In this paper we will study a model in which the time until death is explicit and has a phase-type (PH) distribution.
Lin & Liu (Reference Lin and Liu2007) used PH distributions to model human mortality. In their model a health index called physiological age was introduced and modelled by a Markov process, however, they only considered the possibility to go to the next state with certain parameters, estimating those using the simplex algorithm. In this work, we will consider a more general intensity matrix to model a hypothetical ageing process, giving another interpretation of the states (physiological ages). On the other hand, since it is impossible to have continuous records of the physiological ages of the people, instead the data can be viewed as incomplete observations (discrete times) from a model with a tractable likelihood function. The full data set is a continuous time record of the Markov process (ageing process). Therefore, we can find maximum likelihood estimates by applying a stochastic Expectation–Maximisation (SEM) algorithm. The advantage of using this model is to have a closed-form expression for calculating premiums of all life insurance based on a model that considers smooth transitions in the human’s ageing process.
The rest of the paper is organised as follows. In section 2 we introduce the physiological age concept. As background of PH distributions, in section 3 we discuss some analytic aspects of these distributions. In section 4 we propose our model to study mortality through physiological ages. In section 5 we discuss the Expectation–Maximisation (EM) algorithm, and how we can apply it into our model in order to estimate the parameters. A simulation study is presented in section 6. Finally, in section 7 we used our model to fit real data. The paper is concluded in section 8.
2. Physiological Age
The properties and functional capacities of the body are changing as the accumulated time increases from birth. We mean by ageing process to simultaneous degradation of multiple organ systems. Jones (Reference Jones1956) defined the ageing process as “the progressive, and essentially irreversible diminution with the passage of time of the ability of an organism or one of its parts to adapt to its environment, manifested as diminution of its capacity to withstand the stresses to which it is subjected and culminating in the death of the organism”.
To model the ageing process, we will consider the concept of physiological age, which can be interpreted as relative health index representing the degree of ageing on the individual. Physiological age has been studied by Knowles et al. (Reference Knowles, Part, Glass and Winn2011), where they proposed a linear model of ageing, which allowed a latent adjustment to be made to individual’s chronological age to give their physiological age. Zuev et al. (Reference Zuev, Yashin, Manton, Dowd, Pogojev and Usmanov2000), e.g., studied the relation of the physiological indicators of organisms in a population to the age specific population mortality rate.
Physiological age is a relative index. Since the time spent at a certain physiological age can be considered within a unbounded time interval, it is enough to know the current physiological age of the individual (regardless of its evolution in the past) to determine its future evolution, i.e., this process presents a Markovian behaviour, so is natural assume that the time spent in each state (physiological age) has an exponential behaviour. Assuming that during the time that individuals remains in this state, their ability to adapt to their environment are the same, and when they move to another physiological age it is because these capacities were diminished. Also of the natural ageing process, there are different factors affecting the deterioration of these capacities, the individuals may suffer an incident that make they pass to any physiological age where their abilities are less than those of the current physiological age.
A problem for model the mortality by the ageing process is that determine the age in which human life is segregated is not an easy task, since it is necessary to have information on the health status of the population under study.
3. PH Distributions
Let consider a Markov jump process {X t } t≥0 with state space E={1, 2, … , n, n+1}, where the states 1, 2, … , n are transient, and the state n+1 is an absorbing one. Given these conditions the infinitesimal generator of the process can be written as follows:
 $${\bLambda }{\,\equals\,}\left( {\matrix{ {\mib{Q}} & {\mib{r}} \cr {\bar{0}} & 0 \cr } } \right)$$
where
Q
is a square matrix of dimension n,
r
a column vector of dimension n, and
 $$\bar{0}$$
a row vector of dimension n with all its entries zero.
Q
is called the PH generator and
r
called the exit vector since it contains the rates by which exit to the absorbing state takes place. Since the rows in an intensity matrix must sum 0, we also have that
r
=−
Qe
, where
e
is a vector of dimension n with all of its entries one.
Let
α
be the initial distribution associated to the process, i.e.
 $${\Bbb P}(X_{0} {\,\equals\,}i){\,\equals\,}\alpha _{i} $$
. We assume that
 $$\mathop{\sum}\limits_{i{\,\equals\,}1}^n \alpha _{i} {\,\equals\,}1$$
, this means the process cannot start in the absorbing state.
Consider a random variable τ which models the time it takes for the process to reach the absorbing state n+1, i.e.
 $$\tau {\,\equals\,}\:{\rm inf}\:\{ t\geq 0; \,X_{t} {\,\equals\,}n{\plus}1\}. $$
Definition 3.1 PH distributions with representation ( α , Q ) is the distribution of a stopping time τ for a Markov jump process {X t } t≥0 with state space E={1, 2, … , n, n+1}, an absorbing state {n+1}. We denote this by τ~PH( α , Q ).
PH distributions were considered first by Neuts (Reference Neuts1975, Reference Neuts1981).
The transition probability matrix of the Markov jump process at time t≥0 is given by
 $$P(t){\,\equals\,}{\rm exp}\,(t{\bf \bLambda }){\,\equals\,}\left( {\matrix{ {{\rm exp}\,(t{Q})} & {{\mib{e}} {\,\minus\,}{\rm exp}(t{Q}){\mib{e}} } \cr {\bar{0}} & 1 \cr } } \right).$$
Some of the properties of the PH distributions are the following. Consider τ~PH( α , Q ), then for all t≥0:
-
1. The survival function of τ is given by
 $${\Bbb P}(\tau \,\gt\,t){\,\equals\,}{\mib{\alpha }} \,{\rm exp}\,(t{Q}){\mib{e}} $$
.
-
2. The density of τ is f τ (t)= α exp(tQ ) r .
-
3. The ith moment of τ is given by

 $$\!\!\!\!\!\!\!\!\!\!\!\!\!\!\!\!\!\!\!\!\!\!\!\!\!\!\!\!\!\!\!\!\!\!{\Bbb E}(\tau ^{i} ){\,\equals\,}i\,!\,({\minus}1)^{i} {\mib{\alpha }} ({\mib{Q}} ^{{{\minus}1}} )^{i} {\mib{e}}. $$
See Bladt (Reference Bladt2005) for the demonstration of these properties.
Given the characteristics of the ageing process (presented in the previous section), it is natural to consider that the ageing process is a Markov jump process with the death considered as an absorbing state and the remaining life time following a PH distribution.
Since mortality modelling is important for pension plans and annuity business, the use of parametric models to extrapolate the past into the future has changed over the years due to such as parameters have to have information of the ageing process. The new models apart from adjusting data effectively show the connection between physiological age given by experts and the ageing process. Markov processes and PH distributions have been used to model human mortality (e.g. see Aalen, Reference Aalen1995). Lin & Liu (Reference Lin and Liu2007) have shown that using PH distributions to model mortality data with the properties before mentioned is satisfactory, however, their model has an special structure of the transition matrix that in this work will be extended.
4. Model and Data
As Booth & Tickle (Reference Booth and Tickle2008) mentioned, there are three approaches of the mortality methods: extrapolation, explanation, and expectation. Most methods of mortality are extrapolative, i.e., uses age patterns and trends over time, and includes measures such as life expectancy. Time series methods are used in extrapolative forecasting, which are stochastic. The explanation approach uses structure of epidemiological models of mortality from certain causes of death involving risk factors. In the third approach (expectation), the methods are based on the opinion of experts, thus less formality, more subjectivity, and bias is considered.
As Lin & Liu (Reference Lin and Liu2007) considered, in this work we will propose an explanatory approach. Our proposal considers not only endogenous risk factors (such as lifestyle of each person, feeding habits, sports practice, etc.), but also exogenous risk factors (accidents, epidemics, etc.) that affect the possibility of death.
Assuming that the life of a person can be segregated into n physiological ages (we will give an idea of how to do that in section 7) and death is represented by the state n+1, we consider a finite-state Markov jump process (time-homogeneous) to model the hypothetical ageing process with state space E={1,2, … ,n,n+1}. Since the Markov process has only a single absorbing state (the death state), the death time (the absorbing time) follows a PH distribution.
Since we want a model to explain more precisely human mortality, based on Lin & Liu (Reference Lin and Liu2007), we propose the following evolution for the ageing process. If a person has physiological age i (i∈{1,2, … , n}), we assume that the time spent at this age is exponentially distributed with parameter λ i (0<λ i <∞). Also, for i∈{1, … ,n−1}, we consider three possible cases (additionally of the possibility of continue in the current state):
-
1. The person presents a natural development of the ageing process, in this case, the person eventually transits to the next physiological age i+1. We suppose that the intensity of this transition is given by λ i,i+1 (0<λ i,i+1<∞).
-
2. The ageing process of a person is affected by an unusual incident (car accident, epidemics, etc.), which causes a diminution of its capacity to continue alive. Then the person transits to some physiological age j, with j∈{i+2,i+3, … ,n}. The intensity of this transition is denoted by λ ij (0<λ ij <∞).
-
3. The possibility of death for the person at that physiological status. The intensity of this transition is given by r i (0<r i <∞).
Being at physiological age n, the only possibility of transition is the eventual transition to the death state, with intensity λ n =r n (0<r n <∞).
Note that each state represents a physiological age, and ageing is described as a process of transitions from one physiological age to a higher physiological age. In section 7, we will present how to obtain the parameters λ ij and r i , which basically depend on risk factors.
Thus, the subintensity matrix is given by
 $${\mib{Q}} {\,\equals\,}\left( {\matrix{ {{\minus}\lambda _{1} } & {\lambda _{{12}} } & {\lambda _{{13}} } & \,\ldots\, & {\lambda _{{1n}} } \cr 0 & {{\minus}\lambda _{2} } & {\lambda _{{23}} } & \,\ldots\, & {\lambda _{{2n}} } \cr 0 & 0 & {{\minus}\lambda _{3} } & \,\ldots\, & {\lambda _{{3n}} } \cr \vdots & \vdots & \ddots & \ddots & \vdots \cr 0 & 0 & 0 & \,\ldots\, & {{\minus}\lambda _{n} } \cr } } \right)$$
where
 $$\lambda _{i} {\,\equals\,}\mathop{\sum}\limits_{j{\,\equals\,}i{\plus}1}^n \lambda _{{ij}} {\plus}r_{i} ,\quad i{\,\equals\,}1,2,\,\ldots\,,n{\,\minus\,}1.$$
The initial distribution is α = e i , which denotes the ith unit vector, and the exit vector is given by r =(r 1,r 2, … ,r n )′.
We denote by q i (t) the probability of death for a person at physiological age i∈{1,2 … ,n}, in the interval [0,t], which is given by
 $$q_{i} (t){\,\equals\,}{\Bbb P}(\tau _{i} \leq t){\,\equals\,}1{\,\minus\,}{\mib{e}} _{i} \,{\rm exp}(t{\mib{Q}} ){\mib{e}} $$
where τ i ~PH( e i , Q ). It is important to note that in our model, if a person at physiological age i∈{1,2, … ,n−1} who died in a time interval [0,t], then the transition from age i to the death state not necessarily happened, it is probably that the person visited some other states {i+1, … ,n−1} before die. Since our model proposes to use factors that affect the ageing process, so it presents a better way to model the time to death.
In order to generate mortality tables based on this model, we need to estimate the parameters. Since by this model the time of death is PH distributed, a technical advantage is that, its density, survival function, and moments have simple analytical form. It is well known that PH distributions allow the use of matrix-analytic methods in stochastic models (see Neuts, Reference Neuts1981).
Note that we have an acyclic PH distribution (see Bobbio & Telek, Reference Bobbio and Telek1994 and Bobbio et al. 2003) with a certain interpretation of the states. There are many software available for the estimation part of this distribution: PhFit, EMpht, G-FIT, Hyperstar, among others, but in our work, because of the variance reduction, we propose a new way to estimate this distribution using the Bisection algorithm (see Asmussen & Hobolth, Reference Asmussen and Hobolth2012).
Furthermore, the Heligman–Pollard model cannot identify the distribution of the time of death explicitly, and no analytical tool is available, most of the studies using this model focus on numerical or statistical experiments.
Now, we will consider the following two scenarios regarding the nature of the data: first, when we have continuous time information of the ageing process of the population, and second, considering a more realistic scene where there are reports of the development process only at determined moments, i.e., there are only discrete time observations of a Markov jump process. In both scenarios we consider a population that is subject to the same risk factors and the distribution of the ageing process of each individual it is independent of the others. Also, persons at the same physiological age have the same distribution, and the risk factor only depends on the physiological age.
With these assumptions, we can consider that the ageing process to death of each individual represents a path of a Markov jump process, indeed the paths of the individuals are independent.
Considering a population of size M and the time interval [0,T], let
 $${\bf X}^{m} {\,\equals\,}\{ X_{t}^{m} \} _{{t\geq 0}}^{T} ,m{\,\equals\,}1,\,\ldots\,,M$$
, be independent Markov jump processes with the same finite-state space E and the same intensity matrix (infinitesimal generator) given in (1). Each
X
m
represents the ageing process for each person in the population. In the next section we develop a SEM algorithm for finding maximum likelihood estimators of (
α
,
Q
).
5. The Likelihood Function and a SEM Algorithm
Since the ageing process of a person is recorded only at discrete times we can think of this data set as an incomplete observation of a full data set given by the sample path X m , hence it is necessary to have an algorithm to estimate the intensity matrix and build the corresponding mortality probabilities. The EM algorithm is a broadly applicable method for optimising the likelihood function in cases where only partial information is available.
We are interested in the inference about the intensity matrix Λ based on samples of observations of
X
m
’s at discrete times points, i.e., we suppose that all processes have been observed only at K time points 0=t
1< … <t
K
=T denoted by
 $$Y_{k}^{m} {\,\equals\,}X_{{t_{k} }}^{m} $$
. Assuming that the observation points are equidistant, i.e., t
k+1−t
k
=Δ for all k=1, … ,K, then
 $$Y^{m} {\,\equals\,}\{ Y_{k}^{m} \,\colon\,k{\,\equals\,}1,\,\ldots\,,K\} $$
is the discrete time Markov chain associated with
X
m
with transition matrix P(Δ)=exp(ΔΛ), for m=1, … ,M. We denote the observed values by
y
={
y
1, … ,
y
M
}, where
 $$y^{m} {\,\equals\,}\{ Y_{1}^{m} {\,\equals\,}y_{1}^{m} ,\,\ldots\,,Y_{K}^{m} {\,\equals\,}y_{K}^{m} \} $$
. We need to find the likelihood function for the full data set and the conditional expectation of this full log-likelihood function given the observations
Y
m
.
5.1. Likelihood function and full data case
Considering that the X m ’s have been observed continuously in the time interval [0,T], the complete likelihood function is given by (see Billingsley, Reference Billingsley1961; Jacobsen, Reference Jacobsen1982; Küchler & Sorensen, Reference Küchler and Sorensen1997)
 $$L_{T}^{c} ({\bf \theta }){\,\equals\,}\prod\limits_{i{\,\equals\,}1}^n \alpha _{i}^{{B_{i} }} \prod\limits_{i{\,\equals\,}1}^n \prod\limits_{j\,\ne\,i}^n \lambda _{{ij}}^{{N_{{ij}} (T)}} e^{{{\minus}\lambda _{i} Z_{i} (T)}} \prod\limits_{i{\,\equals\,}1}^n r_{i}^{{N_{i} (T)}} $$
where
θ
=(
α
,
Q
); B
i
is the number of processes starting in state i;
 $$N_{{ij}} (T){\,\equals\,}\mathop{\sum}\nolimits_{m{\,\equals\,}1}^M N_{{ij}}^{m} (T)$$
, where
 $$N_{{ij}}^{m} (T)$$
is the number of jumps from state i to j of the mth process in [0,T];
 $$N_{i} (T){\,\equals\,}\mathop{\sum}\nolimits_{m{\,\equals\,}1}^M N_{i}^{m} (T)$$
the number of processes exiting from state i to the absorbing state in the time interval [0,T], where
 $$N^{m} _{i} (T){\,\equals\,}\left \{ {\matrix{ 1 & {\:{\rm if}\;{\rm the}\;m{\rm th}\;{\rm process}\;{\rm is}\;{\rm exiting}\;{\rm from}\:} \cr {} & \!\!\!\!\!\!\!\!\!\!\!\!{{\rm state}\;i\;{\rm to}\;{\rm the}\;{\rm absorbing}\;{\rm state}\:} \cr 0 & {\:{\rm \!\!\!\!\!\!\!\!\!\!\!\!\!\!\!\!\!\!\!\!\!\!\!\!\!\!\!\!\!\!\!\!\!\!\!\!\!\!\!\!\!\!\!\!\!\!\!\!\!\!\!\!\!\!\!\!\!\!\!other}\;{\rm case}} \cr } } \right.$$
and
 $$Z_{i} (T){\,\equals\,}\mathop{\sum}\nolimits_{m{\,\equals\,}1}^M Z_{i}^{m} (T)$$
, where
 $$Z_{i}^{m} (T)$$
is the total time spent in state i of the mth process in [0,T].
Because of (3) we can rewrite the complete likelihood function as
 $$L_{T}^{c} ({\bf \theta }){\,\equals\,}\prod\limits_{i{\,\equals\,}1}^n \alpha _{i}^{{B_{i} }} \prod\limits_{i{\,\equals\,}1}^n \prod\limits_{j\,\ne\,i}^n \lambda _{{ij}}^{{N_{{ij}} (T)}} e^{{{\minus}\lambda _{{ij}} Z_{i} (T)}} \prod\limits_{i{\,\equals\,}1}^n r_{i}^{{N_{i} (T)}} e^{{{\minus}r_{i} Z_{i} (T)}}. $$
The log-likelihood function is as follows:
 $$\!\!\!\!\!\!\!\!\!\!\!\!\!\!\!\!\!\!\!\!\!\!\!\!\!\!\!\!\!\!\!\!\!\!\!\!\!\!\!\!\!\!\!\!\!\!l_{T}^{c} ({\bf \theta }){\,\equals\,}\mathop{\sum}\limits_{i{\,\equals\,}1}^n B_{i} log(\alpha _{i} ){\plus}\mathop{\sum}\limits_{i{\,\equals\,}1}^n \mathop{\sum}\limits_{j\,\ne\,i}^n N_{{ij}} (T)log(\lambda _{{ij}} )$$
 $$\,\,\,\,\,\,\,\,\,{\minus}\mathop{\sum}\limits_{i{\,\equals\,}1}^n \mathop{\sum}\limits_{j\,\ne\,i}^n \lambda _{{ij}} Z_{i} (T){\plus}\mathop{\sum}\limits_{i{\,\equals\,}1}^n N_{i} (T)log(r_{i} ){\,\minus\,}\mathop{\sum}\limits_{i{\,\equals\,}1}^n r_{i} Z_{i} (T)$$.
It is immediately clear that the maximum likelihood estimators of the parameters are given by
 $$\hat{\alpha }_{i} {\,\equals\,}{{B_{i} } \over M};\,\quad \hat{\lambda }_{{ij}} {\,\equals\,}{{N_{{ij}} (T)} \over {Z_{i} (T)}};\,\quad \hat{r}_{i} {\,\equals\,}{{N_{i} (T)} \over {Z_{i} (T)}}.$$
The case when the ageing process is continuously observed is trivial because we only need to calculate the sufficient statistics: B i ,N ij ,N i ,Z i . The problem is when the observations of the ageing process are recorded at discrete times. Then, we are interested in the inference of θ based on a sample of y ’s.
The discrete log-likelihood function
 $$L_{T}^{d} ({\bLambda })$$
of a time series
Y
m
is given in terms of the transition matrix P(T) (see equation (2)):
 $$L_{T}^{d} ({\bitheta }){\,\equals\,}\prod\limits_{m{\,\equals\,}1}^M \prod\limits_{k{\,\equals\,}1}^{K{\minus}1} p_{{y_{k}^{m} y_{{k{\plus}1}}^{m} }} (\Delta )$$
where
 $$p_{{y_{k}^{m} y_{{k{\plus}1}}^{m} }} (\Delta )$$
is the probability that the mth process makes a transition from the state
 $$y_{k}^{m} $$
to the state
 $$y_{{k{\plus}1}}^{m} $$
in the time Δ. The difficulty is that the derivative of (7) with respect to the entries has such a complicated form that the null cannot be found analytically. Hence, no analytical expression for the maximum likelihood estimator with respect to
θ
is available.
Moreover, in this case there are some difficulties that must be taken into account. First, from a finite number of samples it is impossible to tell if the underlying process is actually Markovian. Second, it is not clear if the observed data are originated indeed from discrete samples of a Markov jump process with some generator Λ, or rather from a discrete time Markov chain which cannot be embedded into a time-continuous counterpart (embedding problem), and finally, the fact that the matrix exponential function is not injective if the eigenvalues of the generator are complex, see Bladt & Sorensen (Reference Bladt and Sorensen2005).
Here, the data can be viewed as incomplete observations from a model with a tractable likelihood function. The full data set is a continuous time record of the Markov jump processes and the initial states. We can therefore find the maximum likelihood estimates by applying the EM algorithm.
5.2. SEM algorithm
We need to find the likelihood function for the full data set and the conditional expectation of this function given the observations Y = y . The EM algorithm is a desterministic algorithm that was introduced by Dempster et al. (Reference Dempster, Rubin and Laird1977) (see also McLachlan & Krishnan, Reference McLachlan and Krishnan1997) to solve the problem of maximising the likelihood function through a relatively simple sequence of maximisation problems whose solutions converge to the maximum possible.
One of the main advantages of this algorithm is that it solves maximum likelihood problems in a iterative way, when there is incomplete or missing information, replacing the missing data with the expected value of the observed data. On the other hand, the asymptotic normality of the maximum likelihood estimator was established in Billingsley (Reference Billingsley1961), but the expression of the asymptotic variance of the maximum likelihood estimator is (in general) very complicated. We can calculate the Fisher information matrix if we use the EM algorithm to find the standard deviation of the maximum likelihood estimators. We can describe the general idea of the EM algorithm as follows:
-
1. Replace missing data with estimated values.
-
2. Estimate the parameters considering the complete information with the estimated values.
-
3. Repeat the previous steps until convergence as follows: for the step 1 the estimated parameter (found in step 2) are used as the current parameter, and for the step 2, the estimated values (found in step 1) are used as observed.
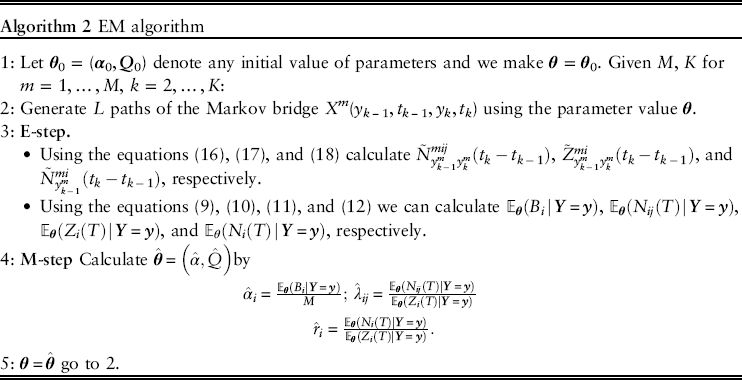
Thus, in this case the EM algorithm works as follows. Let θ 0=( α 0, Q 0) denote any initial value of parameters.

The E-step and the M-step are repeated until convergence. In this case, to calculate the expectation required in the E-step is not an easy work. We propose to estimate this expectation by simulation. Thus, we either can use a SEM algorithm suggested by Celeux and Diebolt (Reference Celeux and Diebolt1986) (see Nielsen, Reference Nielsen2000 for estimation and asymptotic results) or the Monte Carlo EM (MCEM) algorithm (see Wei & Tanner, Reference Wei and Tanner1990). The difference between these two algorithms is that MCEM uses many simulations in each iteration while the SEM just one.
In order to calculate the E-step, from (6) we have that
 $$\eqalignno{ {\Bbb E}_{{\bitheta _{0} }} & (l^{c} _{T} ({\mib{\bitheta }} )\!\mid\!{\mib{Y}}{\rm {\,\equals\,}}{\mib{y}}){\,\equals\,}\mathop{\sum}\limits_{i{\,\equals\,}1}^n {\rm log(\alpha _{i} ){\Bbb E}_{{\bitheta _{0} }} (\it B_{i}\!\mid\!{\mib{Y}} {\,\equals\,}{\mib{y}} )} \cr & {\plus}\mathop{\sum}\limits_{i{\,\equals\,}1}^n {\mathop{\sum}\limits_{j\,\ne\,i}^n {\rm log\left( {\lambda _{{\it ij}} } \right){\Bbb E}_{{\bitheta _{0} }} \left( {\it N_{{ij}} \left( T \right)\!\mid\!{\mib{Y}} {\,\equals\,}{\mib{y}} } \right)} } {\minus}\mathop{\sum}\limits_{i{\,\equals\,}1}^n {\mathop{\sum}\limits_{j\,\ne\,i}^n {\lambda _{{ij}} } } {\Bbb E}_{{\bitheta _{0} }} \left( {Z_{i} \left( T \right)\!\mid\!{\mib{Y}} {\,\equals\,}{\mib{y}} } \right) \cr & {\plus}\mathop{\sum}\limits_{i{\,\equals\,}1}^n {\rm log\left( {\it r_{i} } \right){\Bbb E}_{{\bitheta _{0} }} \left( {\it N_{i} \left( T \right)} \right)\!\mid\!{\mib{Y}} {\,\equals\,}{\mib{y}} )} {\minus}\mathop{\sum}\limits_{i{\,\equals\,}1}^n {r_{i} {\Bbb E}_{{\bitheta _{0} }} \left( {Z_{i} \left( T \right)\!\mid\!{\mib{Y}} {\,\equals\,}{\mib{y}} } \right)}. $$
Since (6) is a linear function of the sufficient statistics B i , Z i (T), N i (T), and N ij (T), it is enough to calculate the corresponding conditional expectations of these statistics.
 $${\Bbb E}_{{{\mib{\bitheta }} _{0} }} (B_{i}\!\mid\!{\mib{Y}} {\,\equals\,}{\mib{y}} ){\,\equals\,}\mathop{\sum}\limits_{m{\,\equals\,}1}^M {{\bf 1}_{{\{ Y_{1}^{m} {\,\equals\,}i\} }} } ;\,\,i{\,\equals\,}1,\,\ldots\,,n$$
where 1 {⋅} is the indicator function
 $${\Bbb E}_{{{\mib{\bitheta }} _{0} }} \left( {N_{{ij}} \left( T \right)\!\mid\!{\mib{Y}} {\,\equals\,}{\mib{y}} } \right){\,\equals\,}\mathop{\sum}\limits_{m{\,\equals\,}1}^M {\mathop{\sum}\limits_{k{\,\equals\,}2}^K {\tilde{N}_{{y_{{k{\minus}1}}^{m} y_{k}^{m} }}^{{mij}} \left( {t_{k} {\,\minus}\,t_{{k{\,\minus\,}1}} } \right)} } $$
 $${\Bbb E}_{{{\mib{\bitheta }} _{0} }} \left( {Z_{i} \left( T \right)\!\mid\!{\mib{Y}} {\,\equals\,}{\mib{y}} } \right){\,\equals\,}\mathop{\sum}\limits_{m{\,\equals\,}1}^M {\mathop{\sum}\limits_{k{\,\equals\,}2}^K {\tilde{Z}_{{y_{{k{\minus}1}}^{m} y_{k}^{m} }}^{{mi}} \left( {t_{k} {\,\minus\,}t_{{k{\,\minus\,}1}} } \right)} } $$
and
 $${\Bbb E}_{{{\mib{\bitheta }} _{0} }} \left( {N_{i} \left( T \right)\!\mid\!{\mib{Y}} {\,\equals\,}{\mib{y}} } \right){\,\equals\,}\mathop{\sum}\limits_{m{\,\equals\,}1}^M {\mathop{\sum}\limits_{k{\,\equals\,}2}^K {\tilde{N}_{{y_{{k{\minus}1}}^{m} }}^{{mi}} \left( {t_{k} {\,\minus\,}t_{{k{\,\minus\,}1}} } \right)} } $$
by the Markov property and the homogeneity of the processes, it is sufficient to evaluate for the states i,j,r,s=1, … ,n, the processes m=1, … ,M, and the times 0≤s 1<s 2<∞, the following:
 $$\tilde{N}_{{rs}}^{{mij}} \left( {s_{2} {\,\minus\,}s_{1} } \right){\,\equals\,}{\Bbb E}_{{{\mib{\bitheta }} _{0} }} \left( {N_{{ij}}^{m} \left( {s_{2} {\,\minus\,}s_{1} } \right)\!\mid\!X_{{s_{2} }}^{m} {\,\equals\,}s,X_{{s_{1} }}^{m} {\,\equals\,}r} \right)$$
 $$\tilde{Z}_{{rs}}^{{mi}} \left( {s_{2} {\,\minus\,}s_{1} } \right){\,\equals\,}{\Bbb E}_{{{\mib{\bitheta }} _{0} }} \left( {Z_{i}^{m} \left( {s_{2} {\,\minus\,}s_{1} } \right) \!\mid\! X_{{s_{2} }}^{m} {\,\equals\,}s,X_{{s_{1} }}^{m} {\,\equals\,}r} \right)$$
 $$\tilde{N}_{s}^{{mi}} \left( {s_{2} {\,\minus\,}s_{1} } \right){\,\equals\,}{\Bbb E}_{{{\mib{\bitheta }} _{0} }} \left( {N_{i}^{m} \left( {s_{2} {\,\minus\,}s_{1} } \right)\!\mid\!X_{{s_{2} }}^{m} {\,\equals\,}n{\plus}1,X_{{s_{1} }}^{m} {\,\equals\,}s} \right).$$
The delicate part of using the EM algorithm rely on the E-step, since it is the computationally demanding one. In 2009, Okamura et al. (Reference Okamura, Dohi and Trivedi2009) proposed two EM algorithms for fitting Markovian arrival processes (MAPs) and Markov modulated Poisson processes with generalised group data, the estimation is performed when exact arrival times are not known. Since in their work the size of the MAPs is limited due to the computational effort, they extended it in Okamura et al. (Reference Okamura, Dohi and Trivedi2012) considering also PH distributions and giving an improvement of reducing the time complexity of their algorithms using uniformisation (UNI). Some of their software available are mapfit (estimation methods for PH distributions and MAPs from empirical data (point and grouped data)), and PHPACK (Phase-Type Analysis Package) which is a software package to use PH distributions in stochastic modelling.
Breuer & Kume (Reference Breuer and Kume2010) proposed a new form of calculating the steps of the EM in MAPs based on the matrix exponential function.
Considering PH distributions, in simulation-based statistical estimation, one needs to generate a sample path of the Markov chain, the problem can, however, be translated to end-point conditioned simulation. Hobolth & Stone (Reference Hobolth and Stone2009) suggested some algorithms for end-point conditional simulation from continuous time Markov chains (CTMCs): rejection sampling, UNI, and direct simulation. Indeed, Hobolth & Jensen (Reference Hobolth and Jensen2011) have been suggested three methods in order to calculate the conditional expectations of the sufficient statistics: eigenvalue decomposition (EVD), UNI, and integrals of exponentials (IE). Such as methods are implemented and compared in Tataru & Hobolth (Reference Tataru and Hobolth2012) indicating that depending on the problem/example one method can be better than the others. In particular, we cannot use EVD because it is necessary that the estimator of the infinitesimal generator in each iteration of EM algorithm is diagonalisable, and this condition cannot be guaranteed. Moreover, Tataru & Hobolth (Reference Tataru and Hobolth2012) concluded that IE is the method most accurate one but is the slowest.
In this paper, we will use the uniformisation method (see Latouche & Ramaswami, Reference Latouche and Ramaswami1999) in order to generate the M sample paths, registering the time and the states visited. After getting those, we can obtain a M×K-dimensional discrete matrix, where the (m,k)-entry is the state of the mth path in the interval of time [t k ,t k+1]. Now, since each state of this matrix can be considered as an end-point, we can use the uniformisation again in order to simulate end-point conditional paths, which is usually very efficient, but can be slow if many state changes are needed in the simulation procedure (Asmussen & Hobolth, Reference Asmussen and Hobolth2012). Thus, we will use a fourth method proposed in the literature to simulate end-point conditional paths: bisectioning (see Asmussen & Hobolth, Reference Asmussen and Hobolth2012; Hobolth & Thorne, Reference Hobolth and Thorne2014). Indeed, we will use bridge sampling from CTMCs for the estimation of PH distributions.
To calculate (13), (14), and (15) we propose to generate L (where L is a fixed positive integer number) sample paths of the Markov bridge X
m
(r,s
1,s,s
2) using the parameter value
θ
0=(
α
0,
Q
0), i.e., a stochastic process defined on [s
1,s
2] and having the same distribution of the Markov jump process
 $$\{ X_{t}^{m} \} _{{t\in[s_{1} ,\,s_{2} ]}} $$
conditioned on
 $$X_{{s_{1} }}^{m} {\,\equals\,}r$$
and
 $$X_{{s_{2} }}^{m} {\,\equals\,}s$$
for m=1, … ,M.
Let X
m(l)(r,s
1,s,s
2) be the lth path of the Markov bridge X
m
(r,s
1,s,s
2). For l=1, … ,L and m=1, … ,M, we can calculate for the corresponding statistics by using:
 $$N_{{rs}}^{{mij(l)}} (s_{2} {\,\minus\,}s_{1} )$$
, the number of jumps from state i to j;
 $$N_{s}^{{mi(l)}} (s_{2} {\,\minus\,}s_{1} )$$
, the number of processes exiting from state i to the absorbing state; and
 $$Z_{{rs}}^{{mi(l)}} (s_{2} {\,\minus\,}s_{1} )$$
, the total time spent in state i.
Now, based on these bridges we approximate the conditional expectations (13), (14), and (15) by
 $$\tilde{N}_{{y_{{k{\minus}1}}^{m} y_{k}^{m} }}^{{mij}} \left( {t_{k} {\,\minus\,}t_{{k{\,\minus\,}1}} } \right)\,\approx\,{1 \over L}\mathop{\sum}\limits_{l{\,\equals\,}1}^L {N_{{y_{{k{\,\minus\,}1}}^{m} y_{k}^{m} }}^{{mij(l)}} \left( {t_{k} {\,\minus\,}t_{{k{\,\minus\,}1}} } \right)} $$
 $$\tilde{Z}_{{y_{{k{\,\minus\,}1}}^{m} y_{k}^{m} }}^{{mi}} \left( {t_{k} {\,\minus\,}t_{{k{\,\minus\,}1}} } \right)\,\approx\,{1 \over L}\mathop{\sum}\limits_{l{\,\equals\,}1}^L {Z_{{y_{{k{\,\minus\,}1}}^{m} y_{k}^{m} }}^{{mi(l)}} \left( {t_{k} {\,\minus\,}t_{{k{\,\minus\,}1}} } \right)} $$
 $$\tilde{N}_{{y_{{k{\,\minus\,}1}}^{m} }}^{{mi}} \left( {t_{k} {\,\minus\,}t_{{k{\,\minus\,}1}} } \right)\,\approx\,{1 \over L}\mathop{\sum}\limits_{l{\,\equals\,}1}^L {N_{{y_{{k{\,\minus\,}1}}^{m} }}^{{mi(l)}} \left( {t_{k} {\,\minus\,}t_{{k{\,\minus\,}1}} } \right)} $$
respectively, for i,j=1, … ,n; m=1, … ,M; and k=1, … ,K.
Thus, we rewrite the EM algorithm for the maximum likelihood estimation as follows:

To implement this algorithm, the main issue is how to sample Markov bridges. We use the bisection method proposed by Asmussen & Hobolth (Reference Asmussen and Hobolth2012) because of its potential for variance reduction. The idea of this algorithm is to formulate a recursive procedure where we finish off intervals with zero or one jumps and keep bisecting intervals with two or more jumps. The recursion ends when no intervals with two or more jumps are presented.
Considering a Markov bridge X(a,0,b,T) and using the bisection algorithm we have two type of scenarios:
1. If a=b and there are no jumps. In this case we are done: X t =a (a is not an absorbing state) for 0≤t≤T.
2. If a≠b and there is one jump we are done: X t =a for t∈[0,τ) , and X t =b for t∈[τ,T]. Here τ is the jump time.
To determine τ we use the following lemma from Asmussen & Hobolth (Reference Asmussen and Hobolth2012).
Lemma 5.1. Considering an interval of length T, let X 0=a, the probability that X T =b≠a and there is only one single jump (from a to b) in the interval is given by
 $$R_{{ab}} (T){\,\equals\,}\lambda _{{ab}} \left\{ {\matrix{ {{{e^{{{\,\minus}\lambda _{a} T}} {\,\minus\,}e^{{{\,\minus}\lambda _{b} T}} } \over {\lambda _{a} {\,\minus}\lambda _{b} }}} & {\lambda _{a} \,\ne\,\lambda _{b} } \cr {Te^{{{\,\minus}\lambda _{a} T}} } & {\lambda _{a} {\,\equals\,}\lambda _{b} }. \cr } } \right.$$
The density of the time of state change is
 $$f_{{ab}} (t;\,T){\,\equals\,}{{\lambda _{{ab}} e^{{{\minus}\lambda _{b} T}} } \over {R_{{ab}} (T)}}e^{{{\minus}(\lambda _{a} {\minus}\lambda _{b} )t}} ;\,\,0\leq t\leq T$$.
In Tataru & Hobolth (Reference Tataru and Hobolth2012) are implemented and tested three methods (UNI, EVD, and IE) for calculating the conditional expectations of sufficient statistics for Markov jump processes. Here, we propose to use the bisection method to calculate the corresponding expectations of the statistics conditioned on the end-points of the processes.
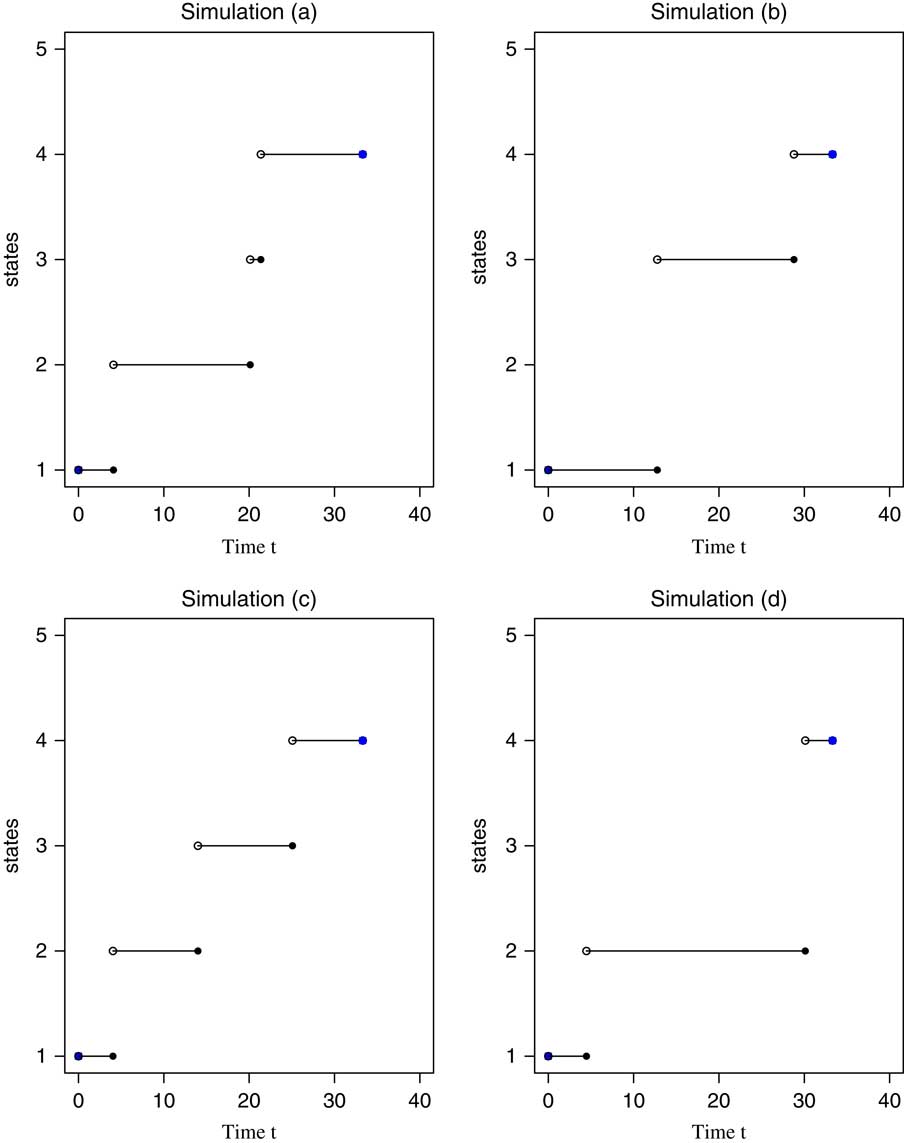
Example 5.1. Bridges: Considering the intensity matrix (20), we simulate some bridges which are presented in Figure 1. In this example, we suppose that a person is in the initial state is 1 at time 0 and at time 33.309 is in the state 4. Here, we present four different scenarios that could happen to this person.
Example of bridges.

As we can see in this figure, in the simulation (b), the person passes directly from state 1 to the state 3 at the age around 12. This is not the case for the simulations (a) and (c), where the person visits all the states, and spends certain amount of time in each of them. Note also that in the simulation (d) the person is in the state 2 for almost 26 units of time.
5.2.1. Fisher information matrix
Because we are interested in the variance reduction, based on Bladt et al. (Reference Bladt, Esparza and Friis2011) we have that the Fisher information matrix using our proposed EM algorithm is given by
 $${\bf{I}} ({{\hat{\bitheta }}} ){\,\equals\,}{\minus}\left[ {{{\partial ^{2} {\cal Q}({{\hat{\bitheta }}} \mid{{\bitheta }} )} \over {\partial {{\hat{\bitheta }}} ^{2} }}{\plus}{{\partial ^{2} {\cal Q}(\hat{\bitheta }{\rm \mid}\bitheta )} \over {\partial {{\bitheta }} \partial {{\hat{\bitheta }}} }}} \right]_{{\hat{\bitheta }{\,\equals\,}\bitheta }} $$
, where
 $${\cal Q}({{\hat{\bitheta }}} \!\mid\!{{\bitheta }} ){\,\equals\,}{\Bbb E}_{{{\bitheta }} } (l_{T}^{c} ({{\hat{\bitheta }}} )\!\mid\!{\mib{Y}} {\,\equals\,}{\mib{y}} )$$
. Thus, in order to get this matrix, we just have to calculate the following:
 $${{\partial ^{2} {\cal Q}} \over {\partial \hat{\alpha }_{i}^{2} }}{\,\equals\,}{\minus}{1 \over {\hat{\alpha }_{i}^{2} }}{\times}{\rm equation}\,(9),\quad {{\partial ^{2} {\cal Q}} \over {\partial \hat{\lambda }_{{ij}}^{2} }}{\,\equals\,}{\minus}{1 \over {\hat{\lambda }_{{ij}}^{2} }}{\times}{\rm equation}(10),\quad $$
 $${{\partial ^{2} {\cal Q}} \over {\partial \hat{r}_{i}^{2} }}{\,\equals\,}{\minus}{1 \over {\hat{r}_{i}^{2} }}{\times}{\rm equation}\,(12).$$
Further, the inverse of the Fisher information matrix is an estimator of the asymptotic covariance matrix. Hence, the estimated standard deviation of the maximum likelihood estimates is given by
 $${\rm SD}({{\hat{\bitheta }}} _{{ML}} ){\,\equals\,}{1 \over {\sqrt {{\rm I} ({{\hat{\bitheta }}} _{{ML}} )} }}.$$
6. A Simulation Study
Now, we will present an example of estimation using the Algorithm 2 and calculating the standard errors of the estimators. The algorithm is coded in Julia and performed on a personal computer with Inter Core i5, running at 2.5 GHz with 4GB RAM.
We will see the convergence of the algorithm, and thus we propose a way to find the final estimation. This methodology will be used in the next section for the estimation of the transition matrix that models mortality data.
Example 6.1. It is well known that, in general, there are four different mortality patterns at ages: 0−2, 2−15, 15−35, and ≥35. Thus, based on that, our example will consider four states, each one representing each pattern, thus n=4. The initial probability vector is defined as α =(0.25,0.25,0.25,0.25), indicating that, a priori, each mortality pattern has the same impact in the population.
The 5×5-dimensional intensity matrix Λ is given by the logarithm of a matrix P , which is constructed in the following way. The 5th column represents the average probability of death of each age group. The ith element of the diagonal is given by P ii =(1−P i5)×(0.9), under the assumption that it is most likely that the person stays in the same group 1 year later. The elements out of the diagonal are given by P ij =(1−P i5)×(0.1)×t ij for i=1,2,3 and j=i+1, … ,4, where
 $$t_{{ij}} {\,\equals\,}{{(n{\,\minus\,}1){\plus}(i{\plus}2){\,\minus\,}j} \over {(n{\,\minus\,}1)(n/2){\,\minus\,}(i{\plus}1)(i{\plus}2)/2}}$$.
Since n=4, thus
 $$t_{{ij}} {\,\equals\,}{{5{\plus}i{\,\minus\,}{\rm }j} \over {(6{\minus}\left( {i{\plus}1} \right)\left( {i{\plus}2} \right)/2}}.$$
Considering real data – probabilities of death – from the United States in 2013, the subintensity matrix and the exit vector are the following:
 $${\mib{Q}} {\,\equals\,}\left( {\matrix{ {{\minus}0.01218} & {0.00082} & {0.00081} & {0.00083} \cr 0 & {{\minus}0.00057} & {0.00006} & {0.00006} \cr 0 & 0 & {{\minus}0.00135} & {0.00028} \cr 0 & 0 & 0 & {{\minus}0.10125} \cr } } \right)$$
and the exit vector
 $${\mib{r}} {\,\equals\,}\left( {\matrix{ {0.00972} \cr {0.00045} \cr {0.00107} \cr {0.10125} } } \right).$$
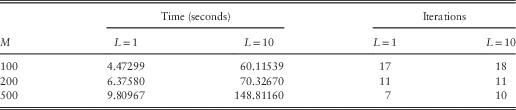
We run the EM algorithm with an arbitrary initial parameters, and fixing T=100, Δ=5, K=20. In order to compare the number of observations and the iterations needed, we run the EM algorithm for different values of M: 100, 200, and 500, and for L=1, and 10. The stopping criterion of the algorithm was
 $$\mid\!{{\hat \bi {\mib{Q}}} {\,\minus\,}{\mib{Q}} \!\mid\,\lt\,$$
ε with ε=10−6. The results are presented in Table 1.
Execution time (seconds) and number of iterations needed

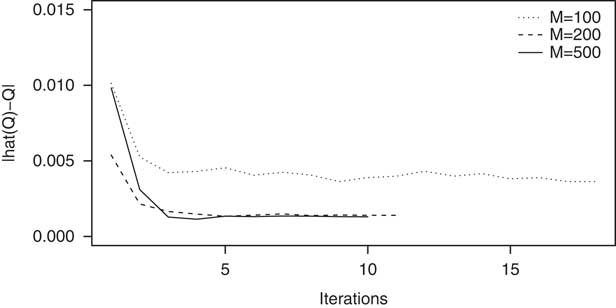
The Figure 2 shows the convergence of the algorithm. We plot the norm−1 of the matrix
 $${{\hat {\mib{Q}}} {\,\minus\,}{{\mib{Q}}} $$
considering L=10, and M=100, 200, 500.
Estimation. Let consider the case where M=200 and L=10. Considering a burn-in of b=5 (see Figure 2) and maximum number of iterations I=11, the SEM estimate of θ is given by
 $${1 \over {I{\,\minus\,}b}}\mathop{\sum}\limits_{i{\,\equals\,}\left( {b{\plus}1} \right)}^I {{{\hat{\bitheta }}} _{i} } $$
where
 $${{\hat{\bitheta }}} _{i} $$
denotes the maximum likelihood estimator at the iteration i.
Estimation using bridges.

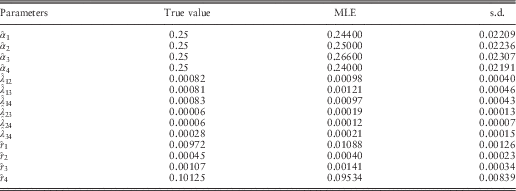
After finding the maximum likelihood estimators, the Fisher information matrix was obtained, so as the variance–covariance matrix. The results are presented in Table 2.
Maximum likelihood estimators (MLEs) and s.d. of the parameters presented in the Example 6.1.

With this simple example we can corroborate that the EM algorithm using the Bisection works very well (see Table 2, column 3). Thus, we can apply it into a real scenario: mortality.
7. Application: Construction of a Mortality Table Using Real Data
In this section we will use mortality and population real data, for the construction of hypothetical physiological ages, to generate records of the evolution of the ageing process of a hypothetical population, and based on these records build a mortality table.
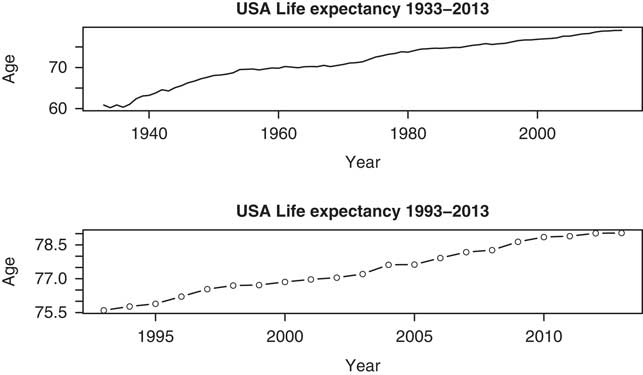
We use the data from the United States (check http://www.mortality.org). The database contains annual information on mortality and population from 1933 to 2013. In each year, the information is classified at 111 ages, from 0 to 110. Based on the evolution of the life expectancy of this population (Figure 3), we consider the data since year 1993, when the last decrease in life expectancy was presented.
Life expectancy at birth, United States.

We denoted by μ
i
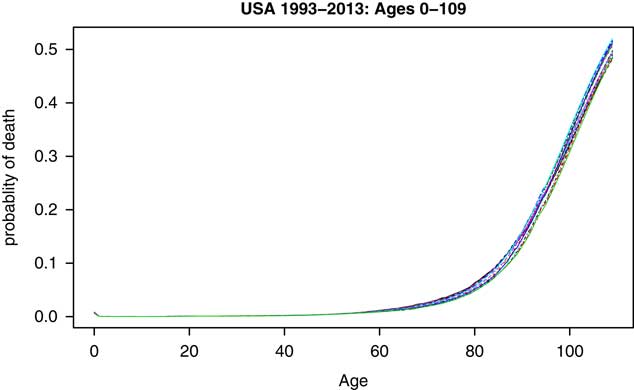
(j) the probability of death observed for a person at age i∈{0, … ,110} in the year j∈{1993, … ,2013} and
 $$\mu _{i} {\,\equals\,}{{\mathop{\sum}\nolimits_{j{\,\equals\,}1}^{21} \mu _{i} (j)} \over {21}}$$
; see Figure 4.
Probability of death, United States 1993–2013.

Since the biological age is the most important factor for the construction of physiological ages, we assume that we have the same number of physiological and biological ages. In order to construct these physiological ages, we need a way to establish the transition probabilities between them, so as to have the structure of our model. Since the information in the database is recorded annually, we just have to calculate the probability that the person passes from age i to age j in one year (i=0,1, … ,109; j=0, … ,110), denoted by p ij .
In order to construct these transition probabilities, define s i be the proportion of people at physiological age i who lead a very healthy life. Based on the study presented in Loprinzi et al. (Reference Loprinzi, Branscum, Hanks and Smit2016), the authors defined a “healthy lifestyle” as one person having the following four qualifications: moderate or vigorous exercise for at least 150 minutes a week, a diet score in the top 40% on the Healthy Eating Index, body fat percentage under 20% (for men) or 30% (for women), and not smoking. Based on the results obtained in Loprinzi et al. (Reference Loprinzi, Branscum, Hanks and Smit2016), let s i =0.027 for i=1, … ,110.
In addition, based on the National Vital Statistics Reports for 2013 of the US Department of Health and Human Services (see Xu et al., Reference Xu, Murphy, Kochanek and Bastian2016), the 15 leading causes of death in 2013 are: diseases of heart (heart disease), malignant neoplasms (cancer), chronic lower respiratory diseases, accidents (unintentional injuries), cerebrovascular diseases (stroke), Alzheimer’s disease, diabetes mellitus (diabetes), influenza and pneumonia, nephritis, nephrotic syndrome, and nephrosis (kidney disease), intentional self-harm (suicide), septicaemia, chronic liver disease and cirrhosis, essential hypertension and hypertensive renal disease (hypertension), Parkinson’s disease, and pneumonitis due to solids and liquids. Thus, we can group those causes into three incidents: 1: accidents (unintentional injuries), 2: suicide (intentional self-harm), and 3: diseases.
Let γ il be the probability that one person at physiological age i presents the incident l, where l∈{1,2,3}, but does not die within a period of 1 year, however, it is important to note that this incident causes a decrease in his/her capacities to adapt to the environment. These probabilities can be obtained as follows:
 $$\gamma _{{il}} {\,\equals\,}{{{\rm Total}\,{\rm number}\,{\rm of}\,{\rm deaths}\,{\rm due}\,{\rm to}\,{\rm the}\,{\rm incident}\,l\,{\rm at}\,{\rm age}\,i} \over {{\rm Total}\,{\rm number}\,{\rm of}\,{\rm deaths}\,{\rm at}\,{\rm age}\,i}},\quad l{\,\equals\,}1,2,3.$$
Let γ
i
be the probability of having at least one incident, i.e.,
 $$\gamma _{i} {\,\equals\,}\mathop{\sum}\limits_{l{\,\equals\,}1}^3 \gamma _{{il}} {\minus}\gamma _{{i1}} \gamma _{{i2}} {\minus}\gamma _{{i1}} \gamma _{{i3}} {\minus}\gamma _{{i2}} \gamma _{{i3}} {\plus}\gamma _{{i1}} \gamma _{{i2}} \gamma _{{i2}} $$
. Then, the transition probabilities are given by
 $$p_{{ij}} {\,\equals\,}\left\{ {\matrix{ {\!\!\!\!\!\!\!\!\!(1{\,\minus\,}\mu _{i} )s_{i} (1{\,\minus\,}\gamma _{i} )\quad \quad \quad \!\!\!\!\quad \:{\rm if}\:\quad j{\,\equals\,}i} \cr {(1{\,\minus\,}\mu _{i} )(1{\,\minus\,}\gamma _{i} )(1{\,\minus\,}s_{i} )\quad \:{\rm if}\:\quad j{\,\equals\,}i{\plus}1} \cr {(1{\,\minus\,}\mu _{i} )\gamma _{i} t_{{ij}} \quad \quad \quad \quad \quad \!\!\quad \:{\rm if}\:\quad j\geq i{\plus}2} \cr } } \right.$$
where, we suppose that if the person presents an incident, the transition probability between ages is inversely proportional to its distance (for obtaining this value we need history incidents for each physiological age), then t ij has the form given in (19).
Thus, we have a hypothetical population with 111 physiological ages and a death state, to which we can associate a discrete time Markov chain that models the ageing process with transition matrix P={p
ij
}
i,j
(for 1 year). Now, given this empirical stochastic matrix P, we need to find a matrix
 $$\Lambda \in \cal D$$
(where
 $$\cal D$$
denote the set of all intensity real matrices of dimensions (n+1)×(n+1)) such that P=exp(1·Λ). We define
 $${\cal P}{\,\equals\,}\{ {\rm exp}(1 \cdot \Lambda )\!\mid\!\Lambda \in \cal D\} $$
the set of all the transition matrices that correspond to the discrete time observations of the Markov jump processes. The problem of identifying the set
 $$\cal P$$
is called the embedding problem, which means that
 $$\cal P$$
is very complicated to obtain, except for two dimensions. Another point is that the matrix exponential function is not injected in all the parts of its domain. Davies (Reference Davies2010) has worked the embeddability, uniqueness of the embedding, and the effects of data-sampling error for stochastics matrices. In Theorem 1 by Bladt & Sorensen (Reference Bladt and Sorensen2005) are given results on existence and uniqueness of the maximum likelihood estimator of Λ. Following Davies (Reference Davies2010), we call a stochastic matrix P embeddable if
 $$P\in \cal P$$
. Now, we define
 $${\cal G}{\,\equals\,}\left\{ {{\cal G}\in {\cal M}_{{(n{\plus}1){\times}(n{\plus}1)}} \left( {\Bbb R} \right)\!\mid\!\mathop{\sum}\limits_j^{n{\plus}1} {G_{{ij}} {\,\equals\,}0\,{\rm for}\,{\rm all}\,i} } \right\}$$
where
 $${\cal M}_{{(n{\plus}1){\times}(n{\plus}1)}} \left( {\Bbb R} \right)$$
denote the set of real matrices of dimension (n+1)×(n+1). Since our P is a stochastic and upper triangular matrix, we can considerer the case where Spec(P)∩(−∞,0]=∅, and by Proposition 1 of Davies (Reference Davies2010) we have
 $$\Gamma {\,\equals\,}{\rm log}\left( P \right)\inG$$
The problem is that
 $$\Gamma \zcansls{\in}D$$
. For this, if we define
 $$\Lambda _{{ij}} {\,\equals\,}\left\{ \matrix{ \Gamma _{{ij}} \quad \:{\rm \quad \,\, \quad \quad if}\:\quad i\,\ne\,j\quad \:{\rm and}\:\quad \Gamma _{{ij}} \geq 0 \hfill \cr 0\quad \:{\rm \quad \,\,\,\,\, \quad \quad if}\:\quad i\,\ne\,j\quad \:{\rm and}\:\quad \Gamma _{{ij}} \,\lt\,0 \hfill \cr {\minus}\mathop{\sum}\nolimits_{j\,\ne\,i} \Lambda _{{ij}} \quad \:{\rm if}\:\quad i{\,\equals\,}j \hfill \cr} \right.$$
by Theorem 12 of Davies (Reference Davies2010) we have that
 $$\mid\mid\!\Gamma {\,\minus\,}\Lambda \left| {\left| {{\,\equals\,}{\rm min}\{ } \right|} \right|\Gamma {\,\minus\,}D\!\mid\mid\,\colon\, D\in \cal D\} ,{\rm where}\mid\mid \cdot \mid\mid$$
represents the norm-
 $$\ell _{\infty} $$
. Then, given P by the expression (21), we can obtain Γ=log(P) and thus Λ. Using this Λ, we generate historical information of the ageing process of the population of the United States at observed discrete times.
Now, given the records (discrete times) of the ageing process, we use the Algorithm 2 to estimate the corresponding infinitesimal sub-generator Q , considering n=111, M=1,000, T=50, Δ=1, K=50, L=1, I=100, b=20, and therefore to find the estimated PH parameters, used for building the mortality tables, and to calculate the corresponding life expectancy.
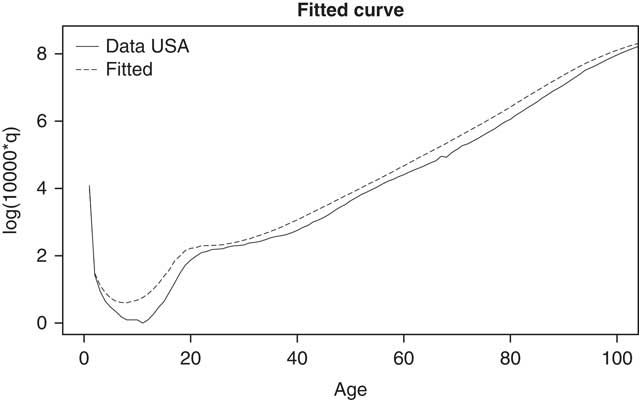
In Figure 5 we plot the estimation of the mortality tables using the equation (4) and the observed death rate considering the year 2013. Because of the way it was built the example presented in this section, we can observed four very different mortality patterns, since the idea was to expose the influence of the risk factors included in our model. The Figure 5 shows mortality increases at ages 15–35 years, and the increasing susceptibility with ageing. Note also that in order to see these patterns in a better way, in this figure we used the log(10,000×q), where q is the probability of death, as Lin & Liu (Reference Lin and Liu2007) presented some of their graphics.
Estimation of mortality tables for United States, 2013.

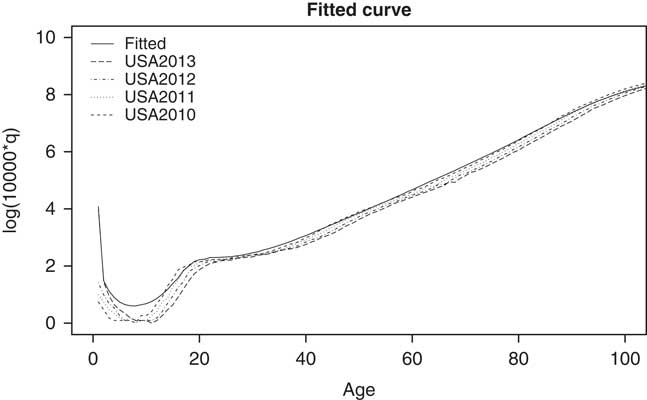
If we also plot the data from the years 2010, 2011, and 2012 (see Figure 6), we observe that the estimation is not always biased upwards as it is for 2013.
Estimation of mortality tables considering different years.

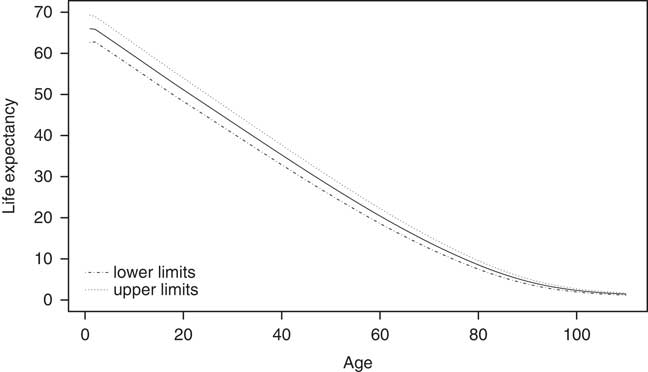
Since the model presented in this work considers a law of probability to modelling remaining life time, and using the tool presented in section 5, we can make inference about the parameters of the probability distribution. We calculate the life expectancy as the first moment of the PH distribution following the properties presented in section 3. The Figure 7 shows the estimation of the life expectancy considering the year 2013.
Estimation of the life expectancy.

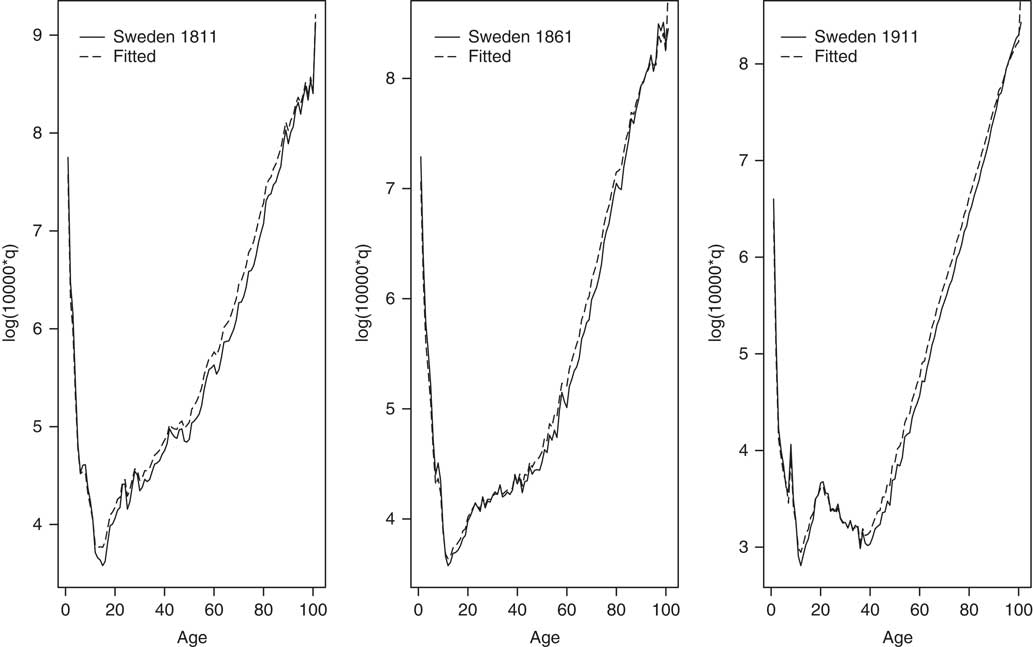
Finally, as in Lin & Liu (Reference Lin and Liu2007), we present the fitting curve for the Swedish cohorts of 1811, 1861, and 1911. The construction of the physiological ages for the Swedish population was made following the idea presented in this section for physiological ages of the US population in 2013. The Figure 8 shows the results considering n=101, M=1,000, T=50, Δ=1, K=50, L=1, I=100, and b=20.
Fitted curves for Swedish cohorts of 1811, 1861, and 1911.

8. Conclusions
In this paper we have considered the ageing process to propose a new mortality model.
The main contributions of this paper are the following. We used the concept of physiological age in order to propose a more general mortality model using PH distributions. The estimation of the parameters of the model, when the data is recording in discrete times (real scenario), was performed using a SEM algorithm which in turn uses the bisection method. Moreover, we proposed an important and innovative idea to construct a physiological age index using the main risk factors.
The results using real data make evident that the proposed model fits very well the human mortality when there are records of risk factors.
Furthermore, it is possible to extend this model if we assume that the risk factors are modelled by a stochastic process and seen the ageing process as a stochastic process in random environment.
Acknowledgements
The authors would like to acknowledge the support from the Sistema Nacional de Investigadores of CONACYT, PRODEP UJED-PTC-100, and PAPIIT-IA105716. The authors further thank the reviewers of this article for their valuable observations.