


Introduction
A study of the seismic signals produced by avalanches allows us to characterize them with a view to monitoring avalanches in areas or at times when human observation is not possible. This study is the first step towards designing a system for seismic automatic detection and recognition of avalanches in real time. In this regard, experimental devices for the automatic acquisition of seismic signals were installed during the last decade in the Catalan Pyrenees and French Alps (Reference Sabot, Martinez, Suriñach., Olivera, Gavaldà. and Sivardière.Sabot and others, 1995; Reference Leprettre., Navarre and Taillefer.Leprettre and others, 1996). The a posteriori analysis of seismic signals obtained automatically over a wide avalanche-study area in the Pyrenees, by the Institut Cartogràfic de Catalunya since 1988, and attributed to avalanches indicates that only part of an avalanche is recorded (Reference Sabot, Martinez, Suriñach., Olivera, Gavaldà. and Sivardière.Sabot and others, 1995). The duration of these seismic signals ranged from 2 to 20 s, whereas the expected duration should exceed 40 s because the length of the avalanche paths in the study area was about 2 km. In order to explain this phenomenon and improve our understanding of these seismic signals, seismic data and video images of artificially released avalanches were recorded simultaneously. This has enabled us to control some of the information (duration of the avalanche, mean flux velocity, avalanche temporal evolution, etc.) which remains unknown when recording of naturally released avalanches is done without human observation. In this paper, we compare the seismic data and video images for two artificially released avalanches. In addition, we verify the avalanche simulation obtained by numerical modelling using these video images and analyse the seismic signals from the perspective of the modelling results.
Site and Measurements
Our experimental site is at the Boí Taüll ski resort (Pyrenees, northeast Spain), where the artificial release of avalanches is used to protect the ski area (Fig. 1). The two avalanches studied we re artificially released by explosives during the 1995–96 season. The first (“Raspes Roies” path) was triggered at an altitude of 2725 m a.s.l. and ran down about 840 m over a regular open slope with a convex profile oriented towards the west; the vertical drop was about 500 m (Fig. 2a). The snow involved had a density that exceeded 200 kg m−3. The avalanche was dense and formed a powder cloud that did not travel very much further than the dense part; the deposit showed a rough aspect and included snow balls. The seismic station which recorded this avalanche was at the bottom of the avalanche path 1500 m from the explosion impact point.
Location map of the Boí Taüll ski resort (northeast Spain).

The second avalanche (“Cervi” path) was triggered at an altitude of 2600 m a.s.l. and ran down 800 m with a vertical drop of 375 m (Fig. 3a). The snow involved had a density lower than 200 kg m−3 near the avalanche deposit. The avalanche ran over a sharp, convex slope rupture, incorporated air and formed a powder cloud. The deposit was rough and included snow balls about 1 m3 in size. The seismic station was 900 m from the explosion impact point opposite the path.
The seismic signals and related video images were recorded using a common time base during both avalanches. The seismic signals were acquired in three dimensions using a standard seismic station with a sensitivity velocity response that was flat in the 2–40 Hz frequency band; the sampling frequency for the signals was 100 samples s−1.
Seismic Study
Ground-Wave Velocity
The seismic records obtained in these experiments consist of two parts: the signal produced by the explosion and the signal due to the avalanche. The explosion signal is composed of three different wave trains which are easy to identify: those waves propagating along the ground, air waves (from the blast) and echo waves. The situation of the explosion impact point was confirmed by determining the azimuth from a study of the ground velocity vector of the first wave train. The propagation velocities of the seismic waves along the ground were estimated from the distance between the station and the explosion impact point deduced from both the cartography and the difference between the arrival times of the ground- and air-wave trains of the explosion. These velocities are about 2250 m s −1 for the “Raspes Roies” avalanche and 2750 m s−1 for the “Cervi” avalanche. Consequently, we can approximate the propagation velocity of the ground waves as 2500 m s−1 for the Boí Taüll site. These low velocity values agree with those of lhe most superficial crustal layers, which are those that are involved in this study.
Comparison with Video Images
Comparison of the recorded seismic signals and the corresponding video images allows us to determine the origin of the different seismic wave trains. For this reason, the time base for these two types of information was shifted by taking into account the measured distances and the calculated mean ground-wave velocity.
The most prominent seismic waves generated by the “Raspes Roies” avalanche are shown in Figure 2b. No significant amplitudes corresponding to the avalanche are observed in the first 20 s after the explosion. The wave train of 12 s duration corresponds to images when the avalanche began to form a snow cloud and crossed the change of slope in the topography (1 in Fig. 2). In this part, the maximum velocity of the avalanche was reached, as deduced from a simulation process. The wave trains of the last part of the signal correspond to the images of the avalanche-stopping stage, suggesting that the energy could be associated with the above mentioned stage (2 in Fig. 2).
(a) Cartography of the Raspes Roies avalanche on the I.C.C. map (scale 1:5000). E. Explosion impact point, S. Seismic station. 1. Zone where the avalanche slope and the avalanche type change. 2. Avalanche-stopping zone, (b) Vertical, north-south and east-west components of the “Raspes Roies” seismic signal. 1. Changes in avalanche slope and type; 2. Phenomena associated with the avalanche-stopping stage (note that the seismic signals corresponding to the explosion have been excluded.)

The vertical component of the seismic waves generated by the “Cervi” avalanche is shown in Figure 3a. In this case, it is possible to discriminate between the avalanche seismic-signal and the ambient noise 25 s after the start of the avalanche. The first group of wave trains corresponds to the different impacts against the skilift masts (1–5 in Fig. 3a and b), whereas the last wave train of this group (H in Fig. 3) is associated with the impact of the Ilow against the maintenance hut for the skilift. Just as in the case of the “Raspes Roies” avalanche, the last part of the signal (A in Fig. 3a) corresponds to the images of the avalanche-stopping stage.
(a) Cartography of the “Cervi” avalanche on the I.C.C. map (scale 1: 5000). 1–5. skilift masts; E. Explosion impact point; S. Seismic station, (b) Vertical component seismogram of the “Cervi” avalanche. A. Phenomena associated with the avalanche-stopping stage. 1–5 and H. Impacts against the skilift masts and hut.

Numerical Modelling using Video Images
By studying the video images of the “Raspes Roies” starting zone and its stratigraphic profile, we observed that the powder part of the avalanche did not travel much further than the dense part, which is consistent with the density of the snow involved. Inconsequence, we consider that the powder part is negligible and assume the avalanche is dense for modelling purposes.
Numerical Model
Numerical simulation is used in modelling avalanche dynamics. To this end, a number of models viewing the avalanche from a rigid body to a fluid have been considered for the different types of avalanches by different authors (Reference Gubler.Gubler, 1989; Reference MarcoMarco, 1995).
A variety of two-dimensional models, considering the moving avalanche as a fluid flow or as a partially fluid flow have been tested by comparing different avalanche characteristics such as maximal flow velocities and run-out distances. The values obtained from the model computations have been compared with those measured in artificially released avalanches and in laboratory-scale avalanches (Reference GublerGubler, 1987; Reference Nishimura and Maeno.Nishimura and Maeno, 1987).
In this study, the avalanche was modelled in three dimensions on the assumption that it was a Bingham body. The equations describing the flow were obtained by vertical integration of the balance laws of mass and momentum Navier Stokes equations) assuming the pressure was hydrostatic and the rheological model was that of Bingham (Reference Naaim, Ancey. and BrugnotNaaim and Ancey, 1992). The equations obtained constitute a nonlinear hyperbolic system and show the assumptions of the shallow-water equations. In order to determine the friction terms, it was assumed that the velocity profile was independent of depth, which allowed us to neglect dissipation. The system of equations which governs the motion of the avalanche is:

where  h is the flow depth at a point. z is the orthogonal axis of the terrain, ϕx
and ϕy
are the slopes in the x and y directions, respectively. τc
is the critical stress arising from the Bingham model and the mean velocity is
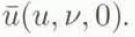
Application to the “Raspes Roies” Avalanche
The study was based on field observations. The topographic map of the domain was discretized as a regular mesh covering the whole surface. This was achieved by digitizing the contour lines of the study domain and using an interpolation method for meshing. ’The evolution of the mean and maximum velocities (calculated for each step and on the whole avalanche) (Fig. 4) were obtained by taking into account the starting zone that was defined by the video images and the stratigraphic profile. A comparison between the simulated avalanche and the video images showed that the duration of the modelled avalanche was a little shorter than that observed, although the run-out distance was similar. The good results obtained in the simulation, in terms of the duration and run-out distance, allowed us to use the numerical model to understand the seismic signals from the avalanche. Comparison of the velocity profile of the simulated avalanche (Fig. 4), the seismic signal (Fig. 2b) and the video images showed that the first part of the signal (1 in Fig. 2b) corresponded to the change in the topographic slope and also to that part where the maximum velocity of the avalanche was reached. This part also corresponded to the image when the powder cloud was formed. The simulation also suggested that the second part of the seismic record (2 in Fig. 2b) corresponded to the avalanche-stopping stage.
Mean and maximum velocities for each time-step on the whole avalanche obtained by numerical simulation.

Image Processing
Studies of the dynamics of snow avalanches have produced many numerical models. However, the difficulty in measuring the parameters required for these models has hampered their validation. Image processing, increasingly used in the study of the dynamics of snow avalanches, can supply further information for these validations (Reference MarcoMarco, 1995). An active contour-tracking algorithm was used to obtain the images for the evolution of the “Raspes Roies” avalanche front and to compare them with the results of the simulation and with the seismic signals. After digitizing the image, preprocessing to correct the apparent motion was carried out. Next, a simple and original tracking algorithm, which uses an extraction contour algorithm (Reference Latombe, Ladret, Granada and P.Latombe and others, 1997) to segment the “Raspes Roies” avalanche, was applied.
Extraction Contour Algorithm
This algorithm makes use of the fact that the boundary between an avalanche and the rest of the image is the most energetic part of the image. Computation of the image energy and determination of its maximum variation allow us to adjust an initial contour to the real one.
The algorithm can be summarized as follows. A first contour as near as possible to the real one is selected. Subsequently, the searching contour algorithm is applied. This algorithm consists of (a ) computing energies, (b) processing each point in accordance with the increase in energy, (c) adding or deleting points in order to respect the distance between the points and, finally, (d) cleaning up double points.
Tracking Algorithm
The tracking algorithm is naturally linked to the extraction contour algorithm. A block diagram of the algorithm is shown in Figure 5. For each image, we use a dilated contour of that obtained from the previous image to initiate the extraction contour algorithm. For this kind of image, where the maximum energy is reached by the tracking object, we are obliged to dilate the previous contour before processing the extraction contour algorithm. In terms of image processing, the algorithm introduces the idea of temporal smoothness in the energetic term.
Diagram of the tracking algorithm for image processing.

Application to the “Raspes Roies” Avalanche
The algorithm was applied to a sequence composed of 125 filmed images on the “Raspes Roies” avalanche, and the evolution of the avalanche tracked during; its flow down the slope of the mountain. Three images are shown in Figure 6. In each of them the computed contour is traced with a white line. The first image (Fig.6a) was taken at the start of the sequence, close to the initial contour, and the avalanche contour is perfectly defined. The second image (number 125 in the sequence) corresponds to the maximum extent of the avalanche. Its contour is always traced with precision (Fig. 6b). Finally, the third image shows different contours between the first image and the last one of the sequence (Fig. 6c). The results obtained indicate that the algorithm developed is well suited to our images, yielding very satisfactory results, and constitutes a validation tool for the numerical modelling of snow avalanches. Nevertheless, in order to improve the method, the sequence of contours must be mapped in three dimensions. This involves identifying a sufficient number of points on the image and on the Digital Terrain Model.
Contours of the “Raspes Roies” avalanche-flow sequence, (a) Start, (b) end and (c) different contours between the first and last images.

The similarity between the contours of the avalanche simulation and the video images, even when a change from two to three dimensions is not performed, confirms our conclusions about the validity of the simulation and consequently about the origin of the first part of the seismic signals of the avalanche. However, as the video images only consider the avalanche contour, this method cannot be used to account for the seismic signals generated during the avalanche-stopping stage.
Conclusions
Three different methods of avalanche analysis were applied simultaneously to an avalanche which occurred in the “Raspes Roies” path: seismic measurements, analysis of video images and numerical modelling were performed for the same event. The study has allowed us to account for the differences between the duration of the avalanche and that of the seismic signal. Only some parts of the avalanche generated seismic signals. The seismic signals recorded corresponded to changes in the avalanche type and path slope, interaction with obstacles and to phenomena associated with the stopping stage of the avalanche. These results account for the differences in duration of the avalanches and the corresponding seismic signals observed in records obtained automatically in real time without an observer. Moreover, numerical simulation of dense avalanches will be a useful tool in the absence of video images. Nevertheless, a transformation of the two-dimensional images into three-dimensional representation is necessary in order to achieve a direct comparison between the numerical models and the results of image processing.
Acknowledgements
This study was supported by the CICYT Project (No. AMB93-0837), the Human Capital and Mobility Program (contract No. CHRX-CT93-0307 DG 12 COMA) and the SAME program (ENV4-CT96-0258). The experiments at Boí Taüll were carried out with the kind collaboration of the Boí Taüll ski resort. We wish to thank J. M. Vilaplana for his encouragement and the avalanche team of the I.C.C. for their technical assistance and support during the field measurements. We are indebted to H. Gubler and J. Schweizer for their suggestions and comments which have greatly improved the manuscript.



