

INTRODUCTION
Meta-analysis is a statistical method that can appear complex and intimidating at first glance (Rosenthal & DiMatteo, Reference Rosenthal and DiMatteo2001). But at its heart, a meta-analysis calculates the mean and variance of a set of numbers. The numbers are not individual scores, however, as researchers are accustomed to averaging, but instead are statistics reported across studies within a particular research domain, such as a set of study correlations, standardized mean differences between groups, or odds ratios. For at least 150 years, scientific researchers have engaged in the practice of averaging effects found across a set of studies or scientific observations; however, meta-analysis has developed relatively recently as a formalized statistical method for doing so (for information on the development of meta-analysis, see Borenstein, Hedges, Higgins, & Rothstein, Reference Borenstein, Hedges, Higgins and Rothstein2009; Hunter & F. L. Schmidt, Reference Hunter and Schmidt2004; for early works on meta-analytic methods, see Cooper & Rosenthal, Reference Cooper and Rosenthal1980; Glass, Reference Glass1976; Hedges & Olkin, Reference Hedges and Olkin1985; Rosenthal, Reference Rosenthal1978; F. L. Schmidt & Hunter, Reference Schmidt and Hunter1977).
Averaging quantitative effects across studies through meta-analysis overcomes three major problems of narrative or qualitative reviews in second language (L2) research. The first problem is having to wrestle with conflicting findings across studies: The magnitude of reported effect sizes across studies can vary wildly, ranging from large positive effects to large and possibly counterintuitive negative effects. Authors of narrative reviews may be correct in attributing such conflicting findings to the unique samples or theoretical orientations of each study, but an important competing explanation may be a simpler one involving sampling error variance. More specifically, small samples alone can contribute to large fluctuations in study outcomes, independent of the particular theories, samples, measures, or settings that were summarized. Researchers have a natural tendency to interpret significant statistics no matter what the sample size is (Tversky & Kahneman, Reference Tversky and Kahneman1971). This practice should generally be avoided because conceptually, small samples usually represent very little of the population of interest, and empirically, small-sample statistics (even significant ones) are highly unstable. However, small samples do have the potential to contribute meaningfully to the average meta-analytic effect across studies, given that the average is based on a cumulative sample size that is both conceptually representative of the population of interest as well as statistically significant.
The second problem of narrative reviews is an overreliance on the results from traditional null hypothesis significance testing (NHST). NHST has long since enjoyed a privileged status as the standard for empirical evidence (and, to some extent, publishability) in the field of second language acquisition (SLA), yet over five decades and thousands of pages of general debate on NHST have yielded many critics and few supporters (e.g., Balluerka, Gómez, & Hidalgo, Reference Balluerka, Gómez and Hidalgo2005; Lykken, Reference Lykken1968; F. L. Schmidt, Reference Schmidt1996). Applied linguists have also joined the fray, citing the weaknesses of NHST (Crookes, Reference Crookes1991; Ellis, Reference Ellis, Norris and Ortega2006; Larson-Hall, Reference Larson-Hall2010; Lazaraton, Reference Lazaraton1991; Norris & Ortega, Reference Norris, Ortega, Norris and Ortega2006, Reference Norris and Ortega2007; Plonsky, Reference Plonsky2009), and we similarly argue that progress in SLA will continue to be impaired by NHST until there is a widespread reform emphasizing effect sizes and practical significance, similar to what is already taking place in psychology, education, and other social sciences (e.g., see Wilkinson & the Task Force on Statistical Inference, Reference Wilkinson1999).
The root of the problem of NHST is that it reduces research findings into a dichotomy of statistical significance or nonsignificance based on the p value—and nothing more. This is problematic because statistical significance does not reflect the size or the importance of an effect. A p value for a t test, for instance, is a function of four numbers: the sample mean difference, the sample variances of the groups, the alpha level, and the sample size. Researchers can change any of these four numbers (incidentally, legitimately or deviously), to create a small p value and reject the null hypothesis, thereby achieving fame and fortune (or hopefully publication, at least). But the size or practical significance of an effect is what should matter, not only its statistical significance. As Tukey (Reference Tukey1991) said in the context of finding a small p value, “the effects of A and B are always different—in some decimal place—for any A and B. Thus asking ‘are the effects different?’ is foolish” (p. 100). Once early research efforts provide empirical support for the presence of a relationship, it usually becomes important to understand magnitudes and patterns of relationships as well as the circumstances that affect them.
The third problem with narrative review concerns the limitations of the reviewers themselves, who even as experts are fallible human decision makers who can be inconsistent in the way they encode and interpret empirical findings across studies. They may also weigh quantitative findings more heavily for those studies whose authors make a verbally compelling case for their research or publish in prestigious journals, even though other empirical findings might be more informative, yet present a less interesting story line and/or reside in less-visible journals. To be clear, we are not implying that the expertise of a reviewer should ever be divorced from the process of a meta-analytic review; instead we are saying that experts reviewing L2 research should consider using meta-analysis as an important tool that may inject a more objective and systematic approach into the review process.
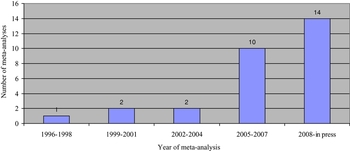
This article is fortunate to accompany the rise in prominence of meta-analysis in SLA (see Figure 1). We first highlight the many potential benefits of meta-analysis in the research enterprise, referring to meta-analyses conducted in SLA as cogent examples. We then outline the general process of conducting a meta-analysis, discussing critical steps and associated decision points that SLA researchers will inevitably encounter. We conclude with several take-home points regarding the promise and prospects of meta-analysis for the discipline.
Growth of meta-analysis in L2 research.

USES AND POTENTIAL BENEFITS OF META-ANALYSIS
In its simplest form, meta-analysis quantifies and tests correlations between variables (such as L2 exposure and comprehension) or mean differences between identifiable groups (such as age, proficiency level, or experimental condition). Even relatively simple meta-analyses like these can be quite valuable as a quantitative summary of previous research findings. The first meta-analysis of L2 research, for instance, calculated the average correlation between measures of self-assessment and L2 achievement across 11 previous studies (r = .63; Ross, Reference Ross1998). More commonly, SLA research involves experimental and quasi-experimental designs that measure the effect of a treatment on an outcome (Lazaraton, Reference Lazaraton2000; Teleni & Baldauf, Reference Teleni and Baldauf1989). For example, a recent meta-analysis provides an estimate of the overall effect of corrective feedback on L2 gains (d = .61; Li, Reference Li2010). In mature L2 research domains, meta-analysis can also be extended to test multiple hypotheses, thereby enabling researchers to test theoretical models broader than those contained in any of its constituent studies (Becker, Reference Becker, Cooper, Hedges and Valentine2009).
Meta-analysis clearly has much to offer by summarizing accumulated research and evaluating existing theoretical models; however, its influence should by no means be limited to retrospective accounts of the literature. On the contrary, a thorough meta-analysis catalogs the major substantive and methodological features of its primary studies; thus, one can learn from meta-analysis about the benefits and drawbacks of different designs and motivating theories across studies to determine what type of future research appears to be more productive. This has already happened in SLA meta-analyses in two ways.
First, based on their meta-analytic findings, some L2 researchers have called for additional studies to enhance the robustness, generalizability, and external validity of findings with different learner groups (e.g., preadolescents) and treatments (e.g., types of error correction; Poltavtchenko & Johnson, Reference Poltavtchenko and Johnson2009; Russell & Spada, Reference Russell, Spada, Norris and Ortega2006). Second, Lee and Huang (Reference Lee and Huang2008) concluded from their meta-analysis that studies of input enhancement, and SLA research in general, needs to report their descriptive statistics, methods, and procedures more comprehensively if SLA meta-analyses are to reach their full informative potential (e.g., Norris & Ortega, Reference Norris and Ortega2000; Plonsky, in press).
Meta-analyses in SLA should also be useful for identifying specific variables, settings, and samples that have been underresearched yet can contribute to more integrated and well-developed theoretical models. Meta-analysis is a retrospective summary of research. A prospective meta-analysis is one that could be informed by a retrospective meta-analysis, where a series of planned empirical studies target specific research questions, with those findings to be accumulated in a future meta-analysis (see Berlin & Ghersi, Reference Berlin, Ghersi, Rothstein, Sutton and Borenstein2005). The hope of a prospective meta-analysis is that the broad collaborative planning efforts of researchers would be of higher quality in terms of theory and research design. Because a prospective meta-analysis might yield greater empirical returns than an isolated set of primary studies, it may also receive greater interest and support by granting agencies.
CONSIDERATIONS AND CHOICES
Although meta-analysis is a data-driven procedure, the expert role of the SLA meta-analyst is a critical element, as we have mentioned (see Bangert-Drowns, Reference Bangert-Drowns1995; Ortega, Reference Ortega, Paltridge and Phakiti2010). In fact, at the heart of this review lies the unavoidable interplay between researcher judgment and the meta-analysis procedures that require such judgment (Kavale, Reference Kavale1995; Norris & Ortega, Reference Norris and Ortega2007; Oswald & McCloy, Reference Oswald, McCloy and Murphy2003; Sutton & Higgins, Reference Sutton and Higgins2008). Therefore, rather than prescribing one best practice for conducting a meta-analysis in SLA, we join other authors in emphasizing the fact that there are multiple options at each stage in carrying out a meta-analysis, each characterized by different strengths and weaknesses (see Hall & Rosenthal, Reference Hall and Rosenthal1995; Preiss & Allen, Reference Preiss and Allen1995; Wanous, Sullivan, & Malinak, Reference Wanous, Sullivan and Malinak1989).
Defining the Research Domain
The first step in carrying out a meta-analysis is foundational: defining the conceptual umbrella of SLA research whose findings will be located and summarized. Just as primary researchers should carefully define the population of language learners and appropriately measure and/or manipulate relevant variables, meta-analysts must also delimit the research domain of interest to be investigated, which often requires balancing the prescriptive domain implied by a theory (or theories) with the descriptive domain defined post hoc by the set of studies on hand.
There are very different approaches one may take to this end. Consider the 11 L2 meta-analyses investigating the effectiveness of corrective feedback. Most meta-analyses in this area have been concerned with correction of spoken errors. One meta-analysis, however, focused on the effects of different types of both oral and written error correction, including recasts and metalinguistic feedback, but only with respect to gains in L2 grammar (d = 1.16; Russell & Spada, Reference Russell, Spada, Norris and Ortega2006). Of three recent meta-analyses, one took a broad approach by including dissertations and studies of computer-mediated feedback (d = .61; Li, Reference Li2010), while two others were much narrower, focusing only on recasts (Miller & Pan, Reference Miller and Pan2009) and the effects of oral feedback in classroom settings (d = .74; Lyster & Saito, Reference Lyster and Saito2010). Seeking to settle perhaps one of the most highly polemic debates in SLA (see Chandler, Reference Chandler2004; Ferris, Reference Ferris1999, Reference Ferris2004; Truscott, Reference Truscott1996, Reference Truscott1999, Reference Truscott2004), two meta-analyses summarized the accumulated effects of corrective feedback on L2 writing (Poltavtchenko & Johnson, Reference Poltavtchenko and Johnson2009; Truscott, Reference Truscott2007). And finally, five meta-analyses have included studies of error correction within larger bodies of research on the effectiveness of instruction (Norris & Ortega, Reference Norris and Ortega2000, replicated by Goo, Granena, Novella, & Yilmaz, Reference Goo, Granena, Novella and Yilmaz2009; Spada & Tomita, Reference Spada and Tomita2010) and on the effects of L2 interaction (Keck, Iberri-Shea, Tracy-Ventura, & Wa-Mbaleka, Reference Wa-Mbaleka2006; Mackey & Goo, Reference Mackey, Goo and Mackey2007). Our objective in pointing out this flurry of meta-analyses that include studies of corrective feedback is to illustrate two general points. First, many if not most theoretical and empirical questions in SLA can be addressed informatively at the meta-analytic level; second, even SLA meta-analyses in the same general domain can produce different results and interpretations, depending on how the L2 constructs of interest are defined.
Literature Searching
After deciding which constructs, group differences, theoretical relationships, experimental designs, and publication types to include in a meta-analysis, the search for studies that meet those criteria begins. In the same way that the method of recruiting participants affects the generalizability of a primary study's findings, the process of finding the primary studies that might be included in a meta-analysis requires principled and thorough literature-searching techniques. In this age of the Internet, a large variety of electronic databases and resources, both formal and informal in nature, are available to the meta-analyst. We would recommend searching in multiple ways, risking a high level of redundancy in order to ensure that any studies unique to a resource are retrieved.
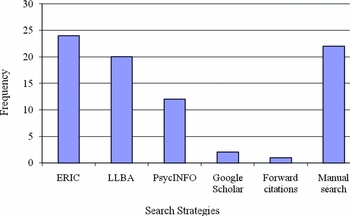
As shown in Figure 2, the most popular database among SLA meta-analysts (24 out of 27) has been the Educational Resources Information Center (ERIC), followed by Linguistics and Language Behavior Abstracts (LLBA) and PsycINFO. Using resources such as Web of Science and Google Scholar that provide forward citations (i.e., the references to those who cited a particular study) is another common practice in present-day meta-analysis (White, Reference White, Cooper, Hedges and Valentine2009). Supplementing electronic database searches, older techniques are just as important, including manually scouring book chapters, journal archives, conference programs, and technical reports, requesting manuscripts from individual researchers, and asking prominent colleagues in the field if they know about any manuscripts in progress, in press, or on the scrap heap of statistical nonsignificance. The process of the entire literature search should be cataloged as it occurs, lest it be forgotten; then the process should be summarized and reported to inform readers’ judgments about the nature and appropriateness of the meta-analysis.
Search strategies in meta-analyses of L2 research.

Study Inclusion Criteria
An important choice in this early stage of a meta-analysis involves whether to filter out the low-quality studies before proceeding. Some scholars have recommended this procedure, citing “garbage in, garbage out,” meaning that the quality of meta-analytic results depends on the quality of primary research that goes into the analysis (e.g., Eysenck, Reference Eysenck1984; Moncrieff, Reference Moncrieff1998; Slavin, Reference Slavin1986). That said, the majority of meta-analysts across disciplines have tended to err on the side of incorporating as many study effects that are relevant to a research domain as possible (see Cooper, Reference Cooper2003; Ortega, Reference Ortega, Paltridge and Phakiti2010). This approach is recommended for the fact that the meta-analysis can be cited as “comprehensive,” and no one can then accuse the meta-analyst of applying an idiosyncratic or subjective filter to the literature base. A comprehensive meta-analysis can also be thought to have “robust” results—or perhaps a more balanced statement is to say that comparing apples to oranges is sensible when the goal is to learn about fruit (Smith, Glass, & Miller, Reference Smith, Glass and Miller1980). A notable exception in SLA to the principle of inclusiveness is a meta-analysis that applied strict methodological criteria when selecting studies of the effectiveness of written corrective feedback (Truscott, Reference Truscott2007). This decision affected both the size and even the direction of the results, when compared to Poltavtchenko and Johnson's (Reference Poltavtchenko and Johnson2009) inclusive meta-analysis of written corrective feedback (d = −.16 vs. d = .33, respectively). Specific exclusion criteria are always subject to debate, however, and any difference in effect sizes based on applying study exclusion criteria may be partially due to reducing the number of studies, independent of the level of study quality (e.g., k = 5 vs. k = 13 studies in the previous example).
An inclusive approach also enables the meta-analyst to examine study quality in a more empirical manner. Researchers can rate studies on one or more dimensions of quality, such as the quality of the measures, samples, and study designs. More commonly in meta-analysis, quality is quantified by the psychometric characteristics of the studies, such as sample sizes and alpha reliability coefficients (Hunter & F. L. Schmidt, Reference Hunter and Schmidt2004). No matter how quality is quantified, quality indices can be correlated with effect sizes to determine their relationship (Cooper, Reference Cooper1998). They can also be used to weight each study outcome, such that higher-quality studies contribute more to the meta-analytic average than do lower-quality studies (Rosenthal & DiMatteo, Reference Rosenthal and DiMatteo2001; Valentine, Reference Valentine, Cooper, Hedges and Valentine2009).
Two L2 meta-analyses serve as examples for examining quality empirically. One meta-analysis conducted meta-analyses on subgroups of studies based on a number of methodological criteria that reflect study quality, such as the level of control in experimental studies (studies with tight control: d = .51, weak control: d = .38, not controlled: d = .59; Adesope, Lavin, Thompson, & Ungerleider, Reference Adesope, Lavin, Thompson and Ungerleider2009). Another meta-analysis found that studies that reported the reliability of their dependent measures tended to report higher effect sizes than studies that did not (d = .65 vs. d = .42; Plonsky, in press), suggesting that studies not reporting reliability coefficients may not have been as rigorous in nature.
Related to the issue in meta-analysis of the quality of primary studies in SLA is the decision of whether or not to exclude unpublished studies entirely (i.e., give them an implicit weight of zero). Some researchers may justifiably choose to include only peer-reviewed papers. Peer review helps ensure that published studies have met a standard of scientific quality as judged by experts in a given field (Burnham, Reference Burnham1990). Therefore, some SLA meta-analyses avoid sampling unpublished studies (e.g., Keck et al., Reference Keck, Iberri-Shea, Tracy-Ventura, Wa-Mbaleka, Norris and Ortega2006; Nekrasova & Becker, Reference Nekrasova and Becker2009), which also allows others to replicate the reported findings, if desired.
Other SLA meta-analysts instead decide to search for and include unpublished research. This is also a reasonable decision, and to date, approximately half of the 27 published and unpublished meta-analyses in SLA we review include unpublished studies, usually dissertations. One obvious statistical advantage of including unpublished studies is that the aggregated sample size increases, in turn increasing statistical power. Furthermore, meta-analyses containing unpublished research may be more robust, as mentioned, and also may be less vulnerable to distorted results due to publication bias, namely, the tendency of editors, reviewers, and individual researchers to favor only statistically significant or theoretically appealing findings (Moncrieff, Reference Moncrieff1998; Torgerson, Reference Torgerson2006; Vevea & Woods, Reference Vevea and Woods2005; for a comprehensive review of this issue, see Rothstein, Sutton, & Borenstein, Reference Rothstein, Sutton and Borenstein2005).
Publication Bias
To assess publication bias, the fail-safe N is a statistic estimating how many nonsignificant studies (presumably unpublished and stashed in the file drawer) would need to be added to render a statistically significant meta-analytic effect nonsignificant (Orwin, Reference Orwin1983). When the fail-safe N is high, that is interpreted to mean that even a large number of nonsignificant studies may not influence the statistical significance of meta-analytic results too greatly. Although the fail-safe N has been calculated in SLA meta-analyses (Abraham, Reference Abraham2008; Adesope et al., Reference Adesope, Lavin, Thompson and Ungerleider2009; Ross, Reference Ross1998), it is not a very precise measure of publication bias (Becker, Reference Becker, Rothstein, Sutton and Borenstein2005).
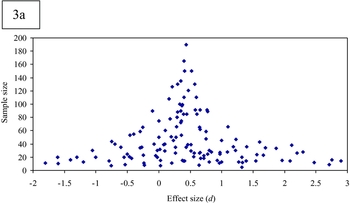
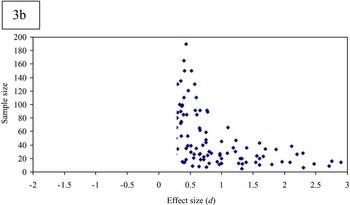
To get better sense of publication bias in SLA, researchers have promoted the use of the funnel plot (see Li, Reference Li2010; Norris & Ortega, Reference Norris and Ortega2000; Plonsky, in press). In the funnel plot, effect sizes are plotted on the x-axis, and their corresponding sample sizes (or some function there of) on the y-axis. Assuming there is a single population effect underlying the set of effect sizes, the plot should take the form of an inverted funnel (see Figure 3a). In other words, smaller-sample studies will have less statistical power and will tend to produce a wider range of effect sizes that fan out at the bottom of the plot, while larger samples have more statistical power and will cluster toward the overall mean at the top center of the plot. Asymmetric plots indicate (but do not guarantee) some form of publication bias. For example, a funnel plot may be positively skewed (see Figure 3b) because small-sample studies that had small and nonsignificant effects were never published or reported. Lumpy-looking funnel plots could indicate that moderator effects are present, where effects tend to be stronger for some subgroups of studies than for others (Sterne, Becker, & Egger, Reference Sterne, Becker, Egger, Rothstein, Sutton and Borenstein2005). Out of the seven meta-analyses in SLA probing the issue of publication bias, three discovered a bias in favor of publishing statistically significant results. Future meta-analyses in SLA should continue the practice of plotting the distribution of study effect sizes as a visual aid for discovering possible publication bias, outliers, or other patterns of notable effects.
Example of a funnel plot without the presence of publication bias (modified from Plonsky, in press).

Example of a funnel plot with the presence of publication bias (modified from Plonsky, in press).

Coding
The coding stage of meta-analysis involves developing a scheme or template used to record important characteristics of each of the studies that may be included for meta-analysis. Coding requires identifying the most important characteristics of studies being meta-analyzed, and then deciding on the best coding format so that the coding data are representative and accurate. Typically, the study characteristics that are coded concern the nature of the sample (e.g., demographic composition, proficiency level) and the type of research design (e.g., classroom vs. laboratory, repeated-measures vs. between-subjects designs). These characteristics may be used simply to describe the pool of studies being meta-analyzed, just as a researcher would describe a sample of people being studied; they may be used to conduct meta-analyses within certain subgroups; or both. It is especially important to code the statistics reported in each study, such as descriptive statistics (e.g., sample sizes, means, standard deviations), and effect sizes (e.g., d values, correlations). In general, it may be useful to err on the side of coding more study information rather than less.
It is difficult to overemphasize the importance of a thorough and appropriately designed coding sheet, because meta-analytic findings and interpretations critically depend on the data obtained from them. There is no “best” coding sheet, but there are some good examples that may serve as a starting point (e.g., Lipsey & Wilson, Reference Lipsey and Wilson2001). A properly developed coding sheet, and accurate coding using that coding sheet, depends heavily on the researcher's expertise and an intimate familiarity with the predictions of relevant SLA theory and literature. Consistent features across the studies themselves will suggest, but not dictate, the appropriate coding sheet to create. The coding sheet might in fact be modified as one engages in the coding process and uncovers important study characteristics that were not anticipated.
To ensure the accuracy of the coding process, some or all of the studies are often coded by additional trained raters. A measure of interrater agreement should be calculated to determine accuracy of the ratings across raters (e.g., intraclass correlation, percent agreement, or number of rating discrepancies and how they were resolved). In SLA, 19 (70%) of the 27 meta-analyses we reviewed employed multiple raters, yet only 16 (59%) reported some form of interrater agreement. There is clearly a fundamental need for meta-analyses in this field to use multiple coders and report interrater agreement as a matter of habit (see Orwin & Vevea, Reference Orwin, Vevea, Cooper, Hedges and Valentine2009, for an excellent discussion of the need for multiple raters given the biases of coding).
We also urge future meta-analysts to publish their coding sheets (reported in 13 of 27 SLA meta-analyses) along with a clear description of the coding procedure. Ideally, the completed coding scheme for each study could be provided as online supplementary material. By making the entire meta-analytic process transparent, with the data on all study effects and study characteristics available for public inspection, consumers of meta-analyses can better understand and interpret the results. They also can replicate findings, combine additional study information of their own, or reanalyze the data in a different way that may provide additional insights.
The coding stage of a meta-analysis also requires the researcher to make decisions about unreported information, such as for those studies where the effect sizes, or the statistics required to calculate them (means, standard deviations, correlations), are not available. Three choices present themselves for dealing with this issue, and whatever choice is adopted should be reported by the meta-analyst. The most time-efficient alternative, and the option chosen for all but three meta-analyses in SLA, is to ignore or remove studies that contain missing data. Despite the appealing convenience of simply excluding these studies, it may not be the best choice for SLA meta-analysts who often must rely on a preciously small sample of primary studies. (The median number of studies across all published meta-analyses of L2 research is 16; the median number of samples is 23.) An alternative to removing missing data is to impute them. Although several procedures have been developed for estimating unreported values (see, e.g., Higgins, White, & Wood, Reference Higgins, White and Wood2008), only one SLA meta-analysis has done so. A meta-analyst must judiciously weigh the potential benefits of imputing data that are missing for a study, in order to salvage the other data available for that study, with the potential drawbacks of making too many imputations and abstractions from the original data. A third choice, reported by only two meta-analyses in SLA, is to request missing data directly from primary researchers themselves. We recommend this approach, but of course, researcher compliance will vary widely from such data requests, for a variety of reasons that are either stated or implied.
Analysis
As with the other stages previously described, many options also exist at the analysis stage, once the meta-analytic study data have been coded and organized into a database. Some meta-analytic approaches are relatively simple but as a result may carry overly simplistic assumptions of the data. Other meta-analytic methods lie at the other extreme, containing statistical nuances that strive to reach ultimate levels of precision that are not warranted by the data and often sacrifice some interpretability at the same time. It is the meta-analyst's responsibility to find a balance between these two extremes, conducting analyses that summarize the data in a faithful, reliable, and informative manner.
Meta-analysis would be a relatively simple endeavor if each primary study produced a single effect size based on a single outcome measure, particularly if measures, samples, and study designs were all the same. Studies in SLA are rarely, if ever, mere replications of one another, though; they are extensions or modifications of past work and may investigate multiple relationships, multiple groups, multiple instruments, and multiple time points. It is appropriate to average multiple effects within each study's sample when the effects reflect the same phenomenon. However, when a set of SLA studies each investigate a similar pattern of effects (e.g., relationships on multiple variables and measures within the same theoretical model), then the pattern of effects within each study is sample-dependent and should be analyzed that way (Cheung & Chan, Reference Cheung and Chan2004; Gleser & Olkin, Reference Gleser, Olkin, Cooper, Hedges and Valentine2009).
Another common analysis issue is when studies report effect sizes in different metrics (e.g., correlation coefficients and d values). These need to be converted to the same metric prior to meta-analysis. For example, repeated-measures and independent-groups designs require different formulas for calculating effect sizes and can only be combined when their estimates of sampling variance are suited to the designs (Morris & DeShon, Reference Morris and DeShon2002; see also Morris, Reference Morris2008). Several resources provide appropriate formulas for converting effect sizes to a common metric prior to meta-analytic averaging (e.g., Lipsey & Wilson, Reference Lipsey and Wilson2001).
Weighted Averaging
When conducting the analysis, it is common to weight each study's effect size such that effects with higher weights will contribute more to the meta-analytic average. About half of the meta-analyses in SLA use weighted effect sizes, mostly weighting by sample size (nine studies) or similarly, weighting by the inverse of the sampling error variance (two studies). This form of weighting assumes that larger-sample effect sizes more accurately reflect true population effects and should therefore contribute more to the meta-analytic average than smaller-sample effects. Another common type of weighting is based on psychometric reliability, where studies with higher reliability contribute more to the meta-analytic average effect size. This weighting has been used in one SLA meta-analysis (Masgoret & Gardner, Reference Masgoret and Gardner2003). One can also create a weight that multiplies the individual weights for sample size, reliability, and other factors (see Hunter & F. L. Schmidt, Reference Hunter and Schmidt2004, and F. L. Schmidt, Le, & Oh, Reference Schmidt, Le, Oh, Cooper, Hedges and Valentine2009, for detailed information on this approach). That said, SLA meta-analyses would greatly benefit even from a relatively simple sample-size weighting of effect sizes.
Fixed Versus Random Effects Models
In addition to the weighted average effect size in meta-analysis, there are estimates of the variance of study effect sizes. The observed variance can be mathematically decomposed in several ways, depending on the choice of meta-analysis model an SLA researcher decides to use. A fixed effects (FE) model assumes that study effects are homogeneous, or sample realizations of only one population effect size. Any variation in effects across studies, therefore, is assumed to be due to sampling error variance or other statistical artifacts (e.g., differences in measurement reliability). The Q test for homogeneity of effect sizes is a post hoc test of this assumption; a statistically significant Q statistic (chi-square with k − 1 degrees of freedom) implies that the FE model does not hold, in other words, that study effects are heterogeneous even after artifacts are taken into account. A random effects (RE) model, by contrast, directly estimates this heterogeneity as a variance estimate (after accounting for sampling error variance). If the variance estimate has a confidence interval that does not include zero and is practically significant, then the conclusion is that study population effects are heterogeneous and do not have the same fixed value. A mixed effects model incorporates both fixed effects (variance in effects predicted by substantive variables) and random effects (unpredicted variance that remains).
If one had to select between the FE and RE model, the RE model is one that has a stronger conceptual motivation, because rather than assume homogeneity, the RE model tests for it (F. L. Schmidt, Oh, & Hayes, Reference Schmidt, Oh and Hayes2009). Only five meta-analyses in SLA appear to have mentioned the choice of model: In'nami and Koizumi (Reference In'nami and Koizumi2009) used a mixed effects model; Taylor, Stevens, and Asher (Reference Taylor, Stevens, Asher, Norris and Ortega2006), Li (Reference Li2010), and Goo et al. (Reference Goo, Granena, Novella and Yilmaz2009) calculated meta-analytic d values for both FE and RE models; and Norris and Ortega (Reference Norris and Ortega2000) chose the RE model.
We wanted briefly to describe FE and RE models because these are now entrenched in the broader meta-analysis literature. Our perspective, however, is that SLA meta-analysis is much more productive and useful for its weighting and averaging procedures, and the choice of meta-analysis model generally does not change the average very much. Neither the FE nor RE model allows one to make strong substantive inferences about the homogeneity or heterogeneity of study effect sizes. First of all, statistical power for homogeneity tests are notoriously low, meaning that based on homogeneity tests, one may often mistakenly conclude that homogeneity exists when effects across studies are heterogeneous and vice versa (Hedges & Pigott, Reference Hedges and Pigott2001; Oswald & Johnson, Reference Oswald and Johnson1998), except perhaps in cases where the number of studies and their sample sizes are atypically large (Sutton & Higgins, Reference Sutton and Higgins2008). Second, it is much better to use both theory and the available study data to suggest moderator analyses a priori, based on subgroups of studies, rather than conducting an overall test and conducting a subgroups analysis post hoc (e.g., a Q test or RE variance estimate).
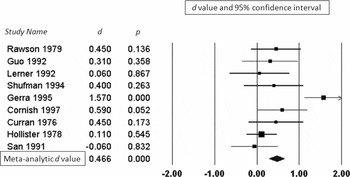
In short, we urge SLA researchers to avoid homogeneity tests and rely more heavily on a combination of statistics, data visualization, and solid knowledge of the literature being analyzed to determine whether (a) all studies are similar (e.g., strict replications), (b) subgroups of studies differ (e.g., second vs. foreign language learners), or (c) most studies are relatively similar but some are unique (e.g., most are K–12 studies along with a single large-sample military study). Note that these efforts rely in part on the use and interpretation of confidence intervals (CIs). A 95% CI provides the expected range of 95% of the sampling variability for a given effect size, where smaller CIs indicate more precise effects (Kline, Reference Kline2004). CIs can be built on a meta-analytic effect size or the effect size of an individual study. A CI for a meta-analytic effect size is based the number of effects in the meta-analysis, the variability in effects, and the sample size for each effect. The CI for the meta-analytic average effect across studies will usually be smaller than that for each constituent study effect—often much smaller when there are a large number of effects being meta-analyzed.
It is important to note that when examining the forest plot of effect sizes and CIs (shown in Figure 4 and Borenstein, Reference Borenstein, Rothstein, Sutton and Borenstein2005), nonoverlapping effect sizes indicate significant differences—but the converse is not true. When CIs overlap, the difference between effects may actually be statistically significant. For this latter situation, there are some rules of thumb for interpreting overlapping CIs appropriately (Cumming & Finch, Reference Cumming and Finch2005), or one may conduct a formal statistical test of the difference. Even with this caution in mind, the forest plot and funnel plot for publication bias are very useful visualization tools that can indicate meaningful patterns in the meta-analytic database.
Forest plot of d values and corresponding confidence intervals (from Borenstein, Hedges, Higgins, & Rothstein, Reference Borenstein, Hedges, Higgins and Rothstein2005, used with permission).

Software
Space limitations prevent a critical review of current software programs available for meta-analysis, but we would be remiss if we did not indicate that a variety of commercial software, shareware, and freeware programs exist for coding and organizing data from the literature, computing and converting effect sizes, computing the meta-analytic effects, performing moderator analyses, determining publication bias, and creating publication-quality graphs of forest and funnel plots. Several sources provide recent reviews of a wide range of software and Internet resources useful for conducting a meta-analysis (e.g., Borenstein et al., Reference Borenstein, Hedges, Higgins and Rothstein2009, chap. 44; Littell, Corcoran, & Pillai, Reference Littell, Corcoran and Pillai2008).
Interpreting Results from Meta-Analysis
Having completed the more objective data collection and statistical procedures of the meta-analysis, the meta-analyst is faced with the critical task of asking and addressing key questions such as these: “How do I interpret the meta-analytic effect sizes averaged across studies?” “How big is a ‘big’ meta-analytic effect size and how small is ‘small?’” “What are implications of the size and patterns of meta-analytic effect sizes for future research and practice?” (Kline, Reference Kline2004). Answers to interpretational questions about effect sizes depend on the meta-analysis itself but also require the expert knowledge and experience of the meta-analyst (Kirk, Reference Kirk1996). Several SLA meta-analyses have interpreted meta-analytic d values using relative terms (e.g., small, medium, large effects). One SLA meta-analysis, for example, took a more literal approach, explaining that the overall d value of .54 means that the average L2 reader with access to first language (L1) glosses outperformed the average L2 reader without L1 glosses by approximately half a standard deviation (Taylor et al., Reference Taylor2006).
As to whether the size of this and other d values are practically meaningful, meta-analyses in most research disciplines routinely default to Cohen's (Reference Cohen1988) benchmarks for standardized effect sizes that connect numerical results to interpretations of relative magnitude. Specifically, d = .20 is considered a small standardized difference between means, d = .50 is medium, and d = .80 is large (Cohen has also set benchmarks for other effect sizes, such as correlation and eta-squared in ANOVA; see Wolf, Reference Wolf1986, for a comparable set of standards). However, Cohen's rules of thumb were only originally intended to stimulate discussion and debate about the size and practical significance of effects found in research, rather than continuing with less informative discussions about p values and statistical significance.
Effect sizes are best understood when contextualized and interpreted with respect to other specific effects within a particular discipline (Valentine & Cooper, Reference Valentine and Cooper2003). One would not expect Cohen's standards of small, medium, and large effect sizes to be identical for SLA and economics, for example, and they may even tend to be different for subtopics within SLA. Some applied linguists have responded to these suggestions by interpreting their research findings in relation to comparable meta-analyses of L1 (Plonsky, in press) and L2 research (e.g., Lee & Huang, Reference Lee and Huang2008; Li, Reference Li2010), more often than not referring to Norris and Ortega (Reference Norris and Ortega2000) as a point of reference. L2 research would surely benefit from a set of benchmarks reflecting the nature and size of effects across different sub-areas of SLA and meta-analyses could inform such benchmarks.
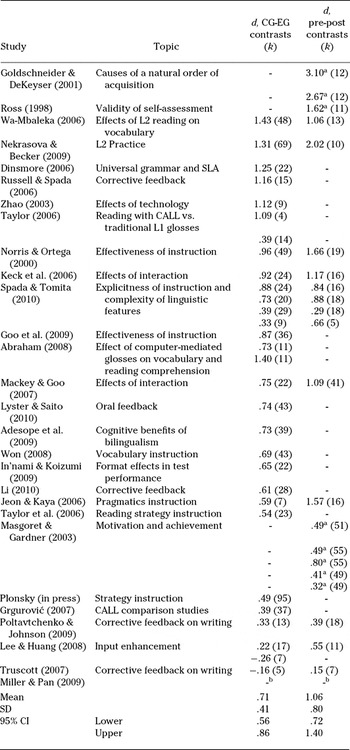
As a first step toward a more accurate understanding of the relative magnitude of effects in SLA, Table 1 presents 27 published and unpublished meta-analyses of L2 research and their effect sizes. These data indicate a fairly even dispersion of effects, ranging from a slightly negative difference to a large difference of approximately 1.5 standard deviations between control and experimental group means. As expected, differences in pre-post designs tend to be larger than for between-groups differences, because study participants serve as their own control in a pre-post design, increasing power to the extent that this effect offsets the smaller sample size typical of these designs (see Lipsey & Wilson, Reference Lipsey and Wilson1993; Morris, Reference Morris2008). At this broad level of surveying effects across L2 meta-analyses in Table 1, Cohen's (Reference Cohen1988) benchmarks appear to underestimate the experimental effects generally obtained in L2 research. Thus, we offer a preliminary and general set of SLA standards for effect sizes, with d = .40 representing a small effect, d = .70 medium, and d = 1.00 a large effect. We do not mean to offer these values as yet another gold standard; they do not apply with any precision to the entire population of research in SLA and should be refined further. Even with SLA-specific norms in place for small, medium, and large effect sizes, what appears to be a numerically large effect for a particular treatment, research design, or population of interest may reflect a theoretically or practically small effect, and conversely, small effects can have very important implications in other contexts (Kirk, Reference Kirk1996; Kline, Reference Kline2004; Prentice & Miller, Reference Prentice and Miller1992; Volker, Reference Volker2006).
Overall Findings from Meta-analyses of L2 Research

Note. Effect sizes listed in descending order. No distinctions have been made between models (i.e., random effects, fixed effects, or mixed effects) or weighting of effect sizes. CALL = computer-assisted language learning.
aConverted from Pearson's correlation coefficient; bResults could not be obtained from the authors.
When interpreting the magnitude of averaged effect sizes from meta-analysis, it may also be useful to reflect on the theoretical development of the research being synthesized. Early research is often characterized by experiments that induce strong manipulations to determine whether an effect even exists, let alone whether it is generalizable. Such experiments would tend to yield large effect sizes (Kline, Reference Kline2004). Subsequently, after an effect is found and theory is advanced by an accumulating corpus of supportive empirical evidence, studies may shift toward examining the generalizability of an effect across samples and settings, leading to more variable effects.
Specifically, effects can be examined to determine whether correlations or group differences are a function of moderators or mediators (for a short and clear discussion of moderators and mediators, see Holmbeck, Reference Holmbeck1997). Moderator variables affect the strength of a relationship when they change. For example, classroom environment could by hypothesized as a moderator variable for the relationship between students’ cognitive ability and L2 mastery. In this case, low-ability students might profit from a richer classroom environment, and therefore cognitive ability would have less of an effect in this setting compared with less stimulating classroom settings. In contrast with moderating variables that qualify the strength of a relationship, mediating variables either fully or partially explain a relationship between an independent and dependent variable. For instance, the relationship between cognitive ability and L2 mastery may be mediated by frequency of exposure to the target language, such that cognitive ability has a significantly reduced effect on mastery once exposure is taken into account.
SLA meta-analyses have carried out some of these more refined moderator analyses, including some of those we have mentioned: The meta-analysis relating self-assessment to achievement examined differences in correlations based on specific skills (e.g., listening, speaking; Ross, Reference Ross1998); the meta-analysis examining the effect of corrective feedback on L2 gains went on to compare the effectiveness of immediate implicit versus explicit feedback (d = .54 vs. .69, respectively; Li, Reference Li2010); and a meta-analysis of the effectiveness of L2 strategy instruction examined whether longer interventions tended to yield greater improvements in L2 learning and use (Plonsky, in press). Note that the latter relationship is not addressed directly in any individual study, yet was able to be investigated meta-analytically.
The research setting is another very important moderator effect that can be discovered as a body of research accumulates over time. In particular, as theoretical models and research findings mature, research may migrate from experimental settings to educational settings that contain more uncontrolled and unmeasured factors. For example, one recent SLA meta-analysis found the effect of lab studies to be almost twice as large as those found in classroom studies (d = .79 vs. d = .43, respectively; Plonsky, in press).
In contrast with the scenario of discovering more subtle effects over time, there is an alternative scenario where advances in theory, design, and measurement enable researchers to overcome the historical shortcomings of past research, allowing them to design studies that generally result in larger effect sizes (Fern & Monroe, Reference Fern and Monroe1996). These two aforementioned trends are opposite in nature; they may be competitive explanations for a set of research findings, or they may run in parallel. Both trends should be considered when interpreting not only the set of effects available for analysis, but how the size of these effects may change over time as theory and research evolve.
To summarize, meta-analysts, just like primary researchers, have a responsibility for drawing appropriate conclusions based on the available body of research evidence—perhaps an even greater responsibility, to the extent that a meta-analysis has widespread visibility and impact. Although there have been two decades of ritual reliance on the same set of benchmarks for practical significance across most of the social sciences, and although we offered some SLA benchmarks ourselves, we want to argue that SLA research will benefit by considering the range of practically significant effect sizes within each of its subdisciplines, eventually moving away from donning small, medium, and large “t-shirt effect sizes” out of mere availability and convenience (Kline, Reference Kline2009, p. 172).
For a meta-analysis to be interpreted in a balanced and scholarly manner, SLA researchers require a thorough understanding of the literature, with knowledge of (a) the development and progression of theories and paradigms underlying the substantive domain being meta-analyzed; (b) the nature of the independent variables and how they tend to be manipulated; (c) the psychometric reliability of outcome measures, because low reliability attenuates effect sizes; (d) the effectiveness (and problems) of the research methods used in primary research; and (e) whether size and patterns of the effects actually found in meta-analyses conform with theoretically expected predictions (Henson, Reference Henson2006; Kirk, Reference Kirk1996; Kline, Reference Kline2009).
CHALLENGES OF APPLYING META-ANALYSIS TO L2 RESEARCH
To this point, we have focused on the benefits and considerations when synthesizing research by means of meta-analysis; however, there are also several distinct challenges to meta-analysis that merit our attention, particularly as they pertain to L2 research. One concern is that seemingly conclusive findings from meta-analyses may either slow or shut down research activities in their respective areas prematurely (Bangert-Drowns, Reference Bangert-Drowns1995). Especially at this early stage in the development of cumulative knowledge in SLA, we feel that meta-analysis most appropriately provides descriptive information of a literature base that suggests future research directions versus any sort of conclusive statistical summary that, by the sheer weight of the cumulative sample size, implies that any further research in an area is redundant. Narrative reviewing procedures should complement quantitative findings from meta-analysis by offering a conceptual model—often one that covers more ground than the models found within any individual study—that can then be used to identify specific areas in the literature that are important yet have been underresearched or ignored in the meta-analysis. In other words, meta-analysis is equally beneficial for both summarizing past empirical findings while stimulating future lines of research inquiry.
For future studies to meet the needs that are identified by SLA meta-analyses, we are in support of Norris and Ortega (Reference Norris and Ortega2000, Reference Norris, Ortega, Norris and Ortega2006, Reference Norris and Ortega2007; Ortega, Reference Ortega, Paltridge and Phakiti2010), who recommend shifting away from isolated research activities. There is a growing need for carefully designed collaborative research that seeks to replicate and thereby test the external validity of previous findings across contexts and learners that differ in theoretically important ways (Language Teaching Review Panel, 2008; Polio & Gass, Reference Polio and Gass1997; Porte, Reference Porte2009; Valdman, Reference Valdman1993). For instance, the conclusion of a meta-analysis of the effects of corrective feedback (CF) on grammar learning pointed out a need “for studies that investigate similar variables in a consistent manner,” lamenting that the “wide range of variables examined in CF is spread rather thin” (Russell & Spada, Reference Russell, Spada, Norris and Ortega2006, p. 156). Unfortunately, this condition is not unique to CF, which has been the object of extensive research in SLA for decades. Ideally, broad agenda setting and collaboration would likely accelerate progress across most L2 research domains, if not all of them. We had mentioned this already in the context of a prospective meta-analysis.
SLA researchers could also collaborate when they disagree on construct definitions and operationalizations, as is common, because these conflicts tend to produce a set of studies that is challenging to meta-analyze. Consider, for example, the concept of “noticing” and the wide range of operationalizations and outcome measures that have been used to study its effects on L2 learning (e.g., R. Schmidt, Reference Schmidt and Robinson2001; Truscott, Reference Truscott1998). The prospect of meta-analyzing a set of studies as diverse and unsettled as the research on noticing is daunting. We do not mean to say that collaboration between those who disagree should lead to theoretical homogeneity. Instead we suggest that researchers who disagree might conduct an adversarial collaboration (Mitchell & Tetlock, Reference Mitchell and Tetlock2009) to further the development of the research base, locating key constructs that can later be synthesized meaningfully and appropriately, whether it is in terms of a unified theory or in terms of a stronger bifurcation that of which each research camp ultimately achieves a better understanding. More generally, collaboration can serve to clarify and distinguish important theoretical definitions and models, perhaps leading to greater standardization of key measures and interventions that pave the way for more detailed meta-analyses and more reliable estimates of effects. Theoretical orientation, then, could serve as a moderator variable. This approach of adversarial collaboration might also reduce the high expectation of any single research effort or any single theory to provide conclusive answers within an L2 discipline (Norris & Ortega, Reference Norris and Ortega2007).
Even with theoretical disagreements in subdisciplines of SLA research, an agreed-upon set of appropriate definitions and measures would greatly facilitate meta-analysis as well as more fine-grained comparisons between studies. Although this is ideal, in reality, meta-analysis is constrained by what primary research ends up reporting—and not reporting. Unfortunately, and somewhat surprisingly, even the descriptive statistics needed to calculate effect sizes (usually the sample size, group means, and standard deviations) are all too often missing from published studies, forcing meta-analysts to exclude those studies from any analysis. To provide a concrete sense of this problem, the following numbers of studies were excluded from six SLA meta-analyses because of information that was not reported: 31 (194% of the studies that were meta-analyzed; Dinsmore, Reference Dinsmore, Norris and Ortega2006), 19 (119%; Nekrasova & Becker, Reference Nekrasova and Becker2009), 32 (71%; Norris & Ortega, Reference Norris and Ortega2000), 36 (59%; Plonsky, in press), 16 (110%; Russell & Spada, Reference Russell, Spada, Norris and Ortega2006), and 20 (59%; Wa-Mbaleka, Reference Wa-Mbaleka2006). These studies could have provided valuable information to a meta-analysis, if the researchers had reported basic statistical information. SLA journals should require the reporting of appropriate descriptive statistics, correlations, and reliability coefficients where appropriate, if only for a greater understanding of the study itself, if not for future meta-analyses.
In addition to the issue of dealing with unreported descriptive statistics critical to meta-analysis, another issue is that the frequency of reporting the reliability of measures used in SLA research is extremely low (see Henning, Reference Henning1986; Norris & Ortega, Reference Norris, Ortega, Doughty and Long2003). Nekrasova and Becker (Reference Nekrasova and Becker2009) and Norris and Ortega (Reference Norris and Ortega2000) both raised this problem, finding that 6% and 16% of the primary studies in their syntheses, respectively, reported the reliability of their dependent measures. It is important to consider the potential unreliability of measures that are implemented in those studies contributing to a meta-analysis, because just as completely unreliable measures lead to null effects, measures with low reliability will lead to reduced effect sizes—even when the actual effect being measured is large. As we have mentioned, coefficients for measurement reliability (e.g., Cronbach's alpha, test-retest reliability) can be used to weight each study's effect size in a meta-analysis, such that the effects from studies with more reliable measures contribute more to the average. Reporting reliability therefore allows a meta-analyst to weight studies in a more precise manner. More generally, by examining the distribution of reliability coefficients, SLA meta-analysts can summarize and interpret the psychometric quality of the substantive measures that are used in a given research area.
SUMMARY CONCLUSION
Meta-analysis generally improves traditional narrative reviews within a research domain by systematically identifying and coding the available quantitative effects, weighting and averaging them in a manner consistent with the statistical strength of the evidence. Meta-analysis is also informative for the results that are not provided, because this may indicate fruitful areas for future research (alternatively, these empirical lacunae may represent “danger zones” where no researcher dare tread!).
Given the growth of meta-analysis taking place in SLA, we close with three brief suggestions. First, we encourage searching for major substantive and statistical indicators of publication bias in a body of research. It is not unreasonable to think that journals tend to reject work that reports nonsignificant effects, and if this is true, then meta-analyses relying only on published effects in a research domain will likely overestimate the overall effect size across studies. At the very least, funnel plots can be provided in the journal space or as online supplementary material, and readers can visually examine effect sizes themselves for potential publication bias or other unique patterns that might not be revealed if one were to look at the summary results from meta-analysis alone. SLA meta-analysts might also more directly attempt to obtain studies in sources that are not readily accessible in hopes that bias is reduced.
Second, SLA researchers should be as transparent as possible about the process of meta-analysis that they undertook, so that readers can better understand and interpret the results, if not replicate them on their own. Transparency includes being open about decision points during the meta-analysis, and it also means making one's coding sheets available and publishing a clear table (or tables) listing the studies and all the data that were involved in the analysis (e.g., sample size, effect size, demographics, and reliability coefficients). Third, we recommend that meta-analysts emphasize practical significance but shift away from Cohen's benchmarks. These benchmarks should be revised within SLA subdisciplines in light of other issues such as manipulation of independent variables, practical significance, and theoretical maturity. We offer a different scale for general interpretations of effect size estimates based on findings from 27 meta-analyses in SLA.
Finally, we note that there is no substitute for well-conducted primary studies in SLA that attempt to satisfy the textbook ideals of representative sampling, careful experimental design, and psychometrically reliable measurement. Primary studies therefore have at least as much promise as meta-analysis, if not more, for answering challenging theoretical and practical research questions in SLA. Meta-analyses often inform primary research by pointing out which theoretical areas are more promising, which types of studies have yielded more compelling results, and how future research needs might increment existing research or blaze new territory previously undiscovered. We are excited about the potential for meta-analysis to summarize the history of research in applied linguistics and to guide its future.