

The last 10 years have seen research on task-based language teaching (TBLT) continuing unabated. With its mounting popularity, TBLT promises to be an even greater magnet for researchers and practitioners for years to come. However, there is a glaring shortfall in the TBLT literature to date: Writings on teacher training have remained scant (Brandl, Reference Brandl, Deusen-Scholl and May2016; Ellis, Reference Ellis2017; Long, Reference Long2016; Van den Branden, Reference Van den Branden2016). Addressing this deficit is important, not only because implementation is part and parcel of what TBLT ultimately involves, but also (and more importantly) because the quality of implementation determines the success or lack thereof. The study reported in this article was meant to help fill the void.
THE ROLE OF THE TEACHER IN TBLT
Much as proponents have been touting the virtues of learner-centeredness in TBLT, the teacher, if anything, plays a pivotal role, a role that many have argued has only become more challenging than ever (Samuda, Reference Samuda, Bygate, Skehan and Swain2001; Reference Samuda and Bygate2015; Van den Branden, Reference Van den Branden2006; Willis & Willis, Reference Willis and Willis2007). Willis and Willis (Reference Willis and Willis2007), for instance, discussed six roles of a teacher in a TBLT classroom: A teacher should be a leader and an organizer of discussion, a manager of group/pair work, a facilitator of task process, a motivator of student participation, a language advisor, and a language teacher. Similarly, Samuda (Reference Samuda, Bygate, Skehan and Swain2001) commented on six roles of the teacher: an advisor, chairperson, monitor, language guide, facilitator, bystander, and co-communicator (cf. Van den Branden, Reference Van den Branden, Van den Branden, Bygate and Norris2009). What is most challenging about this array of roles is that they evolve and are dynamic, even in a single TBLT session.
In a recent discussion on the role of the teacher, Van den Branden (Reference Van den Branden2016) highlighted three roles: a mediator of students’ language development, a change agent, and a researcher contributing to the general understanding of TBLT as “a researched pedagogy.” Apparently, as the general understanding of TBLT grows, so do the expectations on the teacher.
Given the importance of teachers in TBLT, who, as Van den Branden (Reference Van den Branden2016) aptly put it, “bring TBLT to life” (p. 179), various principles have been proffered to guide teachers’ practice. Ellis and Shintani (Reference Ellis and Shintani2014), for example, stipulated that “a key principle of TBLT is that even though learners are primarily concerned with constructing and comprehending messages, they also need to attend to form for learning to take place” (p. 135). Doughty and Long (Reference Doughty and Long2003), on the other hand, provided 10 “methodological principles” (MPs) for teachers:
MP1: Use tasks, not texts, as the unit of analysis.
MP2: Promote learning by doing.
MP3: Elaborate input.
MP4: Encourage inductive (“chunk”) learning.
MP5: Provide rich input.
MP6: Focus on form.
MP7: Provide negative feedback.
MP8: Respect learner syllabi and developmental processes.
MP9: Promote cooperative and collaborative learning.
MP10: Individualize instruction.
These MPs, which are motivated by second language acquisition (SLA) research and corroborated by philosophical principles of education, are intended to be of universal relevance—transcending instructional contexts (Long, Reference Long, Long and Doughty2009, Reference Long2015). Yet, cognizant of how contextual dynamics and contingencies may mitigate the rendering of the MPs in practice, Long (Reference Long, Long and Doughty2009) made a point of leaving pedagogical procedures to classroom teachers, a move backed up by a major research finding:
What has become clear over the past 20 years is that most teachers are inclined to implement TBLT in ways they see fit. As such, they aim to give shape to an approach to language learning that is not only consistent with a particular view of language learning or with specific pedagogical guidelines, but that they themselves also experience as practicable, feasible and appropriate for the particular context in which they are functioning. (Van den Branden, Reference Van den Branden2016, p. 167)
RESEARCH ON TEACHERS
Research on teachers pales against the large amount on task characteristics and their impact on second language (L2) learning, but is, nevertheless, on the rise. The available research has centered on teachers in the classroom (e.g., Brandl, Reference Brandl, Deusen-Scholl and May2016; Carless, Reference Carless2004, Reference Carless, Shehadeh and Coombe2012; East, Reference East2012; Ellis, Reference Ellis and Bygate2015; McDonough, Reference McDonough and Bygate2015; Samuda, Reference Samuda, Bygate, Skehan and Swain2001; Shehadeh & Coombe, Reference Shehadeh and Coombe2012; Van den Branden, Reference Van den Branden2006). Brandl gave a useful summary of the questions that have been dominating the research on teachers:
• How do teachers conceptualize TBLT?
• How do teachers go about implementing tasks or a task-based syllabus?
• What challenges and struggles do they experience?
• What are teachers’ attitudes toward TBLT?
• How compatible do they perceive TBLT with their current instructional practices? (Brandl, Reference Brandl, Deusen-Scholl and May2016, p. 429)
It is clear that to date, TBLT research on teachers has largely confined itself to observing teachers’ behavior—or probing teachers’ perceptions—with or without exploring their understanding of TBLT. TBLT teacher training, in particular, has largely remained a research vacuum (cf. Van den Branden, Reference Van den Branden, Van den Branden, Bygate and Norris2009). Consequently, little is known about the training teachers have received, much less about them being in the training process—in particular, how their understanding of TBLT evolves.
Without a doubt, teachers’ own understanding of TBLT is fundamental to the success (or lack thereof) of TBLT. It is one thing to observe that “teachers do not follow official TBLT-related pedagogic recommendations in a slavish way” (Andon & Eckert, Reference Andon and Eckert2009, p. 305); it is quite another to assume that they all have had a reasonable understanding of not only tasks but also TBLT as a whole. Such an assumption is as yet unwarranted (Van den Branden, Reference Van den Branden2016), and the principles proposed for teacher training, such as the following (Brandl, Reference Brandl, Deusen-Scholl and May2016), may therefore be of limited guiding value:
1. Understand task concepts.
2. Understand task goals and pedagogical intentions.
3. Have a solid command of task routines.
4. Have training that is hands-on and experiential.
As meaningful as these principles are for teacher training, they are mostly procedural, rather than conceptual and epistemological.
Van den Branden (Reference Van den Branden2016), similarly, prescribed a hefty regiment of the teacher should type of suggestions for managing pretask, during-task, and posttask phases of teaching. For example, for the during-task stage, the teacher should:
• Engage in the negotiation of meaning while the students try to deal with the input and output demands raised by the task.
• Produce a wide variety of questions, cues, and prompts to elicit learner output.
• Provide feedback on the students’ written and oral output. Feedback may come in different shapes, including explicit corrections, recasts, confirmation and clarification requests, metalinguistic comments, extensions, and elaborations.
• Incorporate a focus on form in the meaning-oriented work the students are doing.
• Provide ample input and model or practice the performance of a task or the use of a certain strategy. (Van den Branden, Reference Van den Branden2016, pp. 170–171)
Although all of these suggestions make sense, teachers who lack a systematic understanding of TBLT may end up feeling overwhelmed or, worse, acting on them haphazardly.
While teachers do need procedural guidance to address the reality of what they have to deal with in the classroom, restricting guidance to procedural elements may cultivate a superficial understanding of TBLT, run the risk of stunting teachers’ creativity or agency, and ultimately impede the advent of TBLT (Ellis, Reference Ellis2017; Van den Branden, Reference Van den Branden2016). And if we embrace—and we should—the notion of teacher as researcher (Van den Branden, Reference Van den Branden2016), it would be compelling to engage teachers in TBLT training at both the abstract conceptual and practical procedural levels (cf. Cameron, Reference Cameron1997).
This may, however, be too lofty a goal to reach. The biggest obstacle stems from there being no uniform conception of TBLT in the literature. Consequently, it means one thing to one teacher and something else to another. Much of the teacher training has been reduced to helping teachers gain familiarity with or deal with task routines (e.g., differentiating a task from an exercise), rather than cultivating a coherent understanding of TBLT, including its epistemological basis and broad methodological characteristics. But such a level of understanding is essential: Without it, teachers would be left to operate on an elusive grasp of TBLT—searching for guidelines or having only a narrow understanding of one version, only to feel confused and frustrated when encountering another.
Another paramount obstacle has to do with the lack of qualified trainers and programs able to provide comprehensive introduction to TBLT. Brandl observed:
Within second language teacher education (SLTE), the most common social contexts that provide opportunities for learning constitute pre- and in-service methods’ seminars and workshops, classroom observations or video critiques, and formal or informal meetings between supervisors and instructors or among peers. (Brandl, Reference Brandl, Deusen-Scholl and May2016, p. 432)
Developing a functional competence in TBLT demands far more than on-and-off participation in the above activities (cf. Van den Branden, Reference Van den Branden2006)—not just because the subject is complex and unwieldy as a result of the lack of a uniform (even if overarching) version of TBLT. There is also an art and craft dimension to it, one that none of the teacher education models can afford to eschew. I will return to this point, after discussing TBLT and its variants.
TBLT AND VARIANTS
Willis and Willis were spot-on when noting in their introductory chapter that “TBT [task-based teaching] is not the same the world over” (Willis & Willis, Reference Willis and Willis2007, Kindle version, loc. 273). Anyone who is training teachers in TBLT faces the immediate need and challenge of determining what TBLT is and which version to focus on (Brandl, Reference Brandl, Deusen-Scholl and May2016).
There are currently two main schools of thought on TBLT. One views it as a strong form of communicative language teaching; the other sees it as a departure from it. A strong proponent of the former, Ellis considered TBLT an approach to “develop learners’ communicative competence by engaging them in meaning-focused communication through the performance of tasks” (Ellis & Shintani, Reference Ellis and Shintani2014, p. 135). A chief architect of the latter, Long (Reference Long, Hyltenstam and Pienemann1985, Reference Long2015) considered tasks a catalyst, not just a booster, of L2 development. Each line of thinking has morphed into a distinct version of the task-based approach, differentially labeled as task-supported language teaching (TSLT) and task-based language teaching (TBLT) (Ellis, Reference Ellis2003).
While an attempt has been made over the last decade to unify the two (see, e.g., Ellis, Reference Ellis2017), conceptual fissures have persisted (see Long, Reference Long2016). At the core of the epistemological differences is the role of structure-oriented teaching and, for that matter, the status of explicit teaching of grammar. TSLT embraces it, whereas TBLT rejects it. Fundamentally, TSLT has conviction in structural bootstrapping, and TBLT in semantic bootstrapping. With TSLT, knowledge about language (known otherwise as “explicit knowledge” or a conscious understanding of the grammar of the target language) is a necessary step toward knowledge of language (known otherwise as “implicit knowledge” or the ability to use the target language). Conversely, with TBLT, the development of implicit knowledge is both a means and an end.
While TSLT and TBLT both recognize that the ultimate goal of task-based instruction is to develop implicit knowledge, they differ in their calibration of (adult) learners’ capacity for implicit learning. Both consider it weak, and TSLT projects a dire picture of it and sees the only way for adults to develop implicit knowledge as through repeated practice of explicit knowledge (see, however, Ellis, Reference Ellis2017, for a softer stance on this, recognizing tasks involving learners in language use can lead to development of implicit knowledge as well). TBLT, on the other hand, takes language use as the only pathway to implicit knowledge, and the way to shore up implicit learning or fill gaps in implicit learning is through reactive focus on form (Long, Reference Long, Lambert and Shohamy2000).
While both approaches have sought to use insights and findings from SLA research to inform their formulation of task-based instruction, each has tapped different entities: TSLT is largely informed by skill acquisition theory (see, e.g., DeKeyser, Reference DeKeyser, VanPatten and Williams2015), and TBLT by cognitive interactionist theory (see, e.g., Gass & Mackey, Reference Gass, Mackey, VanPatten and Williams2015).
Partly, it is these conceptual differences that have underpinned radically different pedagogical practices. For example, at the syllabus level, TSLT adopts a synthetic approach whereby the content of instruction revolves around discrete formal elements of the target language, and the learner is expected to integrate them into an ability to use the language. TBLT, on the other hand, follows an analytic approach whereby the content of instruction comprises tasks, and the complexity of tasks becomes a main leverage to the development of L2 functional ability (Robinson, Reference Robinson2001, Reference Robinson and Robinson2011).
Differences, accordingly, exist at the classroom procedure level, as well. Language work, for example, can happen at any time—before, during, or after a task—under TSLT, but it happens mostly during a task under TBLT. Taken together, TSLT is largely top-down, with decisions mostly made for the learner; TBLT is typically bottom-up, guided and driven by what the learner needs to, or can, do.
The differences notwithstanding, the two variants of TBLT (and others in between) are notably in unity on several other fronts, four in particular. First, the goal of foreign language instruction is development of implicit knowledge or functional competence. Second, tasks afford unique opportunities for language development. Third, meaning is important to language instruction and learning. Fourth, input matters as much as output. These commonalities should constitute the pillars of any teacher-training program aimed at TBT.
But it is the divergences between TSLT and TBLT that should ultimately fire up teachers about TBT and about its innovative potential of effectively stimulating L2 development. Therefore, TBT should be systematically introduced in a well-rounded training program. At the end of the day, teachers stand to benefit from options.
The broadening of content learning about TBT is necessitated also by the dearth of empirical studies comparing TSLT with TBLT. Until that changes, it would be premature, if not harmful, to play up one version and play down another among teachers.
TASK AS A VEHICLE OF TEACHER TRAINING
Content learning, alone, would not lend teachers the ability to actually do TBT. Knowledge of what and of how have to go hand-in-hand. However, given the shortage of programs that fully implement TBT (Ellis, Reference Ellis2017; Van den Branden, Reference Van den Branden, Van den Branden, Bygate and Norris2009), it would seem to follow that a large amount of modeling should occur in a training program (cf. Cameron, Reference Cameron1997), or in Brandl's words, trainers need to “walk the talk”:
A teacher trainer needs to walk the talk when training foreign language teachers. Teachers need many hands-on opportunities where they can try out and experiment with TBLT methodologies in a safe environment under the guidance of an expert trainer. This practice will allow them to experience TBLT in action and will prepare them for some of the challenges. Examples of such training elements constitute writing reflective journals, peer/expert observations, task/case study analyses, developing tasks, developing lesson plans, and microteaching. One training element that is in particular noteworthy is the need for trainees to be involved in the development of the task materials. (Brandl, Reference Brandl, Deusen-Scholl and May2016, p. 435)
The present study was conducted in precisely such a training program where the training was mediated by tasks. The study set out to explore a two-pronged question: To what extent was task-based learning beneficial to improving trainees’ understanding of TBT (i.e., content learning) and their linguistic ability to express their thoughts (i.e., language learning).
THE STUDY
Context
The present study took place in the Teaching Chinese to Speakers of Other Languages (TCSOL) Certificate Program at Teachers College, Columbia University. The program spans one year (two academic semesters). A key component of the curriculum is the practicum, which is offered at two levels. In Practicum I, trainees learn about the basics of foreign language teaching, from planning to implementation to classroom management. In Practicum II, where the data for the present study were collected, trainees are introduced to task-based teaching (see, e.g., Ellis, Reference Ellis2003; Long, Reference Long2015; Long & Crookes, Reference Long and Crookes1992; Willis & Willis, Reference Willis and Willis2007) uniquely via a task-based approach, with English as the medium of instruction. Both pedagogic tasks (tasks that are performed only in the classroom) and target tasks (real-world tasks) are used as engines of learning. Among the pedagogic tasks are the following:
• Attending mini lectures on specific topics (e.g., Why is TBLT necessary? How is task defined in TBLT? How should tasks be sequenced? What is focus on form? How should task-based learning be assessed?)
• Participating in pair or group discussion on the input received from the lectures
• Designing, sequencing, and implementing tasks in pairs or groups
The target tasks include:
• Carrying out semester-long reading of book, Doing Task-Based Teaching (Willis & Willis, Reference Willis and Willis2007), one chapter per week, and writing reflections on each chapter
• Observing classes and writing observation reports
• Teaching group classes in the Chinese Language Program at Columbia University and writing teaching reports
• Conducting one-on-one tutoring classes in the Chinese Tutoring Program at Teachers College and writing reflection reports
The biggest target task of all is the course's culminating project, which involves trainees working in groups for about a month and a half—mostly outside of class hours—developing TBLT-compatible units of instruction, including tasks and materials, and providing a rationale for the design.
Participants
Participants in the present study were three female attendees of a recent iteration of the TCSOL program, pseudo-named Xin, Chu, and Min. At the time of enrollment, Xin was attending a Master of Science in Teaching English to Speakers of Other Languages (TESOL) program at Fordham University in the United States. Her prior teaching experience was limited to a brief stint as an intern at a private school in China, where she taught English to primary school and middle school students and assisted in curriculum design and development of teaching materials.
Chu had a master's degree in Chinese Linguistics and Language Acquisition from The Chinese University of Hong Kong and had worked twice as a teaching assistant in Columbia University's summer Chinese program in Beijing, China. Of her responsibilities in that role, she created materials for, and taught, intensive drills classes, corrected students’ homework, and tutored individual students.
Min had a master's degree in Dance and Dance Education and taught first-year Chinese as an assistant lecturer in the Department of Chinese Language and Literature of Hong Kong Shue Yan University for a year.
The sampling of the three participants (out of 24) for the study was purposeful. They were the prototypes of their cohort: Xin typified those with training in TESOL; Chu, those with prior training in TCSOL; and Min, those with no training in either TESOL or TCSOL. Likewise, the three participants embodied differential amounts of teaching experience, a ringing attribute as well of the cohort.
Data and Analysis
The data comprised three sets of 10 (ungraded) writing samples, one set from each participant performing the task of writing a weekly reading journal. Data analysis sought quantitative and qualitative perspectives. The goal was to paint a collective picture as well as an individual one, in relation to the two fundamental concerns of the study: content and language learning.
For quantitative analysis, automated analyses were conducted, using two robust, well-established computer programs for text analysis—LIWC (Linguistic Inquiry and Word Count) and the Lexile® framework. LIWC measures style of writing or the social, cognitive, and psychological dimensions of writing (Pennebaker, Booth, & Francis, Reference Pennebaker, Booth and Francis2007), yielding indexes for a wide array of variables. The Lexile® framework (MetaMetrics, 2015) assesses semantic and syntactic complexity, with higher scores denoting higher syntactic and semantic complexity or higher linguistic sophistication.
The automated analyses started off with a focus on content learning. The reading journal data were analyzed on LIWC to obtain scores of cognitive processes, analytical thinking, clout, authenticity, and emotional tone. “Cognitive processes” indexes the extent to which writers try to work out a problem in their minds; “analytical thinking,” logical or formal reasoning; “clout,” confidence or self-certainty; “authenticity,” originality; and “emotional tone,” optimism/pessimism or positive/negative emotions.
Subsequent to these measures of the content of writing, the reading journal data were analyzed on the Lexile® framework for information on language learning, yielding scores reflecting linguistic sophistication, a combination of syntactic and semantic complexity (Douglas & Miller, Reference Douglas and Miller2016). Lexile scores can range from below zero to above 2000L, the higher being more sophisticated.Footnote 1 To illustrate, consider two paragraphs of a sample journal entry, (a) and (b).
Extract 1: Sample Paragraphs of a Journal Entry
(a) In the approach, the grammar is viewed as a vital point if we want to make what you want to say easily understand by our listeners. it is possible that we can understand most of the broken sentences that spoken by Chinese language learners, but later, when the learners want to express more complex meanings, they will feel helpless and confused if they don't have a good command of grammar! So, in the book, they give out two possible starting points for teaching language, i incline towards the first one “to see meaning as a starting point for language development, and to see form as developing from meaning.” after all, the vocabulary is the key to the meaning, the meaning is the key to the communication.
(b) as my english learning experience, grammar is always the core part of the curriculum. Yes, grammar and form are important in language learning, yet in the chapter, they illustrate “why not start with grammar” and give out an example “Yes/No challenge.” the game looks easy but it is “extremely difficult” to focus on the accuracy of what you're going to say. Besides, once learners focus more on the form, they probably lose the fluency and cannot convey their meaning confidently because forms restrict their thoughts.
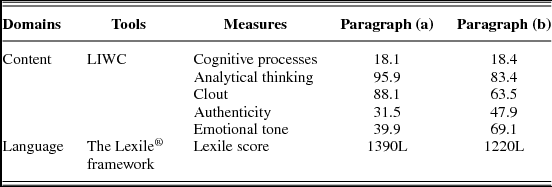
Table 1 summarizes the results from the automated analyses.
Results of Automated Analyses of Sample Writing

According to LIWC analyses, paragraph (a) and paragraph (b) have similar scores on cognitive processes (18.1 vs. 18.4), suggesting a similar extent to which the writer tried to work out an idea or a point in her mind, such as “the grammar is viewed as a vital point if we want to make what you want to say easily understand by our listeners” in (a). Yet the two paragraphs achieve very different scores on analytical thinking (95.9 vs. 83.4), with (a) exhibiting greater formal, logical thinking than (b), as evident in (a) deploying expressions like “if,” “it is possible,” “but,” “so,” “after all,” and (b) fewer such expressions. Likewise, (a) exhibits higher clout, suggesting that the writer had greater confidence in the content of writing, than (b) (88.1 vs. 63.5). Expressions such as “want to,” “key to,” “will” in (a) and lesser use thereof in (b) exude differential amounts of confidence. However, in terms of authenticity, (a) shows less originality than (b) (31.5 vs. 47.9). This is seen in (b) being about one's own thoughts rather than about the nature of a (external) pedagogical proposal discussed in a book chapter, as in (a). Similarly, (a) carries a lower emotional tone than (b) (39.9 vs. 69.1)—where emotions are encoded by words such as “easy,” “extremely difficult,” “lose,” and “cannot.”
Turning to the measure of language using the Lexile® framework, the Lexile scores (which serve as an indicator of linguistic sophistication) are different, as shown in Table 1: Paragraph (a) is more sophisticated than (b), meaning that (a) contains greater syntactic and lexical complexity than does (b).
Thus, it can be seen that while shedding light on content and language, the automated analyses paint a picture that is both granular and dynamic. Even when a given individual attempted two paragraphs of one piece of writing, the underlying cognitive and psychological processes fluctuated, as amply illustrated in Table 1.
Taking advantage of their collective capacities, the present study deployed automated tools to analyze its longitudinal reading journal corpus, tracing participants’ learning of content and language. The resulting picture—probabilistic, for sure, a genetic limitation of any such computer programs—was then augmented by qualitative analysis of select writing samples whereby the texts were carefully inspected for discourse evidence to substantiate the automated results.
RESULTS
Content Learning
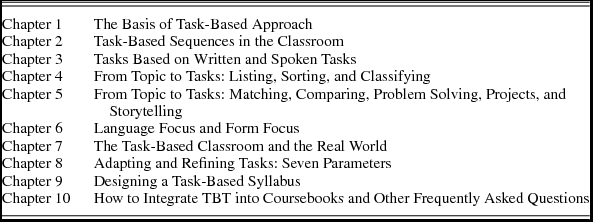
As noted, participants wrote reflections on all 10 chapters of Willis and Willis (Reference Willis and Willis2007). Table 2 gives the titles of the chapters.
Chapter Titles in Doing Task-Based Teaching (Willis & Willis, Reference Willis and Willis2007)

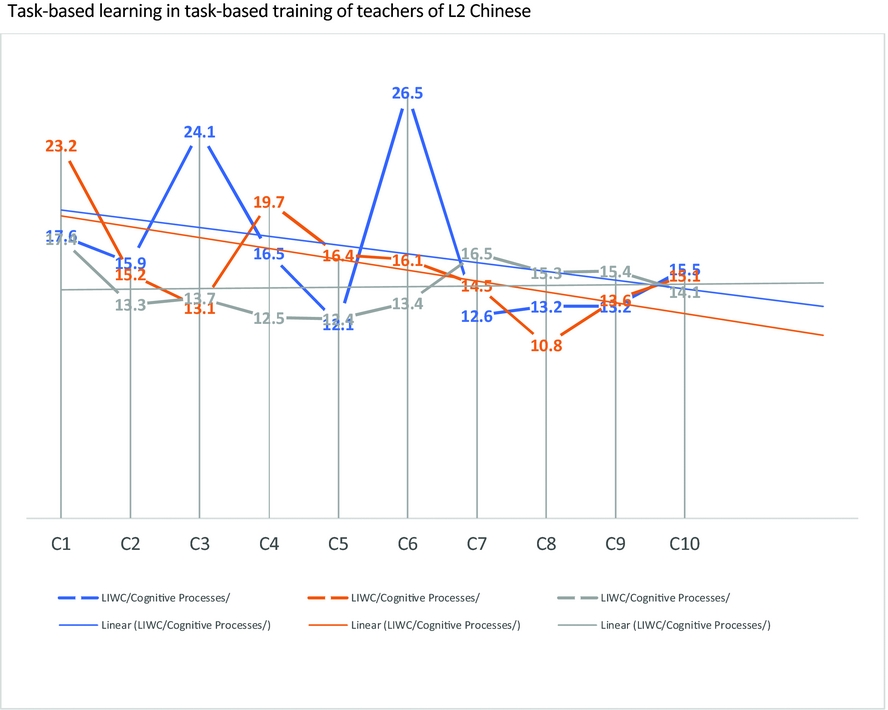
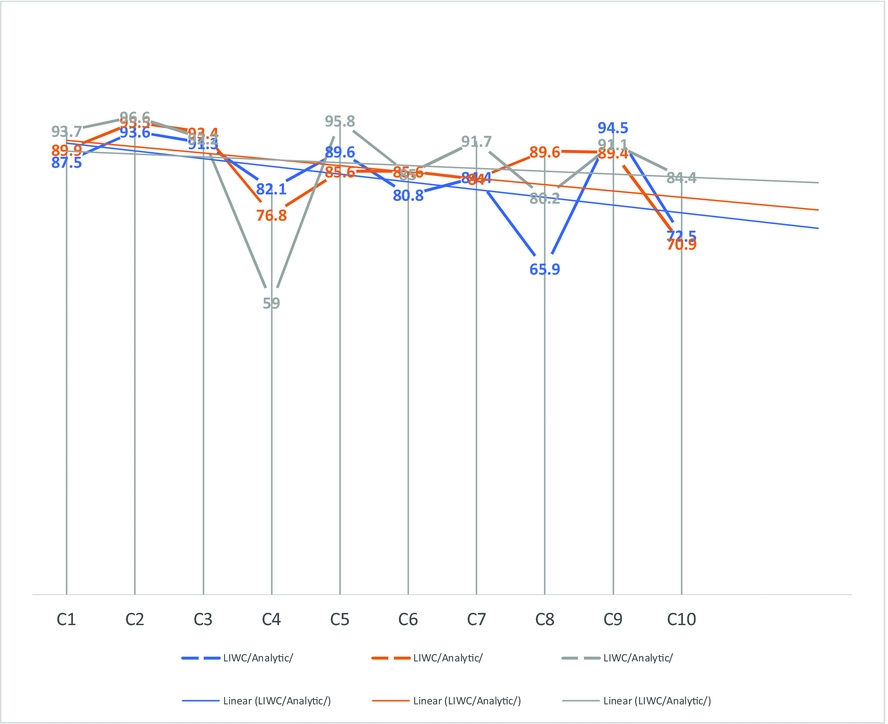
Figures 1–5 show the results yielded by LIWC on the following variables: cognitive processes, analytical thinking, clout, authenticity, and emotional tone.
Cognitive processes scores for all participants across 10 entries with linear forecasts.

Analytic thinking scores for all participants across 10 entries with linear forecasts.
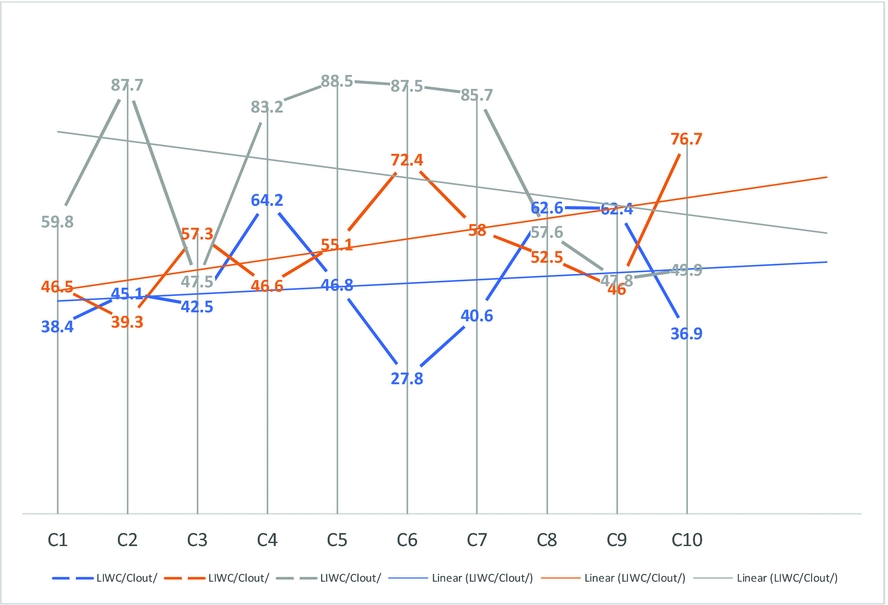
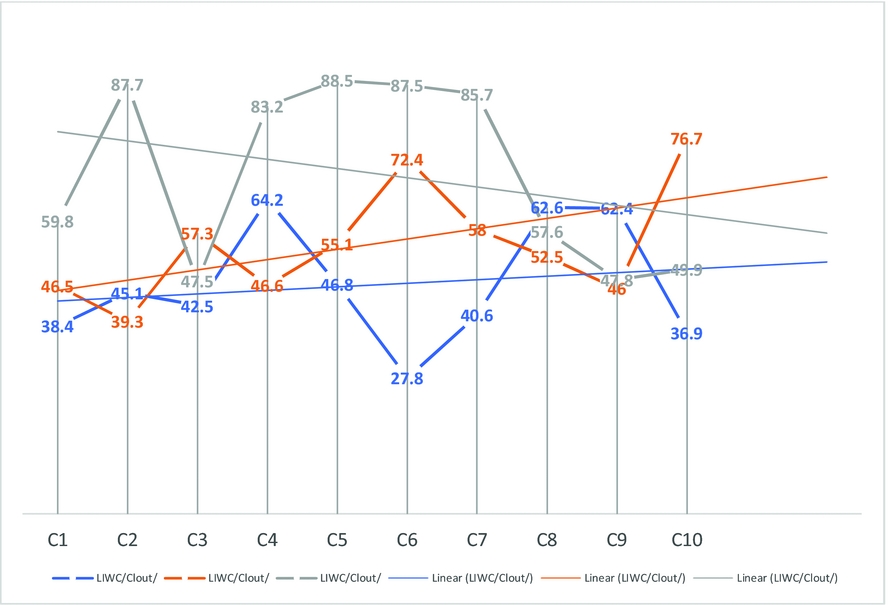
Clout scores for all participants across 10 entries with linear forecasts.
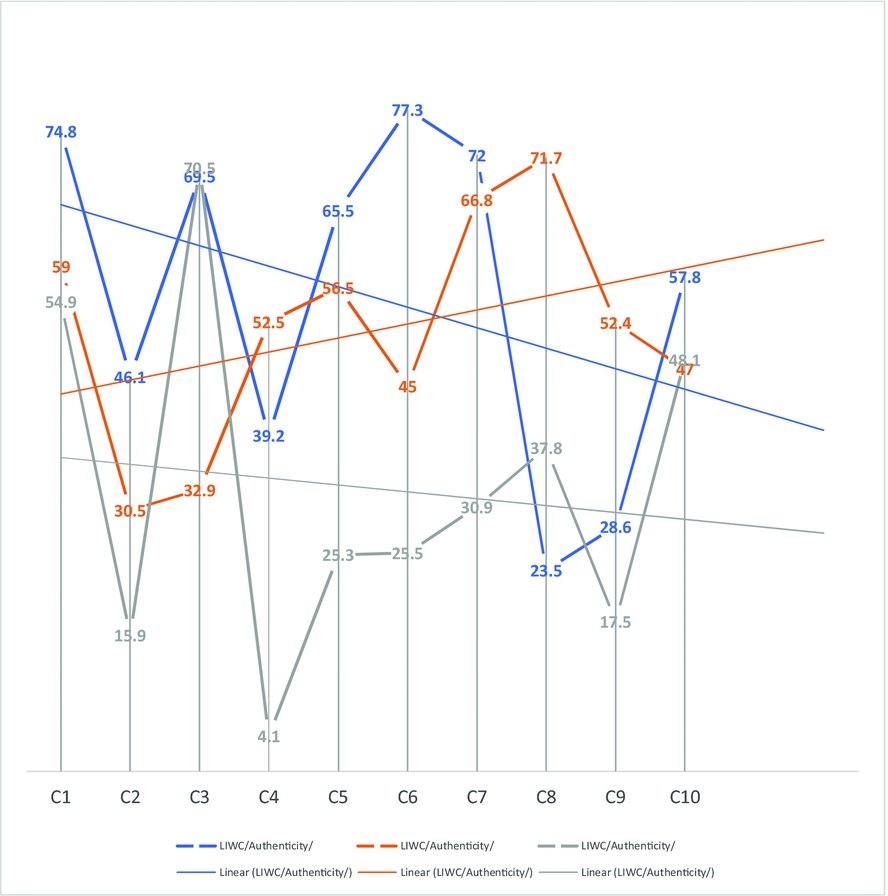
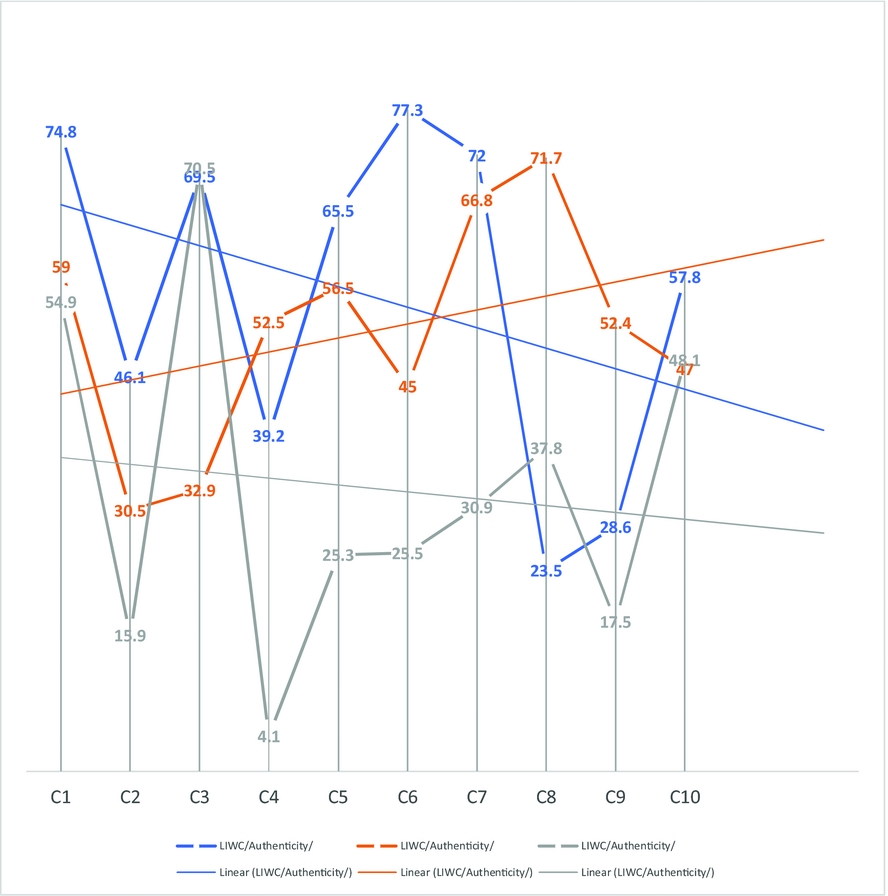
Authenticity scores for all participants across 10 entries with linear forecasts.
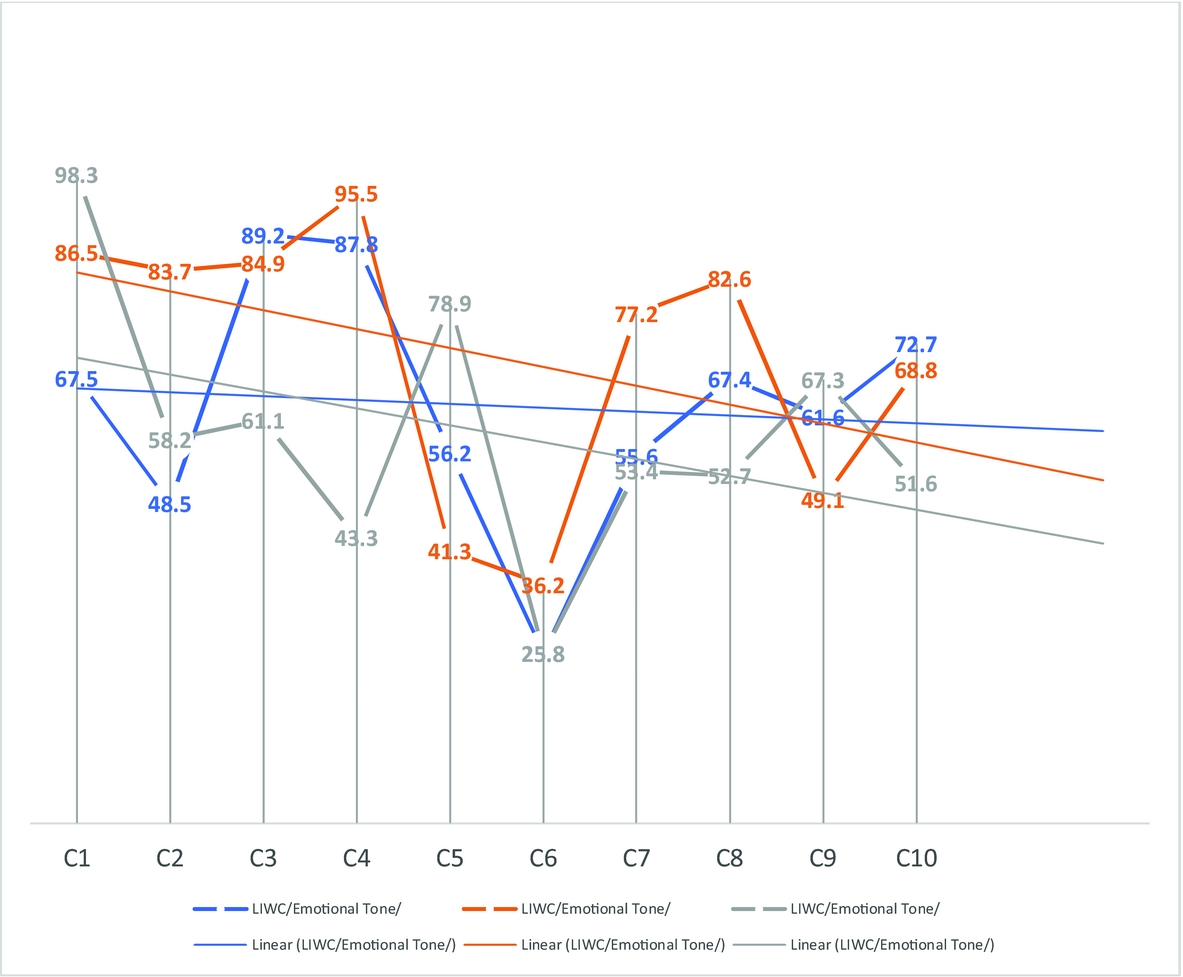
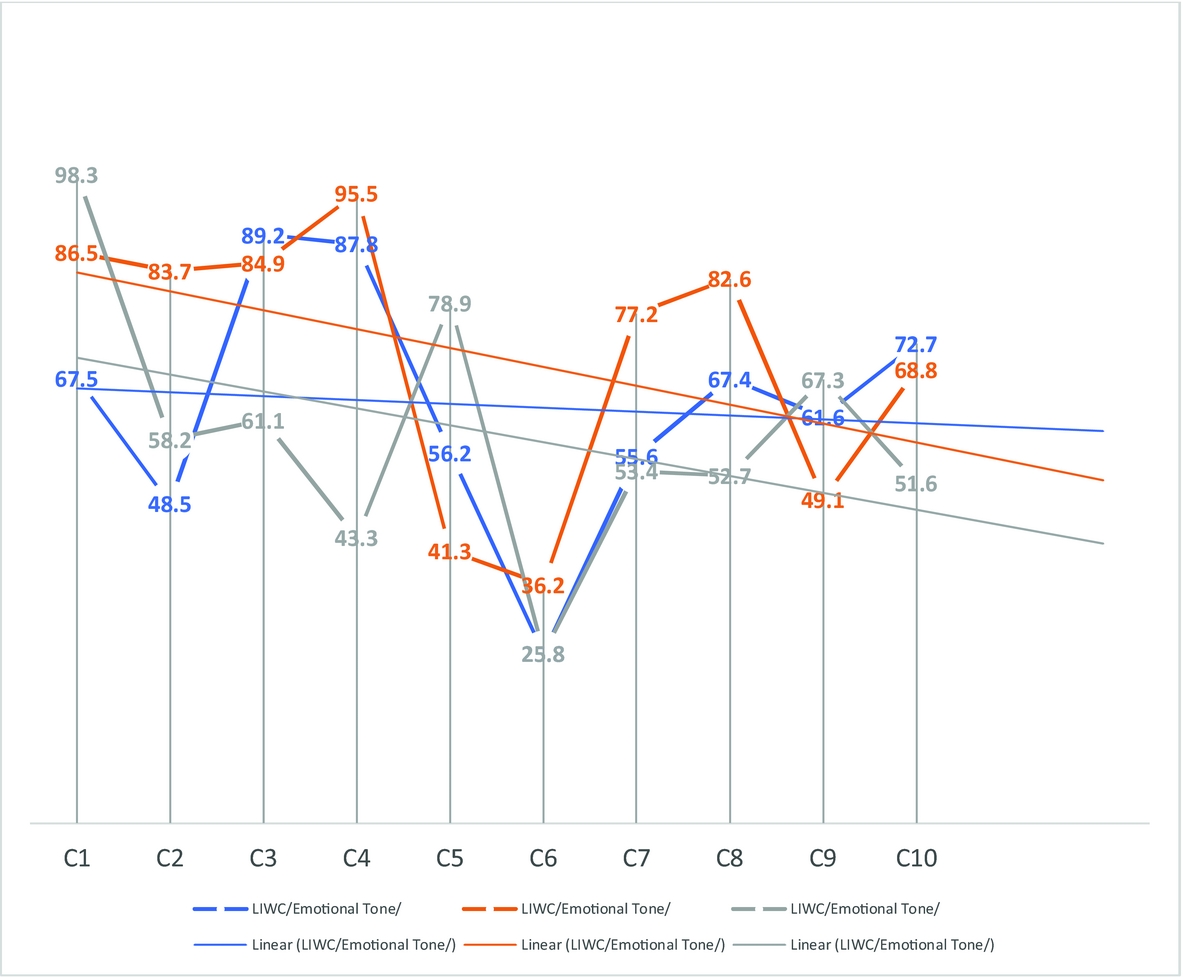
Emotional tone scores for all participants across 10 entries with linear forecasts.
Cognitive Processes
Figure 1 displays the results on cognitive processes for the three participants across 10 journal entries. The thicker lines plot the distribution of the actual scores, and the thinner lines show the linear forecasts. For all three participants, the extant of cognitive processes varied as they wrote on one chapter versus another. Comparing data point 1 (C1) with data point 10 (C10), they all seemed to start with greater use of cognitive processes and end with lesser. The linear forecast trend lines for Xin (as indicated by the blue lines) and Chu (the orange lines) converge on a steady decrease over time, but show a more stable trajectory for Min (the gray lines) with slight increase in the end.
The patterns of variation were idiosyncratic across the participants, as was the magnitude of fluctuation. For Xin, whose scores exhibited greatest magnitude of fluctuation (14.4)—her highest score came from her journal entry on Chapter 6 (C6, 26.5) and her lowest on Chapter 5 (C5, 12.1). Min's journal entries, on the other hand, exhibited the lowest magnitude of fluctuation (5.0), with her highest score on Chapter 1 (C1, 17.4) and lowest on Chapter 5 (C5, 12.4). Like Xin, Chu also showed a large magnitude of change (12.4)—the highest on Chapter 1 (C1, 23.2) and the lowest on Chapter 8 (C8, 10.8). These results indicate that the 10 chapters incurred different amounts of cognitive processes in the participants as they wrote their reflections on the reading.
For the sake of argument, let's zoom in on Xin's entry on Chapter 6, which achieved the highest score on cognitive processes, among all entries combined for the three participants.
Extract 2: Xin's Entry on Chapter 6
Wed., Mar. 1, 2017, at 10:01 p.m.
Chapter six deeply illustrates two different focus in TBLT—language focus and form focus. The form one takes place in preparation for a task and learners themselves control what to know and why. The latter one usually comes after a task sequence. Teachers draw learners’ attentions on the forms which are rooted in a meaningful context. I used to feel uncertain about how TBLT works in a test-driven context, but now I can see that TBLT does not change the things learners need to know about language but changes the we how teachers teach and how learners learn. Teachers can still have the students do activities mirror the exam after a task sequence or even make it a task. Similar to May [pseudo-name of a fellow student], I am also inspired by how concepts and languages in one task might be incorporated in another. I used to pick up texts focusing on a specific topic and struggled finding the similarities in forms. This changed my idea of choosing texts merely based on relevance. If I want to make the language more memorable and not limited to certain context, I should try different contexts that could generate the similar language but might not exactly belong to the same topic.
In this entry, Xin started out with a description of a key distinction made in the chapter between “language focus” and “form focus.” She then brought it home by rethinking her own previous concern about a tension between TBLT (its meaning orientation) and language testing (its form orientation) and articulating her new understanding of TBLT—that TBLT was about how teachers teach and learners learn, and that teachers could incorporate the content of language tests into their TBLT. Further, Xin resonated with a point a fellow classmate made about recycling content and language between tasks, recalling her own earlier practical struggle to develop tasks around a specific topic—worried at the time that the language elements would not recur across the tasks—and offering her newfound solution: using texts on the same topic to naturally generate repetition of the targeted language elements. She went on to rationalize her solution invoking her belief that retention of learning required that learners experience the language in multiple contexts—not necessarily on the same topic. Without a doubt, this is a highly thoughtful entry: hitting a centerpiece of the chapter and buttressing it with three personal spinoffs.
Analytical Thinking
Figure 2 shows results on analytical thinking for all three participants. The thicker lines plot the scores and the thinner lines represent the linear forecasts (blue for Xin, orange for Chu, and gray for Min).
What stands out on immediate inspection of the figure is again fluctuations both for individual participants across time and among them. On closer inspection, the linear forecasts reveal a common trend: All three participants started out high on analytical thinking but loosened up over time, which corroborates the trend on cognitive processes (see Figure 1). The overlap suggests that as participants’ reading of the book progressed, their understanding built up, and as a result, the processing load eased up for the later chapters.
At the individual level, Min's trajectory of analytical thinking appears to show the biggest swing (achieving a score of 59 on Chapter 4 but 95.8 on Chapter 5). A closer look at her actual entries on these two chapters is instructive. Extract 3 exhibits Min's entry on Chapter 4.
Extract 3: Min's Entry on Chapter 4
Wed., Feb. 15, 2017, at 5:29 p.m.
Listing, sorting and classifying are categorized as cognitive process tasks. They are very functional and versatile in task-based teaching. They can be applied in different types and different levels of tasks. Listing with charts and tables is a friendly tool for beginners. It helps to organize information and thus puts less cognitive pressure on them. Sequencing, ranking and classifying can involve a lot of discussions and negotiations. They require more thought and cognitive effort which are suitable for a higher level students.
Since I have had co-teach a high level student in CTP, learning to use this tool should be vey helpful. Our student Jamila is fluent in Mandarine, she has a lot of vocabulary. However, she used the same words repetitively in her writing. She claimed she could not recall the words. I think listing and classifying may help her in writing. I will ask her to brainstorm the words that she may use, or I can brainstorm with her. After she has a word list from the brainstorm, we can have a discussion of those words. Then I will ask her to classify those words according to their meaning and usage. Hopefully, this task will be one of the solutions for her future writing.
Min's entry on Chapter 4 was mostly descriptive. She described, first, her understanding of the tasks introduced in the chapter and, then, how she might apply some of the tasks to her own tutee. But her entry on Chapter 5 reads very different, which due to space limitation cannot be displayed here. Min was notably much less descriptive but more conceptual. Starting with recalling something she had learned in another class—the difference between foreign and second language learning along with the conditions that typically accompanied these two contexts of learning, she began to wonder whether the conditions for foreign language learning could actually be ameliorated. Min then related this thought to the content of the chapter, picking up on the project idea, extending it, and, more important, offering her reasons for why she thought the project idea could help improve the learning conditions for foreign language learners and why it could be feasible for her students.
Clout
Figure 3 shows that participants’ self-confidence varied across the entries. Nevertheless, the linear forecasts (indicated by the thinner lines) show that Xin's and Chu's confidence level grew over time, while Min's decreased. Figure 3 also shows the magnitude of fluctuations. The most dramatic changes happened in Min—the gap between her highest score and lowest was 41. Her clout trajectory exhibited a surge on Chapter 2; took a nose-dive on Chapter 3; rose sharply again on Chapter 4; remained high through Chapters 5, 6, and 7; went sharply down on Chapter 8; and stabilized through Chapter 10. By comparison, Xin's and Chu's trajectories were, overall, less dynamic—the difference between the highest and the lowest score was 36.4 for Xin and 37.4 for Chu. Yet, interestingly, Xin's and Chu's trajectories exhibited stark polarizations at two data points, Chapters 6 and 10. Extracts 4 and 5 present their respective entries on Chapter 10.
Extract 4: Xin's Entry on Chapter 10
Thu., Mar. 30, 2017, at 10:17 p.m.
Chapter ten speaks to the most frequently asked questions toward TBT and many of those were what I have been concerned. I felt much clear after reading this chapter and I would definitely re-read the book for more than one time. For me, obtaining a teaching method and being able to implement it into teaching is more than merely understanding how it works.
I always got new ideas to revise what I have planned when I read this book. While I was reading chapter ten, I went back to back to my final project tasks several times to check if I could make them more productive by using the advice given for integrating potential activities in the textbooks. For example, let the students make an agreement while sharing ideas to prompt more discussion and make the goal clearer, ask for an explanation when giving a statement or require for possible advice, etc.
Another thought provoking point for me is what teachers can do during a post-task report stage. This is not a typical situation happens only in TBT. Even though the class is taught by other teaching methods, students are still likely to get bored during a report stage, or students might focus too much on prepare and present their own reports while being less attentive while listening to the others. By giving them a purpose for listening, the report stage could be more interesting and beneficial.
Extract 5: Chu's Entry on Chapter 10
Thu., Mar, 30, 2017, at 12:04 p.m.
While implementing TBT in my Chinese classes, I've had students who wanted to be taught grammar, who felt that they couldn't sense their own progress while doing tasks in class, who complained about there is a conflict between what they've learned in class and what they would be tested at school. I am glad that Willis & Willis presented us with all the concerns language teachers had during Task-based teaching. I believe all of the 10 questions did speak well for any Chinese teachers who would like to change a traditional class into a more communicative and engaging class.
Among all the questions, I see there are conversational attitudes from both teachers’ side and students’ side. As teachers, as soon as we realize the real goal of language teaching and learning is to be communicative, we become so excited to try to bring TBT into traditional classes. But as for students, they are still stick to the thought that they need to acquire languages by leaning the knowledge first, which may finally lead them to a dead end. As for me, I think my task is to introduce TBT into class, and to have my students gradually accepted the idea that language learning is not only about learning the knowledge, to guide them to see the goal of communication.
At first blush, Xin's entry was somewhat longer than Chu's. But, on closer reading, Xin's entry centered on herself and what she could do, while Chu's was both about herself as a teacher and about other teachers, as evident in her repeated use of “we.” In other words, while Xin was speaking for herself, Chu spoke for herself and for others writ large, “any Chinese teachers who would like to change a traditional class into a more communicative and engaging class,” thereby exhibiting greater clout.
Authenticity
Figure 4 shows results on participants’ originality across the 10 entries. Again, the trajectories were dynamic, waxing and waning. The linear forecasts show little uniform pattern, other than that Min's trajectory looks similar to Xin's, in that both show a downward slope over time, in contrast with Chu's, which shows an upward trend. On average, Xin had the highest authenticity (mean = 55.43), Chu the second highest (mean = 51.43), and Min a distant third (mean = 33.05). Interestingly, however, in spite of what appears mostly to be idiosyncratic dynamicity, all three participants experienced a sharp drop in authenticity on Chapter 2, following a much stronger showing on Chapter 1.
What the three entries on Chapter 2 had in common was that they, albeit to varying extent, relied heavily on what the chapter said rather than on the writers’ own ideas. Xin had the highest score (46.1) because, in addition to referencing contents of the chapter—sequencing tasks and use of first language (L1)—she brought her own prior experience and conception to bear, elaborating on her new understanding of using L1 in TBLT. Chu (30.5), on the other hand, though sprinkling her own sentiments here and there, wrote mostly about what Willis and Willis (Reference Willis and Willis2007) advised teachers to do. Min had the lowest score (15.9). She mostly regurgitated the reading, a stark contrast with her entry on Chapter 1 (54.9) showing much more authenticity, where she wrote considerably more about her own experience than about the chapter. However, Min's last entry—exhibited in Extract 6, displayed a return to higher authenticity (48.1), but this time around, it demonstrated a giant leap in her understanding of TBLT.
Extract 6: Min's Entry on Chapter 10
Wed., Mar 29, 2017, at 2:32 p.m.
Chapter 10 is the final chapter, but it continues to inspire me to look at language teaching in a different way. In addition to giving advice on how to adapt the textbook in TBLT teaching, the chapter seeks to answer criticisms and perceived problems concerning TBLT. I am further convinced that TBLT is a more reasonable and effective way in teaching language than traditional approaches.
The major concern about TBLT is lack of time. By tweaking course books, teachers can save planning time, and by assigning students with task preparation as homework, teachers can make classroom time more efficient. The later part is particularly important because it also reflects the learner-centered approach, which is the core of TBLT. This chapter provides many strategies of how to get learners involved in preparing tasks and practicing language independently. I found it very helpful and it embodies the theory that I have learned in APA.
Learner-centered is the principle I have embraced the most. From APA, I have learned that the learner is the one who controls learning and processing. Providing conditions to motivate the learner's participation and completing the task is a necessity. Only by doing so can the learners process and learn the language. The traditional teacher-led one way teaching cannot attain this effect. In the last few months, I applied the methodology of TBLT in CTP and student teaching. It was a valuable experience even though there were many insufficiencies due to my novice. I was happy to see the student engagement and language production. The textbook and the chances of practice that the course has provided changed my view of teaching and gave me a clear picture of TBLT: TBLT is all about learners and communication; teachers are facilitators; traditional form-focused teaching cannot facilitate communication; meaning is primary; TBLT does not ignore grammars, they arise in tasks and are taught at the end of the tasks, so the learners acquire them naturally. Learners take control and responsibility of their learning.
As a novice language teacher, learning from the textbook “Doing Task-based Teaching” and the course of TCSOL is more than skill acquiring, it is mind-opening.
While much of this entry was about her own take-away, Min did reference the content of the chapter, but the way she did it had changed: Now it was less regurgitating but more summarizing. This entry showed a great deal of synthesis, as well, of input coming from a variety of sources, not least her own ongoing student-teaching experience, signaling internalization of learning.
Emotional Tone
Figure 5 shows the results on emotional tone. Common to all participants, the emotional tone went up and down from one entry to the next. But the linear forecasts illustrate similar, downward trajectories, though much more striking for Chu (the orange lines) and Min (the gray lines) than for Xin (the blue lines). The emotional tone peaked at different data points for the three individuals: on Chapter 3 for Xin (89.2), Chapter 4 for Chu (95.5), and Chapter 1 for Min (98.3). It fluctuated the most—based on the highest and lowest score discrepancy—in Min (72.5), less in Xin (63.4), and least in Chu (59.3). Extract 7 presents Chu's entry on Chapter 4, which far outstripped the rest of her entries in terms of emotional tone.
Extract 7: Chu's Entry on Chapter 4
Thu., Feb. 16, 2017, at 12:15 p.m.
I do benefit a lot from reading this chapter. I found that sometimes I am subconsciously using some of these techniques such as listing, problem solving, sharing personal experience, but I never think about the reason why I continue to find these procedures being such helpful during Chinese teaching. By reading this chapter, I realize being a great Chinese teacher doesn't just mean to teach Chinese well at a time. It requires way more than that, including asking questions by myself, making connections between theoretical approaches and daily practice, and looking for more creative and advanced way of teaching approach.
I also appreciate the effort of researches put to create the Figure 4.1 (Sample topics from around the world). From this chart, what I've learned is that topics should be related to real-life situations based on students’ needs and goals. It's interesting to classify these topics from the cognitive perspective. If I teach Chinese to people from all over the world, I would create a syllabus which meets their communicative needs, like people in the USA and Canada might care about how to prepare for winter, and European students would like to talk about their daily eating preferences. Introduced with this figure and analytical method, I believe that we should design more country-specific or culture-specie textbooks and syllabus in which language serves as a tool of communication instead of linguistic knowledge.
This entry exuded positive emotions about the chapter, as evident in expressions such as “I do benefit a lot,” “find these procedures being such helpful,” “By reading this chapter, I realize,” “I also appreciate,” to name but a few. Essentially, Chu heaped praise on the usefulness of the content of the chapter.
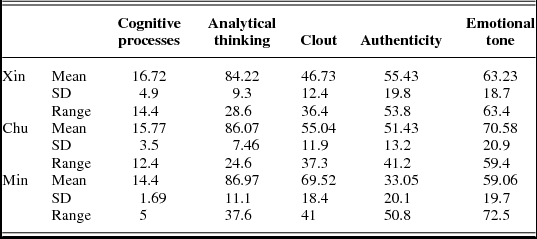
LIWC for All Participants: Mean, Standard Deviation, and Range

Note. SD = standard deviation.
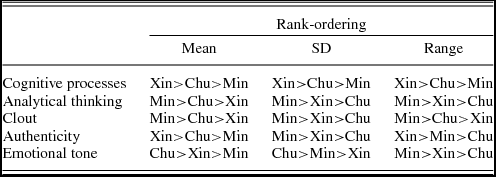
Rounding up the LIWC analyses, Table 3 summarizes the means, deviations, and ranges of scores for all participants. The information provided in Table 3 makes it possible to rank-order the participants’ overall performance on the content dimension of their journal entries, across five different measures. The rankings are given in Table 4.
Participant Rankings Based on LIWC Analyses

As seen in Table 4, the rankings are not always consistent. The mean-based ranking speaks to the participants’ aggregated performance on the reading journal task; the ranking by standard deviation sheds light on the stability of performance; and the ranking by range reflects magnitude of change.
Language Learning
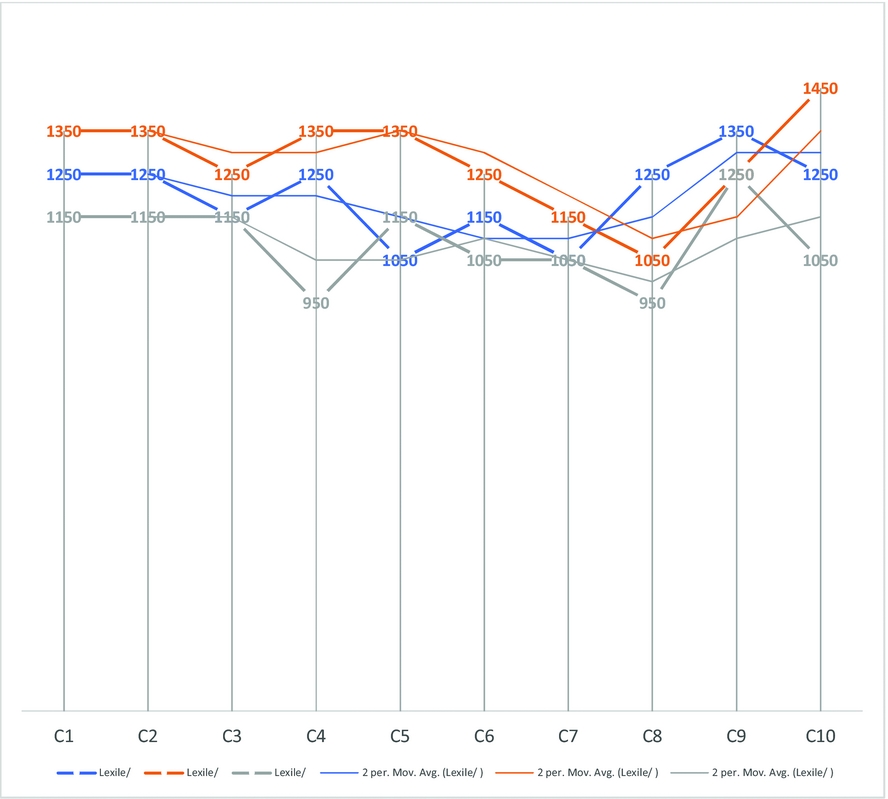
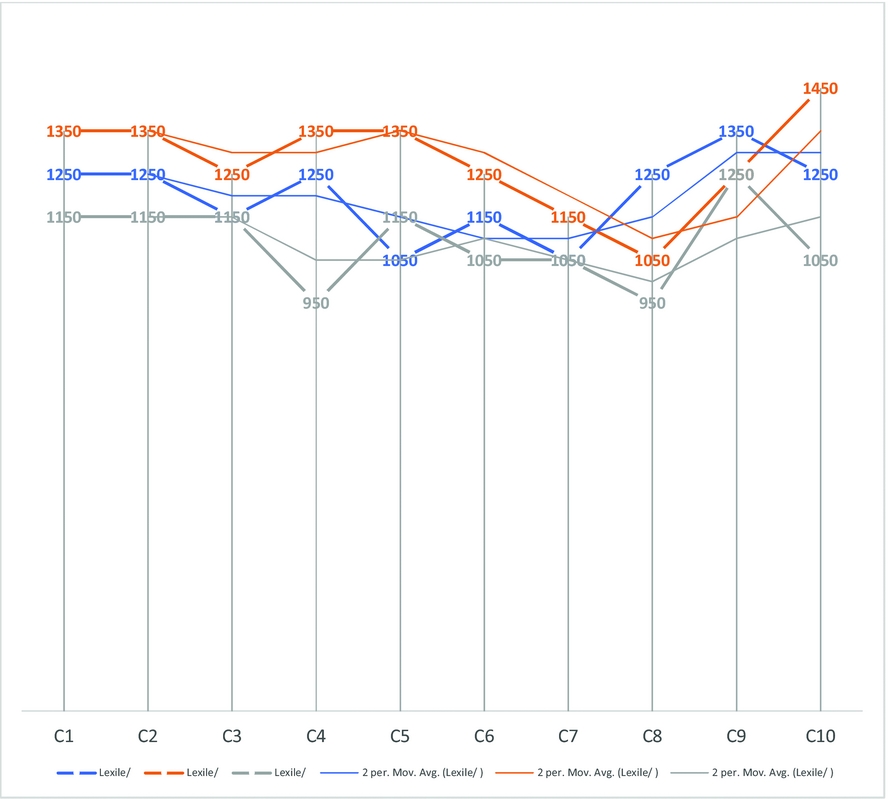
Lexile analysis of linguistic sophistication—a combination of syntactic and lexical complexity—yielded results displayed in Figure 6. Again, variation is seen both across and within the three participants. On average, Chu performed at a higher level (mean = 1280L) than Xin (mean = 1200L) and Min (mean = 1050L), suggesting that Chu was linguistically the most advanced, followed by Xin and trailed by Min. But most relevant, the upward ending of moving averages (represented by the thinner lines) portended continued rise in linguistic sophistication for all of them.
Lexile scores for all participants across 10 entries with moving averages.
DISCUSSION AND CONCLUSION
The present study set out to gauge content and language learning in trainee teachers attending a certificate program in TCSOL, focusing on one of the ongoing tasks participants undertook, writing a weekly reading journal. Results from both quantitative and qualitative analyses demonstrated substantive content learning. All three participants displayed a common set of signs of change in their understanding of the subject. Their LIWC scores across the board (see Table 3) illustrate similar, sustained levels of cognitive engagement with the material and the task. The scores on both cognitive processes and analytical thinking point unambiguously to a process of learning marked by a challenging start and a relatively easy end (Figures 1 and 2).
On the psychological plane, the participants’ self-confidence grew over time, as manifested in their increasing scores on clout for Xin and Chu. Even for Min, whose scores fluctuated the greatest (see scores under Range in Table 3), her self-confidence surged in her entries on Chapters 4 through 7 (see Figure 3).
Authenticity, operationalized as originality or the extent of speaking outside the realm of a given chapter, provided another psychological window on participants’ content learning (see Figure 4). As with clout, the picture is nuanced: Both Xin's and Min's entries exhibited a downward trend over time, an indication that they increasingly converged on the book, or put differently, Xin and Min were increasingly “sold” on the content of the chapters. Chu's entries, in contrast, exhibited an upward trend, exuding greater authenticity over time, an indication that she increasingly extrapolated away from the chapters.
The emotional tone, yet another psychological window on participants’ content learning, varied across the journal entries for all three participants, illustrating changing emotional intensity toward the chapters. Interestingly, but not surprisingly, the emotional intensity peaked and valleyed differently for different individuals. For instance, it peaked at Chapter 4 for Chu, at Chapter 3 for Xin, and Chapter 5 for Min.
Participants’ learning of content was, therefore, dynamic, granular, and nuanced, happening not only at cognitive levels but also at psychological levels. Given the amount of content learning, it is only natural to expect language development happening along the way. The Lexile analysis focusing on the linguistic sophistication of the entries, indeed, bear out the expectation. The scores varied, of course, but overall portended continued growth in linguistic sophistication for all three participants (see Figure 6). This language gain may seem minimal to some. While I am sympathetic with the appetite for more, I hasten to note that the expectation of anything greater at this point should be tempered by several considerations. First, the participants were L2 users of English—with a highly functional linguistic competence—as opposed to earlier-stage learners. Dramatic gains in L2 development are, therefore, not to be expected anyway, following the power law of practice (DeKeyser, Reference DeKeyser, VanPatten and Williams2015). Second, the present study, longitudinal as it was (spanning one semester), uncovered only one temporal segment of the learning process. Third, learning in the present framework of analysis (i.e., multidimensional and dynamic) should not be judged in terms of black-and-white changes but, rather, nuances or sophistication of expressions. The study, above all, offered an organic rather than contrived view (as often happens with lab-based studies) of part of the growth process.
Overall, the study provided tangible evidence in support of a fundamental tenet of TBLT—though still understated in the current literature—that it can result in both content and language learning, and demonstrated it for the first time in a non-language-learning arena. This opens up not just one additional avenue, that of foreign language teacher training, for investigating the potential of TBLT but also, conceivably, multiple avenues, so long as the contexts are content-based and involve L2 learners or users—content-based instruction in K–12 schools, vocational training for immigrants, and the like.
Methodologically, the present study is unique in several ways. First, it invoked multiple measures of content learning, engaging both cognitive and psychological dimensions, thereby breaking with the traditional content measures of propositional units (see, e.g., Ellis & Barkhuizen, Reference Ellis and Barkhuizen2005). The inclusion of psychological measures was particularly productive and illuminating, not to mention that it brought a vital, humanistic dimension to content learning.
Second, the study employed robust automated tools for its data analysis but cross-checked the results through qualitative analysis of the data. The use of automated tools allowed both breadth and depth of analysis and, importantly, objectivity. It eschewed the necessity of a second human coder to help achieve a high level of reliability of data coding and served to fend off criticisms of lack of reliability of data coding in the present study. However, recognizing the probabilistic nature of automated analyses due to the deployment of algorithms, which essentially treat variables as if they were categorical, the present study buttressed the automated analyses with manual qualitative analysis. The importance of the qualitative analysis lay squarely in giving contextual meaning to—and thereby substantiating—the automated results.
Third, the present study employed longitudinal data in its quest to understand learning from a teacher training program. Pursuing a purposeful sampling of three individuals rather than the entire group, the study sought to achieve an understanding of learning that was broad enough to extrapolate to the group of trainees in question (see Larsen-Freeman, Reference Larsen-Freeman, Ortega and Han2017, on the issue of generalizability in dynamic systems research) but, simultaneously, sufficiently narrow to approximate the dynamic “inner workings” of growth.
The outcome of these endeavors is gratifying. But more so is the heuristic value of the findings. Variability, for example, is a big finding from the present study, but it is also very difficult to explain. Why did the participants respond differently to the different chapters, cognitively and psychologically? What might have underlain the dynamic interplay between the writer, writing, the text, and reading, and how did the input the participants received elsewhere in the program, like class discussions, partake in that interplay?
Another big finding from the present study stems from the task itself—the task seemed conducive to learning about TBLT. But what was it about the task that sparked changes in the cognition and the psychology of the writers? How big a role did the content of reading play in generating changes? The reading in this case was a book on TBLT, comprising multiple chapters each devoted to a subtopic. Perhaps some subtopics bore closer connection and some less, from the writers’ perspectives. Perhaps some subtopics came across as more abstract than others. Perhaps some subtopics were closer to the writers’ own experiences than others. Or perhaps it was a writer's repeated encounter with similar content across the chapters that triggered changes in her cognition and psychology.
The reading the participants engaged in was quite like narrow reading (Krashen, Reference Krashen2004). Krashen has touted the value of narrow reading for L2 learners—it leads to better comprehension of content and acquisition of language. If so, it must have been the singular topical focus on TBLT elaborated from multiple angles (via the chapters) by the same authors that led to changes in the participants’ comprehension of the chapters. The reading the participants engaged in also bore resemblance to repeated reading (Samuels, Reference Samuels1979), in that, week after week, the participants read from the same book. Repeated reading is a strategy that has been amply investigated among L1 incipient readers, yielding strong findings on its benefits for improving comprehension and vocabulary development. L2 research on repeated reading is still in its infancy. A longitudinal case study of a heritage speaker of Chinese by Han and Chen (Reference Han and Chen2010) yielded impressive gains in vocabulary acquisition.
In the present study, the task that the current participants engaged in was not entirely a reading task nor a writing task, but a dual task. The writing part was not quite like writing a summary—where some regurgitation was expected (see, e.g., Douglas & Miller, Reference Douglas and Miller2016). Instead, participants wrote about their thoughts on what they had read. There was, therefore, a greater creative dimension to it than writing a summary. In other words, there was much room for the writers to generate and express their own meaning. Could this creative dimension have helped catalyze learning?
All these questions warrant future investigation, to further elucidate the learning documented in the present study. Seeking answers to these questions would prove a worthwhile undertaking and may contribute to the theoretical and practical knowledge of task-based learning—a type of learning, as the present study has attested, that is extendable to other educational settings such as foreign language teacher training.
Acknowledgments
The reviewers and the editor provided thoughtful comments on a previous version of this article. Any inadequacies that remain are my own.