

TESTING HYPOTHESES ABOUT LANGUAGE LEARNING USING STRUCTURAL EQUATION MODELING
For more than 15 years, researchers in second language acquisition (SLA) have written that structural equation modeling (SEM) is an opportune research tool for investigating the likelihood and strengths of the field's theories and hypotheses (In’nami & Koizumi, Reference In’nami and Koizumi2011; Isemonger, Reference Isemonger2007; Kunnan, Reference Kunnan1998, Reference Kunnan1999, Reference Kunnan2010). SLA researchers have proposed that SEM is good for investigating fairness in language testing (Kunnan, Reference Kunnan2010), for measuring the effects of different instructional types on learning (In’nami & Koizumi, Reference In’nami and Koizumi2011), for investigating what influences bilingual development (Lewis & Vladeanu, Reference Lewis and Vladeanu2006), and for measuring the effects of knowledge structures (such as metalinguistic knowledge) that impact second language (L2) performance (Isemonger, Reference Isemonger2007). Prior to 2008, SLA researchers used SEM and demonstrated its great potential for L2-testing research (In’nami, Reference In’nami2006; Purpura, Reference Purpura1998; Schoonen, Reference Schoonen2005; Turner, Reference Turner1989), individual differences (IDs) research (Csizér & Dörnyei, Reference Csizér and Dörnyei2005; Gardner, Tremblay, & Masgoret, Reference Gardner, Tremblay and Masgoret1997; Matsumura, Reference Matsumura2003; Sasaki, Reference Sasaki1993; Tremblay & Gardner, Reference Tremblay and Gardner1995; Woodrow, Reference Woodrow2006; Yashima, Reference Yashima2002), investigations into the effects of knowledge structures (Schoonen et al., Reference Schoonen, Van Gelderen, De Glopper, Hulstijn, Simis, Snelling and Stevenson2003), and questions about bilingual development (e.g., Verhoeven, Reference Verhoeven2007). Within the last five years, the pace at which SEM is being applied to SLA data has increased. SEM is becoming a more frequently used tool, appearing in a wider variety of SLA journals, and it is used with more varied contexts of language learning, as I will demonstrate.
Using SEM for data analysis is becoming more popular in SLA most likely because SLA theories are coming of age. They are more sophisticated and complex, with proposed associations among multiple, complex variables, necessitating the need for robust model testing. Two requirements for SEM are more often being achieved. The first is reliable data collection tools. Many of the field's data collection instruments have been tested over time and have been proven to be reliable and valid, making the use of SEM possible: SEM takes measurement error into account when a model is tested (Kline, Reference Kline and Hoyle2012; Schumacker & Lomax, Reference Schumacker and Lomax2010), so little measurement error (high reliability) in the tests or surveys used to operationalize the traits in the model (often demonstrated via high Cronbach's alpha coefficients) is essential for model testing with SEM. The second requirement is large participant numbers. How large is debated, especially for the field of SLA (In’nami & Koizumi, Reference In’nami and Koizumi2011; Winke, Reference Winke2013), but in general, SEM “is a large-sample technique” (Kline, Reference Kline and Hoyle2012, p. 11), and the more complex the model, the more participants the testing of that model requires. Further augmenting the use of SEM, as noted by Schumacker and Lomax (Reference Schumacker and Lomax2010), is that the software packages for SEM have become more user friendly. After a class on SEM or an in-depth workshop, even statistically adverse researchers can employ SEM by using statistical packages such as IBM's SPSS Amos (http://www-03.ibm.com/software/products/en/spss-amos). Thus it is time to take a step back and look at this statistical technique as it is being used in SLA. What are the overarching patterns of use, and how can researchers continue to use it successfully?
In this article, I first briefly define SEM in a way that novice SLA researchers can understand the basic concepts underlying SEM. Then I summarize how SEM has been used over the last five years (between 2008 and 2013) in the field of SLA, and I review what I see as SLA researchers’ main problems in using SEM. In connection with these problems, I propose some possible solutions and methodological directions for future researchers who use this data-analysis technique.
A SIMPLE INTRODUCTION TO SEM
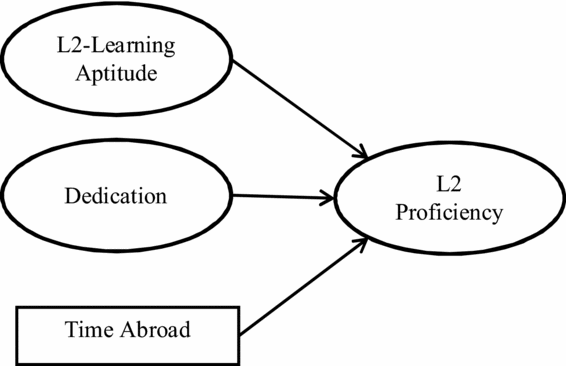
One does not have to be an applied linguist to have an opinion about what it takes to learn an L2. Ask anyone on the street what is important, and he or she might say, for example, that three things are needed: (a) One has to be good at learning languages (i.e., have an aptitude for language learning), (b) be dedicated to learning the language (i.e., put time and effort into learning), and (c) spend time abroad in a country where the language is spoken. So in a way, this person on the street has articulated an imagined model of what it takes to learn a new language. In other words, he or she specified a model that can be estimated and tested, which is the first step in an application of SEM (Hoyle, Reference Hoyle and Hoyle2012b). This particular hypothesized model, if drawn out, might look like what is presented in Figure 1. Applied linguists familiar with the conventions of modeling (e.g., Byrne, Reference Byrne2010; Ho, Stark, & Chernyshenko, Reference Ho, Stark, Chernyshenko and Hoyle2012; Kline, Reference Kline2011; Schumacker & Lomax, Reference Schumacker and Lomax2010) will recognize the variables in the ovals are latent traits, variables that exist but that cannot be measured directly (such as L2-learning aptitude and dedication, which are as of yet undefined in this model and therefore hidden), while the variables in rectangles are indicator or manifest variables, things that are directly measured (e.g., the amount of time abroad can simply be measured in months; see Bollen & Hoyle, Reference Bollen, Hoyle and Hoyle2012, for more on latent variables.) The applied linguist wanting to test this model (see if the model fits with data) is looking to see how the variables on the left (the independent variables) affect or influence the variable on the right (the dependent variable). The cause and effect relationships (direct effects; regression coefficients) are symbolized with single-headed arrows, and these effects are what are equated through SEM (see Pearl, Reference Pearl and Hoyle2012, for a discussion of the cause and effect foundations in SEM).
A simple hypothesized model or path of L2 learning with both latent and manifest variables.

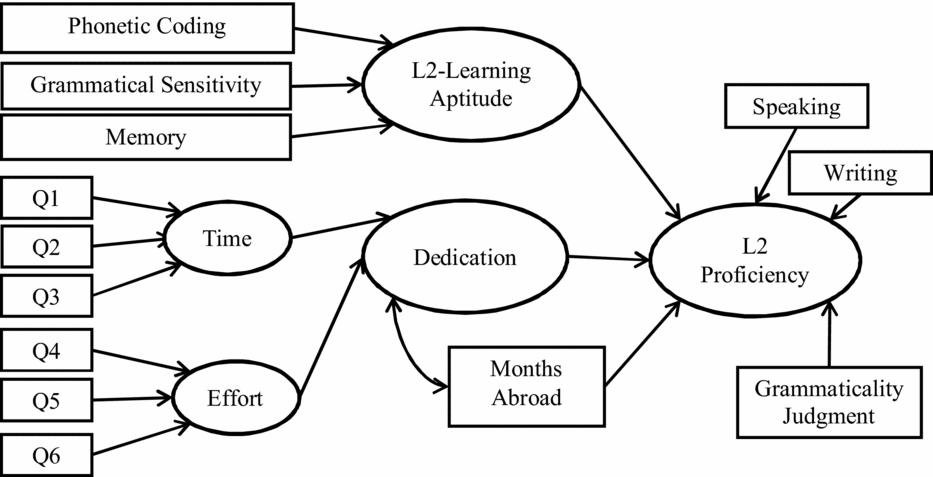
The model in Figure 1 is simple. As researchers ask more questions about the model and further define its variables and the relationships among them, the model becomes more complete (testable), but also more complicated, as shown in Figure 2. L2 proficiency, it might be decided, will be measured through two performance tests (speaking and writing) and one grammaticality judgment test. The applied linguist might suppose a relationship between two of the independent variables: Learners who are more dedicated will spend time abroad and vice versa. Such a relationship is a hypothesized correlation, symbolized with a curved, double-headed arrow (Schumacker & Lomax, Reference Schumacker and Lomax2010, see chapter 3 on correlations). L2-learning aptitude might be defined through three composite measures from the Computer-Based Modern Language Aptitude Test (CB-MLAT; see the Language Learning and Testing Foundation website for information on the test at http://lltf.net/): the Number Learning test (which measures, theoretically, phonetic coding ability); the Words in Sentences test (which assesses grammatical sensitivity); and the Paired Associates test (a test of memory; Skehan, Reference Skehan and Robinson2002). Dedication might be hypothesized as made up of two separate concepts (or factors). The first might be time spent on average per week doing three things in the L2 (movie watching, book reading, and talking; measured through three questionnaire questions). The second factor might be self-estimated levels of effort in studying vocabulary, grammar, and writing conventions (measured through three additional questions given on the same questionnaire). This part of the measurement model will be subjected to confirmatory factor analysis or CFA (see Henry & Cliffordson, Reference Henry and Cliffordson2013; Kline, Reference Kline2011; Turner, Reference Turner1989) because the model suggests that the six items subsumed under dedication actually break down into two independent components or factors.
A hypothesized model of L2 learning. This is a full latent variable (structural) model that can be tested with SEM.
As plotted in Figure 2, the applied linguist has now created a complex structure of variables and their hypothesized relationships. Theoretically, the model can be broken down into two parts: First, the observed variables (in rectangles) that indicate (through arrows) the latent traits (in ovals) are what constitute the measurement model, and the relationships among the latent traits (i.e., the ovals and the arrows connecting the ovals) are the path model (see McDonald & Ho, Reference McDonald and Ho2002). The means of and the variance within the factors (or variables) in the model can be compared and tested with SEM. In this particular full latent trait (structural) model, the analysis through SEM combines CFA, correlation, and regression analyses into one package so that the entire model can be tested at once (Byrne, Reference Byrne2010).Footnote 1 Researchers testing this model with SEM will find out, for example, how much of the variation in L2-learning aptitude accounts for (or predicts) variation in L2 proficiency (revealed through a regression coefficient). In fact, every arrow (each parameter) in the model will be equated, that is, each will have an effect size (single-headed arrows) or correlation (double-headed arrows) estimated for it. Each of these coefficients, in turn, will be tested for significance. The procedure for generating these estimates is by associating indicator-variable data from a specific population with the model structure. The biggest question of all is this: From whom shall the data come?
The data set is of utmost importance because there are, as any applied linguist knows, many different models of L2 learning, and any given model may work with one population, but not another. This is why models tested with SEM are described as plausible with a given data set or not. As stated earlier, with SEM, researchers can investigate a single proposed set of relationships among one or more independent variables and one or more dependent variables. A model that is found to be consistent with the data through SEM has nothing to say about whether a better model might be possible with the existing set of data or with other data. Thus, the results stemming from SEM are grounded within the context of the particular data set (i.e., within the context of the particular L2 being learned, and with the particular people from whom the data were collected). Because of this, a benefit of SEM is that researchers can use it to compare models (using chi-square difference tests, as explained in Kline, Reference Kline2011). A model can be tested over time with the same population (see Barkaoui, this volume; Li, Reference Li2013; Little, Reference Little2013). A model can be tested across different data sets (e.g., Andringa, Olsthoorn, van Beunigen, Schoonen, & Hulstijn, Reference Andringa, Olsthoorn, van Beuningen, Schoonen and Hulstijn2012; Dale, Harlaar, & Plomin, Reference Dale, Harlaar and Plomin2012; Ghonsooly, Khajavy, & Asadpour, Reference Ghonsooly, Khajavy and Asadpour2012; Guo & Roehrig, Reference Guo and Roehrig2011; Henry & Cliffordson, Reference Henry and Cliffordson2013; Kieffer & Lesaux, Reference Kieffer and Lesaux2012), or different models can be tested and compared (e.g., Cochran, McCallum, & Mee Bell, Reference Cochran, McCallum and Mee Bell2010; MacIntyre, MacMaster, & Baker, Reference MacIntyre, MacMaster, Baker and Schmidt2001; Song, Reference Song2008, Reference Song2012; W.-T. Tseng & Schmitt, Reference Tseng and Schmitt2008). Best of all, with SEM, the structural relations can be plotted graphically, as in Figure 2, which enables a very clear visualization of the theory under study (Byrne, Reference Byrne2010). These benefits are what attract applied linguists to this method of data analysis.
THE LAST FIVE YEARS OF SEM IN SLA RESEARCH
The last five years has seen tremendous growth in the use of SEM by SLA researchers. By searching for SEM studies in the Linguistics and Language Behavior Abstracts (LLBA), and by restricting this search to peer-reviewed articles within foreign or SLA, bilingualism, L2 learning, or L2 testing, I found 39 articles using SEM have been published since 2008. I found two SEM overview articles (In’nami & Koizumi, Reference In’nami and Koizumi2011; Kunnan, Reference Kunnan2010). These are excellent, as are recent textbooks on SEM (i.e., Byrne, Reference Byrne2010; Hoyle, Reference Hoyle2012a; Kline, Reference Kline2011; Little, Reference Little2013; Schumacker & Lomax, Reference Schumacker and Lomax2010), and I refer readers to them to further understand the technical details of SEM and how SEM compares to non-model-testing (descriptive) statistics, such as exploratory factor analysis, correlation, and simple and multiple regression. I review only peer-reviewed research articles from the last five years to continue from where In’nami and Koizumi left off (their review of SEM studies was on those published up until 2008) and to give more of an overview of how researchers are using this data analysis technique most recently. The field of psychology also has review articles on how SEM has been applied since 1985 to psychological research, and I refer readers to those articles to understand more fully SEM's various applications (Hershberger, Reference Hershberger2003; MacCallum & Austin, Reference MacCallum and Austin2000; Tremblay & Gardner, Reference Tremblay and Gardner1996).
For the purpose of this review, I first made a spreadsheet summary of the 39 SEM research articles to categorize the articles by author, year, journal, number of participants, their independent and dependent variables, and number of parameter estimates. I also noted which type of SEM the researchers used. Notably, 37 out of the 39 studies presented basic applications of SEM (Kline, Reference Kline2011): CFA, path analysis, or full latent trait (structural) model testing.Footnote 2 The two others presented latent growth curve modeling (Kieffer, Reference Kieffer2011; Mancilla-Martinez & Lesaux, Reference Mancilla-Martinez and Lesaux2010), which is but one of the many advanced applications of SEM (see parts IV and V in Hoyle, Reference Hoyle2012a, for an overview of the basic and advanced applications). I also noted whether language learning or development was part of the measurement model (it was for 26 out of the 39). I recorded if there was a comparison of models (yes for 12). I recorded which software was used for the analysis; most used Amos, but several used EQS, LISREL, or Mplus (see Byrne, Reference Byrne and Hoyle2012, for information on SEM software types). I also recorded how many points the researchers had on their Likert scales and the average reliability of the researchers’ instruments. I will discuss some of these details after I first review the major topics the researchers of the 39 studies investigated.
Topics Investigated Using SEM
Over the last five years, research in SEM has included eight broad topic areas.
1. Linguistic knowledge structures
Eleven studies centered on how knowledge structures, as predictor (independent) variables, affect language development. The knowledge structures consisted of, for example, metacognitive knowledge, working memory, phonological awareness, or syntactic knowledge, and the dependent variables were measures of, for example, discourse comprehension, reading comprehension, reading fluency, listening comprehension, writing proficiency, or vocabulary development. The authors tested their knowledge-structure models on the language development of adults older than 18 years of age (Andringa et al., Reference Andringa, Olsthoorn, van Beuningen, Schoonen and Hulstijn2012; Guo & Roehrig, Reference Guo and Roehrig2011; Pulido & Hambrick, Reference Pulido and Hambrick2008; Zhang, Reference Zhang2012), teenagers (Marx & Roick, Reference Marx and Roick2012; Schoonen, van Gelderen, Stoel, Hulstijn, & de Glopper, Reference Schoonen, van Gelderen, Stoel, Hulstijn and de Glopper2011), or children (Dale et al., Reference Dale, Harlaar and Plomin2012; Kieffer, Reference Kieffer2011; Kieffer & Lesaux, Reference Kieffer and Lesaux2012; Yaghoub Zadeh, Farnia, & Geva, Reference Yaghoub Zadeh, Farnia and Geva2012), with three additional studies specifically focusing on children's Spanish/English (Mancilla-Martinez & Lesaux, Reference Mancilla-Martinez and Lesaux2010; Proctor, August, Snow, & Barr, Reference Proctor, August, Snow and Barr2010) or Chinese/English (Pasquarella, Chen, Lam, Luo, & Ramirez, Reference Pasquarella, Chen, Lam, Luo and Ramirez2011) bilingual development. Three of these seven child studies were extremely large in scale in comparison to most others within this strand (and also when compared to all of the 39 studies’ sample sizes), with 952, 1,632, and 9,189 participants, respectively. (Excluding these three, the remaining nine studies investigating knowledge structures had an average of 232 participants.) The one with 1,632 children was developed out of well-funded data-collection efforts in Britain (Dale et al., Reference Dale, Harlaar and Plomin2012), and the other two were based on U.S. census data (Kieffer, Reference Kieffer2011, with 9,189 children; Kieffer & Lesaux, Reference Kieffer and Lesaux2012, with 952 children). Two (Dale et al., Reference Dale, Harlaar and Plomin2012; Kieffer & Lesaux, Reference Kieffer and Lesaux2012) of these three large-scale studies are extremely unique and important because they tracked children's L2 development from toddlerhood to the young teen years and included socioeconomic status as one of the predictor variables. Meanwhile, Kieffer (Reference Kieffer2011) revealed that socioeconomic status (in particular, poverty) is a factor that shapes future language learning development over and beyond initial language levels in kindergarten (around age 5 years). More studies on knowledge structures are certainly needed, and large-scale ones that investigate factors that contribute to language learning (and bilingual development) during early childhood are clearly warranted as they can help define theories about child-language education in general.
2. Language testing
Seven studies were in the area of language testing. All of these language-assessment studies were conducted with college or university English language learners, an obviously abundant type of test taker. The researchers of these studies looked at what influences test preparation (Xie & Andrews, Reference Xie and Andrews2013), how test-taking strategies influence writing test performance (Yang, Reference Yang2012), and how note-taking affects listening test performance (Song, Reference Song2012). Four articles were construct-validation studies (Aryadoust, Reference Aryadoust2010; Phakiti, Reference Phakiti2008a, Reference Phakiti2008b; Song, Reference Song2008), three of which used CFA to investigate the subcomponents of larger constructs (Aryadoust, Reference Aryadoust2010; Phakiti, Reference Phakiti2008a, Reference Phakiti2008b). The SEM studies in language testing have continued to demonstrate the great promise of SEM to aid in the validation of language assessments. Measurement researchers have paved the way for language-testing researchers who want to use SEM; in particular, SEM specialists have described SEM as a way to validate tests and estimate the reliability of tests (Raykov, Reference Raykov and Hoyle2012; Raykov, Dimitrov, & Asparouhov, Reference Raykov, Dimitrov and Asparouhov2010; Raykov & Marcoulides, Reference Raykov and Marcoulides2013). However, language-testing-SEM studies need to be diversified through theory testing with data from more varied populations (i.e., with data from test takers being assessed in languages other than English).
3. Motivation
Six studies were squarely on motivation. Of these, however, only one was on motivation's effects on learning; in particular, it was on how vocabulary-learning motivation affected vocabulary knowledge (measured in size and depth; W.-T. Tseng & Schmitt, Reference Tseng and Schmitt2008). Of these six, one was on German as an L2 (with young teens) in Germany and Switzerland (Wolfgramm, Rau, Zander-Musić, Neuhaus, & Hannover, Reference Wolfgramm, Rau, Zander-Musić, Neuhaus and Hannover2010). One was on German and English as a foreign language in Hungary (Csizér & Kormos, Reference Csizér and Kormos2009). The other four were on English as a foreign language in Iran (Papi, Reference Papi2010), Japan (Hiromori, Reference Hiromori2009), Sweden (Henry & Cliffordson, Reference Henry and Cliffordson2013), and (the vocabulary motivation study) Taiwan (W.-T. Tseng & Schmitt, Reference Tseng and Schmitt2008). Interestingly, none of these SEM studies on motivation investigated whether a model of motivation necessarily changes over time for any given set of learners. This most likely needs to be done because motivation theorists have posited that motivation is an ever-shifting variable that must be sustained over time (Dörnyei, Reference Dörnyei2009; Ushioda & Dörnyei, Reference Ushioda, Dörnyei, Gass and Mackey2012). Elements that contribute to the sustainment need to be investigated, and cross-sectional or longitudinal multimodel testing within this area may be fruitful.
4. Willingness to communicate
Five studies were on language learners’ willingness to communicate (WTC) in the target language. One of these studies investigated how WTC affects language development (speaking, listening, reading, and writing), but the researchers of that study did not provide information on how they assessed the language (Aidinlou & Ghobadi, Reference Aidinlou and Ghobadi2012). Two studies had clearly defined dependent variables: perceived stress (Gallagher, Reference Gallagher2013) or WTC during group work (Fushino, Reference Fushino2010). The researchers of the other two studies investigated the components of WTC in general and how they were interrelated (Ghonsooly et al., Reference Ghonsooly, Khajavy and Asadpour2012; Peng & Woodrow, Reference Peng and Woodrow2010). All five studies involved university students learning English. Four of the five were on English as a foreign language (Aidinlou & Ghobadi, Reference Aidinlou and Ghobadi2012; Fushino, Reference Fushino2010; Ghonsooly et al., Reference Ghonsooly, Khajavy and Asadpour2012; Peng & Woodrow, Reference Peng and Woodrow2010) and one was on English as an L2 in Britain (Gallagher, Reference Gallagher2013). As with motivation, research on WTC should expand into other language-learning contexts so that the theory (that WTC is an important factor in L2 development; MacIntyre, Dörnyei, Clément, & Noels, Reference MacIntyre, Dörnyei, Clément and Noels1998) can be more robustly investigated.
5. L2-learning aptitude
Three SEM studies were on L2-learning aptitude,Footnote 3 and all three used components of the MLAT. Cochran et al. (Reference Cochran, McCallum and Mee Bell2010) explored how aptitude, native-language reading levels, attributions, and attitudes affected foreign language learning. They tested their model on 648 learners from three different L2s: Spanish, French, and German. The learners were all in 100-level language classes, and L2 learning was measured via the students’ final exam scores. Winke (Reference Winke2013) looked at how aptitude and working memory (WM), mediated by motivation and strategy use, affected Chinese learning. Li (Reference Li2013) also investigated aptitude and WM for learning Chinese, but he additionally investigated how feedback type (implicit or explicit), in connection with aptitude, affects L2 learning. Two of these studies were plagued with low participant numbers (78 in Li; 96 in Winke) because the researchers tried to ensure that the participants comprised a homogeneous group with each person having received the same quality, type, and length of language instruction. Participant numbers can be larger (as in Cochran et al., Reference Cochran, McCallum and Mee Bell2010) when instructional variance is considered to have a relatively small effect. There may be trade-offs and benefits to both approaches: If a researcher controls tightly for instruction, he or she will have fewer participants (reducing the researcher's power to reject the null hypothesis, perhaps to a dangerously low level). If he or she allows for variance in instruction, obtaining higher participant numbers (and more power), he or she will concomitantly have reduced assurance that any observed aptitude effect is the sole cause of learning differences. Perhaps in the field of SLA, both approaches are warranted because modeling the components of aptitude and relating those components with language-learning outcomes is needed on both theoretical and practical grounds. L2 aptitude researchers wrestle with whether aptitude is a static or malleable trait, a unitary or multifaceted construct, one that includes WM or inductive language learning, and whether L2 aptitude is potentially mediated by other IDs. Thus more aptitude researchers should take up SEM as a data analysis tool.
6. International posture
Three studies were on international posture or general dispositions toward language learning in relation to the targeted language's perceived status. One was on how international posture affects motivated learning behavior (Csizér & Kormos, Reference Csizér and Kormos2008); a second was on how international posture affects attitudes toward L2 learning (Rivers, Reference Rivers2010); and the third was on how various dispositions toward English (as a lingua franca, important for professional development) affect individuals’ beliefs about English and English-learning goals (Csizér & Kontra, Reference Csizér and Kontra2012). Csizér and Kormos (Reference Csizér and Kormos2008) asked German-language–learning children (ages 13 and 14 years) in Hungary about their linguistic self-confidence, their foreign media use, and their attitudes about English. They investigated whether those and other variables predicted children's self-reported motivated learning behaviors. Likewise, Rivers investigated learners’ attitudes toward language learning, this time with university students learning English in Japan. Rivers surveyed the students as to their internationalism, patriotism, and their view on the intercultural appeal of speakers of English. Csizér and Kontra investigated English learning by university students in Hungary and found that students’ English-learning goals were strongly shaped by the students’ desires to become nativelike in the language, which they noted is needed for communication with almost any non-Hungarian (for international communication in general). These studies are promising because they help applied linguists understand how cross-cultural communication, global politics, and national feelings about peoples and cultures (including potentially xenophobic inclinations) affect learning outcomes, as well as learning and teaching trends.
7. Computer-assisted language learning
One study explored individuals’ attitudes toward computer-assisted language learning (CALL). Vandewaetere, Desmet, and Leuven (Reference Vandewaetere, Desmet and Leuven2010) investigated how 240 individuals’ CALL experience, combined with their attitudes toward foreign language learning in general, affected their general attitude toward CALL. Given the plethora of research on how individual differences and different learning or teaching environments impact the effectiveness of CALL (i.e., Dooly, Reference Dooly2007, Reference Dooly2011; Razagifard & Rahimpour, Reference Razagifard and Rahimpour2010; Stracke, Reference Stracke2007; Y.-C. Tseng & Liou, Reference Tseng and Liou2006), I was surprised to find this one sole article within CALL that uses SEM as an analysis tool. This is likely a subject within SLA that may well see more SEM studies in the future. For example, Godwin-Jones (Reference Godwin-Jones2011) discussed how CALL promotes autonomous language learning because CALL helps students develop learning strategies that will most likely change as learning changes. Someone investigating such a hypothesis (or proposed cause and effect relationship between CALL and language learning, mediated by strategies) may find SEM to be a good statistical tool for doing so.
8. Acculturation
One SEM study directly examined acculturation.Footnote 4 The authors, Miglietta and Tartaglia (Reference Miglietta and Tartaglia2009), investigated how length of stay, linguistic competence, and media exposure, mediated by actual in-country use of the target language (Italian, in this case), affected Italian-as-a-second-language-speakers’ sense of emotional belonging. Using SEM, the authors found support of their model, which was based on the theory that greater competence in Italian would increase acculturation (adaption to life in Italy) and that higher language ability also would influence emotional attachment to the country both directly and indirectly. Increases in mass media consumption also aligned with greater emotional attachment to the country. This study may break new ground for study abroad researchers interested in seeing how their research may benefit from SEM. Most directly, it exemplifies SEM's potential for research that involves acculturation. Miglietta and Tartaglia conducted their study on 576 adult immigrants in Italy, but the questions are similar to those that study abroad researchers (e.g., those like Du, Reference Du2013; Mererdith, Reference Mererdith2010; Segalowitz & Freed, Reference Segalowitz and Freed2004; Yu, Reference Yu2010) often investigate: What conditions or factors contribute most to success when people learn languages outside of their home country? Study abroad is technically defined as a temporary stay in a foreign country with the purpose of language acquisition (Kinginger, Reference Kinginger2009, p. 18), and this is not to be confused with the permanent type of stay dealt with in Miglietta and Tartaglia (Reference Miglietta and Tartaglia2009). However, if study abroad researchers investigating aspects of acculturation or study abroad L2-learning success (or both) can obtain large enough sample sizes, they could consider using SEM to test their theories.
SLA RESEARCHERS’ MAIN PROBLEMS IN USING SEM AND POSSIBLE SOLUTIONS
By overviewing the 39 empirical research articles that have used SEM over the last five years, I can see that the authors of the studies are doing most things right, which is not surprising given that the journals in which the studies appeared have rigorous reviewing processes. The authors are following recommendations to report multiple fit indices (Hu & Bentler, Reference Hu and Bentler1999; McDonald & Ho, Reference McDonald and Ho2002). They mostly have adequate sample sizes (as I will explain), and they generally report the reliabilities of their instruments. But this is not always the case. I found that a few of the issues (including sample size and reliability) were previously discussed by In’nami and Koizumi (Reference In’nami and Koizumi2011), but they are still slightly problematic. In the following section I will review four problems (sample size, model presentation, reliability, and Likert-scale points) that I think can be addressed well in this article. I will discuss the potential sources of the four problems and also provide some possible solutions. These four issues are important to discuss because novices embarking on their own research with SEM need to be aware of these up front before they finalize their research designs.
Sample Size
The 39 studies mostly have adequate sample sizes, except for, perhaps, Andringa et al. (Reference Andringa, Olsthoorn, van Beuningen, Schoonen and Hulstijn2012), who tested a complex model with more than 50 parameters on data from as few as 113 participants. As noted by In’nami and Koizumi (Reference In’nami and Koizumi2011), who were citing Raykov and Marcoulides (Reference Raykov and Marcoulides2006), researchers who want to apply SEM to their data should have a minimum of 10 participants per parameter to be estimated. With 50 parameters, the minimum number would be 500 subjects. In fact, with such numbers (50 parameters, 500 subjects), the power to reject the model is quite close to 1 (see table 2 in MacCallum, Browne, & Sugawara, Reference MacCallum, Browne and Sugawara1996). A statistically desired power is 0.8 (an 80% probability that the testing of the model would not make a type II error, that is, fail to reject the model when it is actually not plausible). But of course in SLA, unless census data is tapped into (like in Kieffer, Reference Kieffer2011, a study with 9,189 participants), or unless the model is notably noncomplex (with few parameters to estimate, as in Li, Reference Li2013), obtaining a high ratio of parameters to participants is notably difficult. Within the field of SLA, SEM-research reviewers may be wise to accept a minimum of 10 subjects per parameter, lest the field suffer, perhaps, from a lack of model testing. The field could compensate for low power in its SEM studies by encouraging replications and model testing across various subject groups and learning contexts. Another solution researchers can apply is to collapse theoretically related indicator variables into larger composites, which renders latent traits into indicator variables, but at the same time reduces the number of parameters to be estimated. While this may be controversial, this was done in Winke (Reference Winke2013), where I created a composite score out of items on a survey (the Strategy Inventory for Language Learning or SILL; Oxford, Reference Oxford1990) that theoretically represented five factors or subsets of items. I used the one score (rather than five subscores) to indicate what normally is considered a latent variable, effectively stripping out a submodel that would require both CFA and more participants. I did this to make the model less complex (with fewer parameters) and thus easier to identify, although it weakened the theoretical model (rendered the model a less accurate representation of the underlying strategy construct). While there are potential solutions when participant numbers are low, SLA researchers should strive for larger participant numbers when possible, and perhaps this can be achieved through data mining (as done by Kieffer, Reference Kieffer2011) rather than data collecting.
Model Presentation
When reviewing the SEM articles, I sometimes saw the authors split the presentation of the measurement model from the path model. While this is fine, it can be confusing for those new to SEM. For example, Guo and Roehrig (Reference Guo and Roehrig2011) suppressed the indicator variables from their latent trait (structural) model (see figure 2, p. 56 in their article)—they presented the path model only in figure 2. They left the indicator variables off for simplicity in presenting the model. The measurement portion of the model was presented earlier in figure 1 (p. 55 of their article). Thus, readers wanting to visualize the full model must combine the two parts. Similarly, path-only (no-indicator) models were presented by Hiromori (Reference Hiromori2009), Pulido and Hambrick (Reference Pulido and Hambrick2008), Csizér and Kormos (Reference Csizér and Kormos2008), and Csizér and Kontra (Reference Csizér and Kontra2012). In Csizér and Kormos, the full model (the combined measurement and path model) initially tested appeared earlier in the article, along with all of its indicators. Thus interpreting Csizér and Kormos's model in its entirety is easy, and the full model is clear. Pulido and Hambrick also presented the measurement portion separate from the path model, as done in Guo and Roehrig (Reference Guo and Roehrig2011). But in Hiromori (Reference Hiromori2009) and in Csizér and Kontra (Reference Csizér and Kontra2012) the full model was never presented, nor did they present the measurement portions of their models graphically. In Hiromori (Reference Hiromori2009), the latent traits should have been transformed into indicator or manifest variables (represented by rectangles, not ovals) because each trait was directly measured (observed) by a single score. Hiromi's model is a path analysis, not a full latent trait (structural) model analysis. (See Proctor et al., Reference Proctor, August, Snow and Barr2010, as an example of a path analysis, the sole one in the set of 39 reviewed for this chapter.) This is a small quibble, but underscores that model representation and following modeling conventions are important. Readers should be able to clearly understand the intricacies of the analysis that was conducted by viewing the models. Likewise, if only the structural portion of the model is illustrated, the authors should report, as Csizér and Kormos (Reference Csizér and Kormos2008) did, from whence the data for the latent traits came. It might be possible to provide the full model, even if it is complicated and large, in a supplemental file. (Some are already adding large SEM files as journal supplements: e.g., Henry & Cliffordson, Reference Henry and Cliffordson2013, included a large SEM correlation table as a supplement.) Readers could download the full models (with all indicator variables, latent traits, and parameter estimates) from the publisher's website.
Reliability
The third problematic area relates to reliability. The authors of the 39 studies almost always reported the reliabilities of their research instruments, but not always. As I mentioned in the first part of this article, SEM takes measurement error into account when a model is tested (Kline, Reference Kline and Hoyle2012; Schumacker & Lomax, Reference Schumacker and Lomax2010), so high reliability is essential for model testing with SEM. As reported by Kline (Reference Kline and Hoyle2012, p. 69), “if international consistency [an instrument's Cronbach's alpha] is low, then the content of the items may be so heterogeneous that the total score is not the best possible unit of analysis for the measure.” Kline further noted that if reliability is less than 0.50, “most of the observed score variance is due to random error, an unacceptable amount of imprecision in most research” (p. 70). Thus, seeing some instruments with reliability estimates as low as 0.42 (Andringa et al., Reference Andringa, Olsthoorn, van Beuningen, Schoonen and Hulstijn2012) and 0.18 (Pulido & Hambrick, Reference Pulido and Hambrick2008) was disheartening. If an instrument's reliability is lower than 0.50, the score (and the variable it represents) should not be included for testing in the model.
Another issue with the reporting of reliability surfaced when I tried to note the reliabilities of all instruments in the 39 studies. While a few researchers did not report reliability (Csizér & Kontra, Reference Csizér and Kontra2012; Dale et al., Reference Dale, Harlaar and Plomin2012; Li, Reference Li2013), others reported reliability for some instruments, but not others (e.g., Andringa et al., Reference Andringa, Olsthoorn, van Beuningen, Schoonen and Hulstijn2012; Cochran et al., Reference Cochran, McCallum and Mee Bell2010; Kieffer & Lesaux, Reference Kieffer and Lesaux2012; Perfetti & Lesgold, Reference Perfetti, Lesgold, Just and Carpenter1977; Yaghoub Zadeh et al., Reference Yaghoub Zadeh, Farnia and Geva2012). However, there were often good, solid reasons for the omissions. Many of the researchers administered to their participants standardized, off-the-shelf or online instruments that generated total (composite) scores, but not scores for the individual items on the measures. Alternatively, the researchers received composite scores on measures administered by other institutions or organizations. In these cases, data on reliability for the sample population is not available. Kieffer and Lesaux (Reference Kieffer and Lesaux2012) addressed this issue well by clearly stating the Cronbach's alpha when they could calculate it themselves and by clearly reporting on the test-publisher's reliability estimate when they used a commercial test that had a published reliability estimate. Yaghoub Zedeh et al. (Reference Yaghoub Zadeh, Farnia and Geva2012) also indicated when a reliability estimate was from their sample or provided by the testing company.
Kline (Reference Kline and Hoyle2012) noted that wherever possible, SEM researchers should report the reliability coefficients that are based on the sample at hand because the equation modeling will be based on the sample's measurement error, not some hypothetical reliability estimate. The reality is, however, SLA researchers often borrow measures or obtain test scores from other sources. In such cases, Kline noted that SEM researchers should report the published reliability coefficients and cite from where those estimates came. This, he stated, is “reliability induction” (p. 70), not reliability estimation, and warned that such coefficients may not generalize to the study's population. Thus, authors need to be very clear if the reliability reported is real (based on the sample population) or induced; and if induced, the researchers should go a step further according to Kline (p. 70), and describe whether the induced reliability estimate can be generalized to the sample population (based on whether the there are similarities between the participants in the SEM study and the test takers whose data were used to generate the instrument's published reliability estimate).
Likert-Scale Points
The fourth and final issue relates to the Likert scales used in the studies. Out of 39 studies, at least 29 used Likert-scale questions to obtain indicator-variable scores. It struck me that most of the SEM researchers used Likert scales with 5 points. A handful used up to 6 points (Papi, Reference Papi2010; Phakiti, Reference Phakiti2008a, Reference Phakiti2008b; Rivers, Reference Rivers2010; Robinson, Rivers, & Brecht, Reference Robinson, Rivers and Brecht2006; Vandewaetere et al., Reference Vandewaetere, Desmet and Leuven2010; Xie & Andrews, Reference Xie and Andrews2013). A few used up to 7 (Gallagher, Reference Gallagher2013; Hiromori, Reference Hiromori2009; W.-T. Tseng & Schmitt, Reference Tseng and Schmitt2008). A couple used up to 8 (Dale et al., Reference Dale, Harlaar and Plomin2012; Ghonsooly et al., Reference Ghonsooly, Khajavy and Asadpour2012), while one used up to 11 (Peng & Woodrow, Reference Peng and Woodrow2010). Many SLA researchers may have used 5- or 6-point scales because they employed long-standing measures or questionnaires that are available publicly. These measures may have been created long ago (e.g., the SILL was created more than 20 years ago) with 5-point, Likert-scale questions; that is, before the optional number of points on Likert scales was investigated (and I will review this research shortly). Or it could be that SLA researchers are using 6-point Likert scales to match recommendations by Dörnyei and Taguchi (Reference Dörnyei and Taguchi2009), who wrote about designing questionnaires for SLA research. In their appendix, all scales have 6 points.
Educational measurement researchers have published extensive research on Likert scales (Betts & Hartley, Reference Betts and Hartley2012; Cook, Heath, Thompson, & Thompson, Reference Cook, Heath, Thompson and Thompson2001; Gorsuch, Reference Gorsuch1997; Hartley & Betts, Reference Hartley and Betts2010; Neuman, Reference Neuman2010). The recommendation from that literature is to have 7 to 9 points, or even 10 to 11 (c.f., Jones & Loe, Reference Jones and Loe2013). Neuman (Reference Neuman2010) reported on research that has shown that as the number of scale steps is increased from 2 up through 20, the increase in reliability is very rapid at first. It tends to level off at about 7, and after 11 steps, there is little gain in reliability from increasing the number of steps. Gorsuch (Reference Gorsuch1997) meticulously reviewed assumptions related to factor analysis. He explained that with multiple points, Likert-scale-item means can vary with a greater likelihood of a less skewed distribution. SEM is based on reliable variation in indicator scores (the cause and effect foundation of SEM is based on the notion that the indicators in the model have good, construct-caused or construct-defining variation). The main gist is that SLA researchers who employ Likert-scale surveys or questionnaires have the potential to create more variation and higher reliability in their indicator scores by simply changing their scales from 5–6 points to 7–8 points. However, they should also note that the order of the scale (with positive orientations on the left or right) affects how people respond to the items (Hartley & Betts, Reference Hartley and Betts2010), especially when the respondents are children (Betts & Hartley, Reference Betts and Hartley2012). Thus, researchers should consider the number of scale points and the orientation (direction) of the scale carefully. Likewise, they should report the number of points and the direction of the scale in their articles.
CONCLUSION
The purpose of this article was to introduce the general concept of SEM and report on how researchers in applied linguistics are using it. Over the last five years, I found 39 SLA studies with SEM being at least one of its analyses. The researchers of the majority of these articles (11 out of 39 articles) investigated how various knowledge structures (such as metacognitive knowledge or phonological awareness) impact language development. Similar to those 11 studies were 3 on L2-learning aptitude. The researchers of seven articles were experts in L2 testing, and they mostly investigated the underlying constructs of L2 tests and strategies that impacted L2-test outcomes. ID researchers also used SEM, with six articles on motivation and five studies on language learners’ WTC in the target language. Attitudes and beliefs, another type of ID, were also investigated through SEM, with three articles on international posture (people's dispositions toward learning a language in relation to the language's perceived status and importance) and one article on attitudes toward CALL. One final SEM study stood out among the rest, in particular because it was the only one that explored acculturation, that is, how factors such as length of stay, linguistic competence, and in-country, target-language use affect success in the host country. Applied linguists working within study abroad environments have much to gain from reading this study; future SEM work could test theories about optimal study abroad experiences. Overall, the collective 39 studies showcase SEM well and are excellent road maps for SLA researchers, showing them how they could apply SEM to their own data.
By reviewing research in SLA that has employed SEM, I have shown that SEM is a powerful resource for exploring the field's theories and hypotheses. SEM is, indeed, “increasingly popular” in SLA research (Schumacker & Lomax, Reference Schumacker and Lomax2010, p. 195), but at the same time, it is disappointingly “sporadically” used (Bollen & Hoyle, Reference Bollen, Hoyle and Hoyle2012, p. 668). The main goal now for those interested in fully exploiting SEM as a data analysis tool may be getting a larger number of SLA and language-testing researchers to be knowledgeable about SEM. This is important because researchers who use SEM want (and need) those who are not experts in SEM to be able to read, understand, and intuit information from their published studies. However, increasing applied linguists’ general knowledge of SEM may be an unrealistic goal because very few statistics or testing courses that center on research in applied linguistics broach the topic of SEM (Ho et al., Reference Ho, Stark, Chernyshenko and Hoyle2012). When compared to all empirical publications in SLA, relatively few include SEM (Plonsky, Reference Plonsky2013). Thus to learn more about SEM at this point in time, graduate students and researchers may need to attend or audit courses on SEM that are offered by SLA's cousin fields (statistics, educational measurement, or psychological measurement) or attend SEM workshops offered before conferences or at statistical institutes. Anyway one looks at it, the future is bright for SEM, and the time to start learning about it is now.