

Introduction
Maritime Antarctica is characterized by higher temperatures and considerably higher atmospheric precipitation compared with Continental Antarctica. The consequence of less extreme climatic conditions is the presence of terrestrial areas with a large number of streams and lakes fed by meltwater from glaciers, permafrost and atmospheric precipitation (Toro et al. Reference Toro, Camacho, Rochera, Rico, Bañon, Fernandez-Valiente, Marco, Justel, Avendano, Ariosa, Vincent and Quesada2007). The west coast of Admiralty Bay (King George Island, South Shetland Islands), has a number of streams and shallow ponds that are free from ice in summer. However, these water bodies have not been studied as comprehensively as those on other Maritime Antarctic islands, e.g. James Ross Island (Hawes & Brazier Reference Hawes and Brazier1991) and Livingston Island (Toro et al. Reference Toro, Camacho, Rochera, Rico, Bañon, Fernandez-Valiente, Marco, Justel, Avendano, Ariosa, Vincent and Quesada2007), or on Continental Antarctica, e.g. glacier meltwater streams in Wright and Taylor valleys (Stumpf et al. Reference Stumpf, Madden, Soreghan, Hall, Keiser and Marra2012) or the streams of McMurdo Dry Valleys (Green et al. Reference Green, Angle and Chave1988, Reference Green, Stage, Preston, Wagers, Shacat and Newell2005). Luścińska & Kyc (Reference Luścińska and Kyc1993) and Kawecka & Olech (Reference Kawecka and Olech1993) studied algal diversity in Vanishing Creek and Ornithologists Creek, but did not analyse the chemical composition of the water. Elster & Komarek (Reference Elster and Komarek2003) studied periphyton in selected stretches of Petrified Forest Creek and Ornithologist Creek. Pociecha & Dumont (Reference Pociecha and Dumont2008) and Pociecha (Reference Pociecha2008) analysed life cycles of selected invertebrates in Lake Wujka.
Water bodies constitute important ecosystems, yet knowledge of these ecosystems is not comprehensive. Gaining insight into factors which determine the ionic composition of freshwater ecosystems is important. Modification of hydrological conditions through deglaciation is particularly interesting, as deglaciation in the polar regions may have a global impact.
The aims of the study were to: i) evaluate the ionic composition and nutrient levels of meltwater streams and shallow ponds, ii) evaluate alkaline metal, nitrogen and phosphorus content in the surface layer of soil, iii) demonstrate the correlation between the levels of chemical elements in surface waters and atmospheric precipitation, and the process of washing out of chemical elements from soil.
Study area
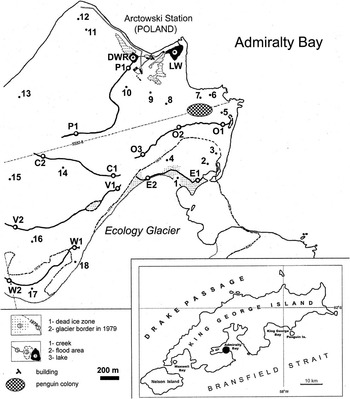
The study was conducted at the Polish Academy of Sciences’ H. Arctowski Polar Station (King George Island, South Shetland Islands) during the 29th Antarctic Expedition, 2004–05. Approximately 90% of the volcanic rock surface of King George Island is covered with ice; Thomas Point Oasis, one of the larger terrestrial areas free from ice, is situated on the west coast of Admiralty Bay (Fig. 1). The oasis is within the Antarctic Specially Managed Area No. 1 and partially within the Antarctic Specially Protected Area No. 128 (formerly known as the Site of Specially Scientific Interest No. 8; Fig. 1). The area is characterized by the presence of streams, wetlands and small, shallow lakes.
Overview of the study area indicating sites where soil samples (1–18) and water samples from shallow ponds and streams were collected (C1 & C2=Czech Creek, DWR=drinking water reservoir, E1 & E2=stream flowing along the border of Ecology Glacier, LW=Lake Wujka, O1–O3=Ornithologists Creek, P1 & P2=Petrified Forest Creek, V1 & V2=Vanishing Creek, W1 & W2=stream flowing across the Wróbel Valley).

The studied region is composed of volcanic and plutonic rocks from early Miocene and Early Cretaceous, which are associated with subduction of the south-east Pacific plate under the Antarctic plate. Rocks dominating in the area include basalts, and to a lesser extent rhyiolite and dacite (Santos et al. Reference Santos, Silva-Filho, Schaefer, Albuquerque-Filho and Campos2005).
The climate of Thomas Point Oasis is mild in comparison to terrestrial areas of Continental Antarctica. The average annual temperature in 1978–87 was -1.8oC, with average temperatures of 2.3oC in summer and -7.1oC in winter (Rakusa-Suszczewski Reference Rakusa-Suszczewski1992). The area is characterized by heavy rainfall and snowfall, with maximum precipitation exceeding 145 mm (Marsz & Rakusa-Suszczewski Reference Marsz and Rakusa-Suszczewski1987). The precipitation is especially high during summer, while winter is considerably drier.
The aquatic habitats are represented by shallow ponds, small (meltwater) streams, and glacial rivulets which run continuously during the summer. The streams and rivulets are <1500 m in length, 10–300 cm in width and 5–70 cm in depth (Elster & Komarek Reference Elster and Komarek2003). No data are available that specify the exact flows. Kozik (Reference Kozik1982) found that the flow of Vanishing Creek oscillated between 25 and 60 l s-1 (mean=50 l s-1). The catchment areas are usually barren, deglaciated landscapes with scattered mosses and lichen stands. In close proximity to the sea, some streams run through penguin colonies, as well as extensive areas covered with moss and scattered vascular plants.
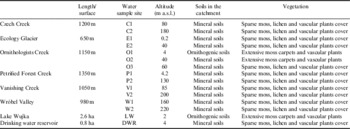
The study investigated six streams: Petrified Forest Creek (P1, P2), Ornithologists Creek (O1, O2, O3), Czech Creek (C1, C2), a stream flowing along the border of Ecology Glacier (E1, E2), Vanishing Creek (V1, V2), a stream flowing across the Wróbel Valley (W1, W2) and Lake Wujka (LW), as well as an artificial drinking water reservoir which belonged to the research station (DWR) (Fig. 1, Table I).
Characteristics of the water bodies on Thomas Point Oasis.

a.s.l.=above sea level.
Methods
Water samples
Between January and March 2005, water samples were collected biweekly from the sources and mouths of streams; additional samples were collected from the middle of Ornithologists Creek. Samples were collected from the centre of LW and DWR at 20 cm depth.
Major ions (Na+, K+, Ca2+, Mg2+, HCO3 -, Cl-, SO4 2-, SiO2 2-, F-), as well as nitrite (N-NO2 -), nitrate (N-NO3 -), ammonium (N-NH4 +) and reactive phosphorus (P-PO4 3-) were analysed using the methodology recommended by APHA (1995). Major ions were analysed with the aid of an ion chromatograph Dionex ICS-3000, enabling conductometric detection. For anion analysis, the analytical column Dionex IonPac AS19 was utilized (eluents: 4.0 mM Na2CO3 and 1.5 mM NaHCO3, flow rate: 1.4 ml min-1). For cation analysis, an analytical column Dionex IonPac CS16 was utilized (eluent: 20 mM HCl, flow rate: 0.8 ml min-1). Calorimetric methods with recommended wavelengths (λ) were utilized for the analysis of: SiO2 2- (silica) with molybdenum blue (λ=690 nm), N-NO2 - with sulfanilamide (λ=543 nm), N-NO3 - (analysed as N-NO2 - after Cu-Cd reduction), N-NH4 + with indophenol blue (λ=630 nm), total reactive phosphorus (TRP) with ammonium molybdate and ascorbic acid as a reducing agent (λ=882 nm). A Carl Zeis Specol 1100 spectrometer was utilized for calorimetric analyses.
Analyses were repeated three times. Certified standard solutions (Merck) were used to assess the accuracy of analytical methods and standard solutions; accuracy ranged from 3–6%.
Total dissolved solids (TDS) and conductivity were measured with a WTW LF197 conductivity meter, and pH was measured with a HANNA HI 9025 pH meter. These parameters were measured in the field while collecting samples.
Soil samples
Soil samples were collected from the surface layer of soil at 18 sites (December 2004 and February 2005) (Fig. 1). Chemical composition (Na, K, Ca, Mg, N and P) was determined according to the methodology recommended by Jones (Reference Jones1999) and Pensu & Gautheyrou (Reference Pensu and Gautheyrou2007). Soil samples were dried, ground and sifted through a 1-mm pore. The N content was determined using an elemental analyser for CHNS-O manufactured by Costech. Soil samples (0.5 g) were cold-treated with a 6-ml mixture of 5:1 concentrated acids: HNO3:HClO4 (65:60%) and 1 ml of perhydrol. After at least 12 hours of digestion, samples were put in a MilestoneTM microwave oven. Mineralized samples were diluted to 25 ml with deionized water. From the extract, Ca and Mg were determined by atomic absorption, K and Na were determined by flame emission with the aid of ASA iCE 3000 atomic absorption spectrometer. The P content was determined by spectrophotometric molybdenum blue (λ=690 nm) with Marcel Media UV-VIS spectrophotometer. The determination process was validated with certified reference material: loamy sand (Loamy Sand 4 CRMO 36-050) and sediments (Metals of sediment CRMO 15-050), results were within two standard deviations of the certified values and recoveries were >91%. The limits of detection (mg kg-1) for elements were: Mg=0.002, Na=0.004, Ca=0.009 and K=0.001. Statistical analysis was applied using Statistica 10.1 software (StatSoft).
Results
Major ions, pH, total dissolved solids and conductivity in water bodies
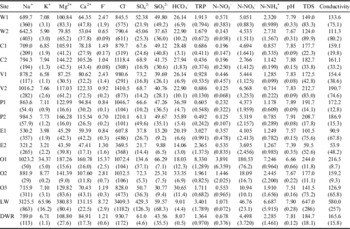
The most abundant anion was Cl-, and Na+ dominated the cations (average concentrations were 1102.2 and 930.9 μM, respectively). Average concentrations of the other major anions ranged between 2.80 μM (F-) and 81.64 μM (SO4 2-) and major cations ranged between 12.46 μM (K+) and 130.76 μM (Mg2+).
Lake Wujka was characterized by the highest average concentrations of Na+, K+, Mg2+, Cl-, SO4 2- and TDS, and the highest conductivity. The average F- concentration was 8.72 μM, c. 50% lower than at the mouth of Ornithologists Creek (O1). In the DWR, concentrations of major ions were much lower, and were similar to the concentrations recorded in the streams (Table II).
Mean (standard deviation) ion concentrations (μM), total dissolved solids (TDS, ppm), conductivity (μS cm-1) and pH in the water samples from Thomas Point Oasis.

DWR=drinking water reservoir, LW=Lake Wujka, TRP=total reactive phosphorus.
The average major ion concentrations in the streams (excluding O1) were Na+=752.3 μM, K+=6.7 μM, Mg2+=107.0 μM, Ca2+=83.3 μM, F-=1.4 μM, Cl-=926.6 μM, SO4 2-=57.2 μM and SiO2 2-=36.2 μM. In samples collected from site O1, concentrations were higher relative to the other sample sites (Table II), especially for F- and K+.
The pH values ranged from slightly acidic to slightly alkaline. The lowest average pH was found in water samples collected from site O1 (6.66), while the highest average pH was found in water samples collected from the site P2 (7.91) (Table II).
The average TDS values were diverse ranging between 59.5 and 647.0 ppm (E2 and LW, respectively) (Table II).
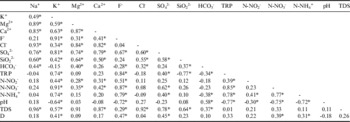
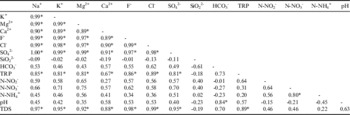
Statistical analysis showed mostly positive, statistically significant correlations between the major ions in the streams and shallow ponds (Tables III & IV).
Linear correlation for relationships between the determined hydrochemical indicators and distance in the streams

D=distance, TDS=total dissolved solids, TRP=total reactive phosphorus.
*Statistically significant correlations at P < 0.05.
Linear correlation for relationships between the determined hydrochemical indicators in the drinking water reservoir and Lake Wujka.

TDS=total dissolved solids, TRP=total reactive phosphorus.
*Statistically significant correlations at P < 0.05.
The statistical analysis revealed an increasing trend in major ions, TDS and conductivity from the sources to the mouths of the streams. The indicators were positively correlated with increasing distance of a water sampling site from the source of each stream (defined as ‘distance’ in Table III). For K+, F- and SO4 2- the correlations were statistically significant (Table III).
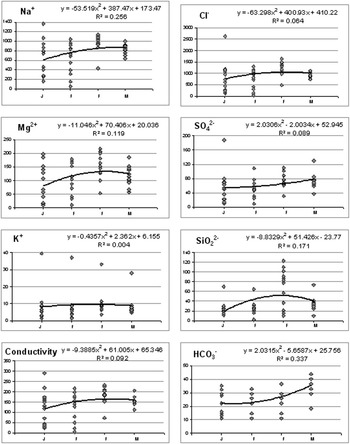
Seasonal variability was observed, most indicators increased from January until the end of February, with a subsequent drop in March 2005. This trend was not observed for SO4 2- and HCO3 - (Fig. 2).
Seasonal variability of selected ions (μM) and conductivity (μS cm-1). J=January, F=February, M=March.

Biogenic elements
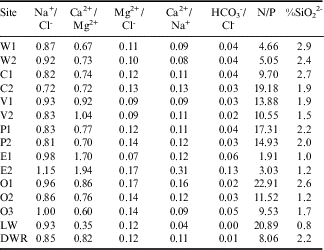
Concentrations of N-NO2 -, N-NO3 -, N-NH4 + and TRP in the water samples fluctuated within a wide range, from values characteristic for oligotrophy to hypertrophy (Table II). The values of Redfield Ratio for N/P also had a wide range from 1.91 (E1) to 22.91 (O1) (Table V).
Ratios determined for selected indicators of the water samples.

DWR=drinking water reservoir, LW=Lake Wujka.
The highest abundance of N and P were found in the waters of Ornithologists Creek (particularly O1 and O2) and LW. In the stream running along the edge of Ecology Glacier, very low N concentrations were recorded, while P concentrations were high. Heightened P concentrations were also observed in the stream running through the Wróbel Valley and in the DWR. Average concentrations of TRP, N-NO2 -, N-NO3 - and N-NH4 + in the water samples (excluding O1 and LW) amounted to 1.374, 0.410, 6.299 and 1.490 μM, respectively.
The analysis of horizontal variability revealed higher average TRP concentrations in water samples collected at the mouth relative to samples collected at the source for all of the streams (Table II). The same trend was observed for nitrogen: N-NO2 - in Vanishing Creek, the stream crossing Wróbel Valley, Petrified Forest Creek and Ornithologists Creek, N-NO3 - in the stream crossing Wróbel Valley, the stream running along Ecology Glacier, Czech Creek and Ornithologists Creek, N-NH4 + in Vanishing Creek, Petrified Forest Creek and Ornithologists Creek (Table II). The highest increase in average concentration of N was observed in Ornithologists Creek; the average concentration of N-NO2 - in the waters near the source was 10.94 μM and increased to 180.53 μM at the mouth.
Nitrogen, phosphorus and metals in the soils
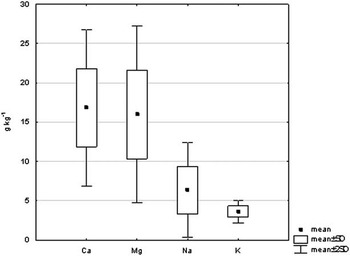
Concentrations of metals in the surface layer of soil at Thomas Point Oasis were highest for Ca and Mg, and lowest for Na and K (average values: 16.8, 15.9, 6.3 and 3.6 g kg-1, respectively) (Fig. 3).
Metals in the soil of Thomas Point Oasis.

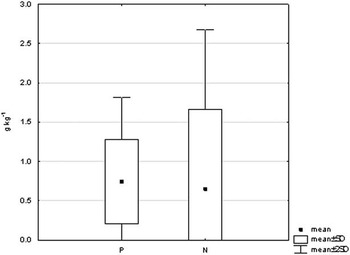
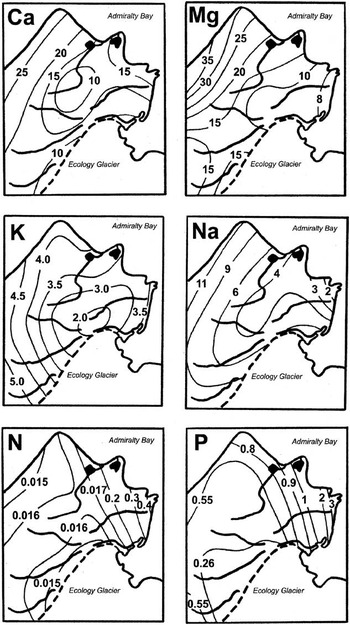
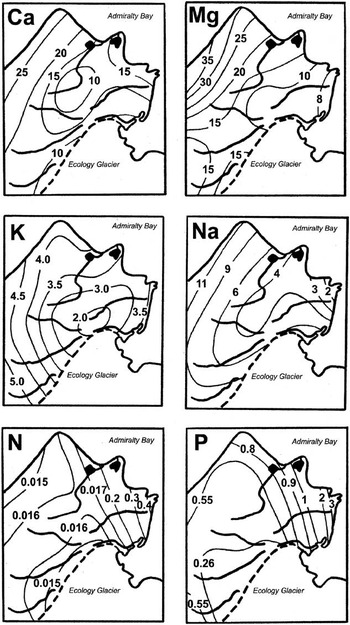
For biogenic elements, the average concentrations of N and P were similar (0.646 and 0.744 g kg-1, respectively) (Fig. 4). The spatial variability of metal concentrations, as well as N and P, is shown in Fig. 5. With increasing height and distance from the eastern coast of the region, the abundance of metals in the soil increased. A reverse trend was observed for N and P with respect to horizontal variability; the highest concentrations were measured in the eastern part of the study area.
Phosphorus and nitrogen content in the soil of Thomas Point Oasis.

Horizontal variability of Ca, Mg, K, Na, P (g kg-1) and N (%) concentrations in the surface layer of soil in Thomas Point Oasis.
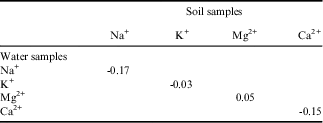
Statistical analysis revealed insignificant correlations between metal concentrations in soil and metal concentrations in surface waters. These correlations were usually inversely proportional (Table VI). Similar correlations were discovered between N and P concentrations in soil and surface water samples. The following coefficients were calculated for the correlation between N in soil and N-NO2 -, N-NO3 - and N-NH4 + in water: r=-0.09, r=0.06 and r=-0.13, respectively. The correlation coefficient for P was r=-0.35.
Correlations between the indicators determined for water samples from streams and for soil samples.

Discussion
The data presented here are similar to those observed in freshwater bodies elsewhere in the Maritime Antarctic. For example, Potter Peninsula on King George Island (Vinocur & Unrein Reference Vinocur and Unrein2000), Livingston Island (Toro et al. Reference Toro, Camacho, Rochera, Rico, Bañon, Fernandez-Valiente, Marco, Justel, Avendano, Ariosa, Vincent and Quesada2007) and Signy Island (Caulkett & Ellis-Evans Reference Caulkett and Ellis-Evans1997). However, the results from the Maritime Antarctic differ from those obtained from surface waters of Continental Antarctica. In the streams of the McMurdo Dry Valleys, the concentrations of Na+, Mg2+, Cl- and SO4 2- were lower and the concentrations of K+, Ca2+ and HCO3 - were higher than those in the current study. The concentration of SiO2 2- found in surface waters of the two regions of Antarctica was similar (Green et al. Reference Green, Angle and Chave1988, Reference Green, Stage, Preston, Wagers, Shacat and Newell2005, Stumpf et al. Reference Stumpf, Madden, Soreghan, Hall, Keiser and Marra2012).
Horizontal variability of major ions in the water samples was characterized by increasing concentration with distance from the source, a trend similar to that observed in other Antarctic streams (Green et al. Reference Green, Angle and Chave1988, Reference Green, Stage, Preston, Wagers, Shacat and Newell2005). There was also a trend of seasonal variability for most major ions similar to the seasonal variability of conductivity reported by Toro et al. (Reference Toro, Camacho, Rochera, Rico, Bañon, Fernandez-Valiente, Marco, Justel, Avendano, Ariosa, Vincent and Quesada2007). The study showed that conductivity in streams increased progressively from the snow melt onset until the end of the summer, caused by flow reduction and interactions with rocks and mineral matter.
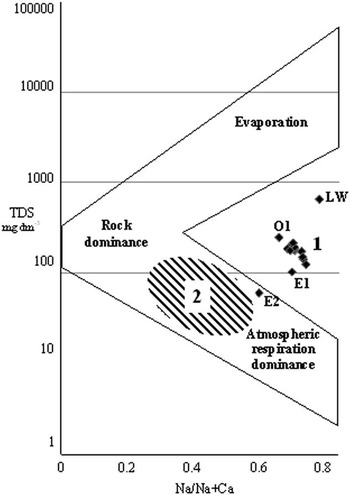
By comparing Dry Valleys streams with other surface waters around the world on a Gibbs plot, Green et al. (Reference Green, Angle and Chave1988) showed that the streams belonged to a group of surface waters influenced by atmospheric precipitation (marine aerosols) and by rock (or rock-derived salt) weathering, and not by evaporation and crystallization. The water bodies in the study reported here were situated in the area on the Gibbs plot that encompasses surface waters that were specified as ‘small East African and Australian basins’ (Fig. 6).
A Gibbs plot comparing the formation of water bodies at Thomas Point Oasis (1) and in the McMurdo Dry Valleys (2; after Green et al. Reference Green, Angle and Chave1988). Solid line is envelope of world surface water. Na and Na+Ca concentrations are mg dm-3.

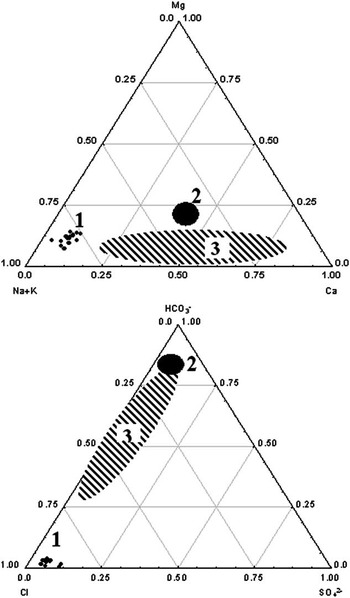
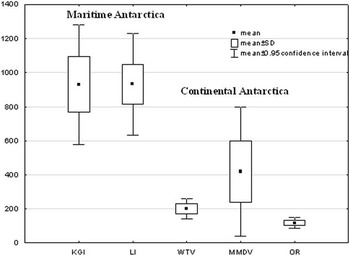
A considerable difference between the average ionic composition of surface waters from Thomas Point Oasis, and the surface waters from around the world (after Livingstone Reference Livingstone1963) and from Continental Antarctica (after Green et al. Reference Green, Angle and Chave1988) is illustrated by a triangle plot in Fig. 7. The triangle plot shows mole fractions of cations and anions of the surface waters. The cations fall exclusively along the Na+K–Mg side while the anions fall exclusively along the Cl–HCO3 side. In the Dry Valleys, Na+ or Ca2+ was the dominant cation, and HCO3 - or Cl- was the dominant anion (Green et al. Reference Green, Angle and Chave1988). In Thomas Point Oasis, Na+ and Cl- dominated. Statistical analysis confirmed this diversity, as illustrated in Fig. 8, which shows a comparison of Na+ concentrations in water samples from various regions of Antarctica. When comparing our data with studies conducted by Caulkett & Ellis-Evans (Reference Caulkett and Ellis-Evans1997) and Toro et al. (Reference Toro, Camacho, Rochera, Rico, Bañon, Fernandez-Valiente, Marco, Justel, Avendano, Ariosa, Vincent and Quesada2007) it can be concluded that such ionic composition is typical for small streams situated in Maritime Antarctic, that are influenced by a damp polar climate characterized by high atmospheric precipitation in the form of snow and rain. The streams are fed mainly by atmospheric precipitation and meltwater from glaciers and permafrost. Ionic composition of atmospheric precipitation in Maritime Antarctic is determined by marine aerosols. During winter, as ice covers c. 19 million km2 of the ocean surrounding Antarctica, atmospheric precipitation is characterized by low concentrations of major ions. However, concentrations of major ions in atmospheric precipitation increase during summer (Bertler et al. Reference Bertler, Mayewski and Aristarain2005). Therefore, it can be assumed that the main source of major ions found in the streams of Maritime Antarctic is atmospheric precipitation. Precipitation in the Dry Valleys is below 100 mm yr-1 (Stumpf et al. Reference Stumpf, Madden, Soreghan, Hall, Keiser and Marra2012). In contrast, atmospheric precipitation in the area of Livingston Island amounts to 700–1000 mm year-1 (Toro et al. Reference Toro, Camacho, Rochera, Rico, Bañon, Fernandez-Valiente, Marco, Justel, Avendano, Ariosa, Vincent and Quesada2007), and in the area of King George Island it ranges between c. 500 mm year-1 (Admiralty Bay) (Marsz & Styczyńska Reference Marsz and Styszyńska2000) and c. 700 mm year-1 (Maxwell Bay) (Mishra et al. Reference Mishra, Kim, Hong and Lee2004). The precipitation is particularly intense during summer. Therefore, different processes are shaping the ionic composition of surface waters in the two regions of Antarctica.
Triangle plots (mole percent) giving the composition of surface waters in Thomas Point Oasis (1), average world rivers (2) and the McMurdo Dry Valleys (3; after Green et al. Reference Green, Angle and Chave1988).

A comparison of Na+ (μM) concentrations in water bodies of Maritime and Continental Antarctica. KGI=King George Island (this study), LI=Livingston Island (Toro et al. Reference Toro, Camacho, Rochera, Rico, Bañon, Fernandez-Valiente, Marco, Justel, Avendano, Ariosa, Vincent and Quesada2007), MMDV=McMurdo Dry Valleys (Green et al. Reference Green, Angle and Chave1988), OR=Onyx River (Green et al. Reference Green, Stage, Preston, Wagers, Shacat and Newell2005), WTV=Wright and Taylor valleys (Stumpf et al. Reference Stumpf, Madden, Soreghan, Hall, Keiser and Marra2012).

After Green et al. (Reference Green, Angle and Chave1988), it can be assumed that Na concentration is an indicator showing to what extent the salts are of marine origin. At the same time Ca can be treated as an indicator of chemical weathering of an assortment of materials, including ferromagnesian minerals and calcite crusts derived from marble or carbonate-containing soils. For example, the Na+/Cl- ratio exceeding 1.7 in surface waters of the Dry Valleys indicates that the salts originate from weathering of mirabilite or feldspars (Green et al. Reference Green, Angle and Chave1988). In the streams on Thomas Point Oasis, the Na+/Cl- ratio did not exceed 1.15 and usually stayed within the range of 0.8–0.9 (Table V). However, the Ca2+/Mg2+ ratio was lower (0.89) than in the Dry Valleys (2.6–20.7) (Green et al. Reference Green, Angle and Chave1988). Moreover, the Mg2+/Cl- ratio was three times lower at Thomas Point Oasis in comparison to the Dry Valleys. A comparatively high Mg concentration and lower Mg2+/Cl- ratio indicates that Mg, similar to Na and Ca, mainly originated from atmospheric precipitation.
Low Ca2+/Na+ (0.11–0.31) and HCO3 -/Cl- (0.00–0.13) ratios recorded in our study showed that the water bodies contained low concentrations of Ca in comparison to Na and very high Cl- concentrations in comparison to bicarbonates (Table V). Therefore, in Maritime Antarctic, and to some extent analogically in Continental Antarctica, evaporation and accumulation of the salt from atmospheric precipitation in the soil are occurring, and the salt is subsequently washed out. The process of Ca, Mg, Na and K accumulation resulting from water evaporation is probably more intense in our study area which is situated higher above sea level. This is confirmed by our finding that the concentration of these metals in the surface layer of soil increase with height (Fig. 5). Tatur & Myrcha (Reference Tatur and Myrcha1984) found that factors conducive to precipitation of minerals from the soils included frequent concentration of mineral salts caused by the freezing of saturated solutions during cold nights of Antarctic summer, as well as strong winds intensifying evaporation. These features distinguish the soil-forming processes in Maritime Antarctic from the soil-forming processes taking place in Continental Antarctica.
Direct weathering of dolorites and other silicate rocks was found to be a less important source of ions in the surface waters than atmospheric precipitation, confirmed by the percentage share of silica (Table V). On average, silica constituted 1.9% of the total mole charge. The average value of silica for rivers worldwide was c. 9% (Livingstone Reference Livingstone1963) and in the Dry Valleys it was c. 3% (Green et al. Reference Green, Angle and Chave1988).
The lower importance of the supply of ions from the soil is also confirmed by the absence of statistically significant correlations for interdependencies between metal contents determined in the surface layer of soil and in water bodies (Table VI).
Biogenic elements
The concentration of the N and P forms allow differentiation of two groups of water bodies, characterized by either high or low trophic status. Elster & Komarek (Reference Elster and Komarek2003) classified Petrified Forest Creek as highly oligotrophic. The same trophic status can be given to DWR and the remaining studied creeks, except for Ornithologists Creek. Lake Wujka is also rich in biogenic elements.
The trophic differences observed in the water bodies result from the influence of breeding colonies of penguins. The colonies are situated in the central coastal part of the study area. In the locations of the colonies and the surrounding areas, beneath a layer of softened penguin guano, phosphate soils, also known as ornithogenic soils, are formed (Tatur & Myrcha Reference Tatur and Myrcha1984, Tatur Reference Tatur1989). These soils constitute a rich source of N, P and F, and are directly responsible for high concentrations of those elements in Ornithologists Creek and LW. However, P is more permanently bound in the crystalline structure of ornithogenic soils and is, therefore, released more slowly than N (Tatur & Myrcha Reference Tatur and Myrcha1988). This process is probably responsible for the higher N (especially N-NO3 -) concentrations in comparison to P concentrations in Ornithologists Creek and LW.
Waters infiltrating ornithogenic soils have an acidic pH (Juchnowicz-Bierbasz Reference Juchnowicz-Bierbasz1999, Juchnowicz-Bierbasz & Rakusa-Suszczewski Reference Juchnowicz-Bierbasz and Rakusa-Suszczewski2002); as these waters were flowing into the mouth of Ornithologists Creek (O1), the pH was acidic. Similar pH values for that stretch of Ornithologists Creek were also observed by Elster & Komarek (Reference Elster and Komarek2003).
The catchment areas of the other streams are situated beyond the direct influence of penguin colonies. The few breeding pairs of other birds, such as brown skua (Stercorarius antarcticus Brooke), Wilson’s storm petrel (Oceanites oceanicus Kühl) or Antarctic tern (Sterna vittata Gmelin) do not provide a significant source of N or P. The inversely proportional correlation between N and P in soils and phosphates, nitrites and ammonium in stream waters indicate that the soils are the source supplying those elements to surface waters. In these soils, N and P may originate from rock weathering, atmospheric precipitation or aeolian dust. The soils are weathered soils derived mainly from volcanic rock (andesite basalts and pyroclastics); however, sedimentary rocks may also be important in several sites (Bolter Reference Bolter2011). Releasing biogenic components from such soils is hindered (Simas et al. Reference Simas, Schaefer, Melo, Guerra, Saunders and Gilkes2006). However, Chacon et al. (Reference Chacon, Ascanio, Herrera, Benzo, Flores, Silva and Garcia2013) showed that the less extreme microclimatic conditions and the presence of liquid water in the ice-free area promote the biogeochemical cycling of soil P. Soils of the area contain secondary minerals, such as haematite and the intergrade chlorite-vermiculite-montmorillonite. Similarly, N in these soils usually has the form of a salt (Bolter Reference Bolter2011). As demonstrated by Green et al. (Reference Green, Stage, Preston, Wagers, Shacat and Newell2005), a comparatively low NO3 -/Cl- ratio (0.003–0.018) indicates that atmospheric precipitation may be the source of N.
The observed variability of N/P ratio was comparable to surface waters of other regions of Maritime Antarctic (e.g. Hawes & Brazier Reference Hawes and Brazier1991, Vinocur & Unrein Reference Vinocur and Unrein2000, Toro et al. Reference Toro, Camacho, Rochera, Rico, Bañon, Fernandez-Valiente, Marco, Justel, Avendano, Ariosa, Vincent and Quesada2007) and pointed to various limitations of primary production in the respective water bodies. Nitrogen limitation occurred at W1, W2, C1, E1, E2, O3 and DWR. At P1, O1 and LW, P limitation occurred. At the remaining research sites primary production could be limited simultaneously by N and P.
Summary
Water bodies of the west coast of Admiralty Bay were characterized by high Na+, Mg2+ and Cl- concentrations, and when represented on a Gibbs plot they were comparable to surface waters classified as ‘small East African and Australian basins’. Ratios of Na+/Cl- and Ca2+/Mg2+ indicated that atmospheric precipitation was the main source of major ions in surface waters. Conversely, Ca2+/Na+ and HCO3 -/Cl- ratios indicated the influence of evaporation and accumulation of salt from atmospheric precipitation in soils. A low level of silica in the total molar charge of the ions indicated that direct weathering of silicate rocks was not an important source of ions. The majority of the water bodies are classified as highly oligotrophic; only Ornithologists Creek and LW are rich in biogenic elements.
Acknowledgements
We would like to thank the Department of Antarctic Biology, Polish Academy of Science, for providing the funding and facilities for this work, and especially the staff of Arctowski Station during the 2004–05 season for their assistance and companionship. We would also like to thank the reviewers whose comments significantly improved the quality of this paper.
Author contribution
Arkadiusz Nędzarek: experimental design, data collection, execution, data analysis, writing and intellectual contribution. Agnieszka Tórza: data analysis, writing and intellectual contribution. Joanna Podlasińska: data analysis.