


Introduction
Roman amphorae are key resources for the study of long-distance trade and distribution processes. These containers mostly carried liquid foodstuffs such as wine, olive oil and fish products (e.g. garum, a fermented fish sauce) and were meant as packaging for overseas transport. Quantitative approaches to their analysis allow us to identify and describe temporal changes in the diverse places to which these foodstuffs were transported. This article builds on this line of research by presenting the largest quantified dataset of Roman amphorae compiled to date, integrating information from 216 sites and 254 excavations across the Western Mediterranean. We focus on 20 of the most common amphora types, primarily those used for transporting olive oil, garum and wine. By analysing these widely distributed containers, we aim to identify general economic trends and discern variation and shifts in provincial supply and consumption across regions such as Hispania, Gaul and Britannia. Trends and patterns identified in this study are explored in reference to studies using a comparable method in the provinces of Germania (Franconi et al. Reference Franconi2023) and Italia (Komar et al. Reference Komar2025). Our interpretations focus on reactions to the appearance of new markets with the expansion of the Roman Empire, the role of state supply mechanisms, such as the annona, the potential move away from amphorae and towards barrels or skins as typical containers, and the increasing regionalisation of trade in Late Antiquity (third–seventh centuries CE).
Materials and methods
Data collection
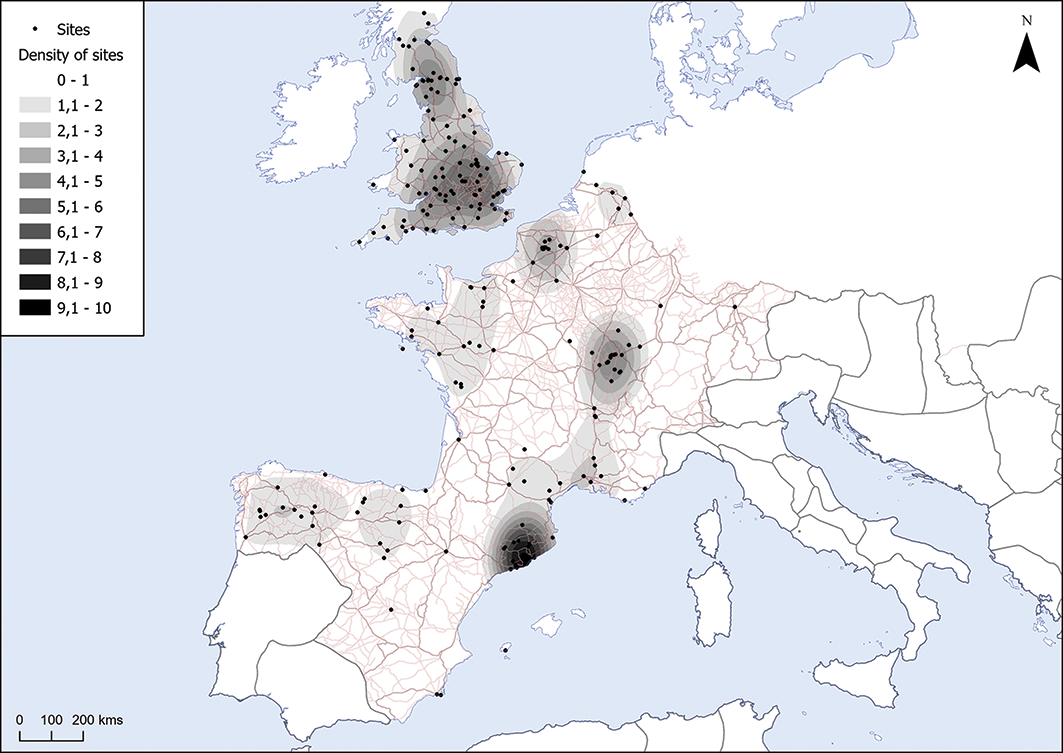
The dataset is an aggregation of the density of 20 ceramic amphora types deriving from 254 excavations, representing 216 sites, and it is accessible as part of the GitHub repository of this article (Blumenkranz et al. Reference Blumenkranz2024). Excavations were conducted from the early 1990s to the present day and cover the Roman provinces of Hispania Citerior, the three Galliae, the two Germaniae, Britannia and Raetia (see Figure 1). Roman Britain formed the initial focus of data collection (by C. Carreras & D.F. Williams); amphorae were classified and quantified according to typology and fabrics, and densities calculated in reference to the extent of excavation areas (Carreras Reference Carreras2000). Data for other provinces are compiled from published studies (Laubenheimer & Marlière Reference Laubenheimer and Marlière2010; Laubenheimer Reference Laubenheimer2022; and the work of the Société Française d’Étude de la Céramique Antique en Gaule, see online supplementary material (OSM) section 3). The resulting site density map (Figure 1) reveals areas with high concentrations of quantified sites, but also empty regions (e.g. Valencia or Central Gaul) that require further amphora studies.
Distribution and kernel density plot of the 216 sites included in this study (plot does not reflect density of amphorae finds) (figure by Pau De Soto).

Ceramic amphora frequency
The ‘frequency’ column of the dataset represents an amphora density that is derived by comparing the excavated and published amphora frequency with the area excavated. Data collection followed the criteria of the Seville protocol, quantifying the amphorae by sherd count and weight. We also included the EVE (estimated vessel equivalent, based on rims), number of spikes/bases and handles. The values were subsequently standardised to enable comparison between sites. Site-based densities were obtained by dividing amphora frequency values (weights, sherd counts) by the excavation area from which an assemblage was excavated (e.g. Xanten or Kops Plateau). For further details see OSM section 3.
Amphora types
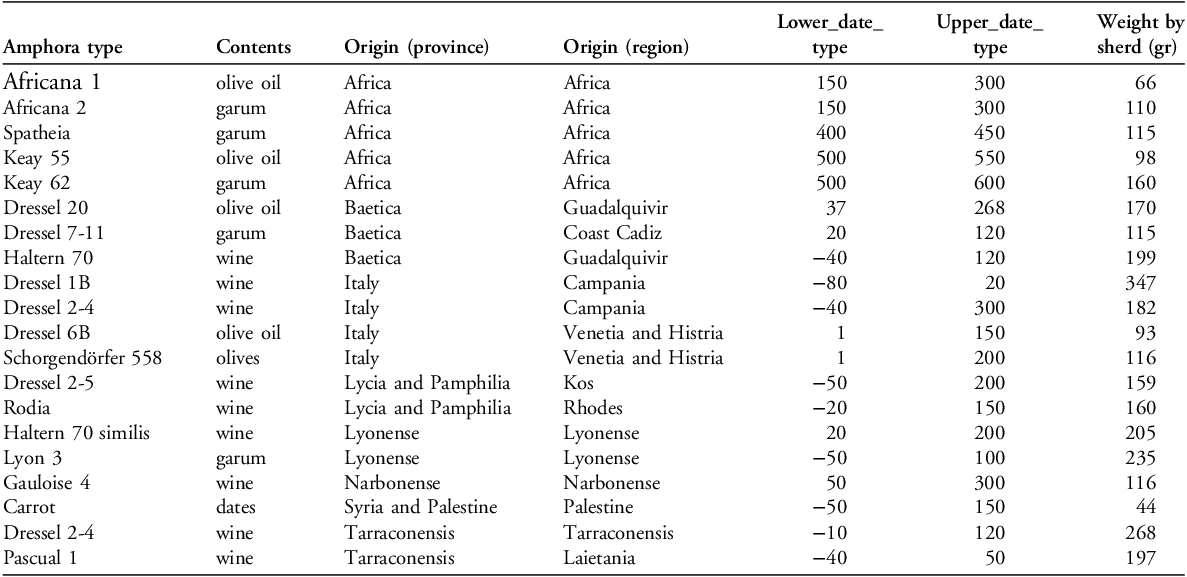
The entire dataset includes more than 150 amphora types. Twenty of the most common types, for which the principal contents and origin are well known, were selected for analysis (Table 1). These common and well-identified types best enable the identification of quantitative trends in the distribution and consumption of olive oil, garum and wine across the Western Roman Empire. In itself, the identification of these common types had already revealed some trends: a higher diversity of types from the second part of the first century BCE to the second century CE, and a limited diversity of late antique and eastern types. The chronological development of these trends is discussed below.
Basic data for amphora typologies.

Table 1 Long description
A table with 15 rows and 7 columns. The columns are labeled Amphora type, Contents, Origin (province), Origin (region), Lower_date_type, Upper_date_type, and Weight by sherd (gr). The table lists various amphora types, their contents such as olive oil, garum, wine, and dates, their origins by province and region, and the weight by sherd in grams. Each row provides specific details for an amphora type, including the range of dates for the type’s use. Notable amphora types include Africana 1, Africana 2, Spatheia, Keay 55, Keay 62, Dressel 20, Dressel 7-11, Haltern 70, Dressel 1B, Dressel 2-4, Dressel 6B, Schorgendorfer 558, Dressel 2-5, Rodia, Haltern 70 similis, Lyon 3, Gauloise 4, Carrot, Dressel 2-4, and Pascual 1. The origins span regions like Africa, Baetica, Italy, Lyonense, Narbonense, Syria and Palestine, and Tarraconensis.
Data analysis
The data analysis was conducted with Python v.3.9.5, making use of the following packages: pandas (McKinney Reference McKinney2010; The pandas development team 2024), seaborn (Waskom Reference Waskom2021) and Matplotlib (Hunter Reference Hunter2007). All code relating to the analysis is available in the GitHub repository for this article (Blumenkranz et al. Reference Blumenkranz2024). The code is organised in a range of Jupyter Notebooks, where each notebook reproduces the plot that visualises a specific query; for example, consumption by amphora contents. The results for all queries performed are available in the OSM section 2 and in the repository.
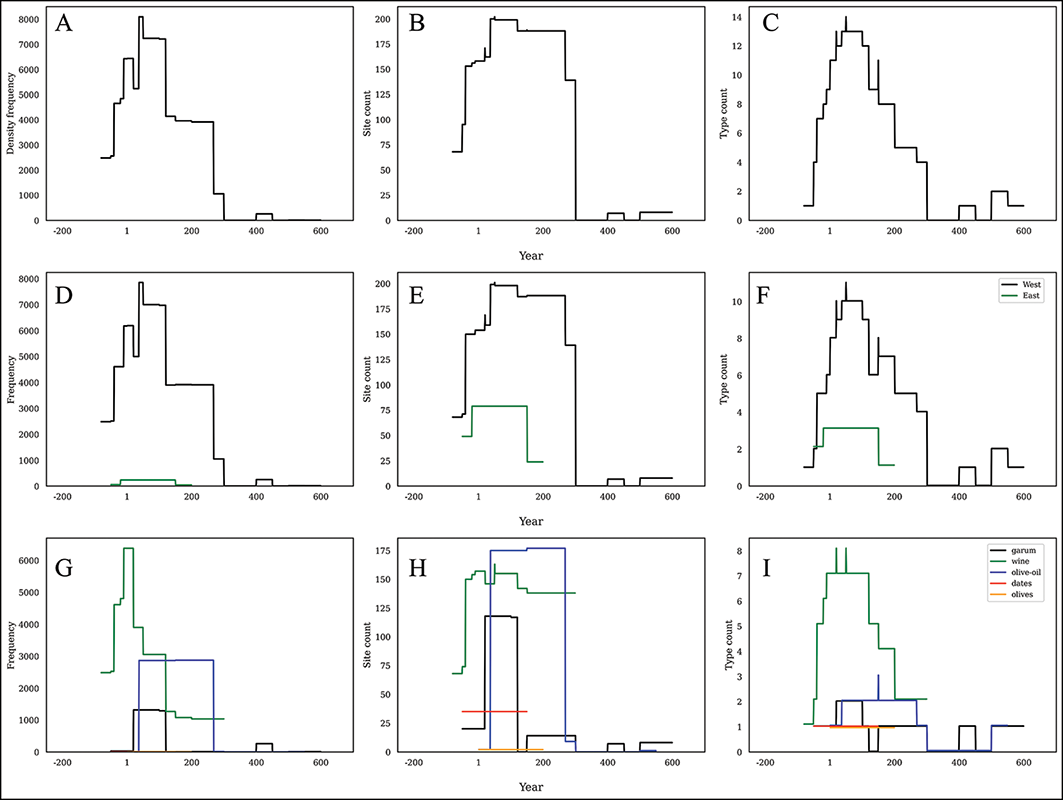
Temporal patterns were derived using the probabilistic aoristic method, assuming a uniform probability for each ceramic item to be deposited at a site in each year of its typo-chronological date range and summing up probability values per year (Crema Reference Crema2010). We use the same code implementation of the aoristic method as Franconi and colleagues (Reference Franconi2023) for the study of temporal patterns in Roman amphorae in the Germanic provinces and as Komar and colleagues (Reference Komar2025) to study temporal patterning in Roman amphorae in central Italy. Like in these studies, the method is applied to reveal patterning in: the ceramic density frequency (cg/m2), measured as a count of a certain amphora type at a certain excavation site divided by the type’s production year span, summed across all amphora types in production in a given year; site count, where a site is considered to be a site of consumption in a given year if it contains amphorae that were in production that year; and amphora type count, which is the count of all amphorae in production in a given year.
The temporal evolution of these three measures was calculated for different partitions of the dataset in 35 queries. Results are presented as line graphs in OSM section 2 where the left panel shows temporal change in the density frequencies, the middle panel shows temporal change in the number of sites at which ceramics are attested, and the right panel shows temporal change in the diversity of amphora types. The latter provides an important reference to explore how the baseline pattern of the dates and diversity of the types selected for this study, and specifically those included in each query-based subset of the data, shapes the frequency and site count patterns.
Results and discussion
General trends
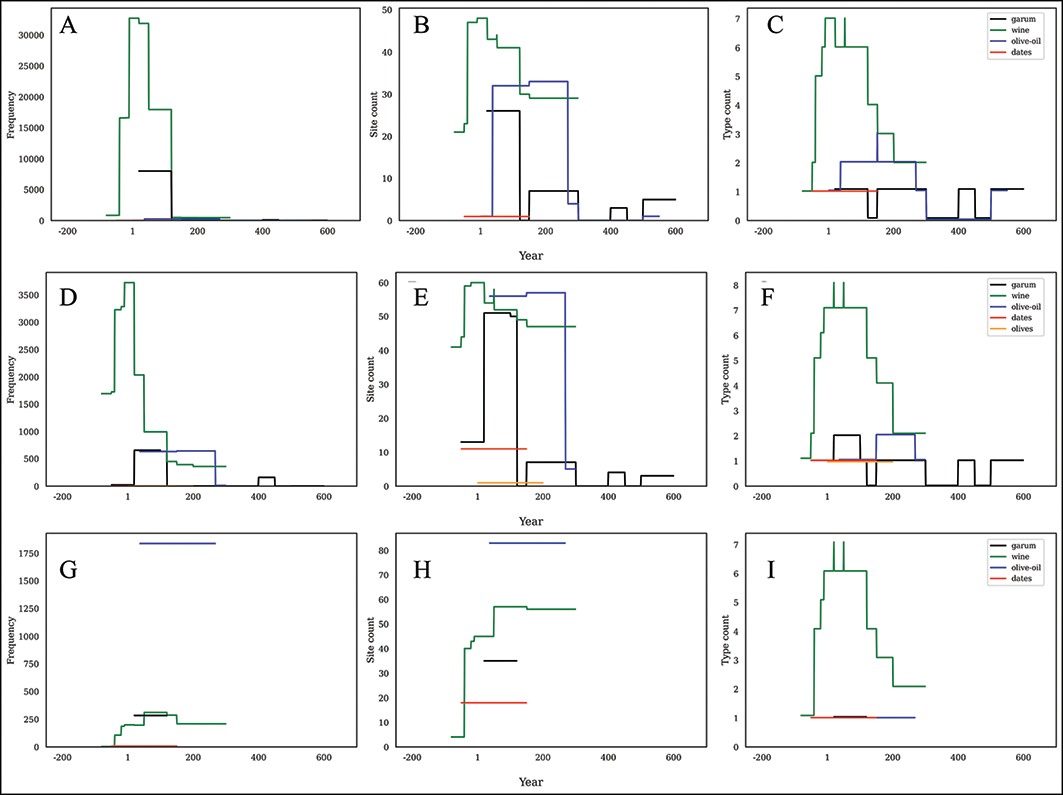
In general, amphora density peaks in the last decades of the first century BCE to 50 CE, followed by a slow decrease to the mid-second century CE (Figure 2a). This slow decrease between 50 and 150 CE coincides with the exports of olive oil in Dressel 20 containers, which was probably a public distribution to supply the northern armies (Remesal Reference Remesal1986). This early imperial peak reveals an extraordinarily active and diverse long-distance trade between the first century BCE and the second century CE (approx. 100 BCE–150 CE) in these Western Roman provinces (cf. Wilson Reference Wilson, Bowman and Wilson2009: 217).
Temporal change, excluding the five high-density sites, in: a–c) the complete dataset; d–f) an origin in the western (black) or eastern (green) provinces; and g–i) typical contents (figure by Tom Brughmans).

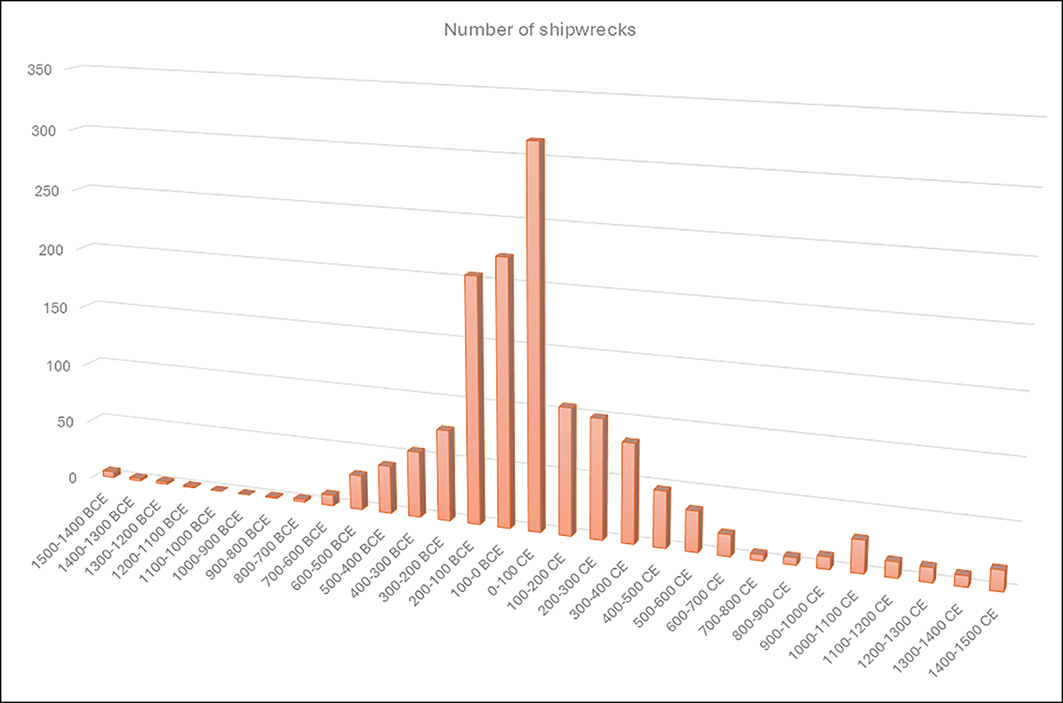
This trend resembles a histogram of dates for shipwrecks published by Parker (Reference Parker1992) and later updated to cover a total of 1646 wrecks by Strauss (Reference Strauss2006) (Figure 3), although our data represent only the Western Roman provinces. This geographic difference may also help explain the limited representation of amphora types dated to the Republican period (second–first centuries BCE) (Figure 2c) in comparison with the frequency of contemporaneous shipwrecks, since some of the provinces in our study area were conquered later (i.e. Germaniae, Raetia, Britannia).
Distribution of 1646 shipwrecks after Parker (Reference Parker1992: fig. 3) (figure by Cèsar Carreras; data from Strauss Reference Strauss2006 updated with the oxrep database 2.1 March 2017).

The chronological trend is also highly similar to the results of the quantitative study of amphorae in the German provinces (Franconi et al. Reference Franconi2023: fig. 3a, black line for type dates), although this study did not homogenise the frequency results using density as we did. A notable difference, however, is that the German provinces show a more limited frequency drop in the second century CE. This comparable trend and difference are also visible in the study focused on central Italy (Komar et al. Reference Komar2025: fig. 2a, black line for type dates). Both studies share a peak in frequency in the first century CE, but the Italian study does not show the strong drop in the early second century. This drop is likely caused by the focus on a narrower selection of amphora types in the present study, fewer of which date to the second part of the second century CE (compare Figure 2C with Komar et al. Reference Komar2025: fig. 2C and with Franconi et al. Reference Franconi2023: fig. 3C). Italy, as a Central Mediterranean region, benefitted early on from North African and Eastern Mediterranean amphora imports, which continued in Late Antiquity. The north-western provinces included in this study did not receive such volumes of imports in later periods when they were probably part of another commercial circuit. Komar and colleagues (Reference Komar2025) indicate that the early imperial boom revealed in their data mirrors patterns already observed in other proxies such as mining activity, construction or food production (i.e. olive-oil and wine presses and garum factories). These proxies also behaved in different ways between territories or provinces. For instance, the highest point of production of foodstuffs in provinces such as Tarraconensis or Narbonensis depended on access to military markets, which also varied over the time.
The site count in the current study (Figure 1) demonstrates that most Western sites in the study area imported amphorae in the period from 50 BCE–250 CE, reflecting the ubiquitous presence of Dressel 20 amphorae in this period; a pattern reflected in the Germanic provinces and central Italy (compare Figure 2B with Komar et al. Reference Komar2025: fig. 2B and with Franconi et al. Reference Franconi2023: fig. 3B).
Most of the products consumed in this western study area originate from Western provinces (Figure 2D). This reflects the mostly western origin of the amphora types selected for this study but, as these are the most common types recovered from excavation, this pattern also reflects the limited influence of Eastern Mediterranean products on the western market. Transport costs and time may provide some explanation here. During the same period, a high proportion of Western sites also consumed Eastern amphorae in very low quantities—normally containing wines.
The present data suggest an extraordinary economic growth in the Western Roman Empire affecting either production or consumption in a relatively peaceful environment (Augustan period, 27 BCE–14 CE and the first and second centuries CE). This period arguably enjoyed more stable transport infrastructures that facilitated amphora exchange and may reveal State involvement in amphora distribution, such as the olive oil in military provinces (i.e. annona militaris; Remesal Reference Remesal1986). Within this general view, there are booms in particular products and production areas (discussed below). The reasons for the end of this booming period may be multiple, including internal problems in the production regions of some wines and olive oil (i.e. climate change), which could reduce volume of production (i.e. Dressel 20 amphora in the conventus Cordubensis) or changes in markets and consumption. Other potential causes may have affected product distribution from public involvement in transportation (Severan period: 193–235 CE), military conflicts, change in state supply (i.e. annona) (Remesal Reference Remesal1986) and disruption of distribution, or result from external factors such as famines or plagues.
Different provincial patterns and the conquest of Britannia
The general trend is mostly shaped by wine and olive-oil amphorae: first a period where wine amphorae were the most frequent in the Western provinces (200 BCE–50 CE) followed by a higher-density frequency of olive-oil vessels (50–250 CE) (Figure 4A). Wine is the dominant product in terms of frequency densities in the overall dataset. Wine amphorae had a wide distribution from the second century BCE to the mid-first century CE, with an increased breadth of products and a boom of exports in the Augustan period. However, a strong decrease in wine frequency in the mid-first century brings wine amphorae in line with the frequency and distribution width of olive-oil amphorae. Fish-sauce exports started in the Augustan period but, despite their wide distribution, they never matched the density frequencies of wine and olive oil.
Temporal change in the typical contents of amphorae deposited at: a–c) Spanish consumption sites; d–f) French consumption sites; and g–i) British consumption sites. High-frequency values reflect the inclusion of high-density sites (figure by Pau De Soto).

This pattern is substantially different when comparing sites located within the modern political boundaries of Spain, France and the UK (Figure 4). This variation in amphora-density frequencies is largely due to geographic differences in agricultural production or temporal differences in when the territories became part of the Roman Empire, affecting their commercial relations and opportunities.
Spanish sites show a pattern of wine consumption comparable to the rest of the Western Empire, but they hardly consumed olive-oil amphorae (Figure 4D–F). Olive-oil amphorae are attested at most of the included Spanish sites (Figure 4E) but only in small density frequencies (Figure 4D). This is because the dataset includes only the province of Hispania Citerior and this province produced its own olive oil, which was not transported in known amphora types. Debate regarding the absence of olive-oil containers in Spain is ongoing, with local flat-bottom flagons suggested as possible vessels. Consumption of fish sauce at Spanish sites starts with a similar pattern to wine and olive oil, but reduced in importance from 100 CE onwards, when local fish-sauce production is detected at Mediterranean and Atlantic sites.
Density frequencies at French sites are also similar to the general pattern in the case of wine imports and fish sauces, but olive-oil imports behave differently. Again, this could be explained by the fact that the province of Gallia Narbonensis produced its own olive oil and did not require external imports. In contrast, imports of olive oil in Gallia Aquitania, Lugdunensis and Belgica were higher due to the lack of local production. Likewise, the temporal pattern of the German provinces and Raetia looks quite like the general trend (Franconi et al. Reference Franconi2023).
Perhaps most striking are the data from the UK, including sites from the Roman province of Britannia (Figure 4G–I). No particular boom in wine imports is noted as the British Isles were not conquered until Claudius (43 CE). Wine amphorae are apparent only in small quantities in southern Britain before the Roman conquest, and afterwards the density frequencies never match the level of the other provinces. In contrast, olive-oil imports were comparatively high since olive groves could not be grown locally. Due to the later date of conquest, all the olive oil was transported in Baetican Dressel 20 amphorae. There is therefore a clear difference between consumption patterns in provinces conquered in the Republican or Augustan periods and the later conquests like Britannia, which showed a particular pattern of consumption before and after it became part of the Roman Empire.
Changes in the supply and consumption of wine over time
As noted above, the rise in amphora trade is largely driven by the increasing quantity and variety of wine amphorae from 200 BCE–50 CE. Initially, the most common type of amphora was the Italian Dressel 1B, one of the three versions (A, B & C) that reached the main Western markets of Hispania Tarraconensis, Gallia, Germania and, in lower-density frequencies, southern Britain.
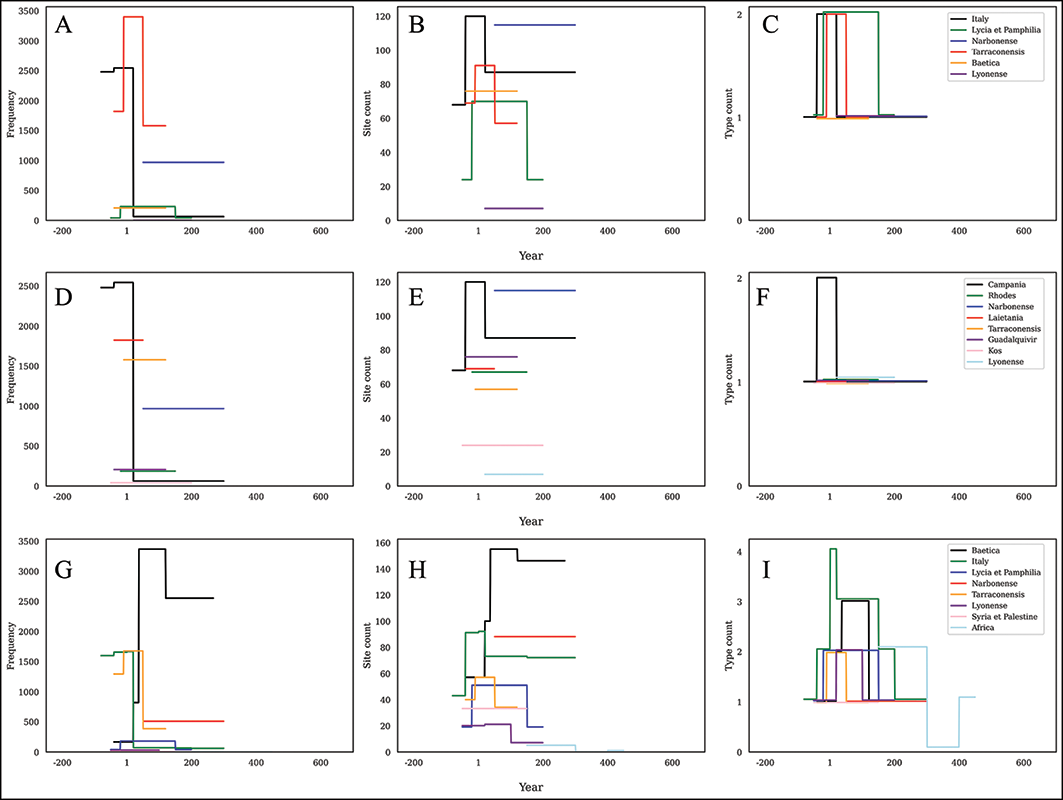
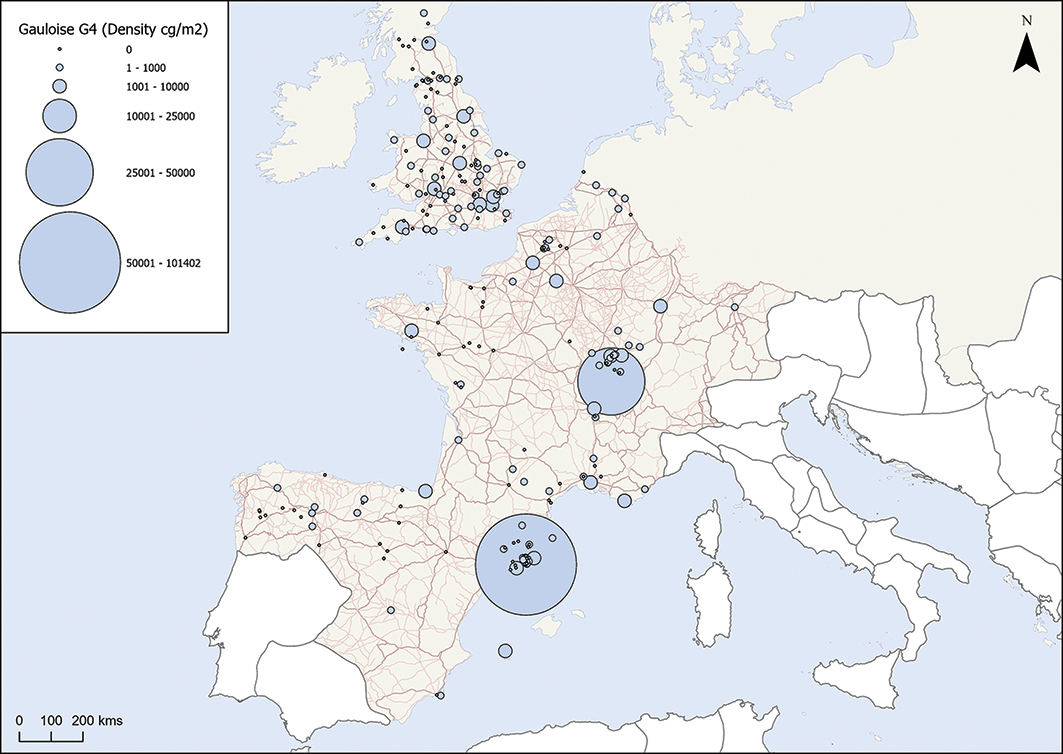
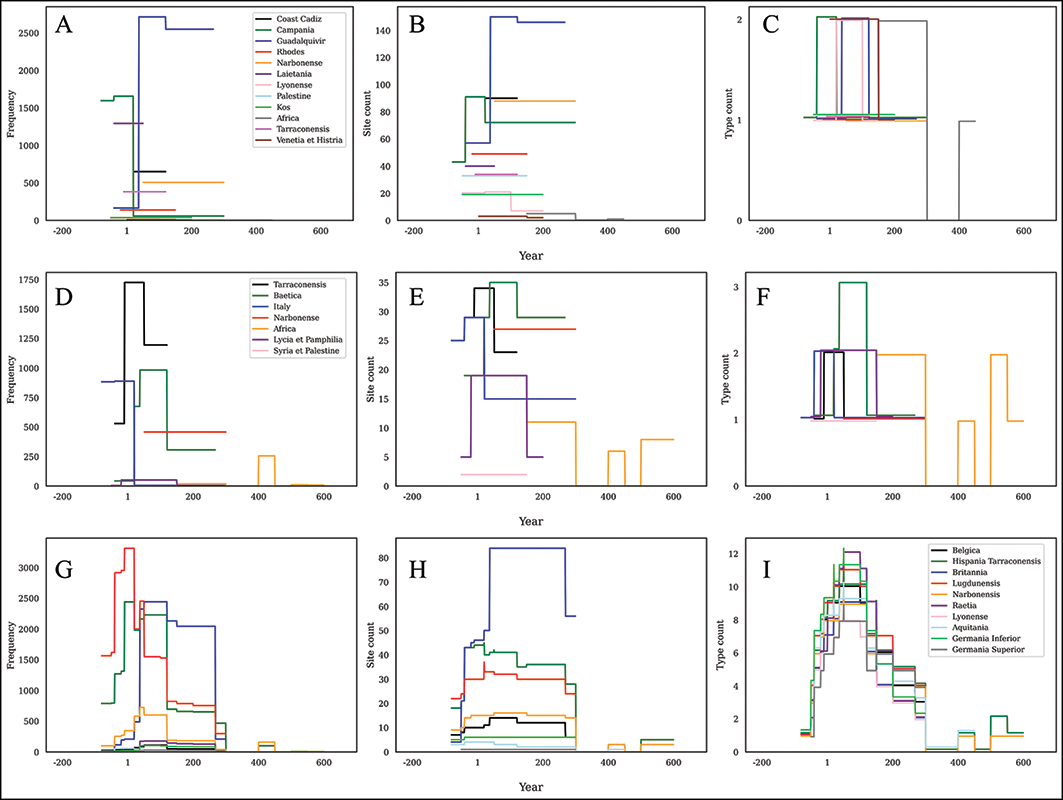
However, this changed with the production and export of Spanish Tarraconensis wines in Pascual 1 and Dressel 3-2 amphorae, which reached a higher-frequency density peak than Italian wines but for less than one century (50 BCE–50 CE) (Figure 5A–C). This apparent boom of Tarraconensis amphorae reflects large quantities at a more limited number of sites (as compared to the higher distribution width of Italian wine) in Tarraconensis, Narbonensis and Aquitania (Figure 5D–F). The Gaulish wine amphora type Gauloise 4 was dominant in Western markets from roughly 50–300 CE, but in lower quantities and at more northerly sites; it was not distributed to other wine production provinces such as Hispania Tarraconensis (Figure 6). One of the highest densities of Gauloise 4 in the Western Roman Empire was in Lugdunum (Lyon), which probably reflects the size of this provincial capital and its role as a redistribution centre for long-distance trade. The success of the flat-bottom Gauloise 4 from 50–300 CE may have been due to the container design, which was especially suited to waterways and land transport towards the northern limes.
Temporal change, excluding the five high-density sites of: a–c) wine amphorae by their province of origin; d–f) wine amphorae by their region of origin; and g–i) the provinces of origin for Atlantic consumption sites (figure by Tom Brughmans).

Figure 5 Long description
Panel A: A histogram showing the frequency of wine amphorae by their province of origin over time. The x-axis represents the year, ranging from -200 to 600, and the y-axis represents the frequency, ranging from 0 to 3500. Different colors represent different provinces. Panel B: A line graph showing the site count of wine amphorae by their region of origin over time. The x-axis represents the year, ranging from -200 to 600, and the y-axis represents the site count, ranging from 0 to 120. Different colors represent different regions. Panel C: A line graph showing the type count of wine amphorae by their region of origin over time. The x-axis represents the year, ranging from -200 to 600, and the y-axis represents the type count, ranging from 0 to 2. Different colors represent different regions. Panel D: A histogram showing the frequency of wine amphorae by their region of origin over time. The x-axis represents the year, ranging from -200 to 600, and the y-axis represents the frequency, ranging from 0 to 2500. Different colors represent different regions. Panel E: A line graph showing the site count of wine amphorae by their region of origin over time. The x-axis represents the year, ranging from -200 to 600, and the y-axis represents the site count, ranging from 0 to 120. Different colors represent different regions. Panel F: A line graph showing the type count of wine amphorae by their region of origin over time. The x-axis represents the year, ranging from -200 to 600, and the y-axis represents the type count, ranging from 0 to 2. Different colors represent different regions. Panel G: A histogram showing the frequency of amphorae by their province of origin for Atlantic consumption sites over time. The x-axis represents the year, ranging from -200 to 600, and the y-axis represents the frequency, ranging from 0 to 3500. Different colors represent different provinces. Panel H: A line graph showing the site count of amphorae by their province of origin for Atlantic consumption sites over time. The x-axis represents the year, ranging from -200 to 600, and the y-axis represents the site count, ranging from 0 to 160. Different colors represent different provinces. Panel I: A line graph showing the type count of amphorae by their province of origin for Atlantic consumption sites over time. The x-axis represents the year, ranging from -200 to 600, and the y-axis represents the type count, ranging from 0 to 4. Different colors represent different provinces.
Distribution of Gauloise 4 amphorae (kernel densities cg/m2) (figure by Pau De Soto).

Figure 5 shows the evolution of amphorae from different production areas, which reveals this trend of changing wine consumption even more clearly. The Republican period was dominated by the Campanian amphorae in terms of frequencies until 50 BCE, after which Laietanian and Tarraconensis vessels had higher densities until 50 CE, though they did not reach as many sites as the Italian products. The Narbonensis production that controlled the market from 60 CE onwards also reached many northern sites. This dominance of particular wine production areas seems to be related to their proximity to the potential markets, initially Hispania and Gaul, later Germaniae, Raetia and Britannia, distributions in which Lyon played a pertinent role. The overspecialisation of Narbonensis in wine production at the expense of other products, such as olive oil (Rice Reference Rice2023), gave this province a comparative market advantage in its particular location and in its production cycle. It further seems that wine production replicated the pattern of Samian ware workshops, with an initial production in Italian workshops to later productions closer to the limes in Gaulish and German potteries.
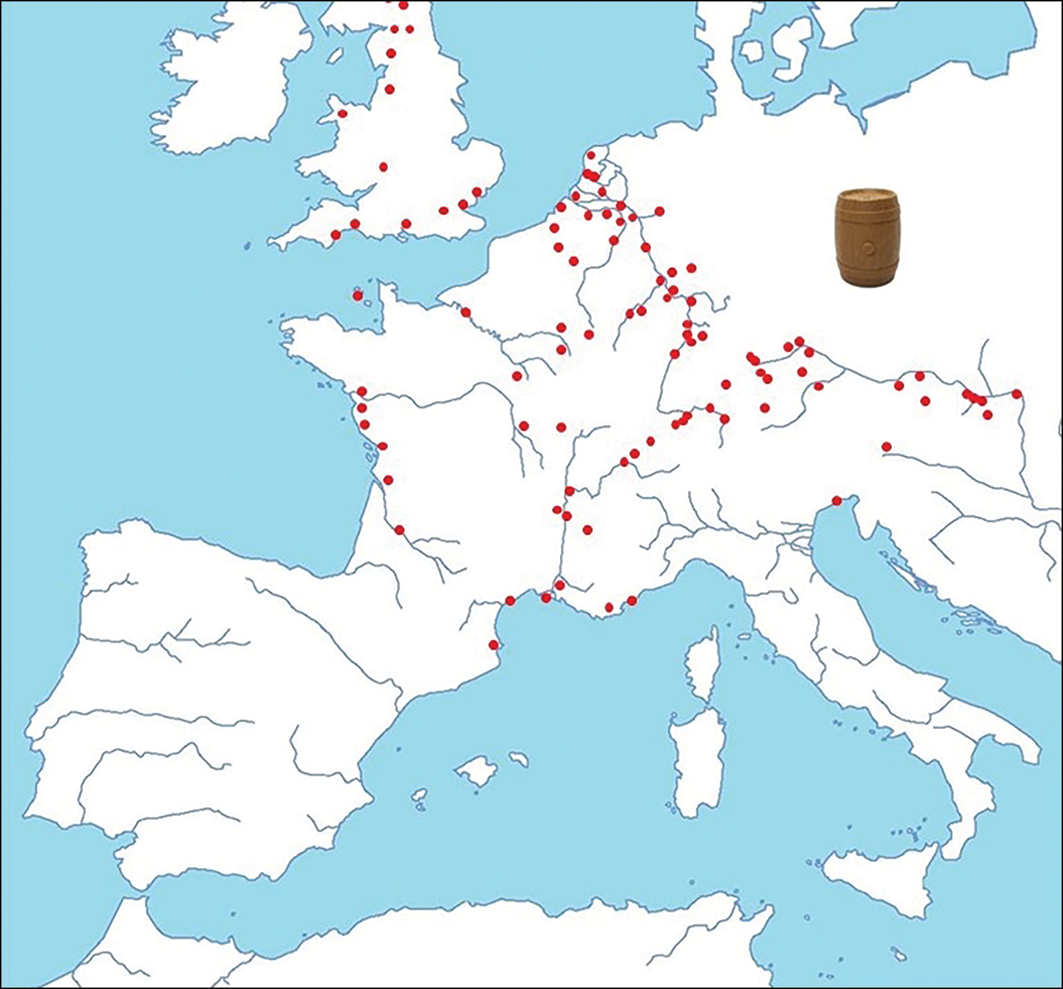
However, the levels of Gaulish imports and of wine in general showed a steep downturn by 300 CE. This decline in wine imports compared to the early Republican period suggests either a switch to the use of other types of containers, a change in consumption pattern with an increasing reliance on locally produced goods that did not require long-distance maritime transport or a shift in the dietary pattern away from oil and wine in some regions. The role of wooden barrels for inland transport in Central and Northern Europe and their potential to replace amphorae has been the topic of recent debates (e.g. Tamerl Reference Tamerl2010). The latest assessment of the distribution of barrel finds in the Roman Empire demonstrates a concentration in provinces such as Gaul, Germaniae, Raetia and Britannia (Figure 7), with barrels typically made of timber that was grown, and therefore probably also processed, in northern climes, such as Gaul. Most of the well-dated barrel finds belong to the earlier imperial periods (Franconi et al. Reference Franconi2023: 30) when wine amphorae were still traded in large amounts, suggesting that barrels complemented amphorae at that point.
Distribution of barrels in the Western Roman Empire (figure by Cèsar Carreras, after Tamerl 2017).

With regards to Mediterranean production areas such as Hispania, Italy or Greece, there is almost no indication of the use of barrels; there are currently few finds and barrels are not represented in sculptures or reliefs (Tamerl Reference Tamerl2010). Therefore, there is nothing to suggest a substitution of amphorae for barrels in the southern Mediterranean provinces, though the partial use of barrels in northern provinces is probable.
Olive oil: the golden liquid from the Mediterranean
Long-distance olive-oil trade was not especially prevalent in the Western provinces during the Republican period, although some limited consumption of North African and Brindisi olive-oil amphorae is evident in Hispania Citerior and Narbonensis. The Brindisi amphorae (Apani V & Giancola V) were found in military contexts or well-Romanised environments in the recently conquered provinces of Hispania Citerior and Narbonensis but the quantities are vanishingly small compared to the wine amphorae.
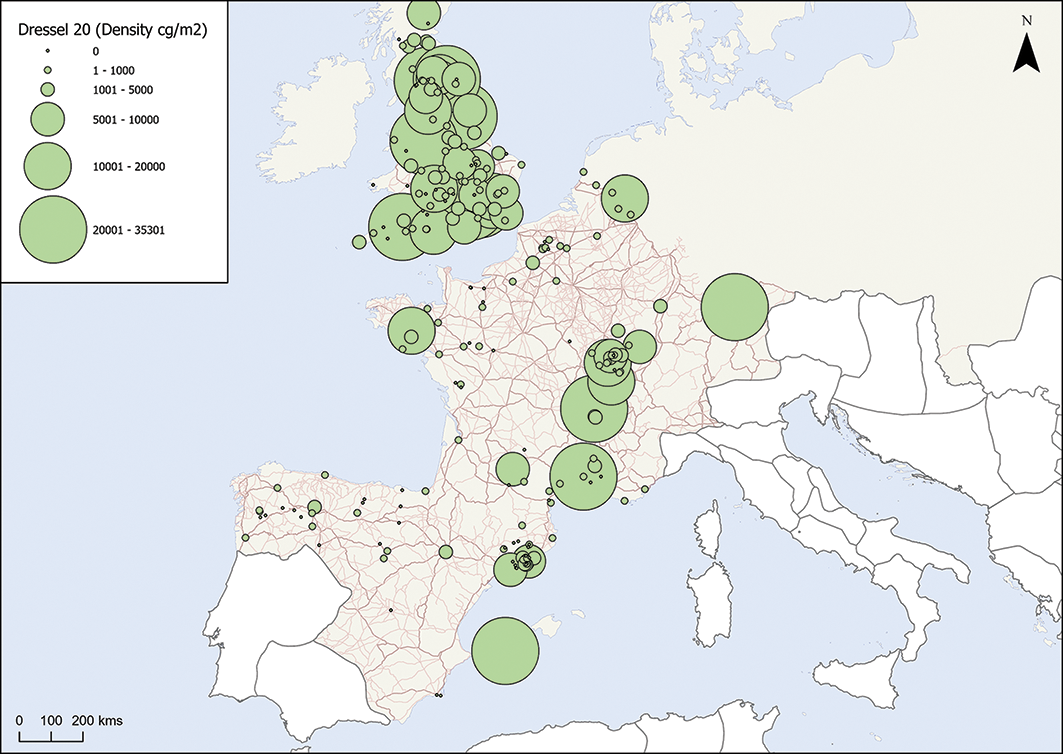
The situation changed completely in the mid-first century CE (Figure 8), when olive oil became the most widely distributed foodstuff in the Western Roman Empire (until 250 CE). Olive oil was mostly produced in the province of Baetica and transported in Dressel 20 amphorae towards the Atlantic consumption sites (Figure 9). Figure 8 reveals the density concentration of those Dressel 20 amphorae within the Western provinces. Again, the heatmap shows high densities in military destinations such as the German, Raetian (i.e. Augsburg) and British limes and at the redistribution centre of Lyon.
Distribution of Baetican olive-oil Dressel 20 amphorae (kernel densities cg/m2) (figure by Pau de Soto).

Temporal change, excluding the five high-density sites, in: a–c) the regions of origin for Atlantic consumption sites; d–f) province of origin for Mediterranean consumption sites; and g–i) the Early Imperial province of consumption sites (figure by Tom Brughmans).

Figure 9 Long description
Panel A: A histogram showing the frequency of olive oil production regions over time for Atlantic consumption sites. The x-axis represents the year, ranging from -200 to 600 CE, and the y-axis represents the frequency. Different regions are color-coded according to the legend. Panel B: A line graph showing the site count of olive oil production regions over time for Atlantic consumption sites. The x-axis represents the year, ranging from -200 to 600 CE, and the y-axis represents the site count. Different regions are color-coded according to the legend. Panel C: A line graph showing the type count of olive oil production regions over time for Atlantic consumption sites. The x-axis represents the year, ranging from -200 to 600 CE, and the y-axis represents the type count. Different regions are color-coded according to the legend. Panel D: A histogram showing the frequency of olive oil production provinces over time for Mediterranean consumption sites. The x-axis represents the year, ranging from -200 to 600 CE, and the y-axis represents the frequency. Different provinces are color-coded according to the legend. Panel E: A line graph showing the site count of olive oil production provinces over time for Mediterranean consumption sites. The x-axis represents the year, ranging from -200 to 600 CE, and the y-axis represents the site count. Different provinces are color-coded according to the legend. Panel F: A line graph showing the type count of olive oil production provinces over time for Mediterranean consumption sites. The x-axis represents the year, ranging from -200 to 600 CE, and the y-axis represents the type count. Different provinces are color-coded according to the legend. Panel G: A histogram showing the frequency of olive oil consumption provinces during the Early Imperial period. The x-axis represents the year, ranging from -200 to 600 CE, and the y-axis represents the frequency. Different provinces are color-coded according to the legend. Panel H: A line graph showing the site count of olive oil consumption provinces during the Early Imperial period. The x-axis represents the year, ranging from -200 to 600 CE, and the y-axis represents the site count. Different provinces are color-coded according to the legend. Panel I: A line graph showing the type count of olive oil consumption provinces during the Early Imperial period. The x-axis represents the year, ranging from -200 to 600 CE, and the y-axis represents the type count. Different provinces are color-coded according to the legend.
The consumption of olive oil in the Atlantic provinces is interesting because the local populations of these territories could not grow olive trees. Instead, they had other vegetable or animal fats (nut oil, butter, lard), which fulfilled a similar role in their diets. The dramatic increase in the consumption of olive oil in the mid-first century CE appears to be related to a military presence seen, for example, in the chronological densities of Dressel 20 stamps that relate to the movement of troops in Roman Britain. Other concentrations of Dressel 20 amphorae in the Cotswolds or south-east Britain (London to Colchester) can be explained by a temporary military presence and Mediterranean immigration (colonies and administrative staff) (Carreras Reference Carreras2000). The idea that the Roman state created an institution called ‘annona militaris’ to supply Roman armies with particular products, such as olive oil, as it was doing for the plebs of Rome, has already been put forward (Remesal Reference Remesal1986; Komar et al. Reference Komar2025).
Such supplies are not detected in provinces such as Hispania Citerior or Narbonensis (Figure 9D–F) because these were olive-oil production provinces (Brun Reference Brun2005). The Baetican products from the Guadalquivir valley—Dressel 20 amphorae—were the dominant type, reaching proportions of more than 60 per cent in the amphorae assemblages of provinces such as Germaniae, Britannia, Belgica, Lugdunensis and Raetia (Figure 9H–I). However, recent work (Rubio-Campillo et al. Reference Rubio-Campillo2017) suggests that State intervention was not so important in the limes provinces. Similar conclusions were drawn from the statistical study of assemblages from the German limes (Franconi et al. Reference Franconi2023).
Alternative olive-oil amphora containers, such as the Adriatic and North African vessels, hardly appear in the Atlantic provinces. They are recorded in very low numbers or, in the case of North African types, become more frequent in the late periods. Likewise, olive-oil containers have similar import percentages in Mediterranean provinces such as Hispania Citerior and Narbonensis (Figure 9H–I), despite the fact that they produced their own olive oil and did not require much external imports.
In Italy (Komar et al. Reference Komar2025), olive oil transported in the Baetican Dressel 20 amphora became the second biggest import, mainly in the city of Rome with the annona mechanism in place. Evidence from Monte Testaccio reveals the importance of such trade, at least from the Flavian period (69–96 CE) to the mid-third century CE (Remesal Reference Remesal1986). The North African oil amphorae replaced the Baetican amphorae from second century CE onwards (i.e. Africana I, Keay LV) but never reached the same density levels.
The crisis of olive-oil imports in our dataset from the mid-third century CE reflects the lack of imports in the Atlantic provinces, where North African and Adriatic olive oils never reached significant numbers. Therefore, if there was indeed a public mechanism to supply olive oil to the Roman armies in the early Empire, it does not appear to have continued into the late Roman period. This change also affected production areas such as Baetica, with a drastic reduction in Dressel 20 amphora production from the late second century CE onwards.
Fish-sauce amphorae: an early distant trade
The third type of amphora-borne commodity imported into the Western provinces in large quantities was fish-sauce products (i.e. garum, muria, liquamen), but that was still in relatively low quantities compared to wine and olive oil (Figure 2). It should be noted, however, that fish sauce could not be considered a staple and all the provinces with a seacoast or major river could produce their own sauces. For instance, Dressel 9-10 similis (Lyon 3A-3B), which included painted inscriptions of garum flos and muria hispana, were produced at Lyon workshops (e.g. La Muette).
The main fish trade used amphorae types from the Baetican coast (Dressel 7-11, Beltran I & II) from the mid-first century BCE to the late first century CE. Afterwards, exports were reduced to some North African vessels, the distribution of which was limited to the Mediterranean provinces. Fish-sauce imports in the provinces of Hispania Citerior, the three Galliae and Britannia (Figures 2, 3 & 4) look similar to the general trend, so they do not show any special distribution. Regarding the sharp fall in the imports of Baetican fish-sauce vessels, new production regions in the Western provinces are detected from the late first century CE onwards, for example in Lusitania, the Galician and Cantabric coasts, Brittany, the Thames Valley and the Lowlands. Most of the fish-sauce infrastructure in these regions included neither amphora- nor ceramic-production workshops, so it is unclear how fish sauces were distributed. The use of barrels for this purpose has been suggested (Tamerl Reference Tamerl2010), though no evidence is available so far.
Just as the trade in wine may have regionalised in some parts of the early Empire, such as the Germaniae (Franconi et al. Reference Franconi2023: 28), the fish-sauce exchange may have also reduced with the creation of regional production areas along the Atlantic coasts, negating the need for imports from the Baetican coast. In this case, local or regional productions may have replaced distant products, except where the latter were considered of special high quality.
As happened with the olive oil, other fish-sauce suppliers, such as North Africa, never managed to distribute their products in the Atlantic provinces (i.e. Spathia, Africana II, Keay LXII), but only along the central and western Mediterranean coasts. Lusitanian fish-sauce amphorae also hardly appear in the Atlantic provinces, and instead were traded towards the central Mediterranean markets.
The commercial crisis of the late Roman Empire
In the discussion of imports of individual products (i.e. wine, olive oil, fish sauces), we note a clear downturn from the late third century CE onwards. This same general trend can in fact be seen for all amphora imports (Figure 2) in the Western Roman Empire. Similar patterns were recorded in the province of Germania (Franconi et al. Reference Franconi2023). Reduction in amphora imports coincides with the decrease in production and trade of the Baetican Dressel 20 amphora type, which was the most popular amphora until the second half of the third century CE in the northern provinces and could be considered a driving force for other commercial movements.
If it is agreed that Dressel 20 was an olive-oil amphora distributed by the Roman State, its disappearance seems to be the result of a lack of public intervention in the northern provinces, or perhaps an intervention only limited to the city of Rome. To what extent the lack of public intervention may have affected the blooming trade in the early Empire is a subject of ongoing discussion. Nevertheless, the decrease in imports is less pronounced in Italy where North African and late Roman amphorae are more common (Komar et al. Reference Komar2025). The late Roman Empire therefore reveals some distinct consumption patterns between the Atlantic provinces and the Central Mediterranean.
Some North African and late Roman vessels were distributed in coastal sites only in relatively small quantities and were not found in the inland sites of the northern provinces such as Tarraconensis. The large North African amphorae were not suited for river or land transport, so whatever was transported in them would have required decanting into another type of container that has not left any archaeological trace. Even so, the quantities of these amphorae recorded at coastal sites do not match the quantities required to supply inland regions.
Another alternative was the rise in the consumption of regional products; provinces such as Hispania Tarraconensis or Galliae still had wine and olive-oil presses and also fish-sauces vats dated to the third and fourth centuries CE. A few regional flat-bottom amphorae with distributions around production areas have been recorded. There are signs, therefore, of regional circuits inland while a coastal global market persisted for a limited quantity and variety of products.
Conclusion
This quantitative analysis of Roman amphora data from 216 sites across the Western Roman provinces provides an overview of how these ceramic vessels can reflect major trends in Roman commercial relationships and long-distance trade from the late Republican period through Late Antiquity. By standardising amphora frequencies and employing a probabilistic aoristic method, we have been able to compare ceramic data from 254 excavations and reveal nuanced temporal and spatial patterns in ceramic density, site count and type diversity.
The study confirms a frequently discussed economic boom in the Western Roman Empire during the early Imperial period (roughly 100 BCE–150 CE), aligning with trends observed in other economic proxies such as shipwreck data. This period was characterised by a high diversity of amphora types and widespread consumption across numerous sites. Our findings highlight the shifting dominance of different commodities and their regional origins, with Italian and Tarraconensian wines initially leading, followed by a significant surge in Baetican olive oil (Dressel 20 amphorae) to the Atlantic provinces. The distinct consumption patterns observed in provinces like Britannia underscore the influence of Roman conquest and state supply mechanisms, such as the annona militaris, in shaping regional economies.
Funding statement
Danmarks Frie Forskningsfond (DFF) Sapere Aude research leadership grant (0163-00060B). Danish National Research Foundation (DNRF) Centre of Excellence for Urban Network Evolutions (UrbNet) (DNRF119).
Online supplementary material (OSM)
To view supplementary material for this article, please visit https://doi.org/10.15184/aqy.2026.10429 and select the supplementary materials tab.
Data and code availability
The data and code can be accessed through the publication’s GitHub repository: https://github.com/Tom-Brughmans/west_roman_amphorae.
Author contributions: CRediT categories
Daniel Blumenkranz: Investigation-Equal, Methodology-Equal.


 Open access

