

Speakers use auditory feedback to monitor their language output for intelligibility and accuracy, as well as to adjust the loudness and rate of their speech (Levelt, Reference Levelt1983; Perkell et al., Reference Perkell, Matthies, Lane, Guenther, Wilhelms-Tricarico and Wozniak1997). However, visual feedback during sign language production does not parallel auditory feedback during speech production. For speakers, listening to one's own voice is similar to listening to another person's voice. That is, the acoustic signal that is perceived while talking is comparable to the acoustic signal that is received when another person is speaking. In contrast, for signers, the visual input from one's own signing is quite distinct from the visual input received when watching another person sign. Signers do not look directly at their hands and cannot see their own faces (grammatical information in many sign languages is conveyed by facial expressions; Zeshan, Reference Zeshan2004). The view of one's own hands while signing differs dramatically from the view of another person's hands. Given these differences in the nature of perceptual feedback for signing compared to speaking, we investigated whether and how alterations in visual feedback might alter sign language production.
Recently, Emmorey, Korpics, and Petronio (in press) found that DeafFootnote 1 signers with tunnel vision due to Usher syndrome (a form of retinitis pigmentosa that causes loss of peripheral vision) consistently produced American Sign Language (ASL) within a smaller signing space near their face compared to normally sighted signers. Arena, Finlay, and Woll (Reference Arena, Finlay and Woll2007) also reported that the size of signing space for British Sign Language was directly related to the size of a signer's visual field for those with Usher syndrome. Arena et al. (Reference Arena, Finlay and Woll2007) hypothesized that signers with tunnel vision use visual feedback to calibrate the dimensions of signing space with respect to their reduced visual field, and Emmorey et al. (in press) argued that visual feedback is not likely to be used to detect errors or to monitor for appropriateness while signing. Signs are difficult to perceive in the far periphery of vision, and syntactic information in ASL is often signaled only by nonmanual markers (Liddell, Reference Liddell1980), which are not visible to the signer. Thus, visual feedback for sign language may primarily function to fine-tune phonetic aspects of signed output, such as the size of signing space.
In this study, we investigated how quickly and automatically signers adjust to alterations in visual feedback by creating sudden, artificial Usher syndrome. Signers who are born with Usher syndrome are generally born deaf, but do not experience loss of peripheral vision until adolescence or early adulthood. The degeneration of peripheral vision is not sudden, but occurs gradually over several years. It is possible that changes in signing space only occur when the change in visual feedback takes place over an extended period of time. In contrast, for speech, adjustments to alterations in auditory feedback occur relatively rapidly and automatically. For example, speakers make compensatory adjustments to their pitch within 100–150 ms of a perturbation of the auditory feedback of their pitch (Elman, Reference Elman1981; Jones & Munhall, Reference Jones and Munhall2000). Alterations of visual feedback might also cause rapid adjustments in sign production. To investigate this question, we asked normally sighted signers to wear goggles that created tunnel vision to determine whether they begin to immediately reduce the size of their signing space when faced with a sudden loss of peripheral vision.
When visual feedback is removed during nonlinguistic reaching and grasping actions, the duration of hand movement is increased and the fine-tuning of hand configuration for grasping is decreased, but the early preshaping of hand configuration is unaffected (Churchill, Hopkins, Ronnqvuits, & Vogt, Reference Churchill, Hopkins, Ronnqvuist and Vogt2000; Schettino, Adamovich, & Poizner, Reference Schettino, Adamovich and Poizner2003). Schettino et al. (Reference Schettino, Adamovich and Poizner2003) argue for an early phase of hand preshaping that involves selection of a basic hand configuration that is independent of visual feedback and a late “corrective” phase that depends on visual feedback to optimize grasp. In addition, hand trajectories during pointing movements are straighter when produced with full vision than when produced while blindfolded (Sergio & Scott, Reference Sergio and Scott1998). However, one difference between sign production and nonlinguistic reaching movements is that signing is not visually guided. Signers look at their interlocutor and do not track their hands while they sign. Visual feedback appears to be necessary to accurately and efficiently reach and grasp an object in the environment, but its role in producing hand configurations unrelated to objects or in reaching locations on the body is less clear.
When auditory feedback is eliminated (or greatly reduced) because of noise presented over headphones, speakers talk louder: a result known as the Lombard effect (after Lombard, Reference Lombard1911). The effect is sometimes referred to as the Lombard reflex because the increase in speech amplitude appears to be immediate and unconscious (Junqua, Reference Junqua1996). Today, it might even be called the “iPod effect” because speakers hearing music through iPod earbuds inevitably raise their voice while speaking (even when their interlocutor can hear them perfectly well). Speakers are hypothesized to increase the volume of speech to increase the auditory feedback signal that is blocked by noise (or music). We investigated whether there might be a visual equivalent of the Lombard effect. Do signers “sign louder” when visual feedback is eliminated by a blindfold or other visual obstruction?
The visual equivalent of shouting or signing “louder” involves producing signs within a larger signing space (Crasborn, Reference Crasborn2003; Emmorey, Reference Emmorey2002). Using measurements from video, Siegel, Clay, and Naeve (Reference Siegel, Clay and Naeve1992) found that obstructing the vision of hearing signers had no effect on the size of the ASL signs they produced. In contrast, the usual Lombard effect was observed when the same participants produced spoken English under noisy conditions. Emmorey et al. (in press) also found that the size of signing space for functionally blind signers did not differ significantly from that of normally sighted signers. These results suggest that there is not a parallel Lombard effect within the visual modality. However, both Siegel et al. (Reference Siegel, Clay and Naeve1992) and Emmorey et al. (in press) calculated signing location from videotape, and it is possible that such measurement techniques are not sensitive enough to detect relatively subtle changes in sign production that may occur when visual feedback is completely removed. Therefore, we utilized an Optotrak motion capture system to better assess possible kinematic changes in sign production that might occur when visual feedback is blocked. The Optotrak system also allows measures of distance and velocity, which are not available in video data of signing.
In addition, we assessed changes that occur during “loud” signing and during informal, casual signing. Shouting and informal signing are associated with opposite ends of the spectrum with respect to signing space. We predicted that shouted signing is produced with larger movements, creating a larger signing space, compared to normal, citation signing. In contrast, we predicted that formal signing is produced with reduced movements within a smaller signing space. We did not examine whispered signing because the goal of whispering is to keep a conversation private or visually quiet by moving signs to a location where the hands cannot be seen by others. Thus, although whispered signs are produced within a smaller signing space, they are also most often dislocated downward, toward one side of signing space, and may involve substitutions of orientation change for path movement (Crasborn, Reference Crasborn2003). Measurements of shouted and informal signing provide a comparison scale for the size of signing space that can be used to interpret changes that might occur with alterations of visual feedback. Furthermore, this is the first study to assess fine-grained kinematic changes in sign language production that accompany changes in register.
In sum, we investigated (a) whether signers process visual feedback on-line and automatically reduce the size of signing space to accommodate a reduced visual field, (b) whether there is a visual equivalent to the Lombard effect, and (c) how changes in register (shouting and informal signing) affect phonetic aspects of sign production.
METHOD
Participants
Thirteen participants were recruited from the San Diego area Deaf community; of these, data from nine participants were used in the analyses. Four participants provided unusable data because of errors in data recording (incorrectly aligned coordinate system, labeling error, or frequent loss of the emitter data). The nine subjects (5 male, 4 female) used for the analyses had a mean age of 23.3 years (range = 18–30 years). All participants were right handed, native or near-native ASL signers (acquiring ASL in early childhood) and all used ASL as their preferred and primary means of communication. All but one was prelingually deaf and reported severe to profound hearing loss. Testing was performed in the Laboratory for Language and Cognitive Neuroscience at San Diego State University.
Materials
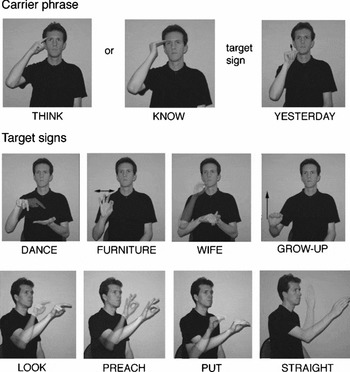
The stimuli were eight ASL signs that were embedded in a carrier phrase to measure the articulation of a sign in a natural context and to standardize the beginning and end of the sign. The carrier phrase for five of the signs (GROW-UP, STRAIGHT, DANCE, WIFE, FURNITURE)Footnote 2 was THINK ___ YESTERDAY. The remaining three signs (PREACH, PUT, LOOK) were agreeing verbs and were embedded in the phrase KNOW ____ YESTERDAY. The verbs THINK and KNOW are both made at the forehead, and the sign YESTERDAY is made at the chin. Citation forms of the carrier phrase signs and the target signs are illustrated in Figure 1. Two phrases were used to allow the context of the sign to fit into the appropriate grammatical contex. The verb KNOW takes a sentential complement, and therefore, the agreeing verbs were inflected spatially (i.e., “preach to someone”). Previous research has found that signers direct their gaze toward the location associated with the syntactic object of agreeing verbs (Thompson, Emmorey, & Kluender, Reference Thompson, Emmorey and Kluender2006). Therefore, we investigated whether these verbs might be differentially affected by changes in visual feedback.
Illustrations of the carrier phrase and the target ASL signs.

Procedure
Digitized records of the movement trajectories of small, infrared-emitting diodes (IREDs), attached to the participant, were collected using the Optotrak Certus system. This system measures the three-dimensional positions of the IREDs with an accuracy of up to 0.1 mm, and 0.01 mm resolution. The resulting position trajectories, sampled at a rate of 100 Hz for each IRED, and velocity information derived from them, permit a fine-grained analysis of signing movements.
A calibration procedure, using a digitizing probe, took place for each participant at the beginning of the session. This procedure established a measurement coordinate system that had its origin at the center of the participant's forehead. From this reference point, the x and y dimensions refer to the horizontal and vertical dimension in the frontal plane of the body, and the z dimension refers to the distance from the body in the sagittal plane.
Participants were seated approximately nine feet from the Optotrak position sensor facing the experimenter who was 10 feet away. The participants faced 45 degrees from the line of sight of the Optotrak position sensor to keep the emitter on the distal side of the hand in view. Four IREDs were attached to the participant: one on the distal side of the right hand, one on the proximal side, one on the right shoulder, and one on the right temple.
Participants were instructed to place their hands in their lap at the completion of each signed phrase. The experimenter (a Deaf ASL signer) was seated directly across from the participant and presented a sign cue (the English gloss of the target sign to be produced), and signalled to begin signing once the recording began. Upon being cued, each phrase was repeated five times before continuing to the next sign for each of the eight target signs. One performance of a phrase is considered to be one trial, creating five trials per stimulus. The words were randomly ordered for each participant, but grouped by carrier phrase.
Data were collected for each stimulus in five conditions: normal, tunnel vision, blindfold, shouting, and informal. In the normal condition the participant was instructed to perform each sign as they would in the standard, citation form as found in a dictionary. In the tunnel-vision condition, participants wore goggles that covered the entire visual field except for a 3.175-m hole for each eye, which allowed approximately 10.5 degrees of visual angle. In the blindfold condition, participants wore a blindfold, which eliminated all visual feedback. During the blindfold condition, the cue to begin signing was provided by a stomp on the ground for each trial. In the shouting condition, participants were told to sign as if they were communicating across a large distance. Finally, in the informal condition, participants were told to produce more “sloppy” signing, of the sort that occurs in casual conversations. The order of these conditions were randomized across participants, with the constraint that the normal condition was always first, the blindfolded and tunnel-vision conditions were randomly second and third, and the shouting and informal conditions were randomly fourth and fifth.
Data reduction and analysis
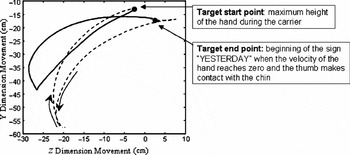
Each trial produced a data file containing 400 three-dimensional position samples (4 s) for each of the four emitters; however, the emitter on the distal side of the hand was most likely to remain in view during signing for the eight signs, and therefore only data from this emitter were analyzed. The emitters on the shoulder and head were used to help determine the beginning and end of the carrier phrase. The target signs were stripped from their carrier phrase for analysis using a Matlab (version 7.0) software program. The start point of each sign was determined by the maximum height of the hand during the carrier verb THINK or KNOW. The end point corresponded to the beginning of the sign YESTERDAY, when the velocity of the hand reached zero or the thumb made contact with the chin. Analyses were performed only on the trajectory between these two points. Figure 2 provides an illustration of the excised movement trajectory for the sign GROW-UP and the transitional movement to and from the carrier phrase signs produced in the citation signing condition.
Illustrations of the movement trajectory for the sign GROW-UP produced in the carrier phrase THINK GROW-UP YESTERDAY in the normal, citation signing condition. The Y dimension is vertical movement and the Z dimension is movement forward from the signer. The dotted line indicates the transitional movement from the lap to the forehead for THINK and from the chin for YESTERDAY back to the lap. The solid line illustrates that excised trajectory used for analysis for the target sign GROW-UP.

Occassionally, a trajectory would have gaps in which no usable data were collected for some or all IREDs. This could occur if the Optotrak camera did not have a line-of-sight view of an emitter or if the light from a IRED reflected so that the emitter appeared to make an impossible jump. Any trial with more than 15% of data missing was not included in analyses.
Dependent measures. For each trial, the following dependent measures were extracted for the movement of the right hand for the target sign after it had been isolated from the carrier phrase.
1. The size of each dimension (X, Y, and Z), reported in millimeters: Dimension size was calculated as the range of motion of the hand during signing, excluding the largest and smallest 25% of the points in trajectory (i.e., the interquartile range).
2. The volume of signing space, reported in cubic millimeters: This was calculated as the product of the size of each of the three dimensions.
3. The duration of the sign, reported in milliseconds.
4. The distance along the trajectory traveled by the right hand, reported in millimeters.
5. The mean velocity of the hand during signing, reported in millimeters/second: Velocity was calculated as the distance covered divided by the duration of the sign.
6. The median location in each dimension (X, Y, and Z), reported in millimeters: The median value for all the locations of the hand during a target sign within each dimension was calculated.
For each dependent measure, the median value was first computed across repetitions for each of the eight signs within each of the five conditions. The mean of the eight signs provided a single value for each subject in each of the five conditions.
Variability in kinematic data. Because individuals differ physically in body size, arm length, height, movement range, and so forth, it is possible that kinematic data patterns might depend in important ways on such physical differences across signers. In a kinematic study of location undershoot in ASL, Mauk (Reference Mauk2003) observed a fair amount of individual variability for some measures across the four signers he studied, although the general undershoot pattern was reliable (i.e., vertical location values were affected by signing rate and phonetic context). Therefore, for all of the dependent variables listed above, we examined the data for substantial variabililty either across participants or across signs, which might engender problems of interpretation for the results.
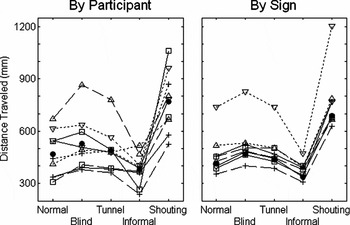
Figure 3 illustrates the general pattern of variability across the nine participants and across the eight signs using distance traveled as a representative example, a measure that a priori might be expected to exhibit substantial differences across participants and signs. As can be seen in the left panel, there were nontrivial differences between participants in overall distance traveled; there was a greater than 2:1 ratio between the average distance traveled for signs produced by the participant making the largest signs compared with the participant making the smallest signs. Despite this individual variation, however, the difference between the shouting and normal conditions was remarkably similar for all nine participants, and this difference was significant (see Results). Crucially, attempts to normalize the data to take into account typical signing size neither changed the overall pattern of the reported results nor substantially improved the power of the statistical comparisons.
An example of one dependent variable, distance traveled, in the five signing conditions, illustrating its variability across (left panel) participants and (right panel) signs. For the left panel, each combination of plotting symbol and line type connecting the plotting symbols represents a different participant. For the right panel, these same symbols and lines are used to represent different signs. Included for reference in both panels are filled circles, which represent the means across participants and signs (identical in the two panels).

Figure 3 also reveals that, not surprisingly, distance traveled was systematically larger for some signs than for others. However, the variation across signs was relatively small and would be trivial except for one sign, GROW-UP, which covered more distance than all of the other signs in all conditions. As with the particiant data, the direction of the difference between the normal and the shouting conditions was the same for all signs and was quite similar in magnitude (except for GROW-UP). Based on the generality of the observations illustrated in Figure 3, we did not complicate the analyses by normalizing the data across signs and focused on the variability across participant means when evaluating the reliability of signing differences between conditions.
RESULTS
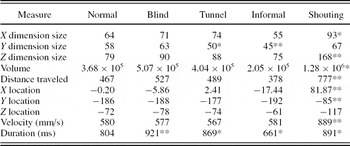
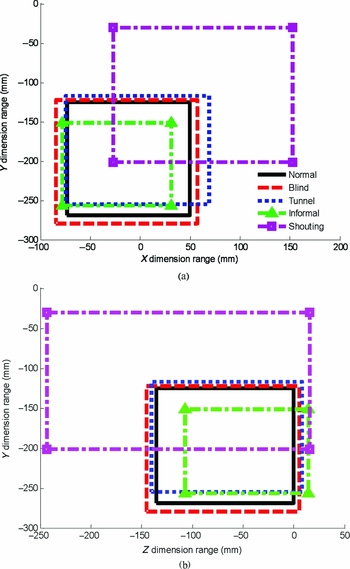
Table 1 displays the mean values across participants for each of the 10 dependent variables in the five conditions of the experiment. Analyses of the effects of the conditions are reported as paired samples, two-tailed t tests with Bonferroni correction to compensate for multiple comparisons (αFW = .05). Each of four experimental conditions was compared with the normal control condition. The sizes and locations of signing space for each of the conditions are displayed in Figure 4 as two separate two-dimensional representations, one for the front view of the signer (Y and X dimensions plotted) and one for a profile view (Y and Z dimensions plotted).
Means for each dependent measure

Note: The values are in millimeters, unless stated otherwise.
*p < .0125 (Bonferroni significance). **p < .001.
The dimensions of signing space in the five conditions (normal, blind, tunnel vision, informal, shouting) averaged across nine participants. The origin (0) is at the center of signer's face, just in front of the nose, as calibrated for each participant at the start of testing. (a, b) The values on the ordinate axis represent vertical space in the vertical Y dimension. The bottom edge of each box plot represents the average minimum height of signing, and the top is the average maximum height. (a) An illustration of the coronal plane from the signers’ perspective. The abscissa represents the horizontal X dimension. The left edge of each box plot is the average maximum leftward location, and the right edge is the average maximum rightward location. (b) An illustration of the sagittal plane with the signer facing rightward. The abscissa represents the outward Z dimension, with positive values indicating forward movement from the signer's perspective. The left edge of each box plot is the average minimum location (with little motion behind the signer), and the right edge of each box is the average maximum forward location. [A color version of this figure can be viewed online at journals.cambridge.org/aps]

Change in register: Informal signing and shouted signing
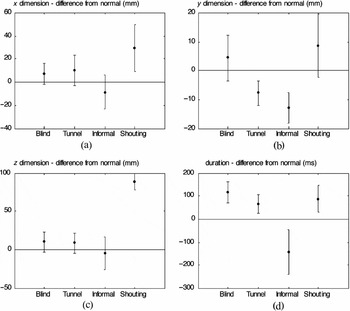
As predicted, informal signing had a shorter duration than normal, citation signing, t (8) = 3.47, p = .008. Also as predicted, informal signing was characterized by a smaller space in all three dimensions (see Figure 4). However, the difference was statistically reliable only in the vertical dimension, t (8) = 5.55, p = .001, and not for the horizontal and forward dimensions, t (8) < 1.5, p > .05. Confidence intervals summarizing the effects on signing space and duration for the comparison of the informal and normal signing conditions, as well as for the other three conditions, are shown in Figure 5.
Confidence interval plots for (a) X dimension size (horizontal plane), (b) Y dimension size (vertical plane), (c) Z dimension size (forward plane), and (d) duration. Each point on a graph represents the difference between that measure in normal signing and the condition stated on the x axis. Error bars show 95% confidence intervals of that difference.

As predicted, compared with the normal condition, shouting was larger in all three dimensions (see Figures 4 and 5). The increase in size was statistically reliable for the horizontal dimension, t (8) = −3.37, p = .01, and the forward dimension, t (8) = −19.20, p < .001, but not for the vertical dimension, t (8) = −1.86, p = .1. The increase in size was also reflected in the three-dimensional volume, t (8) = −3.76, p = .006, and in the distance covered, t (8) = −8.39, p < .001. The median location of the shouted signs was displaced to the subjects’ right compared to normal signing t (8) = −5.71, p < .001, and vertically higher, t (8) = −8.48, p < .001. Shouted signs were also performed with a greater average velocity, t (8) = −8.77, p < .001, and longer duration, t (8) = −3.51, p = .008.
Altered visual feedback: Blind signing and signing with tunnel vision
Blindfolded signing did not differ significantly from citation signing on measures of sign location, size of signing space, or sign velocity, t (8) < 2, p > .09 (see Table 1). However, blind signing had a significantly longer duration, t (8) = −5.74, p < .001, and there was a marginally significant difference in sign trajectory distance, with blind signing covering a greater distance than normal signing, t (8) = −2.85, p = .022 (a Bonferroni correction requires a p value of .0125 for significance).
Signs produced with tunnel vision were produced in a significantly smaller space within the vertical dimension, t (8) = 4.08, p = .004 (see Figures 4 and 5) and also had a longer duration than signs produced with normal vision, t (8) = −3.52, p = .008. All other measures of signing space size and location were not significantly different from citation signing, t (8) < 2, p > .1.
Adaptation to tunnel vision
To determine whether the effect of tunnel-vision goggles changed over time as subjects adapted to the altered visual input, we examined whether the difference in the vertical dimension (the Y dimension) between normal and tunnel-vision signing was greater for the production of the last sign than for the first sign. If the difference between normal and tunnel-vision signing is larger for repetitions of the last sign compared to the first sign, then it would indicate that adaptation to tunnel vision increases over a few minutes. However, the interaction between sign order and signing condition was not significant, t (8) < 2, p > .10, suggesting that adaptation to tunnel vision is immediate.
Effect of visual interference on agreeing verbs
We hypothesized that agreeing verbs might be differentially affected by tunnel vision compared to other signs because for these verbs, the signer must look at the location in space associated with the syntactic object. An analysis of the data from the vertical dimension indicated a significant interaction between sign type and condition, F (1, 8) = 5.40, p = .049. However, the change in the vertical dimension of signing space was not in the predicted direction. The agreeing verbs were less affected by tunnel vision. The mean difference between normal (M = 31.56 mm, SD = 8.03) and tunnel vision (M = 29.52 mm, SD = 77.6) for agreeing verbs was 2.0 mm, whereas the difference for other signs between normal (M = 74.05 mm, SD = 14.26) and tunnel vision (M = 62.90 mm, SD = 14.41) was 11.2 mm. As can be seen by the mean size of the vertical dimension, agreeing verbs were produced within a smaller vertical dimension than the other signs during normal signing, and therefore signers may not have needed to adjust their production much in order to adapt to the tunnel-vision goggles.
DISCUSSION
Altering visual feedback produced subtle changes in sign articulation. When their visual field was reduced to 10.5 degree visual angle by tunnel-vision goggles, participants produced signs within a smaller vertical dimension. In addition, the adjustment of signing space was immediate. These findings suggest that visual feedback plays at least some role during sign production. Following Arena et al. (Reference Arena, Finlay and Woll2007) and Emmorey et al. (in press), we hypothesize that visual feedback functions to calibrate the size of signing space with respect to where the signers’ hands appear within that space. In addition, Arena et al. (Reference Arena, Finlay and Woll2007) reported that both normally sighted signers and signers with Usher syndrome produced most of their signing outside their field of vision, although there was a clustering of hand positions at the periphery of the visual field. Thus, we suggest that the change in vertical signing space in the tunnel-vision condition does not reflect signers’ attempt to keep their hands within view.
Furthermore, these findings suggest that visual feedback for sign language is unlikely to be parsed by the comprehension system during on-line language production. Several studies have found that auditory feedback is important for detecting errors in speech production. For example, when speakers are prevented from hearing their own voices (e.g., by wearing headphones emitting loud white noise) or when speakers silently mouth words, they are less likely to detect speech errors compared to when they can hear themselves speak (Lackner & Tuller, Reference Lackner, Tuller, Cooper and Walker1979; Postma & Noordnus, Reference Postma and Noordnus1996). Although speakers may parse their own auditory feedback via the language comprehension system (Levelt, 1989), it is unlikely that visual feedback received during sign language production is robust enough to be the primary information source for a comprehension-based sign monitor. Rather, visual feedback may provide broad information about the location and movement of the signer's hands, and changes in the dimensions of signing space may reflect a general calibration procedure for signing space.
Although blind signing and citation signing were generally indistinguishable from one another, signs in the blind condition were significantly longer in duration. This finding is consistent with the increase in movement duration that occurs when visual feedback is removed during nonlinguistic reaching tasks (e.g., Berthier, Clifton, Gullapalli, McCall, & Robin, Reference Berthier, Clifton, Gullapalli, McCall and Robin1996; Churchill et al., Reference Churchill, Hopkins, Ronnqvuist and Vogt2000). Similarly, removal of auditory feedback leads to an increase in word duration for speech (e.g., Bond, Moore, & Gable, Reference Bond, Moore and Gable1989; Summers, Pisoni, Bernacki, Pedlow, & Stokes, Reference Summers, Pisoni, Bernacki, Pedlow and Stokes1988). For reaching movements, increased movement time is related to a slow down that occurs as the hand nears a target location or object (Churchill et al., Reference Churchill, Hopkins, Ronnqvuist and Vogt2000; Schetino, Adamovich, & Poizner, Reference Schettino, Adamovich and Poizner2003). For speech, increased word duration is hypothesized to improve speech intelligibility for both the speaker and for his or her interlocutor (Summers et al., Reference Summers, Pisoni, Bernacki, Pedlow and Stokes1988). Longer signs are likely to be more intelligible to a sign perceiver, but increased duration does not provide more visual information to a blindfolded signer. We hypothesize that the increase in movement time observed for both blind and tunnel-vision signing may be because of, at least in part, a larger deceleration as the hand nears the face for chin contact in the carrier phrase sign YESTERDAY. Although neither blind nor tunnel-vision signing differed significantly in overall velocity from citation signing, the means are in the expected direction. Further research is needed to determine whether the increase in movement time with reduced or no vision is, in part, due to a more prolonged deceleration phase as the hand approaches a target location, as found for nonlinguistic hand movements.
In addition, there was a trend for signs produced in the blind condition to cover a greater distance (see Table 1 and Figure 3). A possible explanation for this result is that participants increased sign duration and distance traveled in an effort to boost the proprioceptive signal received during sign production. We have suggested that signers do not rely heavily on visual feedback to monitor their sign language output. Rather, we hypothesize that signers depend more on proprioceptive feedback, and when they are blindfolded, they must rely entirely upon proprioceptive information to monitor their signing. Increasing sign duration and the distance traveled by the hand would increase the amount of proprioceptive feedback that is perceived during sign articulation.
Blind signing did not resemble “loud” signing. When they could not see their hands, participants did not produce forwardly displaced signs or signs within a larger signing space, replicating the results of Siegel et al. (Reference Siegel, Clay and Naeve1992). Thus, there does not appear to be a visual equivalent of the Lombard effect for sign language production. We hypothesize that the absence of a Lombard effect is because of the asymmetric versus symmetric nature of the output signal for sign compared to speech. For speech, increasing vocal amplitude increases comprehensibility in noise for both the speaker and the listener. In contrast, increasing the size of signing space may only increase comprehensibility in visual “noise” for sign perceivers, not for sign producers. Naeve, Siegel, and Clay (Reference Naeve, Siegel and Clay1992) found that when the perception of signing was impeded by a large screen between conversational partners, participants produced signs with a greater mean vertical distance and with greater forward motion, just as we observed for shouted signing (see Table 1 and Figure 4). Visual impedance from a screen does not impair the signer's view of his or her own hands, whereas the presence of environmental noise impairs the speaker's ability to hear his or her own voice. We suggest that poor visibility affects the sign perceiver more than the sign producer because the sign producer does not depend on the visual system to parse sign language for comprehension (unlike the perceiver). In contrast, auditory noise affects both the speaker and the listener because both depend on the auditory system to parse speech for comprehension. Thus, the presence of a Lombard effect for language production may depend on the ability to comprehend the same output signal by both the producers and the perceivers of language.
Similar to tunnel-vision signing, informal signing was produced within a reduced vertical dimension, but we suggest that the reduction occurred for a different reason. In contrast to the tunnel-vision condition, signs in the informal condition had a shorter duration than those in the citation signing condition. In addition, as can be seen in Figure 4, informal signing was shifted slightly lower compared to citation signing, whereas tunnel-vision signing was shifted slightly upward, although the differences in mean location did not reach significance. We suggest that casual, informal signing is less effortful, which is reflected by shorter sign duration, a slight lowering of signing space, and less movement within the vertical dimension.
Finally, shouting in sign language was most distinct from normal signing. Shouted signs were displaced forward and to the right, and they were produced within a larger volume of signing space, with greater velocity, greater distance traveled, and a longer duration (see Table 1). These changes in sign articulation reflect extension of the right hand and arm, which may increase sign visibility by increasing the size of the movement for signs. We predict that left-handed signers would displace sign articulation forward and to the left, reflecting the extension of their dominant hand. Enhancing the movement properties of signs is likely to improve sign perception at a distance or under poor lighting conditions, although we are unaware of any study that has directly tested this prediction.
In sum, the results indicate that signers immediately adjust the vertical dimension of signing space when vision is restricted and that blindness has no effect on the dimensions of signing space. We hypothesize that signers use visual feedback to monitor the location of the hands within signing space, rather than to monitor for errors in language output. Changes in register (informal or shouted signing) produce distinct changes in the dimensions of signing space that reflect ease of articulation (informal signing) or increase in the size of movements (shouting). Further research will help determine whether and how changes in register affect the visual perception and comprehensibility of signs, which will help clarify relationships between sign articulation and visual perception (e.g., do visual perceptual targets exist for sign language production?).
ACKNOWLEDGMENTS
This research was supported by a grant from the National Institute on Child Health and Human Development (R01 HD13249) to Karen Emmory and San Diego State University. We are particularly grateful to the Deaf signers who participated in the study.