Introduction
When we read, we move our eyes several times a second (Rayner, Reference Rayner1998, Reference Rayner2009). During these eye movements, called saccades, the eyes move quickly and visual information is suppressed (Matin, Reference Matin1974). It is therefore during pauses between saccades, called fixations, that uptake of visual information occurs. Reading in a second language is typically slower and more effortful than native (L1) reading. Eye tracking data from second language (L2) readers is consistent with this observation; in L2 readers, fixations are longer and saccades shorter, indicating less efficient, more effortful reading (Cop, Drieghe & Duyck, Reference Cop, Drieghe and Duyck2015a).
Importantly, eye movements during reading are under cognitive control, meaning that ongoing mental processing influences where the eyes look and for how long. For example, readers spend more time looking at long words (like onomatopoeia) than at short words (like cat). Readers also look longer at words that are less frequent (Ashby, Rayner & Clifton, Reference Ashby, Rayner and Clifton2005; Cop, Keuleers, Drieghe & Duyck, Reference Cop, Keuleers, Drieghe and Duyck2015b; Kliegl, Grabner, Rolfs & Engbert, Reference Kliegl, Grabner, Rolfs and Engbert2004; Rayner, Reference Rayner1998, Reference Rayner2009). Word predictability influences eye movements in a similar way (Luke & Christianson, Reference Luke and Christianson2016; Staub, Reference Staub2015). Sentence and discourse-level factors also influence eye movements (Christianson & Luke, Reference Christianson and Luke2011; Luke, Henderson & Ferreira, Reference Luke, Henderson and Ferreira2015; Perfetti, Goldman & Hogaboam, Reference Perfetti, Goldman and Hogaboam1979; Van Berkum, Brown, Zwitserlood, Kooijman & Hagoort, Reference Van Berkum, Brown, Zwitserlood, Kooijman and Hagoort2005). Thus, eye movements are influenced by low-level visual and orthographic processing, word identification, and sentence- and discourse-level semantic integration. Changes in eye movements can therefore arise from different stages in the reading process.
This means longer fixations in L2 reading can be attributed to cognitive processing difficulty. However, this difficulty could arise during early-stage processes such as visual/orthographic processing or later, during word-, sentence- and discourse-level processing. That is, when an individual reads in a second language, they can encounter difficulty at either the early stages, which reflect perceptual processing and initial word recognition, or the later stages, which involve semantic, morpho-syntactic, and discourse processing, or both. As an example of early-stage difficulty, L2 readers have less experience with the written form of their second language, and so will likely be slower to recognize symbols and characters that they have not seen as often as a native reader has. As an example of difficulty at the later stage, L2 readers may recognize the letters in a word easily but not be able to match the word to a meaning, or they may recognize a word but have difficulty understanding its use in context. Thus, showing that L2 readers are slower than L1 readers is, by itself, not informative about why L2 readers are slower.
The challenge of comparing reading in different orthographies
How the eyes move when reading is determined by properties of the language and of the reader. These include properties of the written language, such as the compactness of the writing system. That is, when readers move their eyes differently in their L2 compared to their L1, some of this difference is, of course, due to their status as L2 readers, but some of it can be attributed to changes in the writing system. Liversedge, Drieghe, Li, Yan, Bai, and Hyönä (Reference Liversedge, Drieghe, Li, Yan, Bai and Hyönä2016) compared eye movements across three languages with significantly different writing systems: Finnish, English and Chinese. These written languages differ in the density of visual information; Liversedge et al. (Reference Liversedge, Drieghe, Li, Yan, Bai and Hyönä2016) found that a Chinese word consists of one or two characters, while the equivalent Finnish word is on average 8–9 characters, with English falling in between. Further, Chinese is an orthographically deep language, in that there are few consistent relationships between the written form and the spoken sounds, while Finnish is orthographically shallow, with a given letter almost always representing a given sound. Again, English falls between these two. Liversedge et al. (Reference Liversedge, Drieghe, Li, Yan, Bai and Hyönä2016) found that these cross-linguistic differences led to significant differences in eye movements during reading, with readers making the longest fixations and shortest saccades in the dense, orthographically deep language of Chinese, and shortest fixations and longest saccades in the least dense, least orthographically deep language of Finnish.
The findings of Liversedge et al. (Reference Liversedge, Drieghe, Li, Yan, Bai and Hyönä2016) show that when an English speaker reads in their L2 of Chinese or Finnish, some change in eye movements is expected, even required, by the nature of the writing system. This means that it can be difficult to dissociate reading differences arising from orthographic differences across languages from differences arising from proficiency differences between readers (L1 vs. L2). One method for controlling for the effect of orthography is to carefully control the stimuli, matching them across different languages. However, Liversedge et al. (Reference Liversedge, Drieghe, Li, Yan, Bai and Hyönä2016) describe this process as “quite painstaking” (p. 10), meaning that it may not be feasible in many cases. Further, even when the sentences were parallel across languages, the individual eye movements were still significantly different across orthographies at the word level. Research exploring L2 reading behavior is thus complicated by the fact that orthography is often a confounding variable in studies of bilingualism; L2 readers are not just reading in a different language, but also often in a different orthography, and it is not clear how much of the difficulty of L2 reading arises from language and how much from orthographic distance. Thus, in order to zero in on the sources of L2 reading difficulty, it is essential to dissociate these two influences.
Analysis of fixation duration distributions
One way to try to compare reading in different orthographies is to look at global eye movement behaviors. That is, rather than focusing on word-level variables, the analyses could focus on measures that are more agnostic about what the reader is looking at in a given moment. One such measure is fixation duration. This measure, which simply reflects the amount of time the eyes pause between movements to take in visual information, can be used to compare different types of reading, or even to compare reading with other eye movement tasks (Carter & Luke, Reference Carter and Luke2020; Henderson & Luke, Reference Henderson and Luke2014; Luke & Henderson, Reference Luke and Henderson2016).
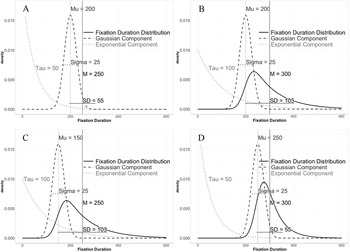
While it is possible to analyze fixation durations directly, it is often more informative to examine properties of the distribution of fixation durations. There is now a large body of literature examining fixation duration distributions during reading and other oculomotor tasks (Carter & Luke, Reference Carter and Luke2018; Guy, Lancry-Dayan & Pertzov, Reference Guy, Lancry-Dayan and Pertzov2020; Luke & Henderson, Reference Luke and Henderson2013, Reference Luke and Henderson2016; Luke, Nuthmann & Henderson, Reference Luke, Nuthmann and Henderson2013; Luke, Smith, Schmidt & Henderson, Reference Luke, Smith, Schmidt and Henderson2014; Luke et al., Reference Luke, Henderson and Ferreira2015; Luke, Darowski & Gale, Reference Luke, Darowski and Gale2018; Reingold, Reichle, Glaholt & Sheridan, Reference Reingold, Reichle, Glaholt and Sheridan2012; Sheridan, Rayner & Reingold, Reference Sheridan, Rayner and Reingold2013; Sheridan & Reingold, Reference Sheridan and Reingold2012; Staub & Benatar, Reference Staub and Benatar2013; Staub, White, Drieghe, Hollway & Rayner, Reference Staub, White, Drieghe, Hollway and Rayner2010; White & Staub, Reference White and Staub2012). This literature shows that the distribution of fixation durations is highly skewed, with most fixations being between 200–300ms but with many that are significantly longer. Figure 1 illustrates this skewness with several example fixation duration distributions. As Figure 1 shows, the overall mean fixation duration (solid vertical line) is influenced both by the location of the peak of the distribution (dashed vertical line) and by the skewness (dotted line), which indicates the proportion of longer fixations; mean fixation duration can increase if all the fixations were made longer or if only some were made longer. For this reason, it often proves useful in eye-tracking studies to divide the distribution into a normal (Gaussian) part that represents the center of the distribution and an exponential part that captures the skewness, rather than relying on the mean. Representing a fixation duration distribution in this way yields three parameters: MuFootnote 1, the center of the normal part of the distribution; Sigma, the standard deviation of the normal part; and Tau, the parameter that represents the exponential part of the ex-Gaussian distribution and thus captures the skewness of the distribution. Mu and Tau are usually independent of each other (Staub & Benatar, Reference Staub and Benatar2013).
Four example fixation duration distributions. The black lines represent the distribution of fixation durations. The dark gray dashed lines represent the Gaussian (normal) component of the distribution. The light gray dotted lines represent the exponential component of the distribution. This figure illustrates how changes in mean fixation durations can occur because of changes in Mu (the center of the distribution) or Tau (the tail of the distribution) or both (Compare panel A to panels B and D). Further, two different distributions can have the same mean (Compare panel A to panel C and panel B to panel D).

Changes in Mu usually indicate an early-arising effect, where the center of the fixation duration distribution is shifted. In other words, if a manipulation causes a slow-down early in the process of reading a word, most or all fixations will be lengthened by the manipulation. The literature bears this out: the Mu parameter is consistently associated with early perceptual stages of processing. For example, when the visual quality of the stimulus is reduced, Mu increases (Glaholt, Rayner & Reingold, Reference Glaholt, Rayner and Reingold2013; Luke et al., Reference Luke, Nuthmann and Henderson2013; Walshe & Nuthmann, Reference Walshe and Nuthmann2014; White & Staub, Reference White and Staub2012). When the eyes land in a non-optimal position on a word, making it more difficult to see the entire word, Mu also increases (Reingold et al., Reference Reingold, Reichle, Glaholt and Sheridan2012). As further support of this, Henderson, Choi, and Luke (Reference Henderson, Choi and Luke2014) observed that individual differences in Mu in a (L1) reading task were correlated with differences in the structural anatomy of the primary visual cortex, where early visual processing occurs.
The Tau parameter, on the other hand, is generally associated with later stages of processing; changes in Tau indicate a later-arising effect. In other words, if some manipulation causes disruption that occurs later in the process of reading a word, many fixations will already have ended so only a subset of fixations will be affected by this manipulation. For example, Tau increases when it becomes difficult to integrate some stimulus into the overall representation stored in working memory (Glaholt et al., Reference Glaholt, Rayner and Reingold2013; Walshe & Nuthmann, Reference Walshe and Nuthmann2014). When individuals encounter clause boundaries during reading, they slow down in order to integrate what they have read into their overall mental representations (Just & Carpenter, Reference Just and Carpenter1980; Luke et al., Reference Luke, Henderson and Ferreira2015; Rayner, Kambe & Duffy, Reference Rayner, Kambe and Duffy2000). These clause ‘wrap-up effects’ also manifest as changes in Tau (Payne & Stine-Morrow, Reference Payne and Stine-Morrow2014). While Mu is associated with early, perceptual processes, the Tau parameter is associated with higher-level cognitive processes, specifically working memory (Luke et al., Reference Luke, Darowski and Gale2018; McVay & Kane, Reference McVay and Kane2012; Schmiedek, Oberauer, Wilhelm, Süß & Wittmann, Reference Schmiedek, Oberauer, Wilhelm, Süß and Wittmann2007; Tse, Balota, Yap, Duchek & McCabe, Reference Tse, Balota, Yap, Duchek and McCabe2010; Unsworth, Redick, Lakey & Young, Reference Unsworth, Redick, Lakey and Young2010). Furthermore, Tau is correlated with reading-related activity in frontal and parietal regions associated with attentional control, rather than occipital regions associated with perceptual processing (Henderson, Choi, Luke & Schmidt, Reference Henderson, Choi, Luke and Schmidt2018).
Taken together, these results suggest that when Mu increases, this reflects increased processing difficulty at an early, perceptual stage of reading; factors that affect Mu in reading are likely influencing early orthographic processing. By contrast, increases in Tau likely reflect lexical/post-lexical processing, as readers attempt to integrate stimuli into their overall mental representation; factors that affect Tau are altering a later, linguistic stage of processing. The studies presented here examine L2 reading using distributional (ex-Gaussian) analyses to attempt to determine which stage of language processing (early-stage or later-stage) presents the most difficulty for L2 readers.
Thus, there is converging evidence that, at least with regard to fixation duration distributions, changes in Mu reflect early arising effects that are perceptual/orthographic in nature, while changes in Tau reflect later-arising meaning-related processing. It is important to note, however, that caution is necessary when assigning the ex-Gaussian parameters to particular cognitive processes or stages of processing (Fitousi, Reference Fitousi2020; Matzke & Wagenmakers, Reference Matzke and Wagenmakers2009; Rieger & Miller, Reference Rieger and Miller2020). For this reason, Study 1 includes specific manipulations to further test the idea that Mu is associated with orthographic processing and Tau with semantic processing. Even so, conclusions about which cognitive processes are associated with these parameters are made tentatively, as are statements about which stage of processing is involved.
The present paper
The present paper reports three studies. These studies examine the source of L2 reading difficulty, separating orthographic/early and linguistic/later difficulty. The reported studies accomplish this in two major ways. First, we analyzed L2 reading behaviors using ex-Gaussian analyses of the fixation duration distribution. The components of the fixation duration distribution are stable over time (Carter & Luke, Reference Carter and Luke2018) and are influenced by global, rather than local, properties of the text, meaning that they are less influenced by differences in text content. This makes the ex-Gaussian analysis ideal for comparing reading of different texts and reading in different orthographies. As discussed above, the components of the ex-Gaussian distribution can also help dissociate early and late arising effects.
Second, in each study two groups of bilingual readers were recruited. In Studies 1 and 2, the first group consisted of native speakers of English that were L2 learners of Mandarin Chinese, while the second group consisted of native speakers of Mandarin Chinese who were L2 learners of English. In Study 3 the groups were English–Portuguese and Portuguese–English bilinguals. Both groups read paragraphs in both languages. This allowed us to explore the interaction of text language and reader language in a crossed 2×2 design. The interaction will reveal any relative change in Mu, Sigma, or Tau for L2 readers, independent of any change arising from cross-language differences in orthography.
Of primary interest in the present study is how reading in a second language influences the fixation duration distribution. It is expected, based on the existing literature, that L2 readers will have longer fixations (Cop et al., Reference Cop, Drieghe and Duyck2015a). What is not known is whether this difference is a result of changes in Mu or in Tau. If L2 readers have larger Mu than the native readers, this will suggest that L2 readers experience difficulty in the pre-lexical, perceptual stage of reading (i.e., orthographic processing, the recognition of letters and characters and their formation into word units). If L2 readers have larger Tau than native readers, this will suggest that they encounter difficulty interpreting words and sentences (i.e., understanding words and integrating them into the overall passage).
Study 1
Study 1 had two goals. The primary goal was to examine the fixation duration distributions of L2 readers in order to identify the source of slower L2 reading. If L2 readers show an increase in Mu, this will suggest early-stage orthographic difficulty, i.e., difficulty with word decoding. If L2 readers show an increase in Tau, it will point to difficulty with syntactic and/or semantic processing, i.e., accessing word or sentence meaning. It is of course possible that L2 readers experience both types of difficulty.
A secondary, but still important, goal was to verify the interpretation of the ex-Gaussian parameters. As noted in the introduction, changes in Mu are thought to reflect early stages of processing and have been shown to be associated with visual processing of stimuli. In Study 1, we selected two languages that are orthographically distant: Chinese and English. Eye movements differ significantly in native Chinese reading compared to native English reading: fixations are longer and saccades shorter (Liversedge et al., Reference Liversedge, Drieghe, Li, Yan, Bai and Hyönä2016; Liversedge, Hyönä & Rayner, Reference Liversedge, Hyönä and Rayner2013; Yang & McConkie, Reference Yang and McConkie1999). We therefore expect that the increased visual complexity and density of Chinese characters compared to English letters should require increased early visual processing effort in L1 Chinese reading compared to L1 English reading, which will most likely show up as a larger Mu parameter in Chinese reading.
Changes in Tau, on the other hand, are thought to reflect late-arising, meaning-driven processes. The simplest way to create linguistic processing difficulty is to remove the meaning altogether. A significant body of research exists examining pseudo-reading, which is reading-like behavior that occurs when the semantic content of text is removed. In this paradigm, letters are replaced by Zs or block shapes so that the overall visual structure of the text is preserved but no meaning can be extracted. This research is relevant to L2 reading because it represents a worst-case-scenario in which a reader has no proficiency in a language, as when an English monolingual looks at a Chinese text. Research in pseudo-reading has consistently found that fixations are longer when there is no meaning to be acquired from text (Luke & Henderson, Reference Luke and Henderson2013, Reference Luke and Henderson2016; Nuthmann & Engbert, Reference Nuthmann and Engbert2009; Rayner & Fischer, Reference Rayner and Fischer1996; Vitu, O'Regan, Inhoff & Topolski, Reference Vitu, O'Regan, Inhoff and Topolski1995). It is important to note that this difference appears to be driven by a subset of fixations, which are lengthened in response to the removal of semantic information from a stimulus (Luke & Henderson, Reference Luke and Henderson2013, Reference Luke and Henderson2016). In other words, when reading something that is visually interpretable but difficult or impossible to understand, Tau increases. This appears to be related to difficulty with stimulus identification (i.e., the extraction of meaning from a stimulus), as this change also occurs in visual scenes when the scene is more difficult to process (Glaholt et al., Reference Glaholt, Rayner and Reingold2013; Luke & Henderson, Reference Luke and Henderson2016; Walshe & Nuthmann, Reference Walshe and Nuthmann2014). To our knowledge, the pseudo-reading technique has not been employed in Chinese, but it seems likely that Tau will increase during ‘Chinese’ pseudo-reading just as it does in ‘English’ pseudo-reading.
Based on this literature, several hypotheses can be put forward about how these different manipulations will affect Mu and Tau. With regard to text language, it is expected that readers of Chinese will make shorter saccades and longer fixations (Liversedge et al., Reference Liversedge, Drieghe, Li, Yan, Bai and Hyönä2016). The longer fixations in Chinese likely arise because Chinese is more visually dense than English. In other words, the difference between Chinese and English orthography should have an early-arising influence on the L1 reading process, and so should manifest as a difference in Mu. With regard to task, it is expected that fixations will be longer overall in the pseudo-reading task (Luke & Henderson, Reference Luke and Henderson2013, Reference Luke and Henderson2016; Rayner & Fischer, Reference Rayner and Fischer1996; Vitu et al., Reference Vitu, O'Regan, Inhoff and Topolski1995). However, pseudo-reading is not a perceptually difficult task, as the pseudo-letters and pseudo-characters are visually simple. Instead, in pseudo-reading the difficulty is in linguistic identification and integration, which is impossible in pseudo-reading. Thus, the difference in fixation durations between reading and pseudo-reading should be observed primarily in Tau, as previous research has shown (Luke & Henderson, Reference Luke and Henderson2013, Reference Luke and Henderson2016).
Methods
Participants
Forty-three participants from the Brigham Young University community completed the experiment. All participants had 20/20 corrected or uncorrected vision. Twenty-two participants (11 males) were native English speakers who speak Chinese (Mandarin) as a second language. The other 21 participants (1 male) were native Chinese speakers who speak English as a second language. Four participants did not follow instructions, and their data were discarded, leaving 17. Each participant completed a Leap-Q questionnaire (Marian, Blumenfeld & Kaushanskaya, Reference Marian, Blumenfeld and Kaushanskaya2007) and the LexTale English proficiency task (Lemhöfer & Broersma, Reference Lemhöfer and Broersma2012). See Supplementary Material (Supplementary Materials) for demographic and proficiency information about the participants.
Materials
Thirty short English paragraphs (40–60 words) were selected. These texts represented a range of difficulties including novice, intermediate and advanced according to the ACTFL proficiency guidelines (Clifford & Cox, Reference Clifford and Cox2013). For each English text a Chinese version was created by a native speaker of Mandarin Chinese. Novice passages were translated from English, although some changes were made so that the content would reflect Chinese society and culture and would seem genuine to native Chinese speakers. For more complex passages (intermediate and advanced), authentic materials from Chinese publications (news and editorials) were selected that covered topics similar to the original English paragraphs. Thus, while the content of the English and Chinese versions of each passage was not identical, they were similar in topic and in difficulty. For each English text, spaces between words were used to define interest areas around each word. In Chinese, there are no spaces between words, so word boundaries were defined using the Stanford Word Segmenter, version 3.5.2 (Chang, Galley & Manning, Reference Chang, Galley and Manning2008). These boundaries were checked by a native speaker.
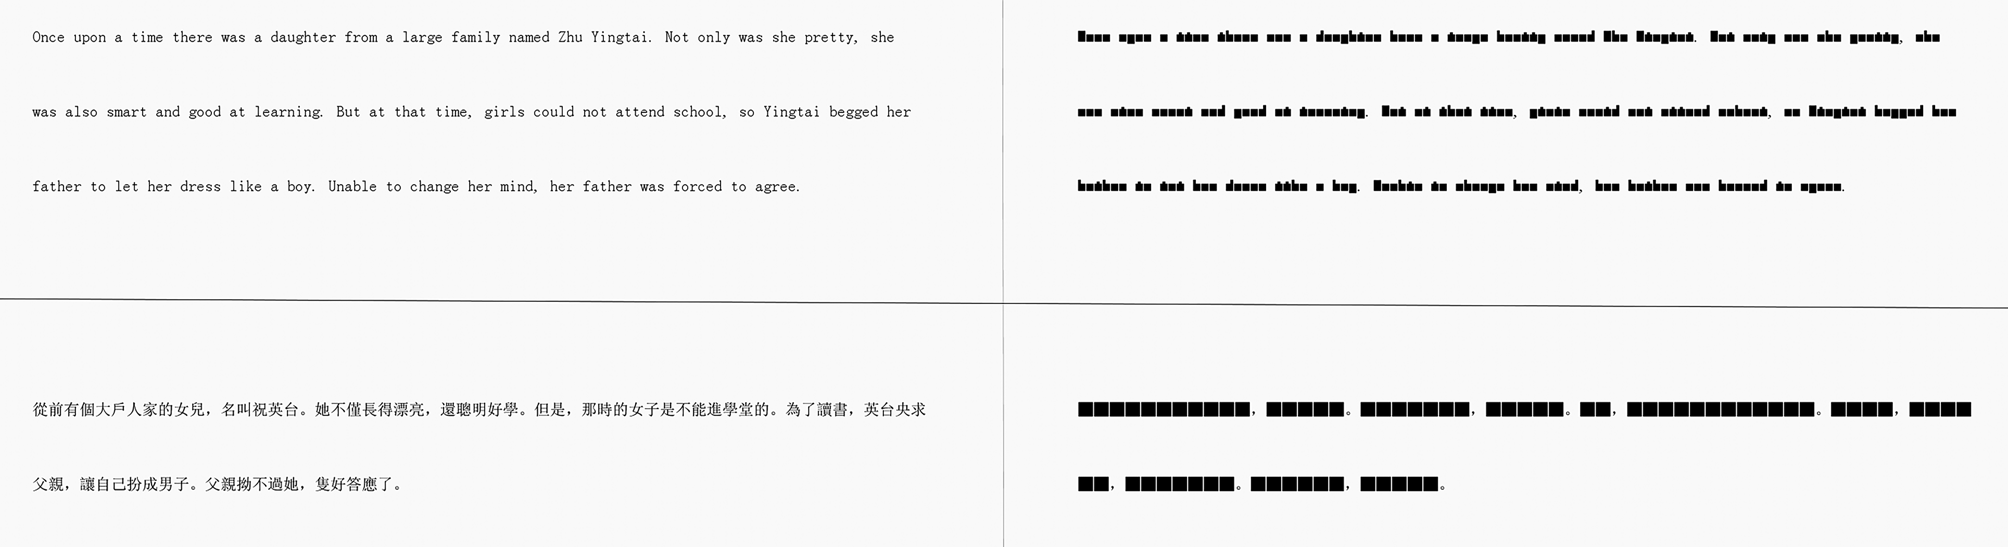
For each text (both Chinese and English versions), a pseudo-reading version was created by replacing letters and characters with block shapes. Examples of the four variants of a text (English, Chinese, pseudo-English, pseudo-Chinese) can be seen in Figure 2. The different versions were counterbalanced across different list conditions, so that each participant saw only two versions of each text (either English and pseudo-Chinese or Chinese and pseudo-English). This manipulation created a 2 (Text Language: Chinese or English) X 2 (Task: Normal Reading or Pseudo-Reading) within-subjects design. The different participant groups added an additional within-language variable, Reader (Native vs. L2).
Example texts in each of the four conditions: English Text (top left), English Pseudo-Text (top right), Chinese Text (bottom left) and Chinese Pseudo-Text (bottom right).

Apparatus
Eye movements were recorded via an SR Research Eyelink 1000 plus eye tracker (spatial resolution of 0.01°) sampling at 1000 Hz. Subjects were seated 60 cm away from a 24” LCD monitor with display resolution set to 1600 x 900 (refresh rate 120 Hz). Chinese and English texts and pseudo-texts were displayed using a customized font based on NSimSum, 16 point, so that approximately 3 English letters or 2 Chinese characters subtended 1° of visual angle. Head movements were minimized with a chin and head rest. Although viewing was binocular, eye movements were recorded from the right eye. The experiment was controlled with SR Research Experiment Builder software.
Procedure
Participants completed a 9-point calibration procedure at the start and half-way through the experiment. Participants were told that they would be reading short paragraphs on a computer screen while their eye movements were recorded. After completing 4 practice trials (1 for each condition), the experiment began. Each trial involved the following sequence. The trial began with a gaze trigger, a black circle presented in the position of the first character in the text. Once a stable fixation was detected on the gaze trigger, the text was presented. The participant read the text and pressed a button when finished. Then a new gaze trigger appeared, and the next trial began. Passages were blocked by language, so that each participant saw all the English texts (and pseudo-texts) together and all the Chinese texts (and pseudo-texts) together, with a break in between. The order of presentation of these language blocks was randomized for each participant. Within each block, order of stimulus presentation was randomized for each subject. The entire session lasted approximately 60 minutes.
Results
Five dependent variables were analyzed. The first was saccade amplitude. Prior to analysis, all leftward saccades were excluded, as were all saccades greater than 22 degrees of visual angle and saccades that occurred during blinks. The second was fixation duration. Prior to analysis, fixations that preceded or followed blinks and extremely short (< 50 ms) or long fixations (> 1200 ms) were removed from the data. After cleaning, there were 160584 saccades and 107739 fixations remaining in the data, for an average of 626 fixations per participant per cell (language x task).
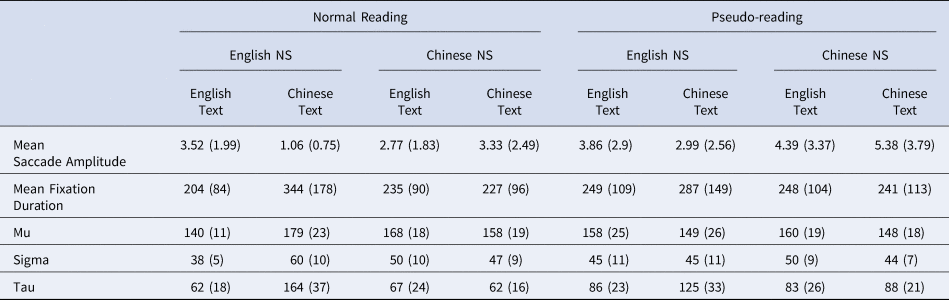
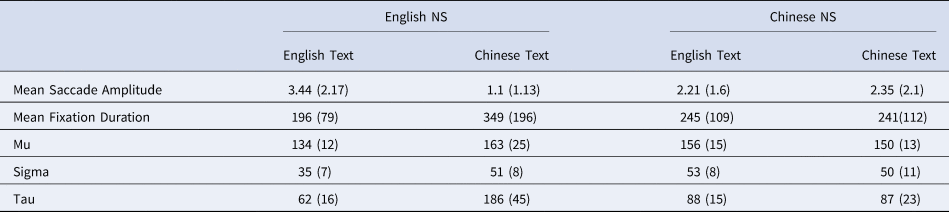
The other three variables were the three components of the ex-Gaussian distribution (Mu, Sigma, Tau). The ex-Gaussian distribution was fitted to the data from each participant in each text language in each task using the timefit functions (1000 iterations) from the retimes package (Massidda & Massidda, Reference Massidda and Massidda2013) in R (R Core Team, 2020). Descriptive statistics can be found in Table 1.
Descriptive Statistics for Global Eye Movement Variables in Study 1

Note. NS = Native Speaker
Each variable was analyzed using linear mixed effects models (lme4 package; Bates, Mächler, Bolker & Walker, Reference Bates, Mächler, Bolker and Walker2015) in R (R Core Team, 2020). P-values were obtained using the lmerTest package (Kuznetsova, Brockhoff & Christensen, Reference Kuznetsova, Brockhoff and Christensen2017; see Luke, Reference Luke2017 for a justification of this approach). All models contained three fixed effects: Text Language (Chinese or English), Task (Normal or Pseudo-reading) and Reader (Native or L2 reader). As the statistical interactions are of primary theoretical interest in the present study, all possible interactions between these variables were included in every model. All predictor variables were dummy coded, with Chinese, Normal Reading, and Native Readers as the comparison groups, respectively. In the following sections, we discuss these fixed effects separately, even though they were all modeled together. All models had random by-participant intercepts and by-participant slopes for Task and Reader. Model outputs and additional figures can be found in Supplementary Material (Supplementary Materials).
Chinese vs. English
Previous research contrasting eye movements when reading Chinese and English observed shorter saccades and longer fixations in Chinese. To confirm this, we compared saccade amplitudes of participants reading in their native language of Chinese or English. Numerically, saccades were shorter in Chinese (see Table 1). However, this effect was not statistically significant. This was the case because Chinese readers made many more short saccades than English readers, but also more long ones (see figure in Supplemental Material).
As expected, fixation durations were numerically and statistically longer in Chinese than in English reading. Analyses of the ex-Gaussian components of the fixation duration distribution confirm expectations that Chinese and English reading fixations differ in Mu and Sigma, the components that represent the center of the distribution, and not in Tau, the component that represents the exponential tail of the distribution. In other words, the majority of fixations are longer in Chinese reading than in English reading. As noted above, this difference indicates that the longer fixations observed in Chinese reading most likely arise from the greater visual/orthographic complexity of Chinese characters.
Normal reading vs. pseudo-reading
Saccade amplitudes were larger in pseudo-reading than normal reading, and this increase was much greater in Chinese readers (see Table 1). This is likely because Chinese does not have spaces between words, and when meaning is removed from text, word segmentation cannot occur and the line becomes a single visual unit. In English, word boundaries are retained in pseudo-reading, and so the increase in saccade amplitude is less.
In English, fixation durations in pseudo-reading are typically longer (Nuthmann & Engbert, Reference Nuthmann and Engbert2009; Rayner & Fischer, Reference Rayner and Fischer1996; Vitu et al., Reference Vitu, O'Regan, Inhoff and Topolski1995), and this is primarily the result of an increase in Tau, the tail of the distribution (Luke & Henderson, Reference Luke and Henderson2013, Reference Luke and Henderson2016). This is exactly what was observed here. Fixation durations were longer in pseudo-reading (see Table 1). Mu and Sigma were not significantly different in pseudo-reading than in normal reading, and the difference between Chinese and English in Mu and Sigma disappeared during pseudo-reading. There was a significant increase in Tau during pseudo-reading (24 ms), and this effect was the same magnitude across languages (i.e., there was no significant interaction with Text Language). In sum, Tau appears to be the parameter that best reflects the extraction of meaning from the stimulus, with increased Tau reflecting increased difficulty with meaning extraction.
Native vs. L2 readers
As Table 1 shows, L2 readers consistently made shorter saccades than native readers. This was true for both the English and Chinese texts, although L2 readers of Chinese shortened their saccades much more than L2 readers of English. L2 readers also had consistently longer fixations, as expected.
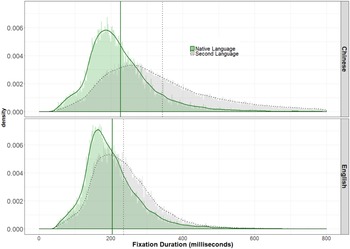
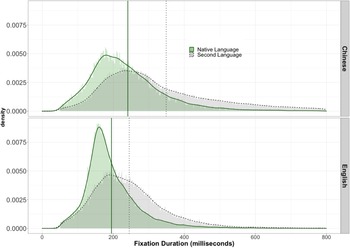
Mu and Sigma increased when reading in L2 (see Figure 3). This increase (of about 26 ms for Mu) was statistically equal in magnitude across languages (i.e., L2 status did not interact with text language). This indicates that the effects of Text Language and of Reader on Mu and Sigma were additive. In other words, reading Chinese text increases Mu and Sigma compared to English, and L2 reading also (separately) increases Mu and Sigma. The effect of Reader was not present for pseudo-reading, where no orthographic processing difficulty would be expected (i.e., there was a significant interaction with reading task, indicating that the differences between Native and L2 readers disappeared in pseudo-reading). These results indicate that the L2 readers in Study 1, regardless of language, were less efficient in their orthographic processing.
Distribution of fixation durations in Study 1 for reading in a native language (green, solid lines) versus reading in a second language (gray, dotted lines). Distributions in the top panel are from reading Chinese text, while the distributions in the bottom panel are from reading English text. The vertical lines represent the mean fixation durations for each group. Histogram bin width was 2 ms.

Tau increased significantly when English speakers read Chinese text but not when Chinese readers read English text. The same pattern was present, but weaker, for pseudo-reading. Thus, this increase suggests that L2 learners of Chinese had difficulty with linguistic processing. One obvious difference between English and Chinese is that Chinese words are not separated by spaces. Thus, native English speakers reading in Chinese might have encountered difficulty with word segmentation that L2 readers of English did not. This word segmentation difficulty when reading L2 Chinese would have occasionally disrupted word recognition and integration, leading to an increase in Tau. Or it is possible that the L2 readers are more likely to encounter wholly unfamiliar characters in Chinese reading, leading to a disruption of both eye movements and comprehension that show up in Tau. Disentangling the possible sources of this Tau increase would require direct manipulation of the Chinese text.
Discussion
The results of Study 1 suggest that the deeper, denser orthography of Chinese resulted in shifts in the Mu and Sigma components of the fixation duration distribution. In other words, most or all fixations became longer when the written language was denser and therefore harder to interpret visually, which is consistent with previous studies: grapho-morphological knowledge has been found to play a predictive role in both L1 and L2 Chinese reading comprehension (Chen, Ke & Koda, Reference Chen, Ke and Koda2021; Zhang, Reference Zhang2017; Zhang, Zhang, Li & Zhang, Reference Zhang, Zhang, Li and Zhang2021). In Chinese lower-level word recognition, readers not only need to decode the Chinese characters with cues such as semantic radicals and phonetic components, but also have to deal with word segmentation by deciding the boundary of words due to the absence of space between words. Word segmentation is a complex process involving lower-level and higher-level processing as readers need to figure out whether a character is used as an independent word or a morpheme in a multisyllabic compound word, form-wise and semantic-wise.
Tau increased when reading pseudo-text, regardless of language. That is, removing semantic meaning increased the duration of some but not all fixations. When reading in a second language, Mu and Sigma were longer, and this was true across both languages. This suggests that second language readers in Study 1 were slower primarily because of difficulties with orthographic processing. Because English and Chinese are orthographically distant, this early-stage difficulty makes sense.
What is surprising is that no overall increase in Tau was observed for L2 readers. At first glance, this might suggest that L2 readers do not experience increased linguistic difficulty compared to native readers. However, there are good reasons, including common sense, to doubt this. In Study 1, participants were not forced to read for comprehension; there were no comprehension questions. Further, the presence of the pseudo-reading condition, in which no comprehension was possible, might have further dissuaded participants from reading for comprehension. In a situation where comprehension was more necessary, an overall increase in Tau for L2 readers might emerge.
Tau did increase selectively for English speakers reading Chinese. This shift in Tau suggests that L2 Chinese readers had unique difficulty with lexical access. The most probable cause is the lack of visual word segmentation cues in Chinese. The absence of word spacing was found to significantly affect Chinese reading in previous eye-tracking studies on early-age Chinese children (Li, Zhang & Ding, Reference Li, Zhang and Ding2021) and L2 Chinese learners (Chen et al., Reference Chen, Ke and Koda2021; Shen & Jiang, Reference Shen and Jiang2013). Word segmentation is crucial for readers to derive word meaning in Chinese reading. A character's meaning can shift dramatically when it is an independent word and when it is a morpheme in various multisyllabic words (e.g., 好 hǎo ‘good’, 好像 hǎoxiàng ‘seem like’, 好奇 hàoqí ‘curious’). Allophones are also common in Chinese, so that different words with different pronunciation can share one character (e.g., 还, hái ‘still’, huán ‘to return’). While word segmentation difficulty is a likely cause of this increase in Tau, it is also possible that L2 Chinese readers were simply more likely to encounter characters and words that they did not know, leading to increases in Tau. There may be other possibilities as well.
Study 2
In Study 2, we attempted to replicate Study 1 with a different sample and different materials. An additional change in Study 2 is the removal of the pseudo-reading condition. While this condition was valuable for establishing how linguistic difficulty influences the distribution of fixation durations, it also served to make the reading task less natural and may have influenced reading behavior and task attentiveness. Instead, in Study 2 participants read for comprehension – each text was followed by a multiple-choice comprehension question. The procedure was otherwise similar to Study 1.
Method
Participants
Forty-two participants from the Brigham Young University community completed the experiment. All participants had 20/20 corrected or uncorrected vision. Twenty-seven participants (19 males) were native English speakers who speak Chinese as a second language. The other 15 participants (5 males) were native Chinese speakers learning English as a second language. Each participant completed a Leap-Q questionnaire (Marian et al., Reference Marian, Blumenfeld and Kaushanskaya2007) and a computerized L2 reading proficiency task (Clifford & Cox, Reference Clifford and Cox2013). See Supplementary Material (Supplementary Materials) for demographic and proficiency information about the participants.
Materials
Prior to coming into the lab, participants took a Reading Proficiency Test in their second language (Chinese or English). These computer adapted tests were developed by the Center for Language Studies at Brigham Young University and took about an hour for participants to complete. In the test, the students read a passage in their L2, which was presented on the left side of the screen, side-by-side with a five-option multiple-choice question presented on the right of the screen in English.
For the eye-tracking portion of the experiment, 34 reading passages were chosen: 17 in English; and 17 that were translations of English passages made by a native Chinese speaker (except Superior texts, which were language-specific). They reflected three levels of text difficulty: Intermediate, Advanced, and Superior (American Council on the Teaching of Foreign Languages (ACTFL) Proficiency Guidelines, 2012). Intermediate passages included advertisements, announcements, signs and notes. Advanced passages included tutorial instructions. Superior passages included texts of political and economic nature. There were 12 reading passages at the Intermediate level in each language, and the word count for each ranged from 50 to 70 English words (for the Chinese texts, this is the number of words before translation). At the Advanced level, there were four reading passages in each language, with word count ranging from 150 to 180 English words. There was one Superior-level reading passage in each language and its word count average was about 600 English words. These reading passages were divided to be as equal as possible at total word count among the three levels (600 words per level). Each reading passage was immediately followed by one multiple-choice comprehension question on a separate screen. The question had five possible options, with three distractors, one correct answer, and “I don't know” as the last option.
Apparatus
The apparatus was the same as Study 1.
Procedure
Data collection process of the present study was divided in three steps: Pre-Visit Intake, Proficiency Testing, and Eye-Tracking. In the Pre-Visit Intake, participants answered an online Qualtrics Screening Survey, which asked for demographic information and questions related to participants’ language background. Participants also completed an electronic consent form for this data. Additionally, the screening survey asked for information about participants’ vision. Participants then took the Reading Proficiency Exam in their L2. After taking the tests, participants were brought to the eye-tracking lab.
During the eye-tracking portion of the study, the procedure was the same as in Study 1, except that participants read two practice texts at the beginning of each language block, some of the texts were divided across multiple screens, and once the text was fully presented, a five-option multiple-choice comprehension question appeared, which participants responded to by clicking with the mouse. The entire session lasted approximately 60 minutes.
Results
The same five dependent variables were analyzed as in Study 1: saccade amplitude, fixation duration, Mu, Sigma, and Tau. Data cleaning and distribution fitting occurred in the manner described in Study 1. After cleaning, there were 133,329 saccades and 201,452 fixations remaining in the data, for an average of 2,398 per participant per language. Descriptive statistics can be found in Table 2. The models fitted in Study 2 contained only 2 fixed effects: Text Language (Chinese or English) and Reader (Native or L2 reader). The interaction between these variables was included in every model. As before, we discuss these fixed effects separately, even though they were modeled together. All models had random by-participant intercepts and by-participant slopes for Reader. Model outputs and additional figures can be found in Supplementary Material (Supplementary Materials).
Descriptive Statistics for Global Eye Movement Variables in Study 2

Note. NS = Native Speaker
Chinese vs. English
In Study 2, saccades were significantly longer in English reading than in Chinese reading. As in Study 1, fixation durations were numerically longer in Chinese than in English reading (see Table 2).
Analyses of the ex-Gaussian components of the fixation duration distribution confirm the findings of Study 1 that Chinese and English reading fixations differ in Mu and Sigma. However, in Study 2, Chinese and English also differed in Tau, with Tau being smaller in English than in Chinese.
Native vs. L2 readers
Saccades were longer in L2 reading, consistent with Study 1. The absence of a significant interaction between Text Language and Reader in Study 2 contrasts with Study 1 and suggests that the presence of the pseudo-reading condition in Study 1 might have influenced saccade amplitudes more globally. In Study 2, the influence of Text Language and of Reader on saccade amplitude was additive. Fixation durations were longer in L2 reading, but a significant interaction with Language indicates that this difference was somewhat smaller in English L2 reading than it was in Chinese L2 reading.
The distribution of fixation durations is shown in Figure 4. In Study 1, L2 readers had a larger Mu overall. The same is true in Study 2. In Study 1, the increase in Mu was identical across text languages (i.e., there was no interaction), and this is exactly what was observed in Study 2, although the increase was numerically smaller (13 ms vs. 26 ms in Study 1). Thus, Study 2 replicates the finding from Study 1 that the effects of Text Language and of Reader on Mu are additive. In other words, reading Chinese text increases Mu compared to English, and L2 reading also (separately) increases Mu.
Distribution of fixation durations for reading in a native language (green, solid lines) versus reading in a second language (gray, dotted lines) in Study 2. Distributions in the top panel are from reading Chinese text, while the distributions in the bottom panel are from reading English text. The vertical lines represent the mean fixation durations for each group. Histogram bin width was 2 ms.

In contrast to Study 1, where a significant increase in Sigma was observed for all L2 readers, in Study 2 a significant interaction of Text Language and Reader indicated that L2 readers of English (but not of Chinese) had a larger Sigma than native speakers.
Tau was larger for L2 readers of English (compared to native English speakers) in Study 2, and a significant interaction with Text Language indicated that this difference was magnified for L2 readers of Chinese. This differs somewhat from Study 1, where no effect of L2 was observed on Tau when reading English texts. However, the larger increase in Tau for L2 readers of Chinese that was observed in Study 1 is observed here as well.
Discussion
As in Study 1, there was a significant difference in Mu between Native and L2 readers, and this difference was statistically identical across languages. This replicated finding provides further support for the idea that L2 readers experience a universal reading slowdown when their L2 orthography is very different from their L1 orthography.
L2 readers of Chinese experienced a large increase in Tau in both Study 1 and Study 2. This replicated finding suggests that L2 readers of Chinese struggle with later stages of text comprehension.
Study 2 was different from Study 1 in two significant but related ways. First, comprehension questions were added. Second, the pseudo-reading condition was removed. Both changes encouraged participants to read for comprehension. These differences likely influenced the differences in results between Studies 1 and 2. Prominent among these was the appearance in Study 2 of a difference in Tau between Native and L2 readers. Such a difference was not present in Study 1. The most likely explanation is that the participants in Study 1 were not reading for comprehension, at least not to the same degree as in Study 2. When the goal is comprehension, L2 readers do experience later-arising difficulty that is most likely associated with semantic/syntactic processes.
Differences in comprehension goals also likely account for the difference in Tau observed in Study 2 between native Chinese reading and native English reading. It seems unlikely that native readers of Chinese have a harder time with later-stage processing than native readers of English. This is especially unlikely in the context of work by Liversedge et al. (Reference Liversedge, Drieghe, Li, Yan, Bai and Hyönä2016), who found that when the content of the texts was equated across languages, overall reading times did not differ significantly. However, Liversedge et al. (Reference Liversedge, Drieghe, Li, Yan, Bai and Hyönä2016) did not explore the fixation duration distribution, so it is possible that the Chinese writing system, with its denser orthography and lack of word spaces, does lead to more occasional disruptions that show up in the Tau parameter. Further research is necessary to test this possibility.
Study 3
A comparison of Studies 1 and 2 raises three important questions. First, is the increase in Mu observed in L2 readers truly the result of orthographic differences between Chinese and English, or a more universal slowdown that can be expected for all L2 readers? Second, do all L2 readers experience later-arising difficulty (as evidenced by an increase in Tau) when reading for comprehension, as was observed in Study 2? Third, is the uniquely large increase in Tau for L2 Chinese readers observed in both Study 1 and 2 truly the result of some Chinese-specific challenge, such as word segmentation difficulty?
To answer these questions, we conducted Study 3, which is identical to Study 2 with one crucial change: instead of Chinese, participants read Portuguese. As Portuguese is an alphabetic language, it is much more orthographically similar to English than Chinese is, and so any difference in Mu across languages might be attenuated or even eliminated. Since the study is otherwise identical (same texts, same comprehension questions), if the requirement to read for comprehension is influencing Tau for L2 readers, this effect should still be observed even though the languages are different. And finally, since Portuguese is written with word spaces and uses characters familiar to native English speakers, we would not expect L2 readers of Portuguese to show the same large increase in Tau that was observed when L2 Chinese readers occasionally struggled.
Method
Participants
Forty-nine participants from the Brigham Young University community completed the experiment. All participants had 20/20 corrected or uncorrected vision. Thirty-four participants (18 males) were native English speakers who speak Portuguese as a second language. The other 15 participants (9 males) were native Portuguese speakers learning English as a second language. See Supplementary Material (Supplementary Materials) for demographic and proficiency information about the participants.
Materials, apparatus and procedure
The materials were identical to Study 2, except the texts were translated into Portuguese instead of Chinese. The apparatus and procedure were the same as Study 2.
Results
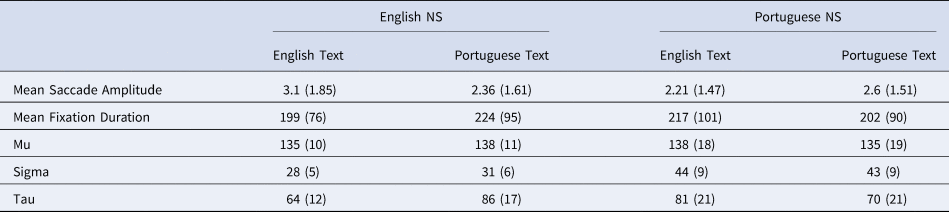
After cleaning, there were 182,212 saccades and 254,274 fixations remaining in the data, for an average of 2,594 per participant per language. The analyses were identical to those conducted in Study 2. Descriptive statistics are shown in Table 3. Model outputs and additional figures can be found in Supplementary Material (Supplementary Materials).
Descriptive Statistics for Global Eye Movement Variables in Study 3

Note. NS = Native Speaker
Portuguese vs. English
Saccade amplitude was significantly larger in English than in Portuguese. There was no significant difference in fixation duration between Portuguese and English. Further, there was no significant difference in Mu between English and Portuguese. Sigma was smaller in English. There was no significant difference observed in Tau between English and Portuguese.
Native vs. L2 readers
There was no significant difference in saccade amplitude for L2 readers – a significant interaction with Text Language indicated that the difference observed between English and Portuguese for native speakers was not significant for L2 readers.
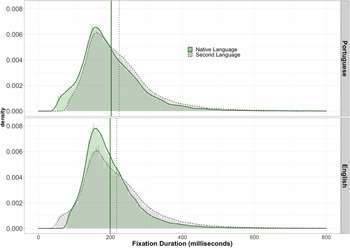
Figure 5 shows the influence of Reader on the distribution of fixation durations across the two languages. L2 readers had significantly longer fixations than did native readers, but the interaction of Reader and Text Language was not significant, indicating that this difference was statistically equivalent across the two languages. The analysis of Mu revealed no significant effects or interactions, indicating that L2 readers did not have a larger Mu than native readers in either English or Portuguese. Sigma was smaller for L2 readers of Portuguese but larger for L2 readers of English. Tau was larger for L2 readers, and there was no significant interaction, indicating that this increase in Tau was statistically the same for both languages. Taken together, these findings show that the increase in fixation durations during L2 reading in Study 3 can be entirely attributed to changes in variability (Tau and Sigma).
Distribution of fixation durations for reading in a native language (green, solid lines) versus reading in a second language (gray, dotted lines) in Study 3. Distributions in the top panel are from reading Portuguese text, while the distributions in the bottom panel are from reading English text. The vertical lines represent the mean fixation durations for each group. Histogram bin width was 2 ms.

Discussion
No differences in Mu were observed in Study 3, where two orthographically and linguistically similar languages, English and Portuguese, were compared. This suggests that the consistent increase in Mu for L2 readers that was observed in Studies 1 and 2 can be attributed to the large orthographic and linguistic distance between English and Chinese.
A significant increase in Tau was observed for all L2 readers in Study 3. This suggests that L2 readers generally experience more difficulty extracting meaning from text when they are reading for comprehension. This increase was statistically identical across the two languages studied, in contrast to Studies 1 and 2, where a much larger increase was observed for native speakers of English reading in Chinese. Taken together, these findings suggest that Chinese text represents a particular challenge for L2 learners, a challenge that shows up in Tau, which we tentatively interpret here as an index of linguistic processing.
General discussion
In the present paper, we used ex-Gaussian analyses of fixation duration distributions to identify the source(s) of L2 reading difficulty. In Studies 1 and 2, we recruited Chinese–English and English–Chinese bilinguals, while for Study 3 we recruited Portuguese–English and English–Portuguese bilinguals. Based on the results, we suggest that slowdowns in L2 reading are primarily reflected in Tau, meaning that L2 readers, regardless of language, will experience linguistic difficulty that arises frequently but not often enough to influence every fixation. An increase in Mu, reflecting a more universal increase in fixation duration, will arise for L2 readers when there are significant differences in the L1 and L2 orthographies and typologies.
In the remainder of this discussion, we summarize our findings about L1 and L2 reading in the specific languages studied, first Chinese/English and then Portuguese/English. Then, we consider the findings regarding pseudo-reading and how reading for comprehension changes eye movements. Finally, we discuss study limitations and outline questions for future work.
Comparing Chinese and English reading
Both Studies 1 and 2 compared reading in Chinese versus reading in English. In this section, we discuss how these findings relate to the literature in both L1 and L2 reading.
L1 Chinese and English reading
In Study 2, saccades in English were consistently about 1 degree longer than in Chinese. This is consistent with other studies (Liversedge et al., Reference Liversedge, Hyönä and Rayner2013, Reference Liversedge, Drieghe, Li, Yan, Bai and Hyönä2016; Yang & McConkie, Reference Yang and McConkie1999). This difference in saccade amplitude was not observed in Study 1, but as the supplementary material shows, (Supplementary Materials} most saccades in Chinese were shorter than in English except a subset of Chinese saccades that were quite long. This sub-population of long saccades likely arises from the conditions of Study 1, where participants were not required to read for comprehension. Fixations were consistently longer in Chinese as well, as expected (Liversedge et al., Reference Liversedge, Hyönä and Rayner2013, Reference Liversedge, Drieghe, Li, Yan, Bai and Hyönä2016; Yang & McConkie, Reference Yang and McConkie1999).
Only a couple of studies have examined the distribution of fixation durations in L1 Chinese reading (Ma, Li & Rayner, Reference Ma, Li and Rayner2015; Ma & Zhuang, Reference Ma and Zhuang2018). These studies examined word frequency effects, and so reported the components of the distribution for high and low frequency words separately. Averaging across frequency conditions and experiments, Ma et al. (Reference Ma, Li and Rayner2015) report that native Chinese readers had Mu of 185, Sigma of 33, and Tau of 75 (range: 65, 87). Ma and Zhuang (Reference Ma and Zhuang2018) report Mu of 194, Sigma of 47, and Tau of 68 (range: 59, 76). Comparing these values to the values for native readers in the present studies reveals that the Mu values were shorter in the present studies, but the values for Sigma and Tau are comparable (S1: 158, 47, 50; S2: 150, 62, 87).
The results of the present studies revealed a consistent difference in Mu of about 17 milliseconds between Chinese and English. This accounted for all the difference in mean fixation durations between languages in Study 1, but not in Study 2 where reading for comprehension was enforced. In Study 2, the mean fixation duration difference was larger (44 ms), and this difference can be partly attributed to a larger Tau in L1 Chinese reading. Thus, the difference in Mu observed here between Chinese and English L1 reading was stable, while the difference in Tau was not.
In Liversedge et al. (Reference Liversedge, Drieghe, Li, Yan, Bai and Hyönä2016), the mean fixation duration difference between Chinese and English reading is about 38 ms, which is more consistent with Study 2. So, the difference in Tau across languages observed in Experiment 2 is likely present in the Liversedge et al. data, and probably in most eye tracking studies of Chinese where participants read for comprehension. If there is a difference in Tau across languages, it could arise from the lack of word spaces in Chinese; although native readers of Chinese are highly efficient at reading unspaced text, when word spaces are introduced in Chinese, mean fixation duration becomes about 20 ms shorter (Bai, Yan, Liversedge, Zang & Rayner, Reference Bai, Yan, Liversedge, Zang and Rayner2008; Zang, Liang, Bai, Yan & Liversedge, Reference Zang, Liang, Bai, Yan and Liversedge2013). This could account for most of the difference in Tau observed in Study 2. In other words, the absence of word spaces could have an influence on eye movements even in native Chinese readers. However, Ma (Reference Ma2017) provides evidence that the addition of interword spaces in Chinese facilitates visual, rather than lexical, processing, and so should more likely show up in the Mu parameter, not Tau. Further research is needed to clarify this point.
L2 Chinese and English reading
L2 readers in Studies 1 and 2 showed a significant increase in Mu, and this increase was not statistically different across languages. Thus, L2 readers who switch from Chinese to English or from English to Chinese experience a consistent slowdown in fixation durations. Likewise, Wang, Koda, and Perfetti, C. A. (Reference Wang, Koda and Perfetti2003) showed that Korean–English and Chinese–English bilinguals processed English text differently, indicating that the L1 writing system influenced L2 reading; Korean hangul is an alphabetic and phonologically transparent writing system, while Chinese emphasizes orthographic processing and is phonologically quite opaque. Consequently, Korean-speakers focused more on phonology when reading in English, while Chinese-speakers focused on orthography. Other researchers have shown that Chinese–English bilinguals employ different, more holistic reading strategies in English than do Korean–English bilinguals, who rely more on sublexical (i.e., letter) information, which is ultimately more appropriate for English orthography (Ben-Yehudah, Hirshorn, Simcox, Perfetti & Fiez, Reference Ben-Yehudah, Hirshorn, Simcox, Perfetti and Fiez2019). Furthermore, the greater the difference between the L1 and L2 writing systems, the greater the difference in brain activation during reading in the two languages (Li et al., Reference Li, Zhang and Ding2021). All of this indicates that the L1 writing system matters in L2 reading. The present results suggest that the effect of orthographic distance arises early, influencing most or all fixations during reading.
L2 Chinese reading was characterized by a very large increase in Tau in both Study 1 (164) and Study 2 (186). This is about 100 ms larger than Tau in native Chinese reading, much larger than the 17–26 ms increase in Tau for L2 English reading and the 16 ms increase for L2 Portuguese reading (Study 3). Clearly, learning to read Chinese as an L2 presents a challenge. One possible explanation is that the L2 readers struggled with the lack of word spaces in Chinese. Only one study has examined the effect of inter-word spacing on the components of the fixation duration distribution. Sheridan et al. (Reference Sheridan, Rayner and Reingold2013) removed word spaces in English by adding numbers in between the words and observed small increases in all three components of the ex-Gaussian distribution. The present findings similarly show that L2 readers of Chinese experience increases in Mu and Tau. The present results may therefore indicate that the lack of word boundary information in Chinese represents a significant challenge for L2 readers that leads to processing slowdowns on some fixations. Of course, it is also possible that other aspects of Chinese orthography, such as the visual density of the characters, could be the cause, as could an overall weaker vocabulary in L2 Chinese learners. More research is needed to clarify this point as well. L2 English readers also experienced an increase in Tau (in Study 2 and 3, but not in Study 1), although this increase was much smaller.
Comparing Portuguese and English reading
Study 3 compared reading in Portuguese versus English. In this section, we discuss these findings in both L1 and L2 reading.
L1 Portuguese reading
There is a paucity of reported research on Portuguese eye movements during reading. What research exists suggests that the participants in Study 3 had typical fixation durations (Leal, Lukasova, Carthery-Goulart, & Aluísio, Reference Leal, Lukasova, Carthery-Goulart and Aluísio2022; Vieira, Reference Vieira2020). Saccades were about 0.6 degrees longer in English than in Portuguese, and Sigma was larger in Portuguese, but overall, the pattern of eye movements was highly similar across the two languages. This is perhaps unsurprising given their orthographic similarity.
L2 Portuguese reading
L2 readers of Portuguese did not have longer saccades than native Portuguese readers. The same was true for native Portuguese speakers reading in English. Overall, this suggests that the orthographic similarities between English and Portuguese make the transition from one language to the other easy for the eyes. Fixation durations were on average about 19 ms longer in L2 reading, and this increase was equivalent across languages. This increase can be entirely attributed to changes in Tau, with no differences in Mu observed. The writing systems used in Portuguese and English are highly similar, which facilitates cross-language transfer (Ben-Yehudah et al., Reference Ben-Yehudah, Hirshorn, Simcox, Perfetti and Fiez2019; Chung, Chen & Geva, Reference Chung, Chen and Geva2019; Jeon & Yamashita, Reference Jeon and Yamashita2014; Sun, Zhang, Marks, Nickerson, Eggleston, Yu, Chou, Tardif & Kovelman, Reference Sun, Zhang, Marks, Nickerson, Eggleston, Yu, Chou, Tardif and Kovelman2022; Wang et al., Reference Wang, Koda and Perfetti2003). This is the most likely reason that no effect of Mu was observed. So, L2 readers of Portuguese and English appear to experience little or no orthographic difficulty, but they do experience some difficulty that is likely later-arising and semantic in nature.
Pseudo-reading
Study 1 included a pseudo-reading condition. The findings from Study 1 closely replicate existing results with English pseudo-reading: an increase in fixation durations driven by changes in Tau, the tail of the distribution (Luke & Henderson, Reference Luke and Henderson2013, Reference Luke and Henderson2016; Nuthmann & Engbert, Reference Nuthmann and Engbert2009; Rayner & Fischer, Reference Rayner and Fischer1996; Vitu et al., Reference Vitu, O'Regan, Inhoff and Topolski1995). This study is, to our knowledge, the first to explore pseudo-reading in a Chinese reading context, and the results were highly comparable to English.
Second language readers’ eye movements in pseudo-reading were highly similar to native readers’ (see Table 2 and Figure 5). This was especially true when pseudo-reading in ‘English’, where word spaces were present. In ‘Chinese’ pseudo-reading, Mu and Sigma were the same for L1 and L2 readers, but Tau was larger for the L2 Chinese readers. This is somewhat unexpected, and in the absence of converging evidence from other studies and methods, is difficult to interpret.
Reading for comprehension
In Study 1, participants were not asked comprehension questions about what they were reading. Further, Study 1 included a pseudo-reading condition where no comprehension was possible. These two factors together certainly served to discourage reading for comprehension. By contrast, Study 2 included difficult comprehension questions after every text and did not include a pseudo-reading condition, so the participants in Study 2 were encouraged to read for comprehension. A comparison of the results of these two studies is informative.
First, the shift to reading for comprehension did not have much impact on saccade amplitudes, except in the case of L1 Chinese reading, where saccades became about 1 degree shorter. Second, while Mu and Sigma remained largely the same, large (21+ ms) increases in Tau were observed for all reader-text language combinations except native English speakers reading in English. This change provides further support to the idea that Tau is the component of the fixation duration distribution most sensitive to meaning. Why the native English readers’ eye movement behaviors did not change across studies during L1 reading is unclear.
Limitations and future directions
The present study is limited in ways that must be acknowledged. First, there were no true monolingual controls. Having only bilinguals simplified recruitment and study design and reduced between-group variance. However, there is some evidence that eye movements of bilinguals are measurably different from those of monolinguals even in their native language (Whitford & Titone, Reference Whitford and Titone2012, Reference Whitford and Titone2015). Comparing bilingual L1 and bilingual L2 reading as we did answers the question of how a given individual's eye movements change when they switch from their L1 to their L2, but including monolingual control groups would answer a different question: how does L2 reading differ from monolingual reading across individuals? Future studies might therefore benefit from including both a monolingual control group and a bilingual comparison group.
Another challenge was that, given the stringent recruitment criteria, it was not possible to equate the groups’ L2 proficiency, either within or across studies. L2 proficiency should affect eye movements in reading, although little is known about how proficiency would influence the different components of the fixation duration distribution. Further, most proficiency measures are offline measures – comprehension, accuracy, or self-rating or self-report – that may not reflect reading efficiency as measured by eye movements. For example, a native English speaker who is an ‘advanced’ L2 reader of Chinese will likely be a slower reader than an English speaker who is an ‘advanced’ L2 reader of Portuguese, given the additional challenges that Chinese presents – an unfamiliar orthography and lack of word spacing information. Further research focused on examining eye movement control in different languages at different levels of proficiency would be valuable.
Finally, our chosen method – an ex-Gaussian analysis of fixation duration distributions – has limitations as well. While there is a growing body of evidence to support the interpretations of Mu and Tau as early/orthographic and late/semantic components, there is also ample reason to be cautious about this interpretation (Fitousi, Reference Fitousi2020; Matzke & Wagenmakers, Reference Matzke and Wagenmakers2009; Rieger & Miller, Reference Rieger and Miller2020). The results reported here should be viewed as tentative until supported by studies using other methods and/or more focused manipulations.
Given these limitations, we have avoided making strong conclusions about the size of the effects reported here; the magnitude of the change in Tau for L2 readers likely depends on how proficient they are and who they are being compared to. Likewise, any change in Mu across languages will depend on what languages are being compared and how proficient the readers of these languages are. However, the present studies revealed several changes in the fixation duration distributions that will likely replicate across languages and populations, even if the precise magnitude of these changes varies.
Conclusion
The present study explored the source of L2 reading difficulty by analyzing the distribution of fixation durations in reading. In three studies, we observed that L2 readers experience an increase in Mu, likely indicating early orthographic processing difficulty, when the L2 has a significantly different writing system than the L1 (e.g., Chinese and English). L2 readers also experienced an increase in Tau, which probably reflects later linguistic processing difficulty, when they read for comprehension.
Supplementary Material
Supplementary material can be found online at https://doi.org/10.1017/S1366728922000670
Acknowledgments
This work has been made possible in part by a grant from the Simmons Research Endowment at Brigham Young University
Data availability
The data that support the findings of this study are part of a larger project, and will be available in the Open Science Framework once data collection for that project is completed.