





Highlights
-
• Bilingualism influences early and late stages of neural control differently
-
• L2 proficiency modulates conflict monitoring (N2) across context conditions
-
• Earlier L2 AoA predicted greater attentional resource availability at conflict SP
-
• Language-switching frequency reduces context sensitivity in later control (SP)
-
• Bilingual experiences uniquely shape how the brain handles cognitive conflict
1. Bilingual experience and attentional control
Bilinguals often outperform monolinguals on executive function (EF) tasks measuring attentional control (e.g., Bialystok et al., Reference Bialystok, Craik, Klein and Viswanathan2004; Costa et al., Reference Costa, Hernandez and Sebastian-Galles2008, Reference Costa, Hernandez, Costa-Faidella and Sebastian-Galles2009; Esposito et al., Reference Esposito, Baker-Ward and Mueller2013; review in Bialystok, Reference Bialystok2017), which is often attributed to their experiences managing two languages that are constantly competing for selection (Bobb et al., Reference Bobb, Von Holzen, Mayor, Mani and Carreiras2020; Kroll et al., Reference Kroll, Dussias, Bogulski, Valdes Kroff and Ross2012, Reference Kroll, Bobb and Hoshino2014). However, bilingualism is complex and individual bilingual experiences may impact attentional control differently (Chung-Fat-Yim et al., Reference Chung-Fat-Yim, Calvo and Grundy2022, Reference Chung-Fat-Yim, Bobb, Hoshino and Marian2023; Dass et al., Reference Dass, Smirnova-Godoy, McColl, Grundy, Luk and Anderson2024; Green & Abutalebi, Reference Green and Abutalebi2013; Leivada et al., Reference Leivada, Westergaard, Duñabeitia and Rothman2021). Evidence suggests that language-switching frequency (Fan et al., Reference Fan, Wu, Cai, Ma, Pan, Xu, Sun, Jing and Li2021), second-language (L2) usage (Carlson & Meltzoff, Reference Carlson and Meltzoff2008), L2 AoA (Durand Lopez, Reference Durand Lopez2021), and L2 proficiency (Sun et al., Reference Sun, Li, Ding, Wang and Li2019) all impact cognition and the brain, and the field is now pushing for examination of bilingualism along a continuum rather than a dichotomy (Dass et al., Reference Dass, Smirnova-Godoy, McColl, Grundy, Luk and Anderson2024; Grundy et al., Reference Grundy2020; Leivada et al., Reference Leivada, Westergaard, Duñabeitia and Rothman2021; Luk & Bialystok, Reference Luk and Bialystok2013; Titone & Tiv, Reference Titone and Tiv2023; Yurtsever et al., Reference Yurtsever, Anderson and Grundy2023, Reference Yurtsever, Sotebeer and Grundy2025). To this end, the present study tested an all-bilingual sample and used event-related potentials (ERPs) alongside an individual-differences approach to examine the effects of bilingualism on attentional control. By treating bilingualism as a continuum of experiences (rather than a dichotomy), we address prior inconsistencies and capture nuanced effects of specific language experiences. We expect that these language experiences will uniquely influence sensitivity to contextual cues and conflict, predicting the amount of attentional control required.
2. Context-specific proportion congruency (CSPC) and attentional control
The CSPC (Crump et al., Reference Crump, Gong and Milliken2006) paradigm is a powerful tool for examination of how contextual cues can modify the amount of attentional control applied to conflicting and non-conflicting stimuli on a Stroop task. The CSPC effect refers to the finding that the congruency effect (slower responses on incongruent than congruent trials) is typically larger in a context where most trials are congruent (high proportion congruent, HPC) than in a context where most trials are incongruent (low proportion congruent, LPC). This indicates that participants use contextual cues (e.g., stimulus location) to adjust their attentional control “on-the-fly,” applying more control in contexts that are likely to have conflict. The CSPC paradigm thereby assesses reactive control – dynamic, trial-by-trial adjustments in attention based on implicit contextual cues (Crump et al., Reference Crump, Gong and Milliken2006, Reference Crump, Brosowsky and Milliken2017). By contrast, list-wide proportion congruency manipulations involve proactive control, as participants can adopt a sustained strategy across a whole block (Braver, Reference Braver2012; Logan & Zbrodoff, Reference Logan and Zbrodoff1979). While some studies suggest that bilinguals may rely more on proactive control strategies (Morales et al., Reference Morales, Gómez-Ariza and Bajo2013), other evidence indicates that bilingual experience specifically affects how reactive control is engaged when task demands shift (Morales et al., Reference Morales, Yudes, Gómez-Ariza and Bajo2015; Wu & Thierry, Reference Wu and Thierry2013). Thus, the CSPC paradigm is well suited for examining how bilingual experiences influence dynamic, trial-by-trial adjustments in attentional control under changing contexts.
3. Sequential congruency effects and the interpretation of conflict adaptation
A theoretically related construct, in which the congruency of the previous trial influences the size of subsequent congruency effects, is known as the sequential congruency effect (SCE), or more commonly, conflict adaptation Footnote 1 (Botvinick et al., Reference Botvinick, Braver, Barch, Carter and Cohen2001). Traditional conflict-monitoring models assume that larger SCEs reflect more adaptive control, as they indicate sensitivity to prior conflict and subsequent adjustment (Botvinick et al., Reference Botvinick, Braver, Barch, Carter and Cohen2001; Egner, Reference Egner2007; Kerns et al., Reference Kerns, Cohen, MacDonald, Cho, Stenger and Carter2004). However, accumulating evidence suggests that the size of the SCE does not provide a straightforward measure of control efficiency. In fact, smaller SCEs often emerge in conditions associated with greater cognitive stability and efficiency. For example, SCEs tend to shrink with practice, suggesting that individuals who develop more fluent task performance require fewer reactive adjustments (Mayr & Awh, Reference Mayr and Awh2009; van Steenbergen et al., Reference van Steenbergen, Haasnoot, Bocanegra, Berretty and Hommel2015). Similarly, longer response-to-stimulus intervals lead to smaller SCEs, indicating that when participants have more time to regulate control proactively, transient trial-by-trial adaptations become less necessary (Duthoo et al., Reference Duthoo, Abrahamse, Braem and Notebaert2014; Egner et al., Reference Egner, Ely and Grinband2010).
Beyond task structure, individual differences in cognitive efficiency also predict SCE size. Higher fluid intelligence is associated with smaller SCEs, supporting the argument that greater cognitive stabilityFootnote 2 results in reduced reliance on transient control adjustments (Liu et al., Reference Liu, Xiao and Shi2016). Conversely, anxiety, and subjective cognitive decline have been linked to larger SCEs, suggesting that heightened sensitivity to conflict, rather than enhanced control, may underlie larger adaptation effects (Osinsky et al., Reference Osinsky, Alexander, Gebhardt and Hennig2010; Schuch & Koch, Reference Schuch and Koch2015; Trikojat et al., Reference Trikojat, Buske-Kirschbaum, Schmitt and Plessow2015). Additionally, research on conflict processing indicates that SCEs may reflect avoidance learning, as conflict trials are often aversive (Botvinick, Reference Botvinick2007; Dreisbach & Fischer, Reference Dreisbach and Fischer2012). Supporting this, van Steenbergen et al. (Reference van Steenbergen, Band and Hommel2009) found that reward signals between trials eliminated SCEs, demonstrating that adaptation effects can be modulated by motivational factors.
In summary, recent work indicates that smaller SCEs (or “conflict adaptation” effects) do not necessarily imply a failure of control. They may instead reflect a shift toward a more stable, efficient attentional control strategy that minimizes the need for reactive, trial-by-trial adjustments. Bilinguals continuously manage competing linguistic representations, which may result in a regulatory mode that minimizes reliance on transient, reactive adjustments in favor of a more sustained attentional control process (Grundy & Bialystok, Reference Grundy and Bialystok2019). Instead of adjusting control dynamically in response to individual trials, bilinguals may maintain a consistent level of attentional engagement, leading to more stable task performance over time. In line with this reasoning, Grundy et al. (Reference Grundy, Chung-Fat-Yim, Friesen, Mak and Bialystok2017b) reported that bilingual young adults showed smaller SCEs than monolinguals, which was interpreted as evidence of a more efficient control process that does not depend as heavily on trial-by-trial control engagement. Likewise, Grundy and Bialystok (Reference Grundy and Bialystok2018) found that bilinguals more rapidly disengage attention from irrelevant conflicting stimuli, further suggesting a refined control mechanism in bilinguals that reduces carryover effects across trials.
4. ERP indices of conflict monitoring and sustained control (N2 and conflict SP)
While a growing body of literature has examined bilingual effects on behavioral performance, fewer studies have used electrophysiological measures (e.g., ERPs) to investigate how bilingual experiences relate to the neural dynamics of attentional control. ERPs are well suited for this purpose because they provide millisecond-level temporal resolution, allowing early and later stages of processing during conflict tasks to be dissociated. Two ERP components are especially relevant in this context: the N2 and the conflict slow potential (SP).
The N2 is a fronto-central negative deflection peaking approximately 250–350 ms following stimulus onset and is commonly associated with conflict monitoring and the detection of competing response information (Donkers & van Boxtel, Reference Donkers and Van Boxtel2004; Fong et al., Reference Fong, Hui, Fung, Chu and Wang2018; Jost et al., Reference Jost, Wendt, Luna-Rodriguez and Jacobsen2022). This component is thought to reflect early engagement of attentional control, likely involving anterior cingulate cortex (ACC) signaling the need for increased attentional allocation (Nieuwenhuis et al., Reference Nieuwenhuis, Yeung, Van Den Wildenberg and Ridderinkhof2003; van Veen & Carter, Reference van Veen and Carter2002a, Reference van Veen and Carter2002b). Importantly, bilingual experience has been shown to modulate both ACC function (Abutalebi et al., Reference Abutalebi, Della Rosa, Green, Hernandez, Scifo, Keim, Cappa and Costa2012; Blanco-Elorrieta, & Pylkkänen, Reference Blanco-Elorrieta and Pylkkänen2016; Cachia et al., Reference Cachia, Del Maschio, Borst, Della Rosa, Pallier, Costa and Abutalebi2017; Seo et al., Reference Seo, Stocco and Prat2018) and N2 amplitude during conflict tasks (Antoniou, Reference Antoniou2023; Grundy et al., Reference Grundy, Anderson and Bialystok2017a). Bilinguals have often been reported to show larger N2 amplitudes on conflict tasks alongside reduced late-stage components, a pattern that has motivated accounts emphasizing how attentional control demands may be redistributed across early and late stages of processing rather than expressed as a single uniform neural signature (Antoniou, Reference Antoniou2023; Grundy et al., Reference Grundy, Anderson and Bialystok2017a). Recent work further highlights substantial variability in how such early–late tradeoffs manifest across individuals and tasks (e.g., Carter et al., Reference Carter, DeLuca, Segaert, Mazaheri and Krott2023), reinforcing the need to evaluate processing efficiency through joint behavioral–neural profiles rather than isolated component effects.
The conflict SP is a later, sustained negative-going slow wave that emerges several hundred milliseconds after stimulus onset and can extend beyond the response (Larson et al., Reference Larson, Clayson and Clawson2014; West, Reference West2003). This component is thought to index later-stage or compensatory adjustments to attentional demands following conflict detection, particularly when early control engagement is insufficient to fully resolve competing information (Larson et al., Reference Larson, Kaufman and Perlstein2009a, Reference Larson, Farrer and Clayson2011; Pan et al., Reference Pan, Lu, Chen, Wu and Li2016). Evidence from individual-differences research supports this interpretation: for example, individuals with traumatic brain injury (TBI) show reduced conflict SP amplitudes, consistent with diminished ability to sustain control following conflict detection, whereas individuals with higher intelligence exhibit larger SP amplitudes alongside smaller behavioral adaptation effects, suggesting greater available resources for resolving conflict efficiently (Liu et al., Reference Liu, Xiao and Shi2016). Accordingly, in the present study, we interpret variation in conflict SP amplitude as reflecting differences in the availability and deployment of attentional resources at later stages of processing.
5. Bilingual interactional contexts and sensitivity to contextual cues
It is also crucial to consider theoretical frameworks regarding bilingual language use and attention. Green and Abutalebi’s (Reference Green and Abutalebi2013) Adaptive Control Hypothesis distinguishes between interactional contexts that impose different control demands: single-language contexts (use one language per environment), dual-language contexts (switch languages depending on interlocutor), and dense code-switching contexts (free mixing of two languages within a conversation). Each context is thought to tax control processes differently. In a dense code-switching environment, for instance, bilinguals switch languages frequently but with relatively low interference, because all interlocutors understand both languages; as a result, monitoring external cues for language selection may be less critical (Green & Abutalebi, Reference Green and Abutalebi2013). By contrast, in a single-language context, switching is infrequent and triggered by distinct contexts, so interference from the non-target language is minimal until a context switch occurs. We reasoned that these differing demands might map onto how bilinguals handle contextual cues in a non-linguistic task like the CSPC Stroop. Specifically, an individual who frequently switches languages in a dense code-switching environment might be less attuned to contextual cues indicating when to up- or down-regulate control, because their daily experience deemphasizes context signals (since both languages are always in play). Thus, we tentatively predicted that greater language-switching frequency might correlate with smaller context-specific adjustments (a reduced CSPC effect), reflecting a tendency to apply a more uniform level of control regardless of context.
In addition to switching frequency, L2 experiences such as proficiency, age of acquisition (AoA), and usage might be predictive of changes in response to conflict and context on the CSPC paradigm, given that these bilingual experiences have been shown to modify conflict processing and brain adaptations (Anderson et al., Reference Anderson, Grundy, Grady, Craik and Bialystok2021; DeLuca et al., Reference DeLuca, Rothman, Bialystok and Pliatsikas2020; DeLuca & Voits, Reference DeLuca and Voits2022; Luk & Grundy, Reference Luk and Grundy2023; Titone & Tiv, Reference Titone and Tiv2023). For example, Wu and Thierry (Reference Wu and Thierry2013) and others (e.g., Jiao et al., Reference Jiao, Grundy, Liu and Chen2020) have shown that bilinguals adapt their attentional control and conflict processing on a flanker task based on linguistic context cues.
Inconsistencies in the literature on the effects of bilingualism on EFs and attentional control (meta-analyses in Grundy, Reference Grundy2020; Gunnerud et al., Reference Gunnerud, Ten Braak, Reikerås, Donolato and Melby-Lervåg2020; Lehtonen et al., Reference Lehtonen, Soveri, Laine, Järvenpää, De Bruin and Antfolk2018; Ware et al., Reference Ware, Kirkovski and Lum2020; Yurtsever et al., Reference Yurtsever, Anderson and Grundy2023) can be at least partly explained by the complexity of bilingual experiences and environmental contexts in which participants reside. For example, Yurtsever et al. (Reference Yurtsever, Sotebeer and Grundy2025) demonstrated that age of second-language acquisition (L2 AoA) and language-switching frequency between two languages sometimes uniquely predicted performance in opposite ways (faster or slower reaction times) on flanker and Stroop mouse-tracking paradigms. This means that when different bilingual experiences are collapsed together, researchers risk eliminating real effects; the two experiences effectively cancel each other out. It is for reasons like this one that researchers have been pushing to look at bilingualism along a continuum rather than a dichotomy of “bilingual” and “monolingual” (Deluca et al., Reference DeLuca, Rothman, Bialystok and Pliatsikas2019a; Grundy, Reference Grundy2020; Luk & Bialystok, Reference Luk and Bialystok2013; Rothman et al., Reference Rothman, Bayram, DeLuca, Alonso, Kubota, Puig-Mayenco, Luk, Anderson and Grundy2023a, Reference Rothman, Bayram, DeLuca, Di Pisa, Dunabeitia, Gharibi, Hao, Kolb, Kubota, Kupisch, Laméris, Luque, van, Soares, Prystauka, Tat, Tomić, Voits and Wulff2023b; Yurtsever et al., Reference Yurtsever, Anderson and Grundy2023).
6. The present study
To clarify how bilingual engagement relates to contextual cue use and conflict processing, we examined behavioral performance and two complementary ERP indices (the N2 and the conflict SP) during a CSPC (Crump et al., Reference Crump, Gong and Milliken2006) Stroop task in a heterogeneous sample of bilinguals. One primary expectation was that greater bilingual engagement – indexed by higher L2 proficiency, greater L2 usage, and earlier L2 AoA – would be associated with more efficient performance on a conflict task. However, efficiency can be expressed through multiple behavioral–neural configurations (e.g., smaller behavioral conflict effects and/or faster responses with comparable accuracy, accompanied by equal or reduced reliance on compensatory control). Likewise, changes in early versus late neural recruitment can trade off across time; therefore, behavior, N2, and conflict SP must be interpreted jointly rather than in isolation. Importantly, Table 1 is intended as an interpretive framework rather than a set of one-to-one predictions linking specific bilingual experiences to specific profiles; different experience dimensions may give rise to different efficient configurations, and some patterns (e.g., increased sustained neural responses in the absence of behavioral change) may also reflect differences in available attentional resources rather than increased neural cost. Throughout this paper, efficiency is defined at the level of task performance on a conflict task rather than conflict-specific differentiation per se. Finally, based on interactional-context reasoning (Green & Abutalebi, Reference Green and Abutalebi2013), we expected that more frequent language switching would be associated with reduced sensitivity to contextual cues (i.e., smaller context-specific adjustments), which we evaluate cautiously.
Interpretable profiles of processing efficiency across behavioral and neural measures as a function of increasing bilingual experience. The table illustrates representative configurations of behavioral performance and neural engagement that may emerge with increasing bilingual experience. Profiles are organized by conflict effect (difference between incongruent and congruent trials) and overall-amplitude (mean across trial types) measures and are intended to provide a general interpretive framework for evaluating how efficiency can be expressed across early (N2) and late (conflict SP) stages of processing

Table 1. Long description
The table is divided into two main sections based on E R P profile type: Conflict effect and Overall amplitude.
Section 1: Conflict effect profiles.
- Row 1: Smaller behavioral conflict, larger N 2 conflict, smaller S P conflict. Interpreted as greater efficiency due to stronger early conflict differentiation reducing later effort.
- Row 2: Smaller behavioral conflict, larger N 2 conflict, no change in S P. Greater efficiency through enhanced early engagement.
- Row 3: Smaller behavioral conflict, no change in N 2, smaller S P. Greater efficiency with reduced reliance on sustained control.
- Row 4: Comparable behavioral conflict, larger N 2, smaller S P. Greater efficiency via earlier control allocation.
- Row 5: Comparable behavioral conflict, smaller N 2, smaller S P. Greater efficiency with reduced neural engagement across stages.
- Row 6: Comparable behavioral conflict, no change in N 2, smaller S P. Greater efficiency with reduced late effort.
- Row 7: Comparable behavioral conflict, no change in N 2 or S P. Comparable efficiency with stable processing.
- Row 8: Comparable behavioral conflict, smaller N 2, larger S P. Lower efficiency; reduced early engagement requires late-stage compensation.
- Row 9: Comparable behavioral conflict, larger N 2, larger S P. Lower efficiency; equivalent performance requires greater engagement across all stages.
- Row 10: Larger behavioral conflict, no change in N 2, larger S P. Lower efficiency; poorer performance with increased late effort.
- Row 11: Larger behavioral conflict, smaller N 2, larger S P. Lower efficiency; weak early differentiation leads to failed compensation.
- Row 12: Larger behavioral conflict, larger N 2, larger S P. Lower efficiency; elevated engagement fails to prevent behavioral costs.
Section 2: Overall amplitude profiles.
- Row 1: Faster responses, larger overall N 2, smaller overall S P. Greater efficiency via earlier allocation and reduced sustained effort.
- Row 2: Faster responses, no change in N 2 or S P. Greater efficiency; improved performance without added neural cost.
- Row 3: Comparable conflict, no change in N 2, smaller S P. Greater efficiency; reduced sustained effort.
- Row 4: Comparable conflict, smaller N 2, smaller S P. Greater efficiency; reduced overall engagement.
- Row 5: Comparable conflict, larger N 2, smaller S P. Greater efficiency; earlier engagement reduces sustained effort.
- Row 6: Comparable conflict, no change in N 2 or S P. Comparable efficiency; stable engagement.
- Row 7: Comparable conflict, smaller N 2, larger S P. Lower efficiency; reduced early engagement with increased sustained effort.
- Row 8: Comparable conflict, larger N 2, larger S P. Lower efficiency; increased engagement across stages for same performance.
- Row 9: Larger behavioral conflict, smaller N 2, larger S P. Lower efficiency; reduced early engagement and increased sustained effort with poorer performance.
- Row 10: Larger behavioral conflict, larger N 2, larger S P. Lower efficiency; elevated engagement without performance benefit.
Note: Behavioral and neural patterns may reflect changes in conflict-related effects (Δ = incongruent − congruent) and/or overall amplitude across trial types. Table entries describe how these patterns may vary with increasing bilingual experience, treated as a continuous individual-differences variable rather than a between-group comparison. Efficiency is defined at the level of task performance relative to neural engagement, such that faster or equivalent performance achieved with the same or reduced neural engagement reflects greater efficiency. Increased neural engagement without behavioral cost may also reflect differences in available attentional resources depending on context.
7. Methods
7.1. Participants
Table 2 provides demographic and linguistic background information for participants in the study. Fifty undergraduate bilinguals from Iowa State University were recruited via the SONA system in exchange for course credit. Ten participants reported having an L3, three an L4, and two an L5. Nineteen participants identified English as their L1, while the remaining participants reported various L1s, including Spanish, Chinese, Arabic, Portuguese, German, Amharic, Telugu, Korean, and Khmer. All participants who did not report English as their L1 had English as their L2, except for one individual who reported it as their L3. One participant reported a prior head injury (remote; no current neurological impairment was reported), and two participants reported taking psychoactive medications. As a sensitivity check, we re-ran the primary behavioral analyses and the key ERP models (N2 and conflict SP) after excluding these three participants; the pattern of results and conclusions was unchanged.
Demographic and language-background information for participants in the present study. Values represent means (and standard deviations; range), unless otherwise specified

Table 2. Long description
The table contains two columns. The first column lists the variable and the second column provides the mean value followed by the standard deviation in parentheses and the range where applicable.
* N: 50
* Age: 20.8 (2.4)
* Biological sex, male : 15
* Education – Father (1–5): 3.4 (1.7; 1–5)
* Education – Mother (1–5): 3.1 (1.7; 1–5)
* L 1 proficiency (0–100): 93.6 (9.1; 65–100)
* L 2 proficiency (0–100): 75.3 (18.8; 25–100)
* L 1 usage (0–4): 2.9 (0.8; 1–4)
* L 2 usage (0–4): 2.2 (0.9; 0.5–4)
* L 2 age of acquisition (A o A): 4.4 (4.8; 0–18)
* L 1/L 2 switching frequency (0–4): 1.9 (1.1; 0–4)
7.1.1. Task language and participant language profiles
Because the Stroop prime words were presented in English, the task was completed in participants’ dominant language for some individuals (English L1) and in a highly familiar second language for others (English L2/L3). Importantly, the stimuli were limited to four high-frequency color words, and English proficiency in the sample was high overall, reducing the likelihood that basic lexical comprehension drove the observed context and conflict effects. We now clarify this sample heterogeneity explicitly to aid interpretation of the results.
7.1.2. Power and sample size
The present sample size (N = 50) is within – and on the higher end of – typical sample sizes used in ERP studies of conflict processing. Meta-research suggests that ERP studies often involve comparatively modest samples and are most sensitive to medium-to-large effects, with precision improving as sample sizes grow (Clayson et al., Reference Clayson, Carbine, Baldwin and Larson2019; Szűcs & Ioannidis, Reference Szűcs and Ioannidis2017). Consistent with current best practices for individual-differences ERP work, we modeled bilingual experience as continuous predictors and entered all predictors simultaneously to estimate unique effects while limiting the number of separate models, thereby improving parsimony and interpretability. We acknowledge that higher-order interactions in modest samples can be underpowered, and therefore emphasize effect sizes, theoretical coherence, and the need for future replication with larger and more diverse samples to improve precision.
7.2. Tasks and procedures
We used a custom Stroop task implementing a CSPC manipulation (adapted from Crump et al., Reference Crump, Gong and Milliken2006). On each trial, participants saw a brief color-word prime (presented in black) followed by a colored square target; congruency was defined by the relationship between the prime word and the target color.
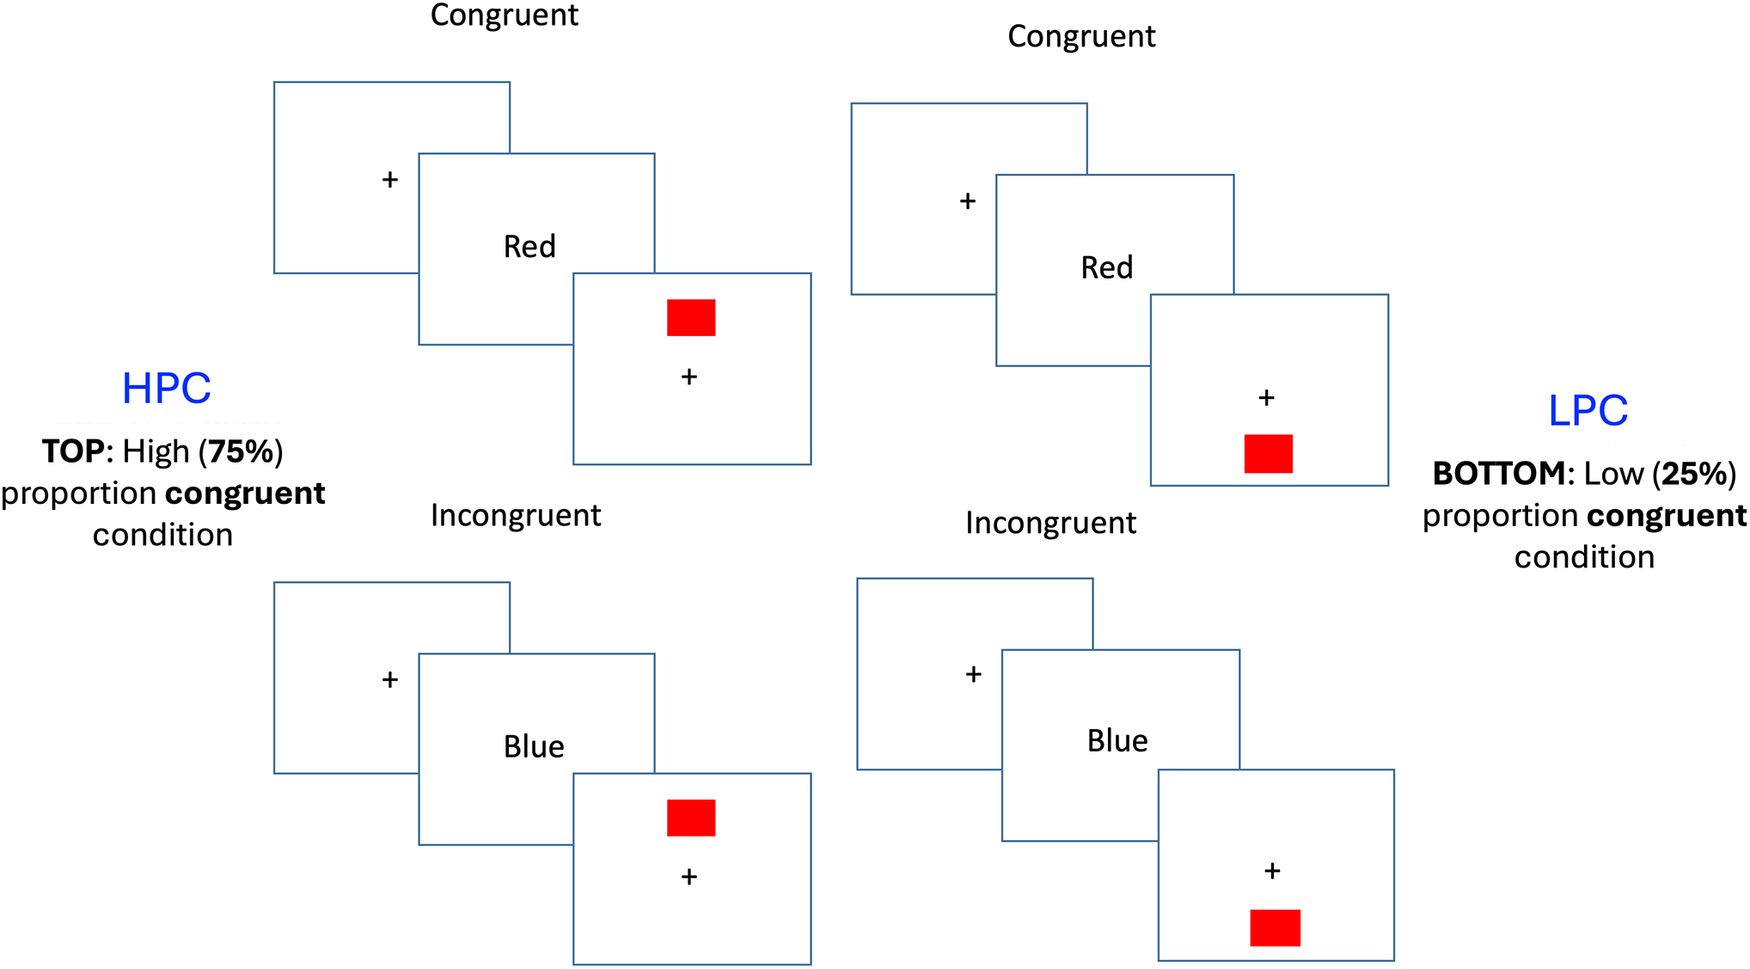
In the present study, participants first saw 48 practice trials with feedback on each trial (reaction time for current trial and mean accuracy thus far) presented for 1500 ms, followed by 384 experimental trials spread across four blocks (96 trials per block) without feedback. The overall proportion of congruent to incongruent trials in any given block was 50/50. However, the proportion of congruent trials in a given location was manipulated so that 75% of the trials that appeared above (or below – counterbalanced across participants) the fixation cross and 25% of trials that appeared below (or above – counterbalanced across participants) the fixation cross were congruent (see Figure 1), which created the HPC and LPC contexts, respectively.
Examples of four trial types used during the context-specific proportion congruency (CSPC) paradigm in the present study. When the color box appeared above the fixation cross, there was a 75% chance of encountering a congruent trial. When the color box appeared below the fixation cross, there was a 25% chance of encountering a congruent trial. The 75%/25% location mapping was counterbalanced across participants. Timing: fixation (1000 ms), blank (250 ms), prime word (100 ms), target until response (max 2000 ms).

Figure 1. Long description
The diagram is split into two vertical sections.
On the left, under the blue heading H P C, is the TOP High 75 percent proportion congruent condition. It contains two trial sequences.
* The top sequence, labeled Congruent, shows three frames: a fixation cross, the word Red, and a red color box positioned above a fixation cross.
* The bottom sequence, labeled Incongruent, shows three frames: a fixation cross, the word Blue, and a red color box positioned above a fixation cross.
On the right, under the blue heading L P C, is the BOTTOM Low 25 percent proportion congruent condition. It contains two trial sequences.
* The top sequence, labeled Congruent, shows three frames: a fixation cross, the word Red, and a red color box positioned below a fixation cross.
* The bottom sequence, labeled Incongruent, shows three frames: a fixation cross, the word Blue, and a red color box positioned below a fixation cross.
Like the original design, each trial started with a fixation cross for 1000 ms, followed by a blank screen for 250 ms, then a black-ink word prime (red, blue, green, yellow) for 100 ms, and finally a colored square target until a response was made or 2000 ms had elapsed. Participants were instructed to respond as quickly and accurately as possible to the ink color of the square with “z,” “x,” “n,” or “m” for “red,” “blue,” “green,” or “yellow.” Responses were made on a standard QWERTY keyboard: participants used the left hand for “z” and “x” and the right hand for “n” and “m.”
Participants first completed the CSPC task followed by the Language and Social Background Questionnaire (LSBQ; Anderson et al., Reference Anderson, Mak, Keyvani Chahi and Bialystok2018).
7.2.1. Language and social background questionnaire
Proficiency was assessed via self-ratings for each language on a 0–100 scale (0 = not at all proficient; 100 = native-like). The average L2 proficiency across speaking, understanding, reading, and writing was taken as the overall L2 proficiency score. Language usage was computed as the mean frequency of use across speaking, listening, reading, and writing, on a 0–4 scale. L2 AoA reflects the self-reported age (in years) at which participants began learning their L2. Language-switching frequency was calculated as the mean of LSBQ items assessing how often participants switch between their two primary languages across contexts (including with parents and family, with friends, and on social media) on a 0–4 scale.
7.3. Analyses
For each dependent variable (reaction times, accuracy, amplitudes), we ran a 2 (context: HPC, LPC) × 2 (congruency: congruent, incongruent) repeated-measures ANOVA. This analysis was followed by a 2 × 2 ANCOVA including second-language (L2) proficiency, L2 usage, L2 AoA, and switching frequency between languages as covariates in order to assess the effects of L2 experiences on context and congruency and any interactions. All four L2 experiences were added to each model to determine the unique contributions of each L2 experience on outcomes, unconfounded by variance associated with (i.e., independently from) the other L2 experiences.
7.3.1. Clarification of ANCOVA models and control of type I error
In each outcome model, the four bilingual predictors (L2 proficiency, L2 usage, L2 AoA, and L1/L2 switching frequency) were entered simultaneously as continuous between-participant predictors. To test moderation, we included each predictor’s interactions with context and congruency (context × predictor, congruency × predictor, and context × congruency × predictor) within the same omnibus model rather than running separate models per predictor. Because our focal interaction terms were motivated by a theoretically specified interpretive framework for relating behavioral and early/late ERP measures (Table 1), these terms were specified in advance to constrain interpretation and analytic flexibility. Importantly, this framework does not increase statistical power or sensitivity to detect effects but rather guides how observed effects are interpreted once detected; all inferences therefore remain subject to the same sample-size constraints.
Although interactions among bilingual experience variables are theoretically plausible, we did not include higher-order interactions among these predictors in the present models. Given the modest sample size (N = 50) and the number of predictors already included, such interactions would be underpowered and risk overfitting. Our approach instead focused on estimating the unique contributions of each experience dimension while controlling for shared variance. Future work with larger samples will be required to systematically test how these experience dimensions interact.
7.4. EEG acquisition
Electroencephalographic (EEG) activity was continuously recorded using the ActiveTwo Biosemi electrophysiology system (www.biosemi.com) from 64 Ag/AgCl scalp electrodes, along with four additional electrodes positioned at the outer canthi and below each eye to capture horizontal and vertical eye movements. Two extra electrodes—a common mode sense active electrode and a driven right leg passive electrode—served as replacements for conventional ground electrodes (www.biosemi.com/faq/cms&drl.htm).
The EEG signal was acquired with an open passband ranging from DC to 150 Hz and digitized at 512 Hz. Offline, the signal was bandpass filtered between 0.01–55 Hz and re-referenced to a common average reference. Signal processing and averaging were conducted using EEGLAB version 2023.1 (Delorme & Makeig, Reference Delorme and Makeig2023) and ERPLAB version 9.00 (Lopez-Calderon & Luck, Reference Lopez-Calderon and Luck2023) toolboxes within MATLAB version R2022a (MathWorks, 2023).
Stimulus-locked epochs were extracted from −200 to 800 ms relative to stimulus onset, using a 200 ms pre-stimulus baseline. EEG epochs were time-locked to onset of the colored square target. The −200 to 0 ms baseline period preceded prime onset and therefore does not include stimulus-evoked activity from either the prime or the target. Any electrode sites exhibiting high-frequency noise were interpolated, and trials contaminated by muscle tension or drift were excluded before applying eye artifact detection procedures. A simple voltage threshold of 400 μV was used for trial rejection. To correct for horizontal eye movements and blinks, as well as muscle movement and other artifacts, Independent Components Analysis (ICA; Makeig et al., Reference Makeig, Bell, Jung and Sejnowski1995) was applied. Finally, mean amplitudes were extracted for all time windows and analyses of interest.
Mean amplitudes were extracted on correct trials only. Amplitude windows and locations for the N2 and the conflict SP were chosen based on previous literature as well as examination of the grand averages (see Section 8 for more detail).
8. ResultsFootnote 3
De-identified data used in the present study for analyses and E-prime task files are openly available on Figshare at the following link: https://doi.org/10.6084/m9.figshare.32988152. Correlations between L2 variables appear in Figure 2. Note that even though proficiency and usage were significantly correlated, variance inflation factors were all less than 1.61, suggesting that collinearity was not an issue. As an exploratory check, we also examined a standardized proficiency–usage composite; however, we retained separate predictors because proficiency and usage showed dissociable associations with behavioral versus ERP outcomes.
Heatmap for correlations between different bilingual experiences in our sample. Note that even though proficiency and usage were significantly correlated, variance inflation factors (VIFs) were all less than 1.61, suggesting that collinearity was not an issue. * p < 0.05, ** p < 0.01, *** p < 0.001.

Figure 2. Long description
The heatmap consists of a 4 by 4 grid where the diagonal from top-left to bottom-right is empty. The variables on both axes are L 2 Proficiency, L 1 / L 2 Switching, L 2 A o A (Age of Acquisition), and L 2 Usage.
* Row 1, L 2 Proficiency: Correlates with L 1 / L 2 Switching at 0.272 (light purple), with L 2 A o A at negative 0.061 (pale pink), and with L 2 Usage at 0.492 with three asterisks (dark purple).
* Row 2, L 1 / L 2 Switching: Correlates with L 2 Proficiency at 0.272, with L 2 A o A at 0.053 (near white), and with L 2 Usage at 0.024 (near white).
* Row 3, L 2 A o A: Correlates with L 2 Proficiency at negative 0.061, with L 1 / L 2 Switching at 0.053, and with L 2 Usage at 0.047 (near white).
* Row 4, L 2 Usage: Correlates with L 2 Proficiency at 0.492 with three asterisks, with L 1 / L 2 Switching at 0.024, and with L 2 A o A at 0.047.
Darker purple shading indicates a stronger positive correlation, while pale pink indicates a weak negative correlation. The only statistically significant correlation shown is between L 2 Proficiency and L 2 Usage.
8.1. Behavioral
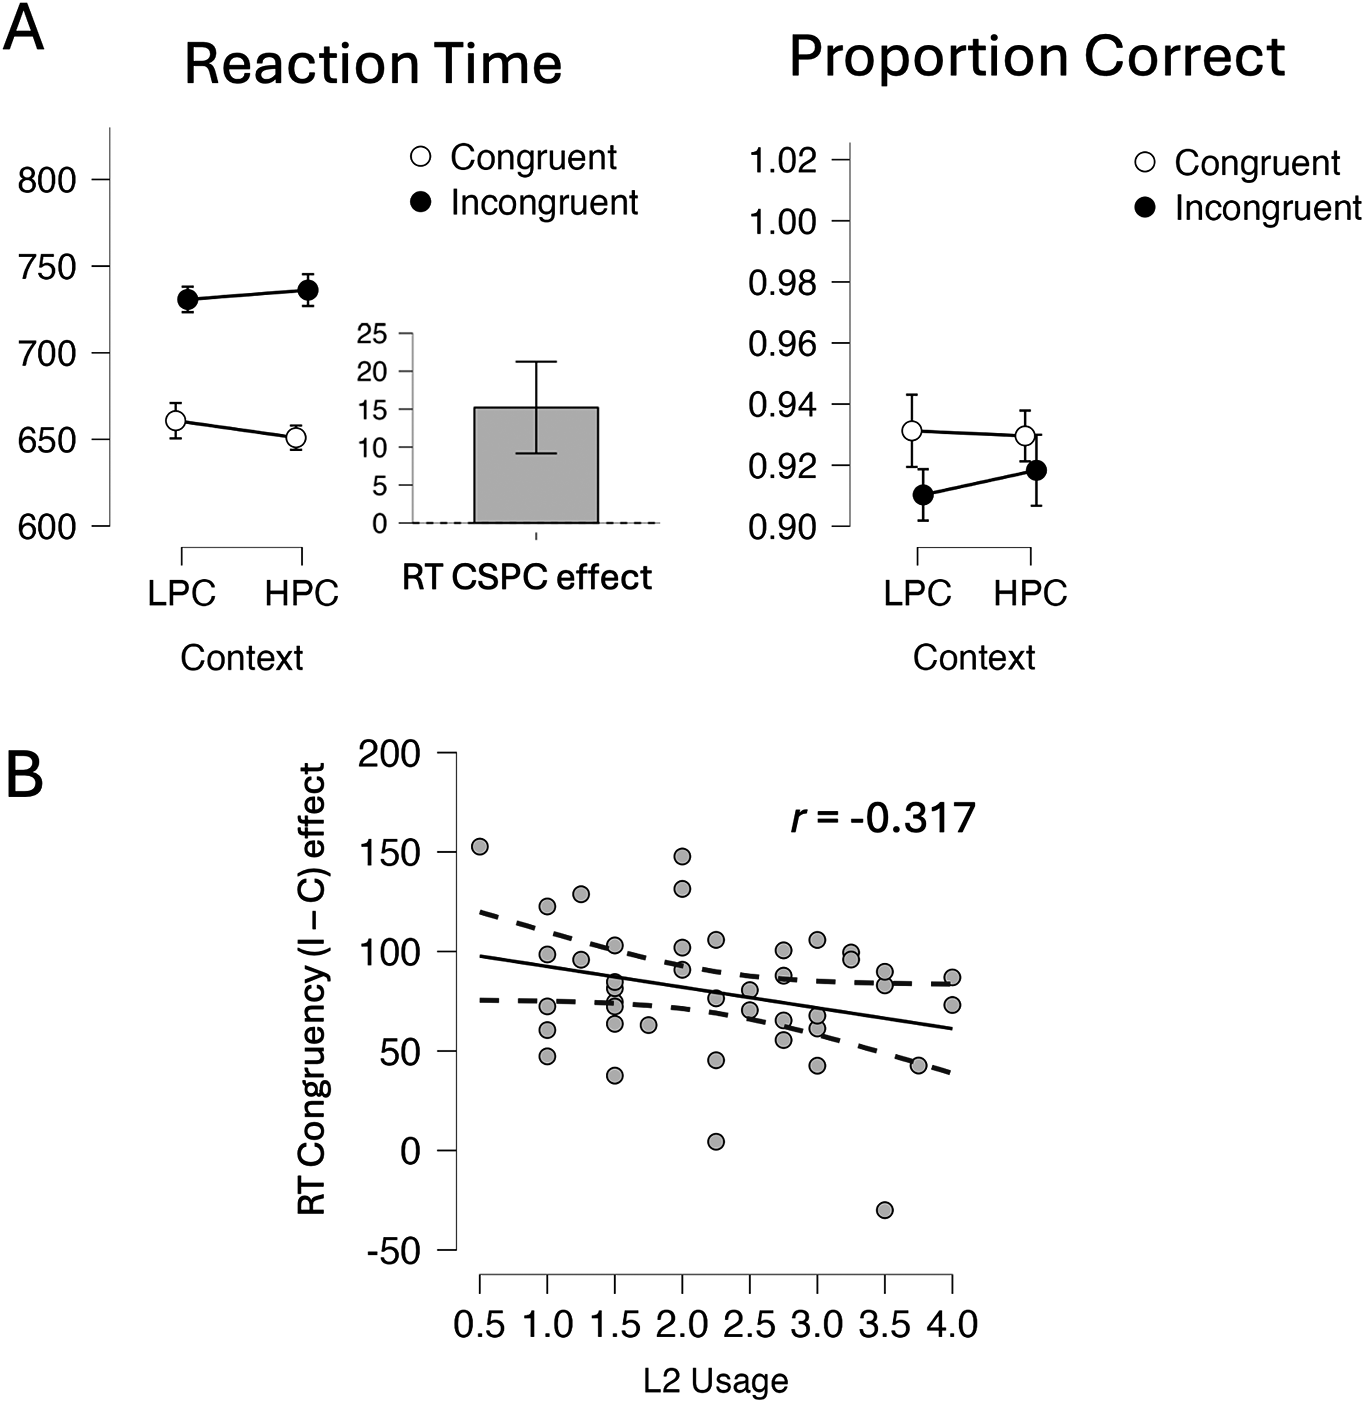
Figure 3 represents reaction times (RTs) and accuracy on the CSPC paradigm used in the present study.
Behavioral responses on the context-specific proportion congruency (CSPC) Stroop task. Panel A shows reaction times and proportion correct during the CSPC task. Panel B represents the correlation between the congruency effect (incongruent minus congruent trial RTs) and L2 usage. Error bars represent standard errors of the mean. LPC = Low Proportion Congruent, HPC = High Proportion Congruent.

Figure 3. Long description
Panel A contains three charts. On the left, a line graph for Reaction Time in milliseconds shows Incongruent trials (black circles) consistently higher than Congruent trials (white circles). Incongruent R T increases slightly from L P C to H P C, while Congruent R T decreases slightly. In the center, a bar chart titled R T C S P C effect shows a single gray bar at approximately 15. On the right, a line graph for Proportion Correct shows Congruent accuracy is higher than Incongruent accuracy. Incongruent accuracy increases from L P C to H P C, while Congruent accuracy remains stable. Panel B is a scatter plot with L 2 Usage on the x-axis (0.5 to 4.0) and R T Congruency (I minus C) effect on the y-axis (-50 to 200). A solid regression line shows a negative correlation with r equals -0.317, flanked by dashed confidence interval lines. Data points are gray circles concentrated between 50 and 150 on the y-axis.
8.1.1. Reaction times (RTs)
The ANOVA revealed a main effect of congruency F(1, 49) = 213.7, p < 0.001, with RTs to congruent trials faster than incongruent trials, and a significant interaction between context and congruency, F(1, 49) = 6.34, p = 0.015. The interaction is explained by the finding that the congruency effect (incongruent RT – congruent RT) was larger in the HPC than the LPC context, displaying a significant CSPC effect, as expected.
The ANCOVA with L2 experiences in the model revealed a significant congruency x L2 usage interaction, F(1, 37) = 4.13, p = 0.049. The interaction demonstrated that more L2 usage was associated with smaller congruency effects (Figure 3, bottom panel). No other effects reached significance (all ps > 0.18).
8.1.2. Accuracy
The ANOVA revealed a significant main effect of congruency, F(1, 49) = 7.82, p = 0.007, displaying more accurate responses for congruent than incongruent trials. No other effects reached significance (ps > 0.35).
The ANCOVA with L2 experiences in the model demonstrated no significant main effects or interactions (ps > 0.09).
Together with RT findings, no evidence of speed–accuracy tradeoffs was observed, allowing faster responding to be interpreted as reflecting more efficient task performance with all else being equal.
8.2. Neural: ERPs
8.2.1. N2
Figure 4 displays the N2 neural responses at electrode FCz (280–320 ms). The N2 component and its location were chosen based on previous work suggesting that the N2 plays a role in conflict monitoring and that it is commonly observed at FCz (e.g., Groom & Cragg, Reference Groom and Cragg2015; Hong et al., Reference Hong, Yang, Wang, Li, Ding and Sheng2021; Nieuwenhuis et al., Reference Nieuwenhuis, Yeung, Van Den Wildenberg and Ridderinkhof2003). Visual inspection of the grand average confirmed that the N2 was most robust at this location.
N2 ERP responses and its relationship with L2 proficiency on the context-specific proportion congruency (CSPC) Stroop task. Panel A represents the N2 ERP waveform. To facilitate visualization of condition differences, the figure to the right represents mean amplitudes during the N2 window. Panel B represents the correlation between L2 proficiency and the context effect (HPC–LPC). To facilitate interpretation, the figure to the right represents mean amplitudes by context and L2 proficiency group (median split into high and low groups for visualization purposes only). Error bars represent standard errors of the mean (line graphs) and 95% confidence intervals around the line of best fit (scatterplot).

Figure 4. Long description
Panel A contains a line graph of N 2 E R P waveforms at electrode F C z. The y-axis represents amplitude in microvolts from negative 2.0 to 1.0. The x-axis represents time in milliseconds from negative 100 to 600. Four lines represent conditions: L P C congruent correct (blue), H P C congruent correct (red), L P C incongruent correct (green), and H P C incongruent correct (magenta). A gray shaded area highlights the N 2 window between 250 and 350 milliseconds. To the right, a smaller line graph summarizes mean amplitudes for L P C and H P C contexts. Congruent trials (open circles) show a sharp decrease in negativity from L P C to H P C, while incongruent trials (filled circles) remain stable at approximately negative 1.45 microvolts.
Panel B contains a scatterplot on the left showing the correlation between L 2 proficiency (x-axis, 20 to 100) and the context effect amplitude (y-axis, negative 3 to 2 microvolts). A solid black regression line shows a positive linear increase with a Pearson r value of 0.345, flanked by blue dashed lines representing 95 percent confidence intervals. To the right, a line graph compares mean amplitudes for Low and High L 2 Proficiency Groups. For the Low group, the H P C context (black line) is more negative than the L P C context (gray line). For the High group, both contexts converge at a less negative amplitude of approximately negative 1.2 microvolts.
The ANOVA revealed a significant main effect of congruency, F(1, 49) = 7.41, p = 0.009, with greater N2 amplitudes for incongruent than congruent trials. This effect was qualified by an interaction between context and congruency, F(1, 49) = 8.51, p = 0.005, such that the congruency effect was significant in the LPC context, t(49) = 3.98, p < 0.001, but not in the HPC context (p = 1).
The ANCOVA with L2 experiences included in the model revealed a significant main effect of context, F(1, 37) = 11.72, p = 0.002, where N2 amplitudes were greater for HPC contexts than LPC contexts. Importantly, this effect was qualified by a significant context by L2 proficiency interaction, F(1, 37) = 5.00, p = 0.032. The interaction is explained by the finding that enhanced (more negative) N2 amplitudes for HPC than LPC were more evident in individuals with low L2 proficiency than in those with high L2 proficiency (r = 0.345). In other words, high L2 proficiency individuals showed similar N2 responses regardless of context. Furthermore, these N2 amplitudes were smaller (less negative) for high than low L2 proficiency individuals in the HPC but not the LPC context. For illustrative purposes in observing these patterns in Figure 4, we divided individuals into high and low L2 proficiency based on a median split. No other effects reached significance (ps > 0.30).
8.2.2. Conflict SP
Figure 5 displays the conflict SP wave neural responses at electrode POz (550–650 ms), which was chosen based on previous work examining the conflict SP (review in Larson et al., Reference Larson, Clayson and Clawson2014) and visual inspection of the grand average to confirm.
Conflict SP ERP responses and its relationship with L1/L2 switching frequency on the context-specific proportion congruency (CSPC) Stroop task. Panel A represents the conflict SP ERP waveform. To facilitate visualization of condition differences, the figure to the right represents mean amplitudes during the conflict SP window. Panel B represents the correlation between language-switching frequency and the context effect (HPC – LPC). To facilitate interpretation, the figure to the right represents mean amplitudes by context and switching-frequency group (median split into high and low groups for visualization purposes only). Panel C represents the correlation between the mean overall amplitude of the conflict SP and L2 AoA. To facilitate interpretation, the figure to the right represents mean amplitudes by L2 AoA group (median split into earlier and later groups for visualization purposes only). Error bars represent standard errors of the mean (line graphs) and 95% confidence intervals around the line of best fit (scatterplot).

Figure 5. Long description
Panel A: A line graph showing E R P waveforms at electrode P O z from 0 to 800 milliseconds. The y-axis represents microvolts from -1.0 to 3.0. Four lines represent L P C congruent (blue), H P C congruent (red), L P C incongruent (green), and H P C incongruent (magenta). A gray shaded region from 600 to 800 milliseconds highlights the conflict S P window. To the right, a line graph shows mean amplitudes for L P C and H P C contexts, with incongruent trials (black circles) consistently higher than congruent trials (white circles).
Panel B: A scatterplot showing the correlation between Switching Total (x-axis, 0 to 4) and Context Effect Amplitude (y-axis, -3 to 2). A black regression line shows a negative correlation (r equals -0.294) with blue dashed confidence intervals. To the right, a line graph compares H P C (black line) and L P C (gray line) across low and high switching groups, showing a convergence at the high switching end.
Panel C: A scatterplot showing the correlation between Age Learned L 2 (x-axis, 0 to 20) and Overall Amplitude (y-axis, -2 to 4). A black regression line shows a negative correlation (r equals -0.343) with blue dashed confidence intervals. To the right, a line graph shows mean amplitude decreasing from the Earlier L 2 A o A group to the Later L 2 A o A group.
The ANOVA revealed a significant main effect of congruency, F(1, 49) = 26.98, p < 0.001, with greater conflict SP amplitudes for incongruent than congruent trials. The effect of context, where HPC contexts showed greater conflict SP amplitudes than LPC contexts, approached, but did not reach, conventional levels of statistical significance, F(1, 49) = 3.53, p = 0.066.
The ANCOVA with L2 experiences added to the model revealed a main effect of L2 AoA, F(1, 37) = 4.92, p = 0.033, where earlier L2 AoA was associated with greater conflict SP, regardless (i.e., independent) of trial type (r = −0.343). The two-way interaction between language-switching frequency and context also approached, but did not reach, conventional levels of significance F(1, 37) = 3.50, p = 0.069. However, given that we had an a priori theoretical prediction for the interaction between language-switching frequency and context, we explored the term further. We also evaluated this term as one-tailed rather than two-tailed given our prediction, in which case the p-value reaches conventional levels of significance (p = 0.035). The interaction is explained, as predicted, by the finding that more switching between languages predicted smaller context effects (r = −0.294, see Figure 5). No other effects reached significance (ps > 0.09).
9. Discussion
The present study examined the neural correlates of different bilingual experiences on conflict processing during a CSPC (Crump et al., Reference Crump, Gong and Milliken2006) paradigm. We found that second language (L2) usage was predictive of behavioral adaptations, that L2 proficiency levels changed how contextual cues were processed at the N2, and that L2 AoA and language-switching frequency were predictive of the conflict slow wave potential (SP). These findings have important implications for theoretical discussions surrounding how individual bilingual experiences contribute to domain-general context and conflict processing.
Reaction time (RT) data demonstrated that larger congruency effects were observed in the high proportion congruency (HPC) conditions than the low proportion congruency (LPC) conditions, replicating previous work using a CSPC paradigm (Crump et al., Reference Crump, Gong and Milliken2006, Reference Crump, Brosowsky and Milliken2017; Jiménez-Moya et al., Reference Jiménez-Moya, Rodríguez-Bailón and Lupiáñez2018). This finding demonstrates the ability of individuals to use contextual cues to adjust attentional demands on-the-fly. Importantly, the ability to adjust attentional demands based on conflict was predicted by L2 usage. While the CSPC effect is typically used to assess context-sensitive adjustments in attentional control, the observed interaction between L2 usage and the congruency effect suggests that using a second language may influence conflict resolution at a broader level. Rather than being limited to context-driven mechanisms, bilinguals may develop a more generalized ability to resolve cognitive conflict across varying task demands. This interpretation aligns with prior research indicating that bilingualism enhances domain-general EF mechanisms, which may not always manifest as changes in context-specific adaptation effects (Kousaie & Phillips, Reference Kousaie and Phillips2012; Morales et al., Reference Morales, Yudes, Gómez-Ariza and Bajo2015).
Greater L2 usage was associated with smaller RT congruency effects, highlighting the importance of continual use of a second language in efficiently processing conflict. Previous work has shown that L2 usage is particularly important for structural brain outcomes, including both grey and white matter adaptations in the brain (DeLuca, Reference DeLuca, Rothman, Bialystok and Pliatsikas2019a; DeLuca et al., Reference DeLuca, Voits, Ni, Carter, Rahman, Mazaheri, Krott and Segaert2024; Grundy et al., Reference Grundy, Anderson and Bialystok2017a; Pliatsikas, Reference Pliatsikas2020). For example, DeLuca et al. (Reference DeLuca, Rothman and Pliatsikas2019b) demonstrated using a longitudinal design that individuals immersed in and continually using a second language showed a reshaping of the caudate nucleus. The caudate nucleus is a brain region involved in adaptive learning, and modifying future behaviors based on past experiences (Packard & Knowlton, Reference Packard and Knowlton2002). In line with their results, the present study found smaller congruency effects with more L2 usage, suggesting that more L2 usage is associated with more adaptive and efficient learning.
The neural data for the N2 and the conflict SP further demonstrate the importance of second-language experiences in adaptations to brain processing of conflict and contextual cues. The N2 was larger for incongruent than congruent trials, reflecting increased attention to the conflicting, but irrelevant, words, as expected (review in Larson et al., Reference Larson, Clayson and Clawson2014). This effect was contextualized by an interaction with context, such that the congruency effect was only present for the LPC, but not the more difficult HPC condition. In the HPC context, participants likely start paying attention to task-irrelevant features (i.e., the words) of the trials, given that these features usually benefit performance. Importantly, greater L2 proficiency was associated with more consistent N2 amplitudes across contexts. Individuals with lower L2 proficiency showed greater (more negative) N2 brain responses during a Stroop task when the task was in the more difficult HPC context compared to the LPC context. However, N2 amplitudes did not change based on context for those high in L2 proficiency. Within the present framework, this pattern is consistent with more efficient early control engagement for highly proficient individuals, insofar as comparable behavioral performance is achieved with reduced need for context-dependent modulation of the N2 – less proficient bilinguals might adjust more on-the-fly when entering a high-conflict context.
Related work supports the idea that specific bilingual experiences map onto distinct neural control profiles. For example, Carter et al. (Reference Carter, DeLuca, Segaert, Mazaheri and Krott2023) reported that individual differences in bilingual experience were linked to systematic variation in conflict-related ERPs (including N2 and later components), and that neural control architecture helped explain experience–behavior associations. This converges with the present findings that different experience dimensions relate to different stages of control and helps contextualize why effects can differ across samples and measures.
Given that bilinguals frequently engage in language switching and conflict resolution from non-target languages, these experiences may contribute to enhanced neural efficiency in handling contextual cues (Abutalebi et al., Reference Abutalebi, Della Rosa, Green, Hernandez, Scifo, Keim, Cappa and Costa2012; Grundy et al., Reference Grundy, Anderson and Bialystok2017a). The observed effects on the N2 and conflict SP suggest that different aspects of bilingual experience – such as proficiency, usage, switching frequency, and L2 AoA – play distinct roles in shaping both early conflict monitoring and later-stage attentional control adjustments. While previous work has primarily focused on how bilingualism influences EF at the behavioral level, our results provide neurophysiological evidence that bilingual experiences shape neural responses to conflict monitoring and attentional control dynamically across time. Future research should continue to disentangle how different bilingual experiences modulate attentional control across various EF tasks and neural markers. These findings are also in line with our previous work with different paradigms and samples showing that bilingualism contributes to more rapid disengagement of attention from irrelevant information (Grundy, Reference Grundy2020; Grundy & Bialystok, Reference Grundy and Bialystok2018; Grundy et al., Reference Grundy, Chung-Fat-Yim, Friesen, Mak and Bialystok2017b). While traditional models of attentional control suggest that larger conflict adaptation effects indicate stronger cognitive control (Botvinick et al., Reference Botvinick, Braver, Barch, Carter and Cohen2001; Egner, Reference Egner2007; Kerns et al., Reference Kerns, Cohen, MacDonald, Cho, Stenger and Carter2004), recent findings challenge this assumption. Egner (Reference Egner2008) demonstrated that with experience, individuals shift toward a more stable control strategy that reduces the need for transient adaptation effects. Consistent with this, Grundy et al. (Reference Grundy, Chung-Fat-Yim, Friesen, Mak and Bialystok2017b) found that bilinguals exhibit smaller SCEs, which they interpreted as evidence of a more efficient control process that does not rely as heavily on trial-level adjustments. The present findings support this view, as bilinguals with greater L2 proficiency showed reduced context sensitivity in N2 amplitudes (i.e., a smaller N2 context effect), suggesting that they may engage a more stable form of conflict resolution rather than relying on transient control mechanisms. Being able to rapidly disengage attention from the previous (and no-longer-relevant) stimulus allows more consistent and efficient responses over time. The present study extends this by showing that L2 proficiency was associated with this pattern of more consistent responses, suggesting a possible efficiency pattern.
Certain bilingual experiences were associated with conflict SP amplitudes as well. For all participants, incongruent trials elicited larger conflict SP amplitudes than congruent trials. This pattern is consistent with more attentional control being applied to conflicting trials after initial detection at the N2 (review in Larson et al., Reference Larson, Clayson and Clawson2014). The conflict SP is a late-stage neural marker of post-conflict control, reflecting the sustained engagement of attentional resources to resolve conflict (Larson et al., Reference Larson, Clayson and Clawson2014; West, Reference West2003). Studies have found that diminished conflict SP amplitudes are linked to attentional control deficits. For example, individuals with TBI exhibit reduced conflict SP amplitudes, suggesting an impaired ability to sustain attentional control following conflict detection (Larson et al., Reference Larson, Kaufman and Perlstein2009b). This aligns with findings from other late-stage ERP components, such as the Late Positive Component, which also shows reduced amplitudes in individuals with fewer available cognitive resources (Raynal et al., Reference Raynal, Schipper, Brandner, Ruggeri and Barral2024). Given the similarities between the conflict SP and LPC as indices of sustained attention, combined with the fact that individuals with worse attentional control show smaller conflict SPs, our interpretation is that larger conflict SP amplitudes reflect greater available attentional resources. More support for this claim comes from Liu et al. (Reference Liu, Xiao and Shi2016), showing that individuals with higher IQ had larger conflict SP amplitudes than those with lower IQ, as well as smaller conflict adaptation effects on a flanker task. Although the switching frequency by context interaction in the conflict SP was modest (one-tailed significance), the direction was consistent with our a priori prediction; we therefore interpret it cautiously as preliminary evidence.
Both language-switching frequency and L2 AoA moderated conflict SP amplitudes. More frequent language-switching predicted smaller differences between LPC and HPC contexts for the conflict SP. In other words, people who frequently switch between their first and second languages showed less adjustment in attentional control based on contextual cues compared to those who switch rarely between their languages. This finding is in line with our predictions based on the dense code-switching environmental demands that Green and Abutalebi introduced (2013). People who switch often between languages are usually immersed in environments in which contextual cues are not as necessary (i.e., dense code-switching environments), given that everyone (or most) in the environment know both languages, and adjustments to control are not needed. Our study demonstrates that this pattern was borne out on a domain-general EF task. We argue that language-switching frequency contributes to domain-general changes to cues signaling a need for changes to attentional control.
On the other hand, earlier L2 AoA was associated with to greater conflict SP amplitudes, regardless of trial type. This result suggests that people differ in their baseline levels of conflict SP resources depending on the age at which they learned a second language. Those who acquired their second language earlier seem to have more attentional resources available for all types of trials. A pure cost account would predict either (a) a behavioral cost (e.g., larger conflict effects or slower responses) or (b) selective increases in conflict-related activity (i.e., larger conflict SP effects). Neither pattern was observed: performance was unchanged and the SP increase was not specific to conflict. This pattern is therefore more consistent with a difference in baseline sustained engagement (i.e., available attentional resources) than with compensatory effort. This pattern was reflected in larger SP amplitudes that did not differ across trial types, suggesting increased sustained engagement rather than changes in conflict-specific processing. Within the framework of Table 1, this configuration aligns with an overall-amplitude pattern (comparable behavior, no change in N2, increased SP) and is interpreted here as reflecting capacity rather than inefficiency because it lacks the behavioral or conflict-specific signatures expected under a cost-based account. Given that the brain is more malleable in early development (review in Huttenlocher, Reference Huttenlocher2009), our findings suggest that learning a second language at a younger age enhances neural plasticity and increases the resources available for attentional control during early development.
Studies have shown that L2 AoA is associated with structural changes in the brain (Anderson et al., Reference Anderson, Yurtsever, Fisher-Skau, Cherep, MacPhee, Luk and Grundy2024; DeLuca et al., Reference DeLuca, Rothman, Bialystok and Pliatsikas2019a; Mechelli et al., Reference Mechelli, Crinion, Noppeney, O’Doherty, Ashburner, Frackowiak and Price2004), and our study adds to this body of evidence by showing that L2 AoA is related to domain-general functional processing changes to the brain as well. In particular, the conflict SP component, which reflects later-stage sustained attentional control, was enhanced in individuals with earlier L2 acquisition – suggesting more attentional resources available in those with early bilingual experience. This aligns with cognitive reserve frameworks proposing that lifelong cognitively demanding experiences, including bilingualism, help preserve executive functioning despite aging or neuropathology. Bialystok (Reference Bialystok2021) outlines evidence that bilinguals exhibit delayed onset of dementia symptoms, preserved cognition despite neuropathology, and slower decline in late-stage aging than monolinguals. Several meta-analyses support these conclusions (Anderson et al., Reference Anderson, Hawrylewicz and Grundy2020; Brini et al., Reference Brini, Sohrabi, Hebert, Forrest, Laine, Hämäläinen, Karrasch, Peiffer, Martins and Fairchild2020; Paulavicius et al., Reference Paulavicius, Mizzaci, Tavares, Rocha, Civile, Schultz, Pinto and Trevisani2020). Neuroimaging work further supports this idea; bilinguals show increased gray matter density in regions tied to attentional control (e.g., Abutalebi et al., Reference Abutalebi, Canini, Della Rosa, Green and Weekes2015) and even volumetric renormalization of the hippocampus, a critical memory center, following a U-shaped pattern with extended L2 engagement (Gallo et al., Reference Gallo, Voits, Rothman, Abutalebi, Shtyrov and Myachykov2025). Gallo et al. (Reference Gallo, Kubiak and Myachykov2022) report that high L2 proficiency and L2 AoA both predict executive performance beyond traditional reserve-enhancing factors like education or physical activity. Our data extend this literature by identifying specific ERP signatures – namely, larger conflict SP amplitudes – that may reflect greater attentional capacity in individuals with earlier and more intense bilingual experience. These neurophysiological markers provide evidence that the timing and nature of bilingual experience shape the efficiency and flexibility of attentional control systems across the lifespan. Some may argue that the data presented in the present manuscript, and any cross-sectional studies, do not speak to causality and that confounds (SES, IQ, etc.) may be driving the observed effects. However, there are now several longitudinal studies that support the view that bilingualism enhances EFs. For example, Bak et al. (Reference Bak, Long, Vega-Mendoza and Sorace2016) conducted a randomized controlled trial in which older adults were assigned to either a second-language learning program or a control condition. Results demonstrated that those in the language-learning group showed significant improvements in EFs. Other training-based studies also provide evidence that second-language learning induces changes to EFs. For example, Pfenninger and Polz (Reference Pfenninger and Polz2018) showed that older adults engaging in foreign language learning exhibited improvements in EF, autonomy, and communicative skills, suggesting that bilingual engagement may support cognitive resilience. Wong et al. (Reference Wong, Ou, Pang, Zhang, Tse, Lam and Antoniou2019) demonstrated that six months of foreign language learning boosted cognitive performance, and that this boost was maintained three months later. Meltzer et al. (Reference Meltzer, Kates Rose, Le, Spencer, Goldstein, Gubanova, Lai, Yossofzai, Armstrong and Bialystok2023) provided evidence that app-based second-language learning yielded similar EF benefits to traditional brain-training programs, further supporting the role of bilingual engagement in maintaining cognitive function. In an ERP study, Sullivan et al. (Reference Sullivan, Janus, Moreno, Astheimer and Bialystok2014) demonstrated that even early-stage second-language learning leads to enhanced executive control, aligning with our findings regarding the modulation of the N2 and conflict SP responses. Our results align with frameworks that differentiate an early conflict-monitoring stage and a later compensatory control stage – and show that bilingual experiences can uniquely fine-tune each of these stages independently.
9.1. Potential limitations
A reviewer of a previous version of this paper noted that patterns we characterize as efficient (e.g., smaller CSPC or SCE effects in experienced bilinguals) are also observed in clinical populations (e.g., brain injury, developmental disorders). However, multiple studies challenge the assumption that larger conflict “adaptation” effects are indicative of superior attentional control.
Most research on conflict adaptation (SCE) examines whether or not an effect is present rather than its magnitude. For instance, theories based on cognitive control (Botvinick et al., Reference Botvinick, Braver, Barch, Carter and Cohen2001), feature integration (Hommel et al., Reference Hommel, Proctor and Vu2004), contingency learning (Schmidt & De Houwer, Reference Schmidt and De Houwer2011), and repetition expectancy (Duthoo et al., Reference Duthoo, Abrahamse, Braem and Notebaert2014) explore the conditions that either elicit or eliminate conflict adaptation by modifying task parameters to support their respective frameworks. Control-based theories argue that conflict adaptation reflects top-down control adjustments in response to conflict signals (e.g., Botvinick et al., Reference Botvinick, Braver, Barch, Carter and Cohen2001), while feature integration theories propose that stimulus–response bindings are episodically retrieved across trials (e.g., Hommel et al., Reference Hommel, Proctor and Vu2004). For example, Botvinick et al. (Reference Botvinick, Braver, Barch, Carter and Cohen2001) suggest that “conflict monitoring serves to translate the occurrence of conflict into compensatory adjustments in control” (p. 625), meaning that conflict adaptation-related processes are engaged contextually as needed. However, research on the relative magnitude of conflict adaptation rather than its presence or absence suggests that smaller conflict adaptation effects develop over time with more efficient processing.
Conflict adaptation effects get smaller with practice, suggesting that smaller effects may reflect increased cognitive efficiency rather than impairment (Mayr & Awh, Reference Mayr and Awh2009; van Steenbergen et al., Reference van Steenbergen, Haasnoot, Bocanegra, Berretty and Hommel2015). Egner et al. (Reference Egner, Ely and Grinband2010) found that conflict adaptation effects get smaller as response-to-stimulus intervals lengthen, allowing more time for performance adjustments – contrary to the expectation that larger conflict adaptation effects indicate greater adaptability. Individuals with higher intelligence show smaller conflict adaptation effects, implying that more stable control strategies may be characteristic of higher-functioning individuals, not just clinical populations (Liu et al., Reference Liu, Xiao and Shi2016). Thus, rather than mirroring cognitive deficits, the smaller conflict adaptation effects observed in bilinguals may reflect a more stable attentional strategy (Grundy & Bialystok, Reference Grundy and Bialystok2018; Grundy et al., Reference Grundy2020).
While larger sample sizes generally offer increased power for detecting higher-order interactions, the present sample (N = 50) is on the higher end of what is typical for ERP studies of cognitive control, as documented in large-scale meta-analyses showing that many ERP investigations use substantially smaller samples and are often underpowered for similar effects (Clayson et al., Reference Clayson, Carbine, Baldwin and Larson2019; Szűcs & Ioannidis, Reference Szűcs and Ioannidis2017). Importantly, the theoretical motivation of our analyses constrains interpretation rather than compensating for limited statistical power; accordingly, we emphasize effect sizes, pattern consistency, and transparency regarding limitations, while acknowledging that larger samples will be important for improving precision and replication. Future research should seek to replicate these effects with larger samples to further confirm the robustness of these findings. An important direction for future research will be to examine interactions among bilingual experience dimensions, as different combinations of proficiency, usage, acquisition timing, and switching may give rise to distinct control profiles.
10. Conclusions
The present study examined how different bilingual experiences relate to neural and behavioral indicators of attentional control in a CSPC Stroop paradigm (Crump et al., Reference Crump, Gong and Milliken2006). We found that individual differences in bilingual experience – specifically L2 usage, L2 proficiency, L2 AoA, and language-switching frequency – each showed unique associations with performance and ERPs. In sum, more frequent L2 usage predicted smaller behavioral conflict effects; higher L2 proficiency was linked to more stable (context-invariant) N2 responses; earlier L2 AoA was associated with larger conflict SP amplitudes (greater sustained attentional resources); and frequent language switching was associated with reduced context-based modulation of the conflict SP.
These results extend our understanding of how bilingualism influences attentional control by demonstrating that not all bilinguals exhibit the same pattern of cognitive and neural adaptation. Instead, specific facets of bilingual experience play distinct roles. Frequent L2 use was related to a general performance boost (reduced Stroop interference), suggesting that active engagement in a second language may strengthen domain-general conflict resolution skills. High L2 proficiency was associated with a refined neural control strategy at early processing stages: proficient bilinguals did not need to up-regulate conflict monitoring (N2) in the high-conflict context to the same extent as less proficient bilinguals did. One interpretation is that greater proficiency confers a flexibility or efficiency in engaging control – proficient bilinguals might maintain a moderate level of monitoring that is effective across contexts, whereas less proficient bilinguals must adjust more when entering a high-conflict context. Early L2 AoA was linked to a generally more robust conflict SP, indicating greater overall attentional resources available during conflict resolution. This could reflect long-term neuroplastic effects of early bilingual exposure on frontal–parietal control networks. This contrasts with the pattern seen for proficiency, where reduced N2 modulation suggests greater efficiency in early conflict monitoring. In combination, these findings indicate that different bilingual experiences may fine-tune control mechanisms through distinct neural strategies – some emphasizing economy of engagement, others emphasizing the amount of attentional resources developed. In line with these observations, several resting-state fMRI studies show enhanced functional connectivity between frontal and parietal regions in bilinguals – and importantly, this connectivity is greater in those who acquired their L2 earlier, even when matched for proficiency (Berken et al., Reference Berken, Chai, Chen, Gracco and Klein2016). Finally, frequent language switching was associated with an attenuated context effect in the SP, suggesting that those who habitually switch languages apply a more uniform level of sustained control regardless of context. This fits with our hypothesis that constant context switching in language could reduce sensitivity to contextual cues on non-linguistic attentional control tasks. Together, these findings highlight how individual bilingual experiences fine-tune neural mechanisms of control in distinct and interpretable ways.
Data availability statement
All behavioral and EEG data used for analyses, and E-prime program for data collection are available on Figshare.com via the following link: 10.6084/m9.figshare.32988152.
Funding statement
The authors received no specific grant from any funding agency in the public, commercial, or not-for-profit sectors.
Competing interests
The authors declare no conflicts of interest.





 Open access

