





Highlights
-
• Chinese EFL learners showed an N400, reflecting automatic incongruity detection.
-
• Only the intense exposure learners showed a P600, suggesting reinterpretation.
-
• Limited exposure learners showed detection but reduced humor reinterpretation.
-
• L2 exposure intensity modulates the time course of incongruity resolution.
-
• The findings support a conditioned two-stage model of L2 humor processing.
1. Introduction
Humor is a multifaceted communicative phenomenon with interpersonal, social, and cognitive functions, yet it is also highly variable (Attardo, Reference Attardo1994; Dynel, Reference Dynel2025; Dynel et al., Reference Dynel, Brock and de Jongste2016). In interaction, humor can build affiliation, manage face, reduce tension, and signal group membership, but it can also misfire when the sender and the receiver do not share the linguistic and cultural assumptions needed to “get the joke” (Attardo, Reference Attardo1994, Reference Attardo2001; Martin & Ford, Reference Martin, Ford, Martin and Ford2018; Vaid et al., Reference Vaid, Hull, Heredia, Gerkens and Martinez2003).
Within humor research, a common distinction is drawn between nonverbal humor (e.g., visual gags) and verbal humor. Verbal humor makes full use of internal mechanisms of language through rhetorical devices, logical arrangements, and unconventional combinations of words and sentences (Raskin, Reference Raskin1985; Ritchie, Reference Ritchie2004, Reference Ritchie2018). It often relies on pragmatic inferencing, including implicature and the strategic flouting or exploitation of conversational maxims, which prompts audiences to infer unstated meanings, reinterpret utterances in context, and resolve interpretive incongruities (Dynel, Reference Dynel2008, Reference Dynel2017a, Reference Dynel2017b). Because understanding verbal humor involves managing ambiguity and reinterpreting linguistic and pragmatic information rapidly, it provides a useful test case for models of real-time language comprehension. For neurocognitive research, verbal humor also provides an important methodological advantage. Many joke formats provide a relatively discrete “trigger” point, frequently the final word or punchline, at which an initially plausible interpretation becomes unstable, and an alternative humorous construal becomes available (Bartolo et al., Reference Bartolo, Benuzzi, Nocetti, Baraldi and Nichelli2006; Li et al., Reference Li, Wang, Liu, Liu and Wang2025; Schnell et al., Reference Schnell, Varga, Tényi, Simon, Hajnal, Járai and Herold2016; Zheng & Lemhöfer, Reference Zheng and Lemhöfer2019). This feature makes verbal humor well-suited to event-related potentials (ERPs), which track comprehension with millisecond temporal resolution and can distinguish earlier meaning-access or integration costs from later reinterpretation (Nieuwland & Van Berkum, Reference Nieuwland and Van Berkum2005; Payne et al., Reference Payne, Ng, Shantz, Federmeier, Federmeier and Huang2020).
A widely used cognitive account of verbal humor comprehension is the Incongruity – Resolution Theory (Suls, Reference Suls, Goldstein and McGhee1972, Reference Suls, McGhee and Goldstein1983). On this view, humor often unfolds in stages. First, the comprehender detects an incongruity between the incoming element (often the punchline) and the interpretation most strongly supported by the preceding context. Second, the comprehender engages in processes that enable reinterpretation so that the utterance becomes coherent under an alternative interpretation, which can then be evaluated as humorous (Yus, Reference Yus2017). Although not all humor necessarily follows this sequence, the framework is influential because it yields predictions about time course and about which stimulus positions should provoke comprehension difficulty (Ku et al., Reference Ku, Feng, Chan, Wu and Chen2017; Vaid et al., Reference Vaid, Hull, Heredia, Gerkens and Martinez2003).
To investigate the neurocognitive mechanisms of humor interpretation, it is essential to situate Suls’s (Reference Suls, Goldstein and McGhee1972) two-stage Incongruity-Resolution (IR) model within the broader landscape of cognitive accounts, such as the concurrent activation view (Attardo & Raskin, Reference Attardo and Raskin1991), the three-stage model (Attardo, Reference Attardo1997), and the selective activation theory/graded salience hypothesis (Giora, Reference Giora1997). These frameworks offer profound insights into the underlying representational and semantic mechanics of jokes. For instance, Attardo and Raskin (Reference Attardo and Raskin1991) emphasize the simultaneous activation and forced switching of opposed semantic scripts, while Giora (Reference Giora1997) highlights how the cognitive system navigates between highly salient and less salient meanings. These representational models are complementary to Suls’s (Reference Suls, Goldstein and McGhee1972) temporal framework. While Attardo’s and Giora’s theories excel at delineating what semantic operations occur (e.g., script opposition, salience suppression), Suls’s model helps specify when these processes occur chronologically. For the current ERP study, Suls’s two-stage model provides a macro-level neurocognitive interface for linking humor-related semantic operations to their temporal neural dynamics. Specifically, the first stage involves the concurrent activation of competing scripts and the detection of script opposition (Attardo & Raskin, Reference Attardo and Raskin1991). The resolution stage then entails the selective activation of the non-salient meaning (Giora, Reference Giora1997), often through a demanding process of frame-shifting or conceptual blending, which enables the audience to reinterpret the utterance and resolve the incongruity (Coulson & Kutas, Reference Coulson and Kutas2001; Jabłońska-Hood, Reference Jabłońska-Hood2015).
While this frame-shifting or conceptual blending process during resolution is widely characterized as effortful, the source of this processing demand and its functional payoff remain to be specified. Relevance Theory offers a cognitive-pragmatic account that speaks to this question. According to the theory, comprehension is guided by a search for optimal relevance, an interpretation that yields adequate cognitive effects without unjustifiably high processing effort (Sperber & Wilson, Reference Sperber and Wilson1996; Wilson & Sperber, Reference Wilson, Sperber, Horn and Ward2006). In humorous discourse, the punch line typically renders the initially accessible interpretation inconsistent or insufficient, prompting the comprehender to retrieve additional contextual assumptions and derive an alternative interpretation that restores coherence. Incongruity is thus not itself sufficient to produce humor; it functions as a cue for further inferential processing in the search for rewarding contextual effects (Curcó, Reference Curcó1995; Yus, Reference Yus, Ruiz-Gurillo and Ortega2013). When this reinterpretation succeeds, the resulting cognitive effects may offset the additional processing effort invested during resolution and contribute to amusement. This account thus provides a processing-based rationale for the resolution stage posited by Suls’s (Reference Suls, Goldstein and McGhee1972) model: relative to conventional or predictable endings, humorous endings may demand greater inferential effort during resolution and correspondingly longer processing time.
ERP research has been central in operationalizing such staged accounts by mapping these theoretically defined processing stages onto temporally specific neural responses. Coulson and Kutas (Reference Coulson and Kutas2001), for example, reported electrophysiological differences between jokes and nonjokes and argued that humor comprehension involves both an early disruption and later processes consistent with reinterpretation or integration. More broadly, ERP studies frequently report an early processing cost, often discussed in relation to the N400 family and sensitive to semantic integration difficulty and contextual expectancy, followed by later positivities that have been linked to reanalysis or meaning revision (Ku et al., Reference Ku, Chang and Chen2020; Kutas & Federmeier, Reference Kutas and Federmeier2011). Nevertheless, the presence, magnitude, and scalp distribution of these effects vary across studies, implying that stimulus structure, baseline design, and task demands shape which sub-processes are most visible in the ERP (Mayerhofer & Schacht, Reference Mayerhofer and Schacht2015; Vrticka et al., Reference Vrticka, Black and Reiss2013).
Despite progress in first-language (L1) research, time-resolved evidence on second language (L2) verbal humor comprehension remains comparatively limited. Actually, research into L2 verbal humor is significant because humor comprehension can serve as an important indicator of advanced L2 communicative competence (Morain, Reference Morain and Alatis1991). However, it remains a major challenge even for proficient learners (Bell, Reference Bell2009; Davies, Reference Davies2003; Schmitz, Reference Schmitz2002). Failing to grasp L2 humor can lead to social exclusion, embarrassment, and a sense of “reduced personality” in cross-cultural interactions (Bell & Attardo, Reference Bell and Attardo2010). This gap also matters because L2 verbal humor is a theoretically informative case of non-literal and pragmatic language processing in a second language, alongside related phenomena such as irony and indirectness (Bell & Pomerantz, Reference Bell, Pomerantz and Taguchi2019; Ellis et al., Reference Ellis, Zhu, Shintani and Roever2021; Gibbs et al., Reference Gibbs, Samermit and Karzmark2018). In such cases, comprehenders must go beyond literal decoding to recover speaker meaning, manage competing interpretations, and integrate contextual cues into a coherent discourse representation. These demands can be challenging for L2 users, who may show less automatic lexical access, slower semantic integration, and reduced sensitivity to subtle contextual constraints under time pressure (Ellis et al., Reference Ellis, Zhu, Shintani and Roever2021; Ezrina & Valian, Reference Ezrina and Valian2023; Kim & Taguchi, Reference Kim and Taguchi2015; Neff & Dewaele, Reference Neff and Dewaele2023). Humor comprehension is also time-critical because the punchline typically triggers a rapid shift from an initially coherent “default” interpretation to a competing, humorous one. Verbal humor comprehension therefore depends not only on what learners know, but on how efficiently they can access lexical-semantic information, detect the incongruity, and suppress or revise the initial interpretation to accommodate the intended meaning.
Unlike naturalistic exposure, instructed L2 exposure intensity is characterized not only by the concentration and distribution of instructional hours (Collins & White, Reference Collins and White2011) but also by the quality and nature of the input provided within that time frame (Ellis, Reference Ellis2005; Muñoz, Reference Muñoz2008). Exposure intensity in classroom contexts should matter for the L2 verbal humor comprehension process. First, intensive exposure may accelerate automatization of lower-level decoding and lexical access, reducing the cognitive cost of constructing the initial interpretation and freeing resources for incongruity detection at the punchline (Segalowitz, Reference Segalowitz2010). Second, sustained engagement with form-meaning mapping under instructional monitoring may strengthen learners’ ability to regulate competition between alternatives (e.g., inhibiting an L1-driven or literal analysis), a control demand that is central to resolving jokes rather than treating them as simple anomalies (Green & Abutalebi, Reference Green and Abutalebi2013). Thus, intensity is expected to shape the time course of humor processing, not merely overall accuracy, by shifting the balance between early semantic mismatch responses and later reanalysis/integration processes.
From an L2 pragmatics perspective, these challenges are consistent with the view that pragmatic competence is multi-componential and develops through accumulated experience with context-sensitive language use (Gao & Zhang, Reference Gao and Zhang2026; Zhang & Aubrey, Reference Zhang and Aubrey2024). Pragmatic competence includes pragmalinguistic knowledge, which means how linguistic forms realize meanings such as implicature, irony, or humorous intent, and sociopragmatic knowledge, referring to norms and expectations about what meanings are appropriate in context (Roever, Reference Roever, Chapelle, Taguchi and Kadar2024; Taguchi & Roever, Reference Taguchi and Roever2017). Pragmatic performance depends not only on knowledge but also on processing efficiency: learners may possess relevant knowledge yet still struggle to access and integrate cues quickly enough in online comprehension. In this sense, exposure intensity is particularly relevant because it may influence the speed and stability with which learners deploy pragmalinguistic and contextual cues during real-time interpretation, a requirement that is amplified in verbal humor where the intended meaning hinges on rapid reinterpretation.
Behavioral evidence further suggests that L2 humor outcomes are constrained by language experience and language competence (Erdodi & Lajiness-O’Neill, Reference Erdodi and Lajiness-O’Neill2012; Ezrina & Valian, Reference Ezrina and Valian2023). Studies indicate that L2 jokes are often experienced as less funny when they are harder to understand and that individual differences in language experience and comprehension success relate to humor appreciation (Ayçiçegi-Dinn et al., Reference Ayçiçegi-Dinn, Sisman-Bal and Caldwell-Harris2018). However, behavioral measures such as accuracy and funniness ratings do not reveal when difficulty arises, whether during early semantic integration, during incongruity detection, during reinterpretation, or during later evaluation. The high temporal resolution of ERPs can help track the time course of language processing stages at the millisecond level to detect neural signatures not reflected in behavioral performance. Therefore, they are well suited to test how L2 learners deploy pragmatic competence during real-time verbal humor comprehension (Moreno et al., Reference Moreno, Rodríguez-Fornells and Laine2008).
To examine the time course of L2 verbal humor processing, the present study uses ERPs to investigate English verbal humor comprehension in Chinese EFL learners. We analyze EEG time-locked to the final word, which functions as the critical disambiguating cue. The final word is lexically identical across funny and unfunny conditions, enabling a clean test of context-driven meaning construction (Du et al., Reference Du, Qin, Tu, Yin, Wang, Yu and Qiu2013). By holding the punchline word constant, ERP differences at the time-lock point can be attributed primarily to how the preceding context constrains interpretation and to the comprehender’s revision and integration of meanings at the punchline.
Guided by the incongruity-resolution framework and prior ERP work on humor, we focused on two time windows at the final word: 300–500 ms and 500–900 ms. The 300–500 ms window is intended to capture the stage of incongruity detection, indexed by the N400, a broadly distributed negativity sensitive to semantic expectancy and integration difficulty (Chang et al., Reference Chang, Ku, Wu and Chen2019; Kutas & Federmeier, Reference Kutas and Federmeier2011). The 500–900 ms window is intended to capture the stage of incongruity resolution, indexed by a P600/late positivity, which has been linked in humor studies to reinterpretation, integration, and discourse updating when comprehenders attempt to integrate the punchline with prior context (Coulson & Kutas, Reference Coulson and Kutas2001). In addition to these temporal predictions, we tested whether classroom-based exposure intensity may relate to the degree of humor comprehension (Ellis, Reference Ellis2008; Ortega, Reference Ortega2014), in line with the expectation that greater L2 exposure can support more efficient online comprehension of L2 verbal humor.
Based on the above background, the present study addresses the following research questions. (1) What is the time course for Chinese EFL learners’ English verbal humor comprehension? Does it reflect a distinct staged model characterized by incongruity detection and incongruity resolution? (2) How does classroom-based exposure intensity, specifically the contrast between Intense Exposure (IE) and Limited Exposure (LE), modulate the cognitive mechanisms underlying English verbal humor comprehension in Chinese EFL learners?
To address these questions, we propose two hypotheses. Hypothesis 1: L2 verbal humor processing is expected to show a two-stage pattern. Incongruity Detection will be indexed by an N400 effect (300–500 ms), where humorous stimuli elicit larger amplitudes than coherent controls. Incongruity Resolution will be indexed by a P600 (500–900 ms), reflecting the cognitive effort of reanalysis. Hypothesis 2: Exposure intensity will modulate L2 verbal humor comprehension, specifically by targeting the cognitive mechanisms of incongruity resolution. Behaviorally, despite the increased reaction time inherent to processing humorous stimuli, the IE group will demonstrate significantly higher accuracy than the LE group. Neurophysiologically, the IE learners will demonstrate a significantly larger or more distinct P600 amplitude relative to LE learners, reflecting greater engagement of later-stage reanalysis or integration processes required for incongruity resolution.
2. Method
2.1. Participants
Forty-two right-handed Chinese learners of English (age range: 19–24 years; 26 female), whose native language was Chinese, were recruited from Jinan University. All participants in our study completed a background questionnaire to collect data such as their age, gender, major, and English learning experience. All participants reported normal or corrected-to-normal vision and no history of neurological disorders. Participants were required to provide informed consent, received verbal and written instructions on all details of the experiment, and were allowed to withdraw at any time. Each participant received compensation for their inconvenience and commute.
The participants were divided into two groups based on the intensity of their L2 exposure. The Intensive Exposure (IE) Group consisted of 21 English majors. These students engaged in a rigorous curriculum involving approximately 12–20 hours of English instruction per week, covering comprehensive skills including linguistics and literature. The Limited Exposure (LE) Group consisted of 21 non-English majors (e.g., engineering, science, etc.). These students followed a standard College English curriculum with approximately 2–4 hours of instruction per week, primarily focused on general proficiency and exam preparation.
To ensure that the observed effects were driven by L2 exposure intensity rather than pre-existing proficiency differences, the participants’ English proficiency was assessed using the LexTALE test (Lemhöfer & Broersma, Reference Lemhöfer and Broersma2012), and their general baseline proficiency was indexed by their National College Entrance Examination (NCEE) English scores. Independent t-tests showed no significant differences in LexTALE scores (mean ± SD) between the IE and LE groups (60.71 ± 12.40 and 60.12 ± 7.14, respectively; t (40) = 0.19, p = .85, Cohen’s d = 0.06) or NCEE scores (133.05 ± 4.54 and 132.48 ± 5.03, respectively; t (40) = 0.39, p = .70, Cohen’s d = 0.12). In addition, we collected participants’ self-reported total hours of English exposure (classroom and extracurricular exposure). Total English exposure (mean ± SD) was significantly higher in the IE group than in the LE group (20.00 ± 8.14 vs. 7.05 ± 3.11, t (40) = 6.81, p < .001, Cohen’s d = 2.10), indicating a significant group difference in exposure intensity.
2.2. Materials and design
The present study was a mixed design. Manipulation of conditions (Humorous vs. Coherent) served as the within-subject independent variable, while participants’ English exposure (Intense vs. Limited) served as a between-subject factor in the comparison of ERP mean amplitude elicited in the present study. Behavioral accuracy and reaction time, as well as the mean amplitudes of the N400 and P600 components, were measured to serve as the dependent variables.
English jokes were chosen as the candidate experimental stimuli from various sources, such as joke books, popular magazines, websites, and research articles in humor processing. To avoid too much eye movement and precisely time-lock neural activity, the researcher finally selected and adapted 61 one-liners or funny riddle questions followed by a corresponding concise answer that served as a punchline. One-liners and funny riddles were selected for having a short critical ending eliciting the humorous effect, and could be broadly defined as semantic, i.e., based on an incongruity generated either by lexical-semantic knowledge or world-knowledge (Vrticka et al., Reference Vrticka, Black and Reiss2013). The word in which the incongruity lay was identified by the researcher and was defined as the target word. We then manipulated the setup sentences rather than the punchlines to ensure that the neural activity we observed was not due to differences in the physical attributes of punchlines. We subsequently produced coherent setups for each joke’s punchline to serve as non-joke sentences in our set of experimental stimuli. Therefore, two types of stimuli were included within one set that shared the same punchline.
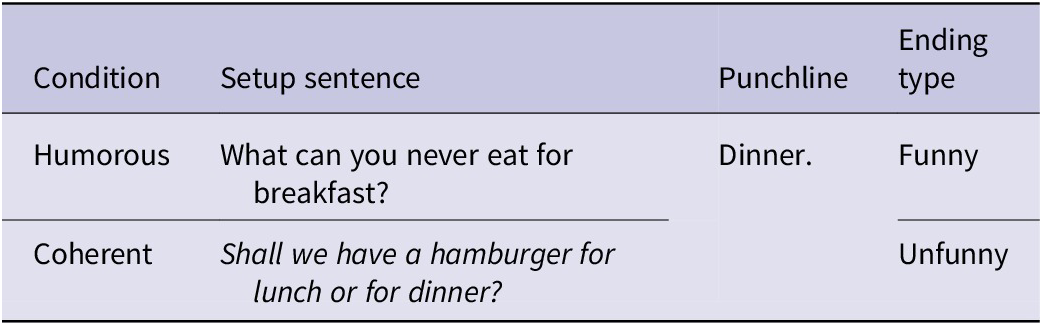
Table 1 shows an example set of our materials, including each of the two types of stimuli, which serves as a demonstration of the characteristics of each type of stimulus. The lengths of the setup sentences were comparable across the two conditions and were constrained to be within 15 words (maximally two lines on the computer screen). In total, 61 sets of experimental stimuli were included in the present study, with each set consisting of two types of stimuli: Humorous and Coherent. Therefore, there were 61 sentences for each condition and 122 experimental sentences in total. All experimental materials are provided in Table A1.
Example of experimental stimuli

Table 1. Long description
The table consists of a header row and two data rows.
Column 1: Condition.
Column 2: Setup sentence.
Column 3: Punchline.
Column 4: Ending type.
Row 1:
- Condition: Humorous.
- Setup sentence: What can you never eat for breakfast?
- Punchline: Dinner.
- Ending type: Funny.
Row 2:
- Condition: Coherent.
- Setup sentence: Shall we have a hamburger for lunch or for dinner?
- Punchline: Dinner.
- Ending type: Unfunny.
A lexical profile analysis of both types of stimuli was conducted using the VocabProfile tool to determine whether their linguistic complexity was appropriate for the participants’ English proficiency level (Cobb, Reference Cobbn.d.; Heatley et al., Reference Heatley, Nation and Coxhead2002). Results indicated that the lexical demand of all the materials was accessible to our participants, with 89.9% of the words belonging to the 1,000 most frequent English word families (K-1), and cumulatively, 95.4% of the tokens belonged to the 2,000 most frequent word families (K-2). All participants were university students who had completed the National College Entrance Examination, which is aligned with the national senior high school English curriculum, and the English Curriculum Standards for Senior High Schools specify an expected vocabulary range of approximately 3,000–3,500 English words by the end of senior high school. Thus, our participants’ vocabulary size exceeded the 95% lexical coverage threshold required for adequate reading comprehension (Nation, Reference Nation2006), and the lexical demand of the experimental stimuli was considered appropriate for them.
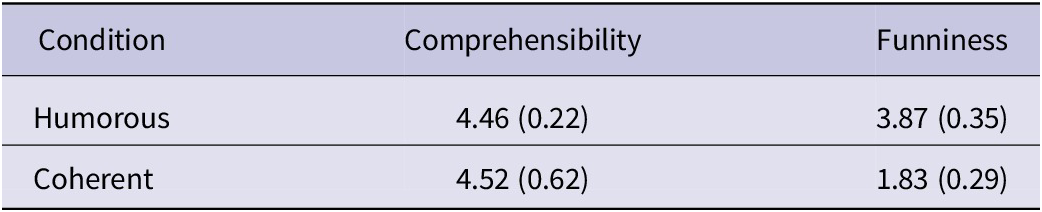
To ensure that the experimental stimuli were comprehensible and that the humorous and coherent stimuli differed as intended in funniness, all experimental sentences were rated by a separate group of 50 participants before the formal ERP experiment. Participants completed an online five-point Likert-scale rating task to evaluate the comprehensibility of the stimuli (1 = most incomprehensible; 5 = most comprehensible) and their funniness (1 = not funny at all; 5 = very funny).The participants who completed this rating task did not take part in the formal ERP experiment. The average rating scores are reported in Table 2. The paired t-tests revealed no significant difference between humorous and coherent stimuli for comprehensibility, t (49) = −1.82, p = .071, while the Humorous stimuli were rated significantly funnier than Coherent stimuli, t (49) = 34.64, p < .001.
Pretest results of the stimuli

Table 2. Long description
The table consists of three columns and three rows.
Column headers from left to right are Condition, Comprehensibility, and Funniness.
Row 1: Humorous condition. Comprehensibility is 4.46 with a standard deviation of 0.22. Funniness is 3.87 with a standard deviation of 0.35.
Row 2: Coherent condition. Comprehensibility is 4.52 with a standard deviation of 0.62. Funniness is 1.83 with a standard deviation of 0.29.
A note at the bottom specifies that data are expressed as mean with standard deviation in parentheses.
Note: Data are expressed as mean (standard deviation).
In the formal EEG experiment, we randomly divided the 61 sets of experimental stimuli into four blocks. The presentation of experimental stimuli was counterbalanced between subjects.
2.3. Experimental procedure
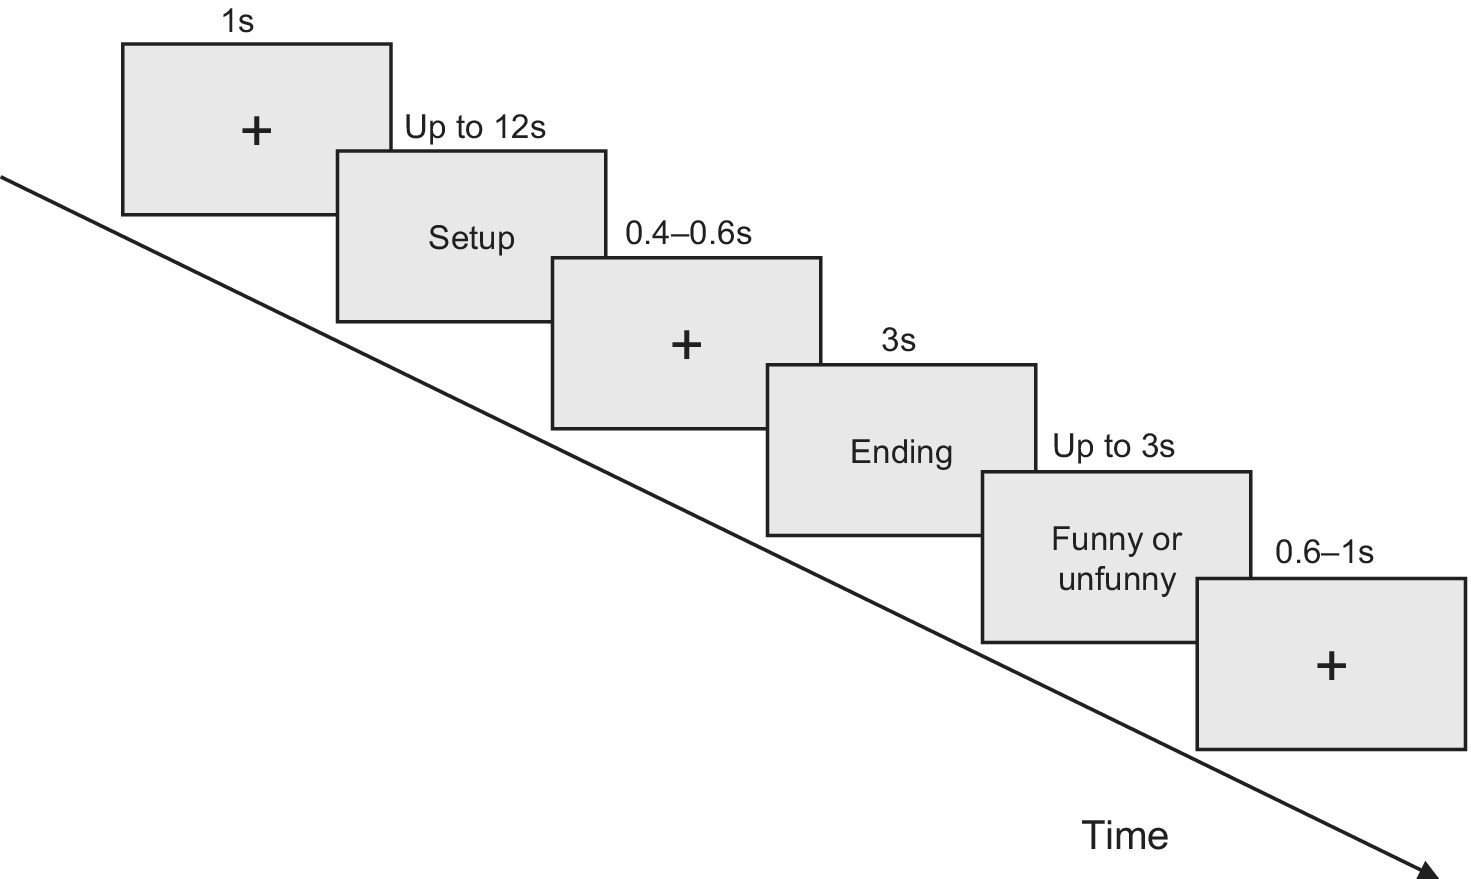
The experiment was programmed and run using E-Prime 2.0 (Psychology Software Tools, Sharpsburg, PA, USA). As shown in Figure 1, each experimental trial began with the presentation of a central fixation (duration = 1,000 ms) to orient the participant to the center of the screen. Then the one-liners or funny riddles were presented without endings. Instead, the endings were replaced by three asterisks at the end of the materials to encourage subjects to activate an expectation about what the possible ending could be (self-paced). Subjects were asked to read silently the setup sentence and press the space key when they felt they understood what they had read; this press made the setup parts disappear (the maximum presentation time was 12 s). A fixation then appeared randomly for 400–600 ms to avoid excessive artifacts of eye movements in reading critical words. Then a humorous ending or a logically coherent ending was presented for 3 s. Participants judged whether each sentence was funny or unfunny by pressing one of the two keys (N or M); the key-to-response mapping was counterbalanced across participants (the maximum time was 3 s). Following an interval of 600–1,000 ms, a new trial appeared. All stimuli were presented centrally and subtended a horizontal visual angle that varied between 1.8° and 5.1°.
Illustration of the experimental procedure for a single trial. Each trial began with a fixation cross presented for 1 s. Next, the Setup (context sentence) was displayed for a maximum of 12 s (or until the participant pressed a key). After a jitter of 400–600 ms, the Ending was presented for a fixed duration of 3 s. Participants were then asked to judge whether the sentence was funny or unfunny within 3 s. The trial concluded with an inter-trial interval (ITI) ranging from 600 to 1,000 ms.

The experimental procedure was divided into two parts. First, to familiarize the participants with the procedure and pace of this task, they were trained with 6 trials using the same procedure as in the formal ERP experiment. Then, the formal ERP experiment started. There were four blocks and each one included approximately 30 trials. The different conditions (Humorous/Coherent) in each block were displayed randomly. The participants were seated in a quiet room facing a screen placed approximately 60 cm away from the eyes, and were instructed to respond as fast and accurately as possible by pressing the corresponding key of the keyboard. They were also asked to minimize movements and eye blinks. Each recording session lasted 40 min, including cap electrode preparation. To relieve the participants from weariness, short breaks were provided after each set of trials. Each block lasted approximately 10 min.
2.4. Electrophysiological recording and preprocessing
The electroencephalogram (EEG) was acquired at 500 Hz sampling rate using a 64-channel system (Brain Products GmbH, Gilching, Germany). Electrodes were placed according to the 10–20 International System. FCz electrode was used as the online reference electrode, and AFz was the ground electrode. Two electrodes (TP9, TP10) were placed on the mastoids, and one additional electrode monitored eye movements. The electrode impedance was kept below 5 kΩ throughout the recording.
Pre-processing was performed with the MNE-Python toolbox. The continuous data were filtered offline using a band-pass filter from 0.1 to 30 Hz. The filtered data were then re-referenced to the average of the bilateral mastoids. Independent component analysis (ICA) was used to identify and correct ocular artifacts (e.g., blinks and saccades). The data were then segmented into epochs time-locked to the onset of the ending words. Each epoch ranged from −200 ms to 1,000 ms relative to the onset, with the −200 to 0 ms interval serving as the baseline correction. Following previous studies (Bornkessel-Schlesewsky et al., Reference Bornkessel-Schlesewsky, Roehm, Mailhammer and Schlesewsky2020; Qi et al., Reference Qi, Beach, Finn, Minas, Goetz, Chan and Gabrieli2017; Rao et al., Reference Rao, Wu and Cai2025), epochs with artifacts exceeding a peak-to-peak amplitude of 150 μV were rejected before averaging. Retained trials and rejection rates are reported in Supplementary Table S1. The main ERP averages included all artifact-free trials, including both correct and incorrect responses.
2.5. Statistical analysis
For the behavioral data, the response time and accuracy were analyzed using a 2 (Condition: Humorous, Coherent) × 2 (Group: Limited, Intense) mixed ANOVA.
For ERP statistical analysis, guided by past humor studies (Coulson & Kutas, Reference Coulson and Kutas2001; Feng et al., Reference Feng, Chan and Chen2014; Ku et al., Reference Ku, Feng, Chan, Wu and Chen2017; Mayerhofer & Schacht, Reference Mayerhofer and Schacht2015; Shibata et al., Reference Shibata, Terasawa, Osumi, Masui, Ito, Sato and Umeda2017), mean amplitudes for the N400 were calculated over the central electrodes (Cz, CPz, Pz) within the 300–500 ms time window, whereas mean amplitudes for the P600 were calculated over the parietal electrodes (CPz, Pz, POz) within the 500–900 ms time window. Data were analyzed using a 2 (Condition: Humorous, Coherent) × 2 (Group: Limited, Intense) mixed ANOVA. The Greenhouse–Geisser correction was applied when sphericity was violated, and post-hoc comparisons were Bonferroni-corrected (alpha = 0.05).
3. Results
3.1. Behavioral results
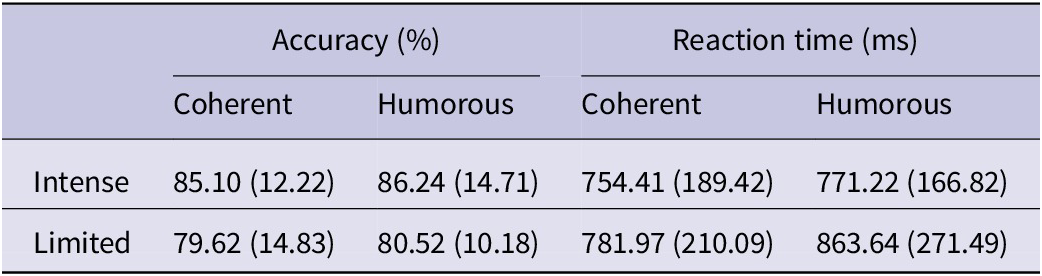
Mean comprehension accuracy and response time for Coherent and Humorous are reported in Table 3. Statistical analysis of comprehension data revealed a significant main effect of Exposure Intensity in the response accuracy (F(1, 40) = 4.78, p = .035, ηp2 = .11), with the Intense Exposure group showing higher accuracy than the Limited Exposure group. The main effect of Condition was not significant (F(1, 40) = 0.12, p = .73), and the interaction was not significant, either (F(1, 40) = 0.001, p = .98). For response time, a significant main effect of Condition was identified (F(1, 40) = 4.92, p = .032, ηp2 = .11), indicating slower responses to Humorous than to Coherent endings in both groups. The main effect of Exposure Intensity was not significant (F(1, 40) = 0.94, p = .338), and the interaction was not significant (F(1, 40) = 2.13, p = .152).
Accuracy and reaction time by condition and exposure group

Table 3. Long description
The table is organized into two main performance metrics: Accuracy (percent) and Reaction time (m s). Each metric is subdivided into Coherent and Humorous conditions. Data is presented as mean with standard deviation in parentheses.
* Intense Exposure Group:
- Accuracy: 85.10 (12.22) for Coherent and 86.24 (14.71) for Humorous.
- Reaction time: 754.41 (189.42) m s for Coherent and 771.22 (166.82) m s for Humorous.
* Limited Exposure Group:
- Accuracy: 79.62 (14.83) for Coherent and 80.52 (10.18) for Humorous.
- Reaction time: 781.97 (210.09) m s for Coherent and 863.64 (271.49) m s for Humorous.
Note: Data are expressed as mean (standard deviation).
3.2. ERP results
For the N400 component, a mixed ANOVA conducted on the mean amplitudes over the central electrodes (Cz, CPz, Pz) in the 300–500 ms time window revealed a significant main effect of Condition (F(1, 40) = 9.13, p = .004, ηp2 = .19). Specifically, Humorous endings elicited a more negative-going waveform than Coherent endings, as shown in Figure 2. However, neither the main effect of Group (F(1, 40) = 0.82, p = .371) nor the interaction (F(1, 40) = 0.05, p = .817) was significant.
Grand average ERP results for the N400 component. The results are displayed separately for the (A) Limited Exposure group and (B) Intense Exposure group. Top panels: Topographical maps showing the distribution for Coherent and Humorous conditions, as well as the difference (Humorous minus Coherent), averaged within the N400 time window (300–500 ms). Bottom panels: Grand average ERP waveforms elicited by Coherent (blue lines) and Humorous (red lines) endings at the central electrodes (averaged over Cz, CPz, and Pz). The gray shaded area indicates the time window used for statistical analysis (300–500 ms). Bar plots illustrate the mean amplitudes with standard error bars; individual data points represent single-subject means, connected to show within-subject comparisons.

Figure 2. Long description
The figure is divided into two main sections.
Panel A, Limited Exposure group, on the left:
* Top row: Three topographical maps labeled Coherent, Humorous, and Humorous minus Coherent. The first two show red positive activity in frontal regions and blue negative activity in posterior regions on a scale from minus 4 to 4. The difference map shows a central blue concentration on a scale from minus 1 to 1.
* Bottom row: A line graph with X-axis Time in m s from minus 200 to 1000 and Y-axis Amplitude in microvolts from 6 to minus 6. A gray shaded N 4 0 0 window between 300 and 500 m s shows the red Humorous waveform is more negative-going than the blue Coherent waveform within the gray 300–500 ms window; negative voltage is plotted upward. To the right, a bar plot shows mean amplitudes for Coherent (blue bar) and Humorous (red bar) with individual subject data points connected by lines.
Panel B, Intense Exposure group, on the right:
* Top row: Three topographical maps following the same labeling as Panel A. The difference map (Humorous minus Coherent) shows a central blue negative distribution.
* Bottom row: A line graph showing the same axes and N 4 0 0 window. In this group, the red Humorous waveform is more negative-going than the blue Coherent waveform within the gray 300–500ms window. The accompanying bar plot shows the blue Coherent bar is higher than the red Humorous bar, with individual subject lines showing a consistent downward trend from Coherent to Humorous.
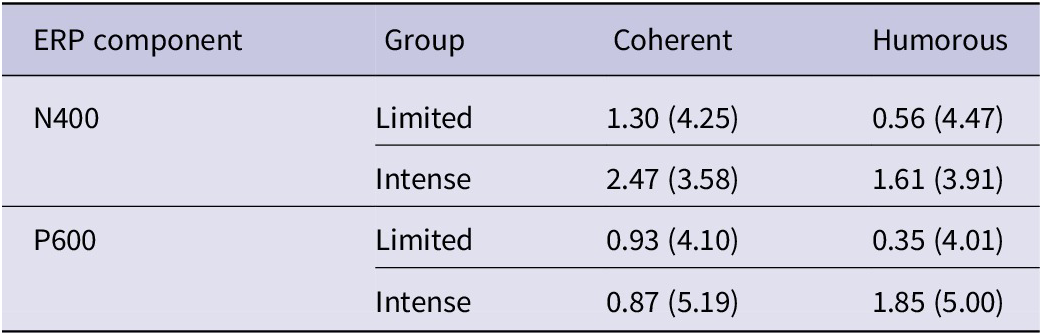
For P600 component, a mixed ANOVA conducted on the mean amplitudes over the parietal electrodes (CPz, Pz, POz) in the 500–900 ms time window revealed a significant interaction (F(1, 40) = 9.00, p = .005, ηp2 = .18), whereas the main effects of Condition (F(1, 40) = 0.60, p = .442) and Group (F(1, 40) = 0.26, p = .610) were not significant. Further simple effects analysis indicated that in the Intense Exposure group, Humorous endings elicited significantly larger P600 (more positive amplitudes) compared to Coherent endings (t(20) = 2.39, p = .027). In contrast, for the Limited Exposure group, no significant difference was found between the Humorous and Coherent endings (t(20) = −1.82, p = .084). See Figure 3 and Table 4 for details.
Grand average ERP results for the P600 component. The results are displayed separately for the (A) Limited Exposure group and (B) Intense Exposure group. Top panels: Topographical maps showing the distribution for Coherent and Humorous conditions, as well as the difference (Humorous minus Coherent), averaged within the P600 time window (500–900 ms). Bottom panels: Grand average ERP waveforms elicited by Coherent (blue lines) and Humorous (red lines) endings at the parietal electrodes (averaged over CPz, Pz, and POz). The gray shaded area indicates the time window used for statistical analysis (500–900 ms). Bar plots illustrate the mean amplitudes with standard error bars; individual data points represent single-subject means, connected to show within-subject comparisons.

Figure 3. Long description
The multi-panel figure is divided into two main sections: A for Limited Exposure group and B for Intense Exposure group.
Top row of both sections: Three topographical maps showing scalp voltage distributions.
* Coherent and Humorous maps use a scale from negative 4 to positive 4 microvolts, showing red positive activity in the anterior regions and blue negative activity in the posterior regions.
* The Humorous minus Coherent difference map uses a scale from negative 1 to positive 1 microvolts. In Group A, this map shows central blue negative activity. In Group B, it shows widespread red positive activity across the posterior scalp.
Bottom row of both sections: E R P waveforms and bar plots.
* The line graphs plot Amplitude in microvolts on the y-axis (from negative 6 at the top to 6 at the bottom) against Time in milliseconds on the x-axis (from negative 200 to 1000).
* A blue line represents the Coherent condition and a red line represents the Humorous condition.
* A gray shaded area from 500 to 900 milliseconds highlights the P 600 window. In Group A, the Humorous waveform is slightly less positive than the Coherent waveform, but the difference is not statistically significant. In Group B, the red line shows a larger positive deflection compared to the blue line.
* To the right of each waveform is a bar plot showing mean amplitudes. In Group A, the mean amplitude is slightly lower for Humorous than for Coherent endings, but the difference is not statistically significant. In Group B, the mean amplitude is significantly higher for Humorous than for Coherent endings. Individual subject means are overlaid and connected to show within-subject comparisons.
Mean amplitudes (μV) for the N400 and P600 by condition and exposure group

Table 4. Long description
The table is organized into four columns: E R P component, Group, Coherent, and Humorous. Data is presented as mean with standard deviation in parentheses.
* N 400 component:
- Limited Group: Coherent 1.30 (4.25), Humorous 0.56 (4.47).
- Intense Group: Coherent 2.47 (3.58), Humorous 1.61 (3.91).
* P 600 component:
- Limited Group: Coherent 0.93 (4.10), Humorous 0.35 (4.01).
- Intense Group: Coherent 0.87 (5.19), Humorous 1.85 (5.00).
Note: Data are expressed as mean (standard deviation).
To evaluate the robustness of the ERP findings, we conducted supplementary sensitivity analyses using stricter peak-to-peak artifact-rejection thresholds of 100 μV and 50 μV. Trial retention and rejection rates after artifact rejection are reported in Supplementary Table S1, and the sensitivity analysis results are reported in Supplementary Table S2. Overall, these sensitivity analyses showed a broadly consistent pattern with the main findings, suggesting that the ERP results were not driven by the specific artifact-rejection threshold.
To further examine whether the N400 and P600 effects showed hemispheric lateralization, we conducted supplementary lateralized analyses using a 2 (Group: Limited, Intense) × 2 (Condition: Humorous, Coherent) × 2 (Hemisphere: Left, Right) mixed ANOVA. For the N400, the left region of interest (ROI) included C3, CP3, and P3, and the right ROI included C4, CP4, and P4. For the P600, the left ROI included CP3, P3, and PO3, and the right ROI included CP4, P4, and PO4. Supplementary Figures S1 and S2 show the lateralized ERP waveforms and mean amplitudes for the N400 and P600, respectively, and the corresponding statistical results are reported in Supplementary Table S3. No significant interactions involving Hemisphere were observed, all ps ≥ .353, suggesting no clear hemispheric lateralization effects.
Since the main analyses included both correct and incorrect behavioral responses, additional ERP analyses restricted to correct trials were conducted. Supplementary Figures S3 and S4 show the N400 and P600 results based on correct trials, respectively. The number of retained correct trials is reported in Supplementary Table S4, and the corresponding statistical results are reported in Supplementary Table S5. As shown in Supplementary Figures S3 and S4, the overall ERP patterns were broadly consistent with those observed in the main analyses (Figures 2 and 3). In the statistical analyses, the N400 condition effect remained significant (p = .011), whereas the P600 Group × Condition interaction was reduced and no longer significant (p = .110). This may be partly related to the reduced signal-to-noise ratio after restricting the analyses to correct trials. In addition, because the two groups differed in behavioral accuracy, restricting the analyses to correct trials resulted in unequal numbers of trials entering the ERP averages across groups (Supplementary Table S4), which may have reduced the stability and statistical power of the P600 analysis. Moreover, the P600 time window partly overlapped with the response period, and response-related activity may have further affected the stability of the P600 estimates in the correct-trial analysis.
4. Discussion
4.1. Overview
This study examined the time course of English verbal humor comprehension among Chinese EFL learners using ERPs to characterize the stages of incongruity detection and resolution. By contrasting participants with intensive versus limited English exposure, the research addressed how language exposure intensity might modulate the neural processes underlying figurative comprehension. Consistent with models of humor processing in first language (L1) contexts (Coulson & Kutas, Reference Coulson and Kutas2001; Shibata et al., Reference Shibata, Terasawa, Osumi, Masui, Ito, Sato and Umeda2017), the results demonstrated a two-stage temporal pattern among IE learners but only a partial pattern among learners with limited language exposure. This conditioned two-stage model provides direct evidence that while the detection of incongruity arises automatically in L2 verbal humor comprehension, its resolution depends on exposure-linked cognitive and linguistic resources.
4.2. Behavioral performance of humor comprehension
Reaction time and accuracy results offer a behavioral foundation for interpreting the ERP findings. Both exposure groups responded faster to unfunny, logically coherent endings than to funny ones, reflecting greater cognitive effort required for incongruity resolution. However, IE learners exhibited higher judgment accuracy, suggesting that their broader linguistic knowledge and pragmatic familiarity facilitated access to contextually relevant interpretations.
These behavioral distinctions are consistent with research showing that L2 experience is associated with greater efficiency in pragmatic comprehension, including faster and more accurate use of contextually relevant cues (Taguchi, Reference Taguchi2005; Zhang & Aubrey, Reference Zhang and Aubrey2024). The current data indicate that IE learners were able to better isolate relevant contextual information, move beyond literal interpretations, and integrate linguistic and sociocultural cues. Conversely, LE learners responded primarily to surface semantic conflict, with less evidence of fully retrieving or integrating the intended inferential meaning.
The difference between funny and unfunny stimuli also illustrates the role of conventionality in reducing processing cost. As predicted by Relevance Theory (Sperber & Wilson, Reference Sperber and Wilson1996; Wilson & Sperber, Reference Wilson, Sperber, Horn and Ward2006), conventional and predictable utterances require minimal inferential effort, whereas highly unconventional or surprising endings demand greater effort balanced by greater cognitive reward. Longer response times for humorous endings thus may represent the cost of expanded interpretive work that makes resolution and consequently possible amusement.
4.3. Incongruity detection in L2: the N400 effect
In the present study, ERP results revealed a robust N400 effect between 300 and 500 ms post-stimulus onset, with larger negativity elicited by funny than unfunny endings in both exposure groups. The N400 commonly reflects semantic integration difficulty and indexes the mismatch between predicted and actual lexical meaning (Kutas & Hillyard, Reference Kutas and Hillyard1980). Its presence across all participants in our study confirmed that even L2 users could detect violations of contextual expectancy at early stages of processing. These findings accord with previous studies of joke comprehension in L1 speakers, where punchlines elicit enhanced N400 amplitudes due to the mismatch between initial semantic frames and the final, incongruent meaning (Coulson & Kutas, Reference Coulson and Kutas2001; Du et al., Reference Du, Qin, Tu, Yin, Wang, Yu and Qiu2013).
Our N400 findings complement behavioral data showing longer processing times for humorous conditions. The detection of incongruity intensifies cognitive demand in both L2 exposure groups. Nevertheless, our results revealed no significant group differences in the N400 component, indicating that the variation in classroom exposure intensity did not modulate the initial stage of incongruity detection. This finding aligns with evidence that L2 learners can exhibit similar N400 effects to L1 speakers when they possess sufficient vocabulary proficiency to access lexical-semantic information (Moreno et al., Reference Moreno, Rodríguez-Fornells and Laine2008; Moreno & Kutas, Reference Moreno and Kutas2005). In our study, tightly controlling the lexical properties at the punchline may have further facilitated this by reducing variance in early lexical-semantic access. Even late learners can show N400 effects, and semantic systems often show more plasticity or robustness than syntactic systems (Hahne & Friederici, Reference Hahne and Friederici2001). Thus, the indistinguishable N400 amplitudes may suggest that both IE and LE learners in our study were equally efficient at accessing the semantic representations required to detect the humor-related conflict, with exposure differences manifesting only during the later resolution stage.
Taken together, our N400 evidence substantiated the first stage of the two-stage model, an early and relatively automatic recognition of semantic conflict driven by lexical – contextual integration rather than by intensity of L2 exposure.
4.4. Incongruity resolution and reinterpretation: the P600 effect
The second stage of L2 humor comprehension emerged as a P600 positivity between approximately 500 and 900 ms after stimulus onset, corresponding to reanalysis and coherence restoration processes. This effect was prominent for humorous endings in IE participants but absent in LE participants.
Although traditionally associated with syntactic reevaluation (Osterhout et al., Reference Osterhout, McLaughlin and Bersick1997; Tanner et al., Reference Tanner, McLaughlin, Herschensohn and Osterhout2013), the P600 has been extended to a wide range of reprocessing phenomena, including discourse integration (Burkhardt, Reference Burkhardt2007), pragmatic inferences (Regel et al., Reference Regel, Gunter and Friederici2011), and humor comprehension (Canal et al., Reference Canal, Bischetti, Di Paola, Bertini, Ricci and Bambini2019; Shibata et al., Reference Shibata, Terasawa, Osumi, Masui, Ito, Sato and Umeda2017). In the current study, the centro-parietal P600 signals participants’ attempts to achieve coherence through frame-shifting, that is, the reorganization of conceptual frames to align initial and alternative interpretations (Coulson & Williams, Reference Coulson and Williams2005).
The L2 exposure-based difference in P600 amplitude suggests that only learners with extensive language experience possess sufficient linguistic and pragmatic knowledge to resolve incongruity. While the LE participants detected semantic anomalies (as indexed by the N400) and ultimately achieved high behavioral accuracy in humor comprehension (approximately 80%), their attenuated P600 suggests reduced efficiency and less robust neural engagement during the pragmatic reinterpretation stage compared to the IE group. This neurophysiological pattern indicates that although LE learners can behaviorally resolve the incongruity, their underlying reanalysis process is less automatized and neurocognitively more effortful. In contrast, the intensive L2 exposure in the IE group facilitates a robust and efficient neural integration of hidden implicatures, manifesting as an enhanced P600 effect. This result is consistent with research on L2 pragmatic processing suggesting that limited processing resources may lead learners to rely more heavily on surface-level linguistic cues, making higher-level pragmatic inferences less accessible (Roever, Reference Roever, Chapelle, Taguchi and Kadar2024; Taguchi & Roever, Reference Taguchi and Roever2017).
While semantic conflict recognition is nearly automatic, resolution presupposes the capacity to inhibit earlier interpretations and to construct a new integrated model of meaning, processes that may require intensive exposure and contextual experience. Figurative language processing requires suppressing literal meanings quickly (Ezrina & Valian, Reference Ezrina and Valian2023; Vaid et al., Reference Vaid, Hull, Heredia, Gerkens and Martinez2003). In our study, the ERP stimuli were one-liners or funny riddles. One-liners often involve structural or garden-path humor, which requires syntactic processing speed to get the humor under time pressure, while in funny riddles, humor often relies on double meanings of words (polysemy) or similar sounds (homophones), which could test learners’ depth of vocabulary and their ability to access literal and non-literal meanings simultaneously and efficiently suppress the initial and salient literal meaning to accept the secondary, funny meaning. This process of comprehension requires cognitive “muscle” built through constant, intensive pressure such as immersion or intensive study, not through occasional practice as in the case of LE participants in our study.
While intensive exposure may not explicitly target humor, it may facilitate the automatization of lower-level syntactic and lexical processing (Morishima, Reference Morishima2013). This reduced cognitive load during the initial parsing phase frees up working memory resources, allowing the L2 learner to allocate attention to the higher-order semantic reanalysis required for humor comprehension. Intensive instructional environments place high demands on inhibitory control, requiring IE learners to constantly suppress L1 interference. This heightened executive control could transfer to figurative language processing, allowing IE learners to more rapidly suppress the salient literal interpretation of a pun or riddle in favor of the contextually appropriate non-literal meaning (Hopp, Reference Hopp2022).
Unlike naturalistic exposure, which prioritizes communicative fluency, intensive L2 exposure fosters acute metalinguistic awareness that may prime IE learners to detect the phonological or syntactic ambiguities central to verbal humor, treating the joke as a linguistic puzzle to be solved. Although the target jokes were not explicitly taught, the IE learners’ more intensive instruction (12–20 hours per week), frequent peer interaction, and motivation to become language professionals may have afforded them denser exposure to English in use than the LE learners, despite no significant between-group difference in general proficiency. This account is consistent with evidence that denser L2 exposure enhances the accuracy of implicit meaning comprehension (Taguchi, Reference Taguchi2011), and that intensified L2 contact predicts gains in pragmalinguistic development (Zhang et al., Reference Zhang, Aubrey and He2026). However, as the online allocation of contextual and pragmatic resources was not directly measured in the present study, this remains a plausible rather than an established interpretation of the ERP findings.
4.5. The conditioned two-stage model of L2 humor processing
Synthesizing these findings, the present study advances a Conditioned Two-Stage Model of L2 humor comprehension, adapting Suls’ (Reference Suls, Goldstein and McGhee1972) classic Incongruity – Resolution framework to bilingual contexts. The first stage is Incongruity Detection. In this stage, universal and largely automatic processing detects a mismatch between the predicted and the actual meaning. Chinese EFL learners with both intense and limited English exposure demonstrated this stage. In the second stage of Incongruity Resolution, however, only controlled, L2 exposure-dependent reanalysis enabled reinterpretation and humor comprehension. Completion of this stage depends on linguistic fluency and pragmatic knowledge sufficient for frame-shifting, which is more likely to be achieved through intensive L2 exposure in a language learning environment depending on classroom instruction.
Our model captures the partial success experienced by many L2 learners: they can perceive incongruity but not necessarily resolve it to derive humor. Such conditionality reflects cognitive resource allocation in L2 comprehension (Morishima, Reference Morishima2013; Roever, Reference Roever, Chapelle, Taguchi and Kadar2024). As L2 exposure increases, learners may gradually automatize lower-level processes and can redirect cognitive capacity toward inferential integration. The model therefore bridges neurocognitive and pragmatic theories by linking observable ERP components to levels of communicative competence. It further supports the view that pragmatic comprehension constitutes a continuum of processing depth rather than a categorical dichotomy between “understanding” and “not understanding” humor (Bell & Pomerantz, Reference Bell, Pomerantz and Taguchi2019).
Pragmatic comprehension in a second language requires the rapid coordination of multiple knowledge sources. At a minimum, comprehenders must integrate linguistic meaning with contextual inference and pragmatic cue knowledge, and performance varies systematically as a function of cue type and its attendant processing demands (Prichard & Rucynski, Reference Prichard and Rucynski2022). This cue-sensitivity is particularly relevant for humor and irony, where the intended meaning often diverges from the literal meaning and must be recovered by combining what is said with what is implied (Dynel, Reference Dynel2008; Ellis et al., Reference Ellis, Zhu, Shintani and Roever2021). In this sense, humor comprehension depends not only on what learners know about vocabulary, grammar, and sociocultural conventions, but also on how efficiently these sources can be brought to bear in real time.
Against this background, our results may inform ongoing discussions on L2 pragmatic comprehension by suggesting a dynamic relationship between early interpretation and later integrative repair. The biphasic N400–P600 pattern observed here is consistent with a two-stage account in which learners first attempted lexico-semantic integration (indexed by the N400) and then engaged in later reanalysis, inference, or coherence-building operations (indexed by the P600). In our study, the N400 effect was observed for humorous stimuli in both groups, indicating that participants detected a semantic mismatch at the punchline. The absence of an IE – LE group difference at this stage suggested that classroom-based exposure intensity did not substantially influence early lexical – semantic activation or incongruity detection. Nevertheless, the group difference that emerged in late positivities revealed that, for IE learners, the initial N400 detection signal triggered a reanalysis process. The P600 here reflects the cognitive work of suppressing the literal interpretation and restructuring the discourse model into correct humor comprehension. Conversely, the LE group, despite showing a similar N400, displayed a significantly reduced P600 and lower accuracy in the funny/unfunny judgment test. This pattern suggests that while they recognized something was wrong (N400), they lacked the intensity of training to carry out the subsequent repair (P600). Simply put, the LE learners detected the joke, but could not resolve it.
Several limitations of the present study should be acknowledged. First, the stimulus set focused primarily on one-liners and riddles, and future studies could examine whether the two-stage pattern generalizes beyond these stimulus types. Cultural familiarity ratings should also be collected to disentangle linguistic difficulty from socio-cultural unfamiliarity. Second, although our study focused on individual differences within the L2 population, the absence of a native speaker baseline remains a limitation. To fully understand these findings, future research needs an L1 control group to compare these L2 neural responses directly with those of native speakers. Thirdly, although LexTALE is a generally reliable proxy for global language proficiency, it may miss the deeper semantic and pragmatic skills required for humor comprehension. Future research should incorporate discourse-level proficiency assessments. Finally, the study employed sensor-space ERP analysis without source localization. Coupling ERPs with methods such as sLORETA or fMRI would enable localization of the cortical networks supporting L2 humor comprehension, such as the temporo-parietal and prefrontal areas implicated in theory-of-mind and inference construction (Feng et al., Reference Feng, Chan and Chen2014; Shibata et al., Reference Shibata, Terasawa, Osumi, Masui, Ito, Sato and Umeda2017).
5. Conclusion
This study provides converging behavioral and neurophysiological evidence that L2 verbal humor comprehension involves two temporally distinct stages: early semantic incongruity detection, indexed by the N400, and later reanalysis for coherence restoration, indexed by the P600. The findings show that only L2 learners with intensive exposure (the IE group) fully engaged both stages and achieved humor appreciation, suggesting that general L2 proficiency may provide the lexical basis for comprehension, whereas intensive exposure facilitates the higher-order pragmatic integration required for humor resolution. Extending Suls’ (Reference Suls, Goldstein and McGhee1972) Incongruity – Resolution model to bilingual contexts, these results support the proposed Conditioned Two-Stage Model and indicate that L2 exposure modulates the efficiency and time course of incongruity resolution in L2 humor comprehension.
Supplementary material
The supplementary material for this article can be found at http://doi.org/10.1017/S1366728926101850.
Data availability statement
Anonymized data, preprocessing scripts, and analysis code will be made available upon reasonable request to the corresponding author.
Acknowledgments
We thank Prof. Yaozhong Liu and Prof. Jing Wang for their valuable suggestions and helpful comments.
Author contribution
F.P.: the design of the work, the acquisition and analysis of data for the work, the interpretation of data for the work, funding acquisition, drafting and revising the article, and final approval of the version to be published. R.Z.: the conception of the work, revising the article, and final approval of the version to be published. M.X.: the experiment design, analysis of data, revising the work, and final approval of the version to be published.
Funding statement
This work was supported by the Guangdong Philosophy and Social Science Planning Project (GD23WZXC01-17; GD23CWY03), the Humanities and Social Sciences Project of the Ministry of Education (21YJA740031), and the Research Center for Brain Cognition and Human Development of Guangdong Province (2024B0303390003).
Competing interests
The authors declare none.
Ethical standard
All participants provided informed consent. The authors assert that all procedures contributing to this work comply with the ethical standards of the relevant national and institutional committees on human experimentation and with the Helsinki Declaration of 1975, as revised in 2008.
Appendix
Experimental stimuli used in the ERP experiment

Table A1. Long description
A table with four columns: Item, Humorous setup, Coherent setup, and Critical ending. Each row presents one of 61 numbered items. In each setup, the critical ending is replaced by three asterisks, and the final column provides the corresponding critical ending. Examples include:
* Item 1: Humorous setup ‘Which is faster, hot or cold? Hot. Because you can catch a ***’; Coherent setup ‘Is December a good time to visit Beijing? No. It’s too ***’; Critical ending ‘cold’.
* Item 6: Humorous setup ‘Why did the physics teacher break up with the biology teacher? There was no ***’; Coherent setup ‘Marie Curie was the woman behind great changes in the science of ***’; Critical ending ‘chemistry’.
* Item 35: Humorous setup ‘What do you call a bee that comes from America? ***’; Coherent setup ‘What device do you use to store the data? ***’; Critical ending ‘U S B’.
* Item 39: Humorous setup ‘Why do ants not get sick? They have ***’; Coherent setup ‘The purpose of vaccination is to make people produce ***’; Critical ending ‘anti-bodies’.
* Item 61: Humorous setup ‘Although the destruction of this earthquake is terrible, there’s still hope. I found a man’s ***’; Coherent setup ‘A man called 110 and said a robber had threatened him with a gun and taken his ***’; Critical ending ‘wallet’.
The table concludes with a note stating that E R P epochs were time-locked to the onset of the critical ending.
Note: Each item included a humorous and a coherent version. The two versions shared the same critical ending, and the preceding setup sentence was manipulated to create either a humorous or coherent interpretation. The asterisks indicate the position at which the critical ending appeared. ERP epochs were time-locked to the onset of the critical ending.




 Open access

