Introduction
NEIGHBORHOOD DENSITY refers to the number of words that sound similar to a given word (Luce & Pisoni, Reference Luce and Pisoni1998; see Vitevitch, Reference Vitevitch2008, for an alternative definition). Neighborhood density is typically defined operationally by counting the number of words formed when a single phoneme is added, deleted or substituted into any position of the target word (n.b.: phonological similarity has been operationally defined in other ways, but the results remain the same qualitatively; see Luce & Pisoni, Reference Luce and Pisoni1998). A word like cat, which has many neighbors (e.g., at, bat, mat, rat, scat, pat, sat, vat, cab, cad, calf, cash, cap, can, cot, kit, cut, coat), is said to have a dense phonological neighborhood, whereas a word like dog, that has few neighbors (e.g., dig, dug, dot, fog) is said to have a sparse phonological neighborhood (n.b.: each word has additional neighbors, but only a few were listed for illustrative purposes). Much psycholinguistic research has demonstrated the influence of neighborhood density on spoken word production (e.g., Goldrick & Rapp, Reference Goldrick and Rapp2007; Kittredge, Dell, Verkuilen & Schwartz, Reference Kittredge, Dell, Verkuilen and Schwartz2008; Vitevitch, Reference Vitevitch1997, Reference Vitevitch2002b), spoken word recognition (e.g., Cluff & Luce, Reference Cluff and Luce1990; Goldinger, Luce & Pisoni, Reference Goldinger, Luce and Pisoni1989; Luce & Pisoni, Reference Luce and Pisoni1998; Vitevitch, Reference Vitevitch2002a, Reference Vitevitch2003; Vitevitch & Luce, Reference Vitevitch and Luce1999; Vitevitch & Rodríguez, Reference Vitevitch and Rodríguez2005; Vitevitch, Stamer & Sereno, Reference Vitevitch, Stamer and Sereno2008), short-term memory (e.g., Roodenrys, Hulme, Lethbridge, Hinton & Nimmo, Reference Roodenrys, Hulme, Lethbridge, Hinton and Nimmo2002) and even reading (e.g., Yates, Locker & Simpson, Reference Yates, Locker and Simpson2004).Footnote 1
More relevant to the present study is the influence of neighborhood density on the process of word learning (e.g., Storkel et al., Reference Storkel, Armbruster and Hogan2006). It is generally accepted that representations of phonological segments, phonological word-forms and semantic information (among other types of representations) are involved in the production and recognition of spoken words (e.g., Dell, Schwartz, Martin, Saffran & Gagnon, Reference Dell, Schwartz, Martin, Saffran and Gagnon1997; Vitevitch & Luce, Reference Vitevitch and Luce2005). These representations also play a role in, and indeed must be formed in, the acquisition of new words in the native or a foreign language (e.g., Storkel & Morrisette, Reference Storkel and Morrisette2002). When one encounters a novel word, one must activate the existing representations of phonological segments until a new word-form can be created and associated with the appropriate meaning. Much research has examined the biases that influence how semantic information influences the acquisition of new words in the native (e.g., Gershkoff-Stowe & Smith, Reference Gershkoff-Stowe and Smith2004) and a foreign language (e.g., Barcroft, Reference Barcroft2003; Finkbeiner & Nicol, Reference Finkbeiner and Nicol2003). However, the present investigation focuses on another part of the word-learning process, namely the formation of phonological word-forms, and examined how known word-forms influence the acquisition of novel word-forms (see also Carlson, Reference Carlson2007; Maekawa, Reference Maekawa2006).
Infants (Hollich, Jusczyk & Luce, Reference Hollich, Jusczyk, Luce, Skarabela, Fish and Do2002), toddlers (Storkel, Reference Storkel2009), preschool children (Storkel, Reference Storkel2001; Reference Storkel2003) and college-age adults (Storkel et al., Reference Storkel, Armbruster and Hogan2006) learn novel words that have dense neighborhoods more readily than novel words that have sparse neighborhoods in the native language. This influence of existing word-forms on the acquisition of novel word-forms has been found when the novel words are nouns (Storkel, Reference Storkel2001), verbs (Storkel, Reference Storkel2003) or homonyms (Storkel & Maekawa, Reference Storkel and Maekawa2005), and has also been found in naturalistic contexts, in addition to laboratory-based experiments (Storkel, Reference Storkel2004, Reference Storkel2009).
To account for the influence of existing word-forms on the acquisition of a novel word-form, Storkel et al. (Reference Storkel, Armbruster and Hogan2006) suggested that the partial phonological overlap that exists between the novel word and the representations of known words in the lexicon strengthen the newly formed lexical representation of a novel word (see also Jusczyk, Luce & Charles-Luce, Reference Jusczyk, Luce and Charles-Luce1994). A newly formed representation that resembles many known words in the lexicon will be strengthened to a greater extent then a newly formed representation that resembles few known words in the lexicon, hence the advantage for learning novel words with dense compared to sparse neighborhoods. This mechanism was recently implemented in an artificial neural network and further tested in a variety of simulations (Vitevitch & Storkel, unpublished observations).
The present study further investigates this learning mechanism by testing native English speakers acquiring Spanish as a foreign language. College students in their third semester of Spanish-language classes were asked to learn real Spanish words (that were selected from advanced level Spanish classes), rather than nonsense words that conform to the phonotactics of the native language (i.e., the method employed in many previous studies of word learning, e.g., Storkel et al., Reference Storkel, Armbruster and Hogan2006). Some of the words to be learned sounded similar to many Spanish words that the students already knew (i.e., the target words had a dense neighborhood), whereas other words to be learned sounded similar to few Spanish words that the students already knew (i.e., the target words had a sparse neighborhood). If the mechanism proposed in Storkel et al. (Reference Storkel, Armbruster and Hogan2006; and modeled in Vitevitch & Storkel, unpublished observations) is a general mechanism used to learn words, then the college students should learn the Spanish words with dense neighborhoods more quickly than the Spanish words with sparse neighborhoods.
Three common psycholinguistic tasks were used to assess how well the college students learned the Spanish words. These tasks are also commonly used in studies of word learning (e.g., Storkel, Reference Storkel2001; Storkel et al., Reference Storkel, Armbruster and Hogan2006; Storkel & Maekawa, Reference Storkel and Maekawa2005). The first task was a picture-naming task in which the participant is presented with a line-drawing of the learned object, and must respond with the newly learned Spanish word. The second task was a referent identification task in which the participant hears the newly learned Spanish word and must select the correct object from three line-drawings. The third task was a perceptual identification task in which the participant hears the newly learned Spanish word embedded in noise and must say the word they thought they heard.
These three tasks were selected to assess word learning via production (e.g. picture-naming task) and comprehension (e.g., referent identification task). These three tasks were also selected to assess different aspects of word learning, namely lexical configuration and lexical engagement (Gaskell & Dumay, Reference Gaskell and Dumay2003; Leach & Samuel, Reference Leach and Samuel2007). Lexical configuration refers to the factual knowledge associated with a word, such as the sounds and letters found in the word, as well as its meaning. When learning the novel Spanish word (el) pato, the student learns that the sounds /p, a, t, o/ occur in the word and occur in that order, that the word is masculine, and is equivalent to the noun “duck” in English. Lexical configuration was assessed immediately after training with the picture-naming and referent identification tasks, because one need only learn the “factual” knowledge about a word to use the correct name when presented with a picture depicting that word, as in the picture-naming task, or correctly indicate which picture is being referred to when presented with several options, as in the referent identification task (Leach & Samuel, Reference Leach and Samuel2007).
In contrast, lexical engagement refers to the dynamic interaction of a (newly learned) word-form with other (known) word-forms or with sublexical representations (Leach & Samuel, Reference Leach and Samuel2007). For example, during word recognition the newly learned word pato activates other similar-sounding words that are known and stored in the lexicon (e.g., dato, palo, pata, plato, gato, paso, rato and pavo). The activation of many similar-sounding Spanish words will result in the rapid and accurate retrieval of the word pato (Vitevitch & Rodríguez, Reference Vitevitch and Rodríguez2005).Footnote 2 Previous studies have demonstrated that the recognition of a word in the noise-degraded conditions associated with the perceptual identification task is influenced by the number of words that the target word sounds like (Luce & Pisoni, Reference Luce and Pisoni1998). Given the sensitivity of this task to the influence of neighborhood density, the perceptual identification task was used to assess lexical engagement in the present study, thereby demonstrating that processing of the recently learned word is affected by the (partial) activation of other known words in the lexicon (Leach & Samuel, Reference Leach and Samuel2007).
In the first session of the experiment, the picture-naming and referent identification tasks were used to obtain baseline measures of performance with the to-be-learned words. The baseline measures of performance in these two tasks served several purposes. First, the baseline measures allowed us to verify that participants had little to no previous knowledge of the to-be-learned words selected as stimuli for the experiment, as evidenced by low rates of accuracy in each task. Second, the baseline measures served as a benchmark against which learning of the word-forms could be demonstrated, as indicated by improved performance in the same tasks after training (immediately and with a longer delay) compared to performance in the tasks at baseline.
Finally, the baseline measures obtained in the picture-naming and referent identification tasks provided us with an important control condition enabling us to rule out any pre-existing differences between the dense and sparse stimuli, and the influence of potential confounding variables associated with the stimuli. Although we considered a number of relevant variables when selecting the stimuli for the present study (see the “Methods” section), it is possible that some potentially confounding variable might have been overlooked. If equivalent performance were observed for the two conditions (dense and sparse words) in the baseline condition we could rule out the possibility that neighborhood density, any of the other relevant measures or some other unknown, overlooked variable associated with neighborhood density differentially affected performance in the tasks.
Furthermore, the repeated measures design employed in the present study allowed us to use each subject as their own control, and is therefore statistically more powerful than a control condition employing a between-subjects design, allowing us to detect even small (potentially confounding) influences should they exist. Moreover, the use of each subject as their own control eliminates other problems that might arise in using another group of participants in a control condition or “control” experiment, such as differences in vocabulary that exist between adults learning Spanish later in life and native Spanish-speaking adults of the same age, or differences that exist in the tasks used in the present experiment and the task used in a “control” experiment.
Immediately after exposure to the to-be-learned words via repeated pairings of the word spoken over headphones and the visual presentation of the object (i.e., a line drawing), participants again took part in the picture-naming and referent identification tasks. These tasks enabled us to assess how well participants learned the “factual” information associated with the to-be-learned word-forms (i.e., lexical configuration).
Approximately 48–72 hours after the first session, participants returned to the lab to again perform the picture-naming and referent identificiation tasks. Work by Dumay and Gaskell (Reference Dumay and Gaskell2007, and others) suggests that a period of sleep is required to consolidate newly learned lexical items into the lexicon, thereby enabling known words to exert an influence on the newly learned word, and vice-versa (i.e., lexical engagement). After this 48–72 hour period, participants returned to the laboratory and again took part in the picture-naming and referent identification tasks, and also performed the perceptual identification task. Note that participants did not receive any additional exposure to the to-be-learned words in the laboratory. As the work by Dumay and Gaskell (Reference Dumay and Gaskell2007, and others) suggests, this period of time should be sufficient for the newly learned word to be integrated into the lexicon, allowing us to use the perceptual identification task to assess lexical engagement, or the extent to which the to-be-learned words interacted with Spanish words that were already known.
In short, the present study examined the word-learning mechanism proposed by Storkel et al. (Reference Storkel, Armbruster and Hogan2006) in a new context, namely, English speakers learning Spanish as a foreign language. This work further differs from previous studies in that participants learned real (Spanish) words rather than specially constructed nonsense words that conformed to the phonotactics of the target language and were associated with nonsense objects as referents (e.g., Storkel, Reference Storkel2001; Storkel et al., Reference Storkel, Armbruster and Hogan2006). Finally, previous studies have primarily examined only one aspect of word-learning − lexical configuration − and only in the native language (e.g., Storkel, Reference Storkel2001; Storkel et al., Reference Storkel, Armbruster and Hogan2006; Swingley & Aslin, Reference Swingley and Aslin2000, Reference Swingley and Aslin2007). The present study examined lexical configuration and lexical engagement, and did so in the context of learning words in a real, foreign language.
Method
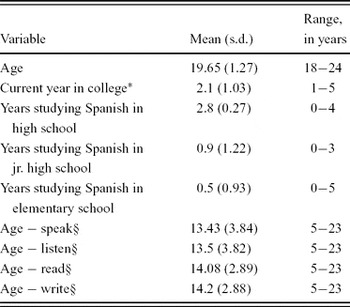
Forty-two native English speakers who were enrolled in third semester Spanish at the University of Kansas participated in both sessions of the experiment. All of the participants were rated at the Intermediate level of the ACTFL Proficiency Guidelines-Speaking, rev. 1999 (Breiner-Sanders, Lowe, Miles & Swender, Reference Breiner-Sanders, Lowe, Miles and Swender2000). Additional information regarding the fluency and language experience of the participants can be found in Table 1. Participants were recruited by word of mouth and fliers, and received monetary compensation in exchange for their participation. None of the participants reported a history of a speech or hearing disorder.
Summary of participant language experiences.

notes: * 1 = freshman, 2 = sophomore, 3 = junior, 4 = senior, and 5 = graduate school.
§ age participant reported learning a Spanish language skill; many participants reported learning the Spanish words for numbers and colors in kindergarten with little subsequent exposure to the language until formal language classes in junior high.
Each participant completed a questionnaire (derived from Li, Sepanski & Zhao, Reference Li, Sepanski and Zhao2006) that asked about their use and experience with the Spanish language: languages spoken at home, parental fluency in other languages, amount of Spanish used/exposed to in daily activities, manner of learning Spanish, age at which Spanish was acquired, point in school that language instruction began, other Spanish classes taken at the university level, other languages spoken, language preference, and foreign countries resided in or visited for more than three months (no participant reported visiting or living in a foreign country for more than three months). See Table 1 for a partial summary of the responses from this questionnaire.Footnote 3
Stimuli
Sixteen words were selected from materials used in fourth semester or greater Spanish classes to minimize the likelihood that the words would be familiar to the participants. All of the words had a consonant−vowel (CV) syllable structure, were two syllables in length (i.e., CV.CV where “.” indicates a syllable break), and were nouns that could be depicted as a black and white line drawing (e.g., Snodgrass & Vanderwart, Reference Snodgrass and Vanderwart1980). The stimuli used in the experiment are listed in the Appendices.
As in most previous studies examining neighborhood density, a median split of words with these characteristics was used to categorize potential stimulus items as having a dense or sparse neighborhood (based on the addition, deletion or substitution of a single phoneme into any position of the target word, e.g., casa /kasa/ has as neighbors taza /tasa/, cosa /kosa/, cada /kada/, caso /kaso/ and casar /kasar/ among other words). Words with more than three neighbors (i.e., the median value of neighbors in the set of potential stimuli) were considered to have a dense neighborhood, and words with less than three neighbors were considered to have a sparse neighborhood.
Although there are concerns associated with dichotomizing continuous variables (e.g., Cohen, Reference Cohen1983), other studies have analyzed neighborhood density effects using regression techniques and found results that are qualitatively similar to the results obtained in studies that dichotomized the continuous variable of neighborhood density (e.g., Spieler & Balota, Reference Spieler and Balota2000; Storkel, Reference Storkel2009). More importantly, however, the concerns typically associated with dichotomizing continuous variables do not apply to the variable of neighborhood density, as MacCallum, Zhang, Preacher and Rucker (Reference MacCallum, Zhang, Preacher and Rucker2002, p. 38) noted that “dichotomization might be justified. . .where the distribution of a count variable is extremely highly skewed, to the extent that there is a large number of observations at the most extreme score on the distribution”. The extremely highly skewed distribution of neighborhood density has been shown in English (Vitevitch, Reference Vitevitch2008), as well as in Spanish, Hawaiian, Basque and Chinese (Arbesman, Strogatz & Vitevitch, Reference Arbesman, Strogatz and Vitevitch2010b): there are many words with no (or few) neighbors, and few words with many neighbors. (Also see Preacher, Rucker, MacCallum and Nicewander (Reference Preacher, Rucker, MacCallum and Nicewander2005) for additional reasons to use the extreme groups approach, as employed in the present study.)Footnote 4
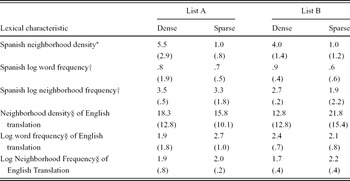
Half of the selected items had a dense phonological neighborhood and half had a sparse phonological neighborhood. These items were split into two lists (A and B) with equal numbers of dense and sparse words on each list. Although the difference in neighborhood density between conditions was statistically significant (F(1,12) = 18.24; p < .05), there was no main effect of list, nor an interaction between neighborhood density and list (both F(1,12) < 1, p > .05).
The same number of word onsets appeared in each condition and on each list. We used two lists of words for two reasons. First, reducing the number of stimuli to eight words per list reduced the number of words that each participant was asked to learn to a reasonable and cognitively manageable number of words (which has been estimated at 8–10 words a day; McMurray, Reference McMurray2007). Second, using two lists of words provided us with the opportunity to demonstrate the influence of neighborhood density on word learning in Spanish with more words, enabling us to generalize our findings more broadly.
Neighborhood density was computed from a lexicon containing approximately 3,900 words (n.b.: proper nouns and conjugated verb forms were not included in the lexicon), obtained from the glossary of the textbook ¿Sabías que. . . ?: Beginning Spanish (VanPatten, Lee & Ballman, Reference VanPatten, Lee and Ballman2004). This resource is available online to the research community as “The Beginning Spanish Lexicon” (Vitevitch, Stamer & Kieweg, unpublished observations).
Some participants might, of course, know more words than those found in The Beginning Spanish Lexicon, and some participants might not know all of the words found in The Beginning Spanish Lexicon. However, using dictionaries and other collections of words is the standard and conventional approach used in psycholinguistic research to estimate neighborhood density (e.g., Luce & Pisoni, Reference Luce and Pisoni1998). We reasoned that the words in The Beginning Spanish Lexicon (i.e., the words from the glossary of a textbook used in the first and second semester Spanish-language classes) would better represent the vocabulary of a typical student enrolled in a third semester college-level Spanish class than simply using the most frequent words, or a random sample of words from a resource commonly used in psycholinguistic studies of native speakers of Spanish (e.g., Sebastián Gallés, Martí Antonín, Carreiras Valiña & Cuetos Vega, Reference Sebastián Gallés, Martí Antonín, Carreiras Valiña and Cuetos Vega2000). As with any measurement, there is undoubtedly measurement error. Nevertheless, computing neighborhood density from The Beginning Spanish Lexicon serves as a good approximation for the present study.
Because the stimulus words were selected to be unknown to the participants, the frequency with which all of these items appear to the participants in ambient usage is presumed to be 0. However, we verified that the stimulus items did not differ in word frequency based on native Spanish-speaker norms (Sebastián Gallés et al., Reference Sebastián Gallés, Martí Antonín, Carreiras Valiña and Cuetos Vega2000); there were no differences in native speaker word frequency between conditions or list, and no interaction of word frequency and list (all Fs(1,12) < 1, p > .05; means and standard deviations listed in Table 2). The frequency of the phonological neighbors (i.e., neighborhood frequency) was also assessed using native Spanish-speaker norms; again there were no statistically significant main effects or interactions (all Fs(1,12) < 1, p > .05; means and standard deviations listed in Table 2).
Means (and standard deviations) for various lexical characteristics of the stimuli.

notes: * based on the Beginning Spanish Lexicon (Vitevitch, Stamer & Kieweg, unpublished observations).
† based on native-Spanish norms in Sebastián Gallés et al. (Reference Sebastián Gallés, Martí Antonín, Carreiras Valiña and Cuetos Vega2000).
§ based on native-English adult norms in Storkel & Hoover (Reference Storkel and Hoover2010).
Word frequency and neighborhood frequency are log10 values of occurrences per million. Standard deviations are listed below the means in parentheses.
Because the native English participants might use a translation strategy to assist them in learning the Spanish words, we verified that the English translations of the stimuli were also equivalent in word frequency, neighborhood density and neighborhood frequency (based on the adult norms in Storkel & Hoover, Reference Storkel and Hoover2010). There were no statistically significant main effects or interactions for the English translation equivalents of the Spanish words (all Fs(1,12) < 2.34, all ps > .05). See Table 2 for additional information.
Recent research suggests that the age of acquisition (AoA) of a concept in the native language can influence processing of newly acquired words in a second language (Palmer & Havelka, Reference Palmer and Havelka2010). We verified that AoA ratings (Cortese & Khanna, Reference Cortese and Khanna2008) for the English translations of the dense and sparse Spanish words used in the present experiment were comparable. The seven dense words found in the AoA database (Cortese & Khanna, Reference Cortese and Khanna2008; the bisyllabic English word bullet was not in the database) had a mean rating of 3.2 (SD = .8), and the seven sparse words found in the database (the bisyllabic English word pitcher was not in the database; also note that the AoA rating of pail was used for bucket) had a mean rating of 3.0 (SD = .4). This difference was not statistically significant (t(12) = .55, p = .60).
Because previous research in visual word recognition suggests that word forms in one language might activate similar word forms in another language (e.g., Smits, Sandra, Martensen & Dijkstra, Reference Smits, Sandra, Martensen and Dijkstra2009), we verified that the Spanish words did not differ in the number of English words that they resembled (i.e., neighborhood density) or the frequency with which those English neighbors occurred (i.e., neighborhood frequency). The dense Spanish words had a mean of 1.13 English words as phonological neighbors (SD = 1.25), and the sparse Spanish words had a mean of .63 English words as phonological neighbors (SD = .52; t(14) = 1.05, p = .31). The small number of English words that were phonological neighbors of the Spanish words is not surprising (Vitevitch, in press). With regards to the neighborhood frequency of the English words, the dense Spanish words had a mean (log10) neighborhood frequency of .70 (SD = .78) and did not differ significantly from the sparse Spanish words, which had a mean (log10) neighborhood frequency of .87 (SD = 1.09; t(14) = .37, p = .71).
A native speaker of Spanish from Bolivia recorded all stimuli using a high-quality microphone at a normal speaking rate in an IAC sound-attenuated booth. The stimuli were recorded digitally using a Marantz PMD671 solid-state recorder at a sampling rate of 44.1 kHz. The sound files were edited using Sound Edit 16 (Macromedia, Inc.). The amplitude of the sound files was adjusted with the Normalize function to amplify the words to their maximum value without clipping or distorting the sound and without changing the pitch of the words. The differences in the duration of the sound files were not statistically significant (i.e., no main effects nor an interaction; all Fs(1,12) < 2.52, p > .05).
Procedure
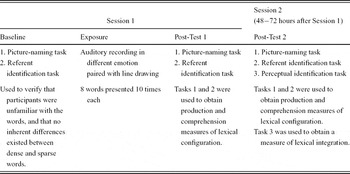
As summarized in Table 3, the experiment consisted of baseline testing (picture-naming and referent identification tasks), an exposure phase, a post-test session immediately after exposure employing the picture-naming and referent identification tasks (Post-Test 1), and a post-test session approximately 48–72 hours after the first post-test session employing the picture-naming, referent identification and perceptual identification tasks (Post-Test 2). This procedure is similar to that employed in other word-learning studies (e.g., Gaskell & Dumay, Reference Gaskell and Dumay2003; Leach & Samuel, Reference Leach and Samuel2007; Storkel et al., Reference Storkel, Armbruster and Hogan2006).
Time-line and description of the word-learning tasks.

Baseline testing
In the baseline testing session, participants took part in the picture-naming and referent identification tasks. The baseline measures in these tasks: (1) allowed us to verify that participants had little to no previous knowledge of the to-be-learned words, (2) served as a benchmark against which learning of the word-forms could be demonstrated, and (3) provided us with an important control condition enabling us to rule out potential confounding variables associated with the stimuli. The picture that was correctly named by sixteen participants (bota “boot”) in the baseline picture-naming task was removed from all of the final analyses (thus, accuracy rates may be based on different denominators for some participants). Methodological details regarding the exposure phase and the three tasks (picture-naming, referent identification and perceptual identification) are provided below.
Exposure phase
After the baseline picture testing session, the participant was exposed to the eight Spanish words that were to be learned (4 dense and 4 sparse). Exposure consisted of an auditory recording of the word (over a pair of Beyerdynamic DT 100 headphones) paired with the visual presentation of the appropriate black and white line drawing (i.e., the same pictures used in the referent identification task). On each exposure a picture was presented for 3000 ms with one presentation of the audio recording. Each picture–word pair was presented for a total of ten exposures in a random order. An iMac running PsyScope 1.2.2 (Cohen, MacWhinney, Flatt & Provost, Reference Cohen1993) was used to control stimulus presentation.
A typical exposure trial proceeded as follows: a language-neutral prompt (i.e., a string of asterisks) appeared on the screen for 500 ms to signal the start of a trial. Immediately following the prompt, a picture and an auditorily recorded word were presented. The participant heard the word at the same time the picture appeared on the screen. However, the picture remained on the screen until 3000 ms elapsed. Because previous research demonstrated the benefits of learning words in the context of high levels of variability, each word was presented in a different emotional intonation (2 exposures of each emotion): happy, sad, angry, neutral and frightened (Singh, Reference Singh2008). No response was required from the participant.
Picture-naming task
In the picture-naming task, participants were seated in front of an iMac running PsyScope 1.2.2. (Cohen et al., Reference Cohen, MacWhinney, Flatt and Provost1993) wearing a set of Koss SB-30 headphones equipped with a microphone that was interfaced to a voice-activated response switch. Each trial in the picture-naming task proceeded as follows: a language-neutral prompt (i.e., a string of asterisks) appeared on the screen for 500 ms to signal the start of a trial. Immediately following the prompt one of the black and white line drawings was presented on the screen.
The participant was asked to name the picture in Spanish as accurately as possible. The verbal response from the participant triggered the voice-activated switch, and the next trial began. Verbal responses were recorded by the researcher as they occurred and using a Marantz PMD671 solid-state recorder to enable reliable assessment of each response. Consistent with previous studies of word learning, rates of accurately producing the newly learned words served as the dependent measure. A response was scored as correct if all the phonemes matched the intended stimulus and incorrect if one or more phonemes did not match the intended stimulus. The only exception was for words with /p/ in the initial position; due to the voice onset time differences between Spanish and English (Lisker & Abramson, Reference Lisker and Abramson1964) a /p/-like and a /b/-like pronunciation were both considered correct. Responses due to an improper triggering of the voice-activated switch (i.e., filled hesitations like “uh”, partial repetitions like “pa-pato”, or use of an article like “el pato”) were excluded from the final analyses, resulting in the loss of less than 1% of the data.
The picture-naming task was used in the baseline testing session to verify that participants were not already familiar with the to-be-learned Spanish words, and to serve as a control condition. The picture-naming task was then used in Post-Test 1 and Post-Test 2 as a production-based measure of one aspect of word learning, namely lexical configuration (Leach & Samuel, Reference Leach and Samuel2007).
Referent identification task
In the referent identification task, the participant wore a pair of Beyerdynamic DT 100 headphones while seated in front of an iMac running PsyScope 1.2.2 (Cohen et al., Reference Cohen, MacWhinney, Flatt and Provost1993). The computer was interfaced with a New Micros button box. Each trial proceeded as follows: a language-neutral prompt (i.e., a string of asterisks) appeared on the screen for 500 ms to signal the start of a trial. Immediately following the prompt, three pictures appeared simultaneously on the screen, and a target word was presented auditorily over the headphones. The auditory recording was presented only once, and in a neutral intonation.
The three pictures included the target referent, and two other “foil” pictures (n.b.: all of the pictures were of the to-be-learned words). One foil picture had the same phonemic onset as the target word, and the other foil had an onset that differed from the target word. Neither foil was semantically related to the target. Each picture appeared once as a target in the task, and again as a foil for another target word. We used only to-be-learned words (i.e., pictures) as foils to prevent participants from strategically selecting the one object in the array of three pictures that they had seen previously in the training session. Because participants had been exposed previously to all of these pictures (and seen each picture an equal number of times in the referent identification task because of counterbalancing), successful performance in the referent identification task could only occur if the participant had indeed learned the correct mapping between the word-form and the referent.
Under each picture a colored dot appeared, corresponding to the colored buttons on the response box (red, yellow and green). Participants were instructed to press the button on the response box that corresponded to the picture of the word that was heard over the headphones.
Like the picture-naming task, the referent identification task was used in the baseline testing session to verify that participants were not already familiar with the to-be-learned Spanish words, and as a “control” condition to rule out other potentially confounding stimulus characteristics. The referent identification task was also used in Post-Test 1 and Post-Test 2 as a receptive-based measure of word learning, namely lexical configuration (Leach & Samuel, Reference Leach and Samuel2007).
Perceptual identification task
In the perceptual identification task, participants heard words mixed with noise, and were asked to say the word that they thought they heard. Participants were seated in front of an iMac running PsyScope 1.2.2 (Cohen et al., Reference Cohen, MacWhinney, Flatt and Provost1993), and wore a pair of Koss SB-30 headphones with a mounted microphone. Each trial proceeded as follows: a language-neutral prompt (i.e., a string of asterisks) appeared on the screen for 500 ms to signal the start of a trial. Immediately following the prompt, a word was presented over the headphones mixed with white noise (at a +18 dB signal-to-noise ratio) and participants said the word that they thought they heard. A microphone was used to record each response, but the microphone was not interfaced to a voice-activated response switch. Each word was presented only one time, but participants had as much time as needed to change their response if they wished before pressing the spacebar and initiating the next trial. A total of 32 words were presented to the participants in a random order in the perceptual identification task: the 8 target words and 24 Spanish words that were likely to be known by language students at this level (i.e., they were from the textbook used in the third semester Spanish class).
The perceptual identification task was used to measure lexical integration (Leach & Samuel, Reference Leach and Samuel2007). Because work by Dumay and Gaskell (Reference Dumay and Gaskell2007) suggests that a period of sleep is required for lexical integration to occur, the perceptual identification task was performed only in Post-Test 2, which occurred 48–72 hours after Session 1.
Results
Picture-naming task
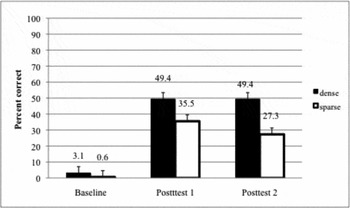
A repeated-measures ANOVA revealed a significant interaction between the three testing sessions (Baseline, Post-Test 1 and Post-Test 2) and neighborhood density (dense and sparse; F(2,78) = 8.63, p < .05), suggesting that participants indeed learned the Spanish words after exposureFootnote 5 (see Figure 1). To further assess the influence of neighborhood density on word learning, post-hoc comparisons with Bonferoni correction were used to compare dense and sparse words in each testing session. At the baseline testing session performance was, not surprisingly, quite poor, indicating that participants had little prior knowledge of these Spanish words. More important, there was no difference in correctly naming dense (mean = 3.1%; SD = 1.2) and sparse words (0.60%; SD = 0.60) in the baseline testing session (t(40) = 1.67, p > .05), suggesting that any potentially confounding variables that may exist among the stimuli do not differentially affect responses to the dense and sparse items.
Accuracy rates for the picture-naming task for the baseline testing session, and the two Post-Test sessions. Error bars represent standard deviations.

Immediately after exposure, however, participants more accurately named pictures of dense words (mean = 49.4%; SD = 4.3) than pictures of sparse words (mean = 35.5%; SD = 4.7) in the Post-Test 1 picture-naming task (t(40) = 3.18, p < .05, d = 3.1),Footnote 6 indicating that participants learned the dense words better than the sparse words. A similar result was observed in Post-Test 2, which occurred 48–72 hours after Post-Test 1. Participants more accurately named pictures of dense words (mean = 49.4%; SD = 4.6) than pictures of sparse words (mean = 27.2%; SD = 3.8) in the Post-Test 2 picture-naming task (t(40) = 5.27, p < .05, d = 5.3). Note that there was no statistically significant difference in performance comparing Post-Test 1 to Post-Test 2 (F(1,40) < 1).
Referent identification task
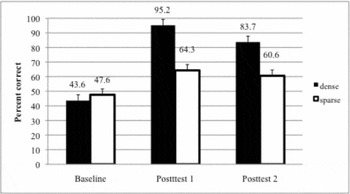
Performance in the baseline testing session of the referent identification task did not differ from chance performance (given three alternatives, chance = 33%; in a binomial test of proportions, p > .72, Graphpad Software, Reference Graphpad Software2002–2005), suggesting that participants had little prior knowledge of these Spanish words. A repeated-measures ANOVA revealed a significant interaction between the three testing sessions (Baseline, Post-Test 1 and Post-Test 2) and neighborhood density (dense and sparse; F(2,78) = 13.61, p < .05), suggesting that participants indeed learned the Spanish words after exposure (see Figure 2). To further assess the influence of neighborhood density on word learning, post-hoc comparisons with Bonferoni correction were used to compare dense and sparse words in each testing session. At the baseline testing session there was no difference in correctly identifying referents with dense (mean = 43.6%; SD = 4.2) and sparse words (mean = 47.6%; SD = 3.8; t(40) = −.76, p > .05), again ruling out influences from any potential confounding variables.
Accuracy rates in the referent identification task for the baseline testing session, and the two Post-Test sessions. Error bars represent standard deviations.

Immediately after exposure, however, participants more accurately identified referents with dense words (mean = 95.2%; SD = 1.8) than referents with sparse words (mean = 64.3%; SD = 3.6) in the Post-Test 1 referent identification task (t(40) = 8.07, p < .05, d = 10.8), indicating that participants learned the dense words better than the sparse words. A similar result was observed in Post-Test 2, which occurred 48–72 hours after Post-Test 1. Participants more accurately identified referents with dense words (mean = 83.7%; SD = 3.8) than referents with sparse words (mean = 60.6%; SD = 3.4) in the Post-Test 2 picture-naming task (t(40) = 4.43, p < .05, d = 6.4). Note that there was no statistically significant difference in performance comparing Post-Test 1 to Post-Test 2 (F(1,40) < 1).
Perceptual identification task
A repeated measures ANOVA was used to examine performance in the perceptual identification task. Participants more accurately identified the recently learned dense words embedded in noise (mean = 86.4%; SD = 2.7) than the recently learned sparse words embedded in noise (mean = 79.3%; SD = 3.3; F(1,39) = 4.49, p < .05, d = 2.3). These results suggest that the words from dense neighborhoods were recognized more accurately than words from sparse neighborhoods.
Discussion
The present study examined the influence of neighborhood density on word learning in a foreign language. Native English-speaking adults were asked to learn novel Spanish words – the foreign language they were studying at the college level – that varied in neighborhood density. In a production-based measure of lexical configuration using the picture-naming task, participants showed evidence of learning Spanish words with dense neighborhoods better than Spanish words with sparse neighborhoods. In a receptive-based measure of lexical configuration using the referent identification task, participants again showed evidence of learning Spanish words with dense neighborhoods better than Spanish words with sparse neighborhoods. These results are consistent with the results obtained in previous studies of word learning in infants (Hollich et al., Reference Hollich, Jusczyk, Luce, Skarabela, Fish and Do2002), toddlers (Storkel, Reference Storkel2009), preschool children (Storkel, Reference Storkel2001, Reference Storkel2003), college-age adults (Storkel et al., Reference Storkel, Armbruster and Hogan2006) and artificial neural networks (Vitevitch & Storkel, unpublished observations).
Like the previous studies, the present study examined the aspect of word learning known as lexical configuration (Leach & Samuel, Reference Leach and Samuel2007), in which factual knowledge associated with a word, such as the sounds and letters found in the word, and its meaning, is acquired and tested in the experiment. The present study significantly extends the previous work on word learning, however, by using real (Spanish) words with real-world referents rather than specially constructed non-words (consistent with English phonotactics) and specially constructed referents.
The present study also demonstrated that the same mechanism used to learn words in the native language might be used to learn words in a foreign language as well (see also Byers-Heinlein, Burns & Werker, Reference Byers-Heinlein, Burns and Werker2010). Recall that Storkel et al. (Reference Storkel, Armbruster and Hogan2006) suggested that the partial phonological overlap that exists between a novel word and the representations of known words in the lexicon strengthen the newly formed lexical representation of a novel word (see also Jusczyk, Luce & Charles-Luce, Reference Jusczyk, Luce and Charles-Luce1994; Vitevitch & Storkel, unpublished observations). A newly formed representation that resembles many known words in the lexicon will be strengthened to a greater extent than a newly formed representation that resembles few known words in the lexicon, giving novel words with dense neighborhoods an advantage over novel words with sparse neighborhoods. A similar mechanism accounts for the results obtained in the picture-naming and referent identification tasks, two tasks used in the present study to assess lexical configuration.
Most important, the present study extends previous word-learning research by not only examining lexical configuration but also by examining lexical engagement, or how a newly learned word-form dynamically interacts with other known word-forms (Leach & Samuel, Reference Leach and Samuel2007). The results from the perceptual identification task, a task used to assess lexical engagement in the present study, showed that Spanish words from dense neighborhoods were identified in noise more accurately than Spanish words from sparse neighborhoods. These results are consistent with the results obtained in previous studies of spoken word recognition in native speakers of Spanish (Vitevitch & Rodríguez, Reference Vitevitch and Rodríguez2005), where Spanish words from a dense neighborhood were recognized more quickly and more accurately than Spanish words from a sparse neighborhood (cf. Luce & Pisoni, Reference Luce and Pisoni1998, for the influence of neighborhood density on spoken word recognition in English). These results also suggest that participants not only learned the Spanish words presented to them in the experiment, but that they integrated these newly acquired word-forms with existing representations in their lexicon of Spanish words, highlighting the importance of examining multiple aspects of the word-learning process (e.g., lexical configuration and lexical engagement).
The results of the lexical engagement task (i.e., perceptual identification task) in the present experiment are important for another reason; they are consistent with work examining the influence of the native language (L1) on word recognition in a second language (L2). Although cross-language influences on processing, such as the activation or the inhibition of related word-forms, can be demonstrated (e.g., Smits et al., Reference Smits, Sandra, Martensen and Dijkstra2009), word recognition in L2 is primarily determined by within-language factors (e.g., Lemhöfer, Dijkstra, Schriefers, Baayen, Grainger & Zwitserlood, Reference Lemhöfer, Dijkstra, Schriefers, Baayen, Grainger and Zwitserlood2008). Recall that Spanish words from a dense neighborhood were recognized more accurately than Spanish words from a sparse neighborhood in the perceptual identification task used in the present study. This pattern of performance is consistent with the results of previous studies of spoken word recognition in native speakers of Spanish (Vitevitch & Rodríguez, Reference Vitevitch and Rodríguez2005), but it is different from what is typically observed in spoken word recognition in native speakers of English (Luce & Pisoni, Reference Luce and Pisoni1998), suggesting that the characteristics of Spanish (the L2) had a greater influence on processing the Spanish words than the characteristics of English (the L1) in this sample of native English speakers learning Spanish. (See footnote 2 for possible explanations for the different pattern of results observed in the two languages for the influence of neighborhood density on processing.)
One implication of the present findings relates to the manner in which the lexicon grows over time. If the same (or a similar) mechanism is used to learn words in the native and a foreign language, then the lexicon for a foreign language might also exhibit the same structural characteristics exhibited in several native languages (e.g., Arbesman et al., Reference Arbesman, Strogatz and Vitevitch2010b; Charles-Luce & Luce, Reference Charles-Luce and Luce1990; Vitevitch, Reference Vitevitch2008). Using the tools of network science to construct a network of phonologically related word-forms in several languages – English, Spanish, Chinese, Hawaiian and Basque – Arbesman et al. (Reference Arbesman, Strogatz and Vitevitch2010b) found several unique structural features: (1) a large highly interconnected group of phonologically related words (referred to as the largest component), as well as many islands (words that were phonologically related to each other – such as faction, fiction and fission – but not to other words in the largest component) and many hermits, or words with no phonological neighbors; the largest component exhibited (2) the characteristics of a small-world network;Footnote 7 (3) assortative mixing by degree (a word with many neighbors tends to have neighbors that also have many neighbors; Newman, Reference Newman2002), and (4) a degree distribution that deviated from a power-law.
If the same (or a similar) mechanism is used to learn words in the native and a foreign language, then one could test the prediction that the network structure of a foreign language learned later in life should also exhibit the four structural features described above despite differences in exposure to a native language (i.e., constant) compared to a foreign language (i.e., several hours a week in a classroom setting), and despite the thematic/semantic focus of lessons that typically occur in foreign-language classrooms. Given that recent work has demonstrated how certain small-world characteristics of the lexicon influence processes like spoken word production (Chan & Vitevitch, Reference Chan and Vitevitch2010) and spoken word recognition (Chan & Vitevitch, Reference Chan and Vitevitch2009), a fruitful area for future research might be to examine proficiency in the foreign language as a function of the emergence of such structural characteristics in the foreign language lexicon. Perhaps individuals who have foreign-language networks that more closely resemble those of native speakers of that language will be more proficient in that language than individuals who have foreign-language networks that do not closely resemble those of native speakers of that language. This possibility, as well as the results of the present study, may also have pedagogical implications for the teaching of foreign languages.
Appendices
Spanish words with dense phonological neighborhoods used as stimuli.

Spanish words with sparse phonological neighborhoods used as stimuli.