Introduction
When people learn a new language, the syntactic features of that language need to be represented in their mind. According to the principles of node structure theory (MacKay, Reference MacKay, Heuer and Sanders1987), syntactic representations are organized in a network of representational nodes. On the one hand, such representations need to be specific enough to capture differences with representations that are already available (e.g., native language or L1 representations), but on the other hand, for reasons of economy, the representational structure should be kept as simple as possible. This implies that, when there are strong similarities between representations, these will often merge into one single representation. In other words, when a syntactic structure is very similar in L1 and the new language, the representation of this structure may become shared across these languages (Hartsuiker & Bernolet, Reference Hartsuiker and Bernolet2017; Hartsuiker, Pickering & Veltkamp, Reference Hartsuiker, Pickering and Veltkamp2004). This paper investigates the role of structural frequency in the sharing of syntax.
It is often assumed that the sharing of syntactic structures across languages is reflected in the emergence of structural priming between languages (e.g., Hartsuiker et al., Reference Hartsuiker, Pickering and Veltkamp2004; Loebell & Bock, Reference Loebell and Bock2003). Structural priming is the phenomenon by which the processing of a syntactic structure is facilitated through recent exposure to a sentence containing that structure (Bock, Reference Bock1986). For instance, when a speaker hears a passive sentence, such as “the mouse is being chased by the cat”, the speaker will be more likely to produce a passive sentence as well (e.g., “the cheese is being eaten by the dog”) although they would normally prefer to use an active sentence (e.g., “the dog is eating the cheese”). According to the lexicalist account of structural priming (Pickering & Branigan, Reference Pickering and Branigan1998), the syntactic network in the mind consists of lexical nodes (representing nouns or verbs) that are connected with combinatorial nodes (representing structural combinations in which a lexical item may appear). When a speaker encounters a sentence, both the corresponding lexical node and combinatorial node receive activation that does not immediately disappear. If, shortly after, a new sentence is processed that allows the same structural combination as the previous sentence, the residual activation of the combinatorial node results in facilitated processing of that sentence structure. In terms of production, this means that the speaker will be more likely to use the same structure as the one that was present in the preceding sentence.
This probability becomes even larger when there is lexical overlap between consecutive sentences (i.e., the lexical boost effect), given that not only the residual activation of the combinatorial node, but also that of the lexical node, and of the connection between both nodes, influences processing of the next sentence (Pickering & Branigan, Reference Pickering and Branigan1998). Furthermore, there is a semantic boost effect to structural priming, when lexical items in both sentences are semantically related (Cleland & Pickering, Reference Cleland and Pickering2003). Interestingly, priming is also observed between prime and target pairs that are formulated in a different language (i.e., when a similar structure exists in both languages, e.g., Cai, Pickering, Yan & Branigan, Reference Cai, Pickering, Yan and Branigan2011; Hartsuiker, Beerts, Loncke, Desmet & Bernolet, Reference Hartsuiker, Beerts, Loncke, Desmet and Bernolet2016; Kantola & van Gompel, Reference Kantola and van Gompel2011; Loebell & Bock, Reference Loebell and Bock2003; see Hartsuiker & Pickering, Reference Hartsuiker and Pickering2008; van Gompel & Arai, Reference van Gompel and Arai2018, for a review). Between-language structural priming includes a translation-equivalent boost in priming when translation equivalents are present in the prime and target (Schoonbaert, Hartsuiker & Pickering, Reference Schoonbaert, Hartsuiker and Pickering2007). In sum, the results obtained with the structural priming paradigm suggest that syntactic representations are rather abstract in nature and are shared between languages.
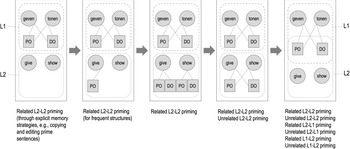
But how is such sharing established during second language (L2) learning? The developmental theory of Hartsuiker and Bernolet (Reference Hartsuiker and Bernolet2017) proposes that L2 syntactic representations become gradually more abstract with increasing L2 proficiency (see Figure 1). In early stages of acquisition, L2 learners form item-specific syntactic representations (e.g., the node for the English verb give is connected to the node for the double-object dative construction, henceforth DO). When the learner becomes more proficient, syntactic representations are abstracted over verbs (e.g., the nodes for various English ditransitive verbs, such as give and show are connected to the node for the DO construction) and finally also across languages (e.g., the English verbs give and show, and the Dutch verbs geven and tonen appear with a DO construction). During this abstraction process, item- and language-specific representations disappear once they are merged into more abstract and cross-linguistic representations. Cross-linguistic priming can be observed in the final stage of the theory.
Hartsuiker & Bernolet's (Reference Hartsuiker and Bernolet2017) developmental theory.

Evidence for this idea comes from production studies that compared priming within L1 and L2 and between L1 and L2 (Bernolet, Hartsuiker & Pickering, Reference Bernolet, Hartsuiker and Pickering2013; Schoonbaert et al., Reference Schoonbaert, Hartsuiker and Pickering2007). These studies found that between-language priming effects became larger with increasing L2 proficiency in conditions where there was no lexical overlap between prime and target sentence. In addition, Kim and McDonough (Reference Kim and McDonough2008) found that the difference between item-specific and abstract priming was larger in low proficient L2 speakers than in intermediate and high proficient ones. This suggests that abstract syntactic representations are mainly present in high-proficient speakers. Another line of evidence stems from a series of studies that investigated structural priming in an artificial language (AL) learning paradigm (Muylle, Bernolet, & Hartsuiker, Reference Muylle, Bernolet and Hartsuiker2020, Reference Muylle, Bernolet and Hartsuiker2021, Reference Muylle, Bernolet and Hartsuikerin press; Weber, Christiansen, Indefrey, & Hagoort, Reference Weber, Christiansen, Indefrey and Hagoort2019), that allows to study the development of shared syntactic representations in very early stages of L2 acquisition. In a multiple session version of this paradigm, Muylle and colleagues (Reference Muylle, Bernolet and Hartsuiker2021) found evidence for a gradual development of shared syntactic representations in ditransitives (i.e., DO datives and prepositional-object datives, henceforth PO), given that cross-linguistic priming only reliably emerged from the second day of training (in contrast to transitives, which showed cross-linguistic priming already on the first day).
The role of frequency
Importantly, Hartsuiker and Bernolet's (Reference Hartsuiker and Bernolet2017) developmental theory predicts that more frequent structures will be represented and shared before less frequent ones, based on the findings from Bernolet and colleagues (Reference Bernolet, Hartsuiker and Pickering2013), who found abstract priming within L2 English and from L1 Dutch to L2 English for of-genitives (which are frequent in both L1 Dutch and L2 English, e.g., “the hat of the farmer”), but not for the less frequent s-genitives (e.g., “the farmer's hat”) in low proficient L2 speakers. In contrast, higher proficient speakers did show priming for both genitives in all conditions. It has to be noted, though, that the s-genitive is also morphologically more difficult than the of-genitive and this might also explain why lower proficient L2 speakers did not show priming. However, McDonough (Reference McDonough2006) found a similar pattern with ditransitives (i.e., low proficient L2 speakers of English showed priming for the frequent PO structure, but not for the less frequent DO structure), despite similar difficulty of the DO and PO structure. Furthermore, an AL learning study by Wonnacott, Newport and Tanenhaus (Reference Wonnacott, Newport and Tanenhaus2008) showed that learners produce frequent structures in the AL more often than less frequent ones, which suggests that the statistical features of the AL were reflected in the learners’ AL productions. In contrast, a recent study investigating structural priming in comprehension during AL learning by Weber et al. (Reference Weber, Christiansen, Indefrey and Hagoort2019) did not find any effect of the frequency of word orders in the AL.
Despite the fact that the developmental theory provides clear predictions about which structure should be shared first, it does not explain how frequency impacts the representations of these structures once they have been shared. Indeed, one important phenomenon in priming that is not accounted for by the developmental theory (and other lexicalist accounts of priming, see Reitter, Keller & Moore, Reference Reitter, Keller and Moore2011, for a discussion) is the fact that low-frequent structures usually elicit stronger priming than high-frequent ones (e.g., Chang, Janciauskas & Fitz, Reference Chang, Janciauskas and Fitz2012; Ferreira & Bock, Reference Ferreira and Bock2006; Hartsuiker & Westenberg, Reference Hartsuiker and Westenberg2000; Jaeger & Snider, Reference Jaeger and Snider2013; Scheepers, Reference Scheepers2003). This is often referred to as the inverse frequency effect. An explanation for this phenomenon is provided by the error-based learning account of priming by Chang, Dell and Bock (Reference Chang, Dell and Bock2006), who claim that encountering infrequent structures results in stronger learning of that structure because this structure violates the speaker's predictions. Similarly, the ACT-R theory of structural priming (Reitter et al., Reference Reitter, Keller and Moore2011) predicts that the learning of a structure depends on its prior probability: the higher the probability of a structure, the smaller the adjustment of weights will be when encountering that structure.
In a bilingual context, however, it is unclear whether speakers are influenced by the frequency distributions of L1, L2, or both. It has been shown that frequency preferences can be inherited from a language that is currently not in use (Nicoladis, Reference Nicoladis2006; Runnqvist, Gollan, Costa & Ferreira, Reference Runnqvist, Gollan, Costa and Ferreira2013). For instance, in Muylle and colleagues’ AL learning studies, the learners (who had Dutch as L1, a PO-biased language) largely preferred the PO over the DO structure when producing in an AL that was unbiased in terms of preference (i.e., DO and PO had the same frequency), at least when the word order was the same in both languages (Muylle et al., Reference Muylle, Bernolet and Hartsuiker2021, Reference Muylle, Bernolet and Hartsuikerin press; Muylle, Bernolet, et al., Reference Muylle, Bernolet and Hartsuiker2020). In a recent study, Kaan and Chun (Reference Kaan and Chun2018) investigated priming of DOs and POs in L1 and Korean L2 speakers of English. For L1 speakers of American English, the DO structure is more frequent than the PO structure, whereas in the L2 English of Koreans the PO structure is more frequent, just as in their L1. Kaan and Chun (Reference Kaan and Chun2018) found inverse frequency effects in priming in line with both groups’ preferences: the L1 group showed more priming for the POs, whereas the L2 group showed more priming for the DOs. In contrast, two other production studies failed to find inverse frequency effects from L1 on priming within L2 (Flett, Branigan & Pickering, Reference Flett, Branigan and Pickering2013; Jackson & Ruf, Reference Jackson and Ruf2017). Hence, the evidence on the contribution of L1 and L2 frequency is rather mixed, although a more recent study by Montero-Melis and Jaeger (Reference Montero-Melis and Jaeger2019) suggests that L2 learners initially inherit their L1 preferences when learning an L2 (expressed by inverse frequency effects from L1), but increasingly take over L2 preferences when becoming more proficient.
Most studies conducted in this area focused on the effects of L1 frequency on L2 production, whereas the effects of L2 frequency on L1 production remain largely unexplored. In any case, cross-linguistic (inverse) frequency effects in the priming of certain structures can only exist if these structures are shared (or at least connected) between languages. If a structure is shared across L1 and L2, the frequency of both L1 and L2 might play a role during L1 production as well, given that activation of a structure will be determined by its frequency in both languages. Indeed, the sharing of representations entails that there is only one representation of a certain structure for both languages, which means that the activation level of that structure can be determined by its frequency in L1 and L2, especially in high-proficient speakers. In contrast, when a structure is not shared across languages, only the language-specific frequency can play a role. The current study aims to elucidate the role of L1 and L2 frequency in the sharing of syntax across languages during early L2 acquisition by means of Muylle et al.'s (Reference Muylle, Bernolet and Hartsuiker2021) AL learning paradigm.
The present study
Two groups of Dutch L1 speakers came to the lab to learn an AL that was either biased toward the DO structure (i.e., DO-bias condition) or PO structure (i.e., PO-bias condition). During the priming block (which was the final block in the AL learning paradigm, see below), priming was assessed from the AL to Dutch by comparing three prime types: a) DO primes, b) PO primes and c) neutral primes (transitive or intransitive). This allowed us to determine the individual strength of PO and DO priming in comparison with a baseline (provided by the neutral primes) and how this priming effect is affected by the bias-condition. For participants in the PO-bias condition, Dutch (which has a strong PO bias, especially in picture description experiments; for a discussion, see Colleman & Bernolet, Reference Colleman, Bernolet, Divjak and Gries2012) and AL frequency distributions were congruent, whereas they were incongruent for the DO-bias condition. By manipulating the AL frequency distribution, we were able to disentangle the role of L1 and AL frequency in priming during Dutch sentence production. If we consider the predictions of Hartsuiker and Bernolet's (Reference Hartsuiker and Bernolet2017) developmental theory and implicit learning theories such as the error-based learning theory (Chang et al., Reference Chang, Dell and Bock2006) and the ACT-R theory (Reitter et al., Reference Reitter, Keller and Moore2011), several hypotheses can be formulated, which are discussed below.Footnote 1
According to the developmental account, high-frequent structures are shared across languages before low-frequent ones. If the theory is correct, participants in the DO-bias condition should first show priming from the DO structure to Dutch and only later from the PO structure (in comparison with a neutral baseline). In contrast, participants in the PO-bias condition should first show priming of the PO structure to Dutch. Hence, it is possible that there is only priming of the most frequent AL structure after one session of learning.
If sharing goes very fast, it is also possible that both structures are already shared (or at least connected) at the moment of testing in the priming blockFootnote 2. In that case, one can make predictions regarding the magnitude of the priming, based on inverse frequency mechanisms, as proposed by the error-based learning account and the ACT-R theory of priming (the developmental theory does not account for inverse frequency mechanisms and hence does not predict differences in the magnitude of the priming effect for shared structures). First, if representations are fully shared, inverse frequency effects of both the AL and Dutch might play a role in the formulation of Dutch target sentences. More concretely, given that the DO structure is less frequent in Dutch, one would expect stronger DO priming than PO priming. However, in the PO-bias condition, the inverse frequency effect is reinforced by the low DO frequency in the AL, whereas in the DO-bias condition, the inverse frequency effect of the DO in Dutch is counteracted by the inverse frequency effect of the PO in the AL. Hence, there should be stronger DO priming in the PO-bias condition than in the DO-bias condition. Second, it is possible that the structures are not fully shared yet across languages, but already connected. In this stage, AL structures may prime their L1 equivalent, but the connection is not strong enough to transfer predictions from the L1 into the AL (although this is rather unlikely, given that L1 transfer is found to be present even in low proficient speakers). In other words, encountering a DO-structure in the AL will activate the DO structure in Dutch (resulting in priming), but given that the representations of both languages are not strongly associated (yet), this encounter does not violate expectations from Dutch (given that no actual Dutch DO structure was presented). Hence, the learner will only be influenced by frequency effects from the AL. As such, the inverse frequency effects of Dutch should not play a role in the Dutch sentence formulation.
Finally, it is also possible that neither structure is shared (yet) between the languages. In that case, there should be no AL-Dutch priming and no difference between the DO- and PO- bias conditions, given that AL frequency would not affect sentence formulation in Dutch.
Methods
Participants
Ninety-six psychology students (20 males, 76 females; age: 17–35, M = 20.3, SD = 3.0) participated in this experiment. The sample size was chosen based on the guidelines of Mahowald, James, Futrell and Gibson (Reference Mahowald, James, Futrell and Gibson2016), that for an interaction coefficient of 1 (which we assume because the difference in priming across bias conditions should be large, given that frequency effects play an important role in the magnitude of priming effects), 96 subjects and 24 items will lead to a power of .93. Hence, with 36 items, 96 participants are probably sufficient in order to find an interaction with priming. The participants received either a course credit or payment in return for their participation. Half of them were assigned to the PO-bias and the other half to the DO-bias condition. Only students who exclusively had Dutch as L1 could take part. Before participation, they filled in a short language background questionnaire in order to ensure that they indeed met this language criterion. Furthermore, participants had no learning or language disorders and had normal or corrected-to-normal hearing and vision.
Materials and design
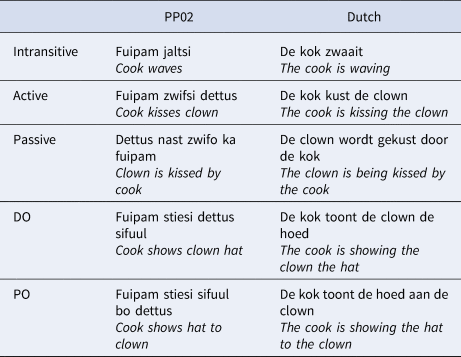
All materials were taken from our previous studies using the AL (baptized ‘PP02’) learning paradigm (Muylle et al., Reference Muylle, Bernolet and Hartsuiker2021; Muylle, Bernolet, et al., Reference Muylle, Bernolet and Hartsuiker2020). We used the same PP02 version as in Muylle, Bernolet et al.'s (Reference Muylle, Bernolet and Hartsuiker2020) baseline condition. The participants learned the AL vocabulary by viewing pictures of human agents (10 in total, e.g., cook, pirate, waitress) and objects (ball and hat). They learned to describe six different actions in the AL, consisting of two intransitive (i.e., run and wave), two transitive (i.e., kiss and shoot) and two ditransitive actions (i.e., give and show). These actions were depicted in short animated action movie clips of 3 s (Muylle, Wegner, Bernolet & Hartsuiker, Reference Muylle, Wegner, Bernolet and Hartsuiker2020). An example of each type of structure can be found in Table 1. For the PO-bias condition, 75% of all presented dative sentences (including prime sentences in the priming block) were PO and the remaining 25% DO. In the DO-bias condition, this pattern was reversed. In order to avoid the formation of a representational connection between the specific verb pairs (given that there was never verb overlap in the target trials of interest), Dutch target movies in the priming block also contained the actions sleep and jump for intransitives, tickle and punch for transitives and deliver and sell for ditransitives, but the participants did not learn the respective vocabulary in PP02 (because twelve verbs would be too much to remember). The PP02 words and sentences were always presented both auditory (through headphones) and written on the screen. Auditory stimuli consisted of WAV-files, which were recorded in Audacity (Audacity, 2018). The PP02 learning tasks were programmed in PsychoPy2 Coder (v1.85.6; Peirce et al., Reference Peirce, Gray, Simpson, MacAskill, Höchenberger, Sogo and Lindeløv2019). All stimuli were presented on a grey background and texts were presented in Courier New font (bold; heigth: 62 px; color: black).
Examples of sentences in PP02 & Dutch.

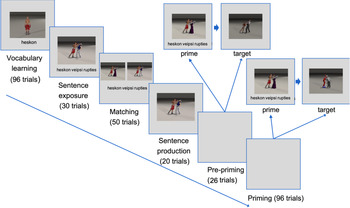
Procedure
The procedure was nearly identical to the one applied in Muylle, Bernolet et al. (Reference Muylle, Bernolet and Hartsuiker2020). All participants learned the AL by means of six consecutive blocks (see Figure 2) that were separated by screens with instructions. After signing the informed consent, the participants were installed in front of a computer screen with AZERTY keyboard, where they first completed the online version of the Dutch LexTALE (www.lextale.com; Lemhöfer & Broersma, Reference Lemhöfer and Broersma2012) to measure Dutch vocabulary scores. Next, the experimenter administered the forward and backward digit span (WAIS-IV subtests; Wechsler, Reference Wechsler2008) in order to assess working memory capacity of the participants. Once these were completed, the participants received a set of Sennheiser headphones and started with the PP02 learning task. The participants were simply told that they would learn an AL based on pictures and short action movies. The speech of participants in this part of the experiment was recorded in Audacity.
Sequence of the different experimental blocks.

Vocabulary learning block (96 trials)
In this block, the participant was presented with pictures and their PP02 associated nouns (twelve in total). Each picture was presented eight times. The first time, participants received a picture in the middle of the screen together with a noun that was written underneath. They repeated this noun aloud and pressed ‘space’ to continue with the next trial. The next seven times they encountered the same picture, it was presented in isolation and participants tried to say the word aloud, retrieving it from memory. They received the correct response directly after, by pressing ‘space’. Once the audio stopped playing, the next trial started automatically after 2 s. The first two appearances of each picture followed an ABACBDCED etc. pattern (in which each letter represents a different picture), whereas the third appearance followed an ABCDE etc. pattern. For the other five presentations, the pictures appeared in pseudorandom order in a way that the same picture was never presented twice in a row.
Sentence exposure block (32 trials)
Here, participants were presented with action movies and a sentence describing the depicted action. At the start of each trial, a verb appeared in the middle of the screen and, 1 s after the audio stopped playing, a movie appeared at the middle of the screen and started to play while a sentence appeared underneath. Participants repeated this sentence aloud and pressed ‘space’ to continue with the next movie. Each intransitive verb appeared three times during this block, whereas each transitive verb appeared three times in an active construction and three times in a passive construction. In the DO-bias condition, the DO structure appeared nine times and the PO structure appeared three times (this was counterbalanced over verbs). For the PO condition, it was the other way around.
Matching block (50 trials)
The goal of this block was to further expose the participants to sentences while forcing them to comprehend these sentences by choosing the movie that matches the sentence out of two movies. Concretely, two movie stills appeared at the left and the right of the screen and played sequentially from left to right. When the movie ended, it was replaced with a still depicting the ongoing action. After the right movie stopped playing, a fixation cross appeared in the middle of the screen, followed by a sentence at the bottom of the screen. Participants indicated which movie matched the sentence by pressing either ‘Q’ for the left movie or ‘M’ for the right movie. After the button was pressed, the correct movie played again together with the sentence audio. Now, participants repeated the sentence aloud and pressed ‘space’ when finished, in order to continue to the next trial. The movies either differed in one aspect (i.e., replacement of subject, object, indirect object, or verb) or assigned different roles to the agent and patient or indirect object. Intransitive verbs appeared five times each and the other verbs appeared ten times each. Half of the transitive sentences were active, and the other half were passive. For ditransitives, fifteen sentences were DOs and five sentences were POs in the DO-bias condition and vice versa for the PO-bias condition.
Sentence production block (20 trials)
During this block, participants practiced formulating sentences in the AL and received feedback on their utterances. During each trial, a movie played in the middle of the screen and the participants formulated a sentence in the AL describing the action in the movie. In order to prevent them from getting stuck on a forgotten word, they were provided with cheat sheets on which the pictures and respective PP02 nouns were presented. Based on the response, the experimenter selected one of the possible correct descriptions using a Cedrus RB-730 response box. For instance, when the participant formulated an active or DO sentence, the experimenter pressed the left button to play the respective sentence. When the sentence was passive or PO, the right button was pressed. If the response was ambiguous, the experimenter pressed the middle button to randomly select a correct response. By doing so, the participants received feedback on their utterances. After the audio stopped playing, the program waited for 3.5 s before continuing with the next trial. Transitive and ditransitive verbs appeared four times each and intransitive verbs appeared two times each.
Pre-priming block (26 trials)
Here, each trial started with a movie presented in the center of the screen and a prime sentence underneath. The participants indicated whether the sentence matched the movie by means of a button press (‘Q’: match or ‘M’: no match). Then, the target movie appeared and the participants formulated a sentence in the AL to describe the movie. For this, they could again use the cheat sheets. When this was done, they pressed ‘space’ to continue with the next trial. The verb was always repeated between prime and target. There were five intransitive, ten transitive (five active, five passive) and twelve ditransitive trials, of which nine had a DO prime and three had a PO prime in the DO-bias condition and vice versa for the PO-bias condition. This block was not present in the previous studies using this design, but was added in order to enhance priming effects in the priming block. In a previous study (see Muylle et al., Reference Muylle, Bernolet and Hartsuikerin press), we found that the presence of a condition with verb overlap was a precondition for the cross-linguistic priming to appear. Hence, it might be advisable to include a verb overlap condition in the experimental design. However, given that the design of the current study does not allow to test a verb overlap condition (i.e., because a neutral prime can never have the same verb as the target), we therefore included a pre-priming phase in which there was always verb overlap between prime and target. Note that we are aware that the inclusion of this extra block might impact learning (e.g., there might be sharing of both ditransitive structures before the actual priming block starts), making the results of the current study less comparable to the previous ones. We return to this issue in the discussion.
Priming block (96 trials)
The procedure was the same as in the pre-priming block, but now participants produced target sentences in the AL (for fillers only) or Dutch, depending on a cue underneath the target movie. When the cue was ‘AT’ (i.e., abbreviation for ‘artificiële taal’ [artificial language]), participants formulated the target sentence in the AL and when the cue was ‘NL’ (i.e., abbreviation for ‘Nederlands’ [Dutch]), they formulated the sentence in Dutch. Also here, the use of the cheat sheets was allowed. Once they were ready, they pressed ‘space’ to continue with the next trial. There were 36 trials of interest, whereas the remaining 60 trials were fillers. Three different conditions were compared within-subjects, each consisting of twelve trials: a) a DO prime with Dutch ditransitive target, b) a PO prime with Dutch ditransitive target and c) a neutral prime (transitive or intransitive) with Dutch ditransitive target. In order to retain the DO or PO-bias in the priming block, 24 filler trials had a DO prime (for the DO-bias condition) or a PO prime (for the PO-bias condition). The target language for these trials was always PP02 and the structure to be produced was either transitive or intransitive. Other fillers either had a transitive or intransitive prime, followed randomly by a transitive or intransitive target. Twenty-four of them were PP02 targets and twelve were Dutch targets. By doing so, Dutch and PP02 targets were equally distributed across the priming block. Furthermore, because Muylle et al.'s (Reference Muylle, Bernolet and Hartsuikerin press) study indicated that the presence of a related condition might boost the presence of priming considerably, half of the fillers shared their main verb between prime and target.Footnote 3
When the PP02 learning task was finished, participants wrote down what they thought the goal of the experiment could be. After that they received a written debriefing, which they read before answering some final questions. These questions were: “did you notice that you had a tendency to repeat the structure of the prime sentence?’’ (Yes/No) and “If yes, did you deliberately choose to use the other structure” (on a 1–5 scale, 1 = never – 5= always). Finally, some open ‘space’ was left for comments regarding the experiment. After this, the experiment was finished.
Coding of responses
In this section, we only discuss the scoring of ditransitive responses, because these were the targets of interest. We used the same scoring criteria as Muylle, Bernolet, et al. (Reference Muylle, Bernolet and Hartsuiker2020), which are also reported in the pre-registration. Responses were coded as DO, PO, or other. Vocabulary errors did not influence the scoring. For Dutch targets (which were used in our primary analyses), the verb was not taken into account as long as it appeared in a ditransitive structure that allowed PO-DO alternations. For instance, sentences with the preposition “aan” were only scored as PO when the sentence could also be formulated as a DO. Sentences were scored as other when a) one or more constituents were missing, b) the response was formulated in PP02 and c) other sentence constructions were used (e.g., “de clown krijgt de bal van de kok” [the clown receives the ball from the cook] or “de clown koopt de bal van de kok” [the clown buys the ball from the cook]). For PP02 targets (which we used for secondary analyses), sentences were scored as PO whenever a preposition appeared, even when the preposition itself was wrong (e.g., ‘ka’ or ‘ba’ instead of ‘bo’) or when the word order was switched (e.g., ‘dettus heufsi fuipam bo tuulmas’ [clown gives cook to ball] instead of ‘dettus heufsi tuulmas bo fuipam’ [clown gives ball to cook]). If there was no preposition and all constituents were mentioned, the sentence was scored as DO. There were 543 other responses (16%; DO bias: baseline: 7%, DO prime: 7%, PO prime: 7%; PO bias: baseline: 9%, DO prime: 10%, PO prime: 10%), which were discarded from further analysis.
Results
All data and scripts are available on Open Science Framework (link: https://osf.io/bswzk).
Control tasks and PP02 accuracy
The mean LexTALE score was 88.93 (SD = 7.76) in the DO-bias group and 88.36 (SD = 7.28) in the PO-bias group. Independent t-tests indicated that there was no significant difference in Dutch vocabulary knowledge between the groups (t(93.62) = 0.37, p = .71). Working memory capacity, assessed with the forward (DO: M = 6.4, SD = 1.1, PO: M = 6.3, SD = 1.0) and backward digit span test (DO: M = 5.1, SD = 0.9, PO: M = 5.0, SD = 1.0), was also similar across groups (forward digit span: t(91.31) = 0.82, p = .41; backward digit span: t(91.91) = 0.43, p = .67). In order to measure PP02 accuracy, the number of correct responses was calculated for a) the final presentation of each picture in the vocabulary learning block (i.e., a measure of vocabulary knowledge at the end of the block), b) correct choices in the matching block, c) correct utterances in the sentence production block, d) correct choices in the sentence-movie matching task for the prime in the pre-priming block, e) correct utterances in the pre-priming block, f) correct choices in the sentence-movie matching task for the prime in the priming block and f) correct PP02 target utterances in the priming block. This number was then divided by the total number of trials in order to obtain a mean accuracy score for each participant. The mean accuracy score was .91 (SD = .06) in the DO-bias condition and .90 (SD = .06) in the PO-bias condition. A two-sample t-test revealed that this score did not differ across groups (t(92.47) = 0.68, p = .50).
Structural preferences
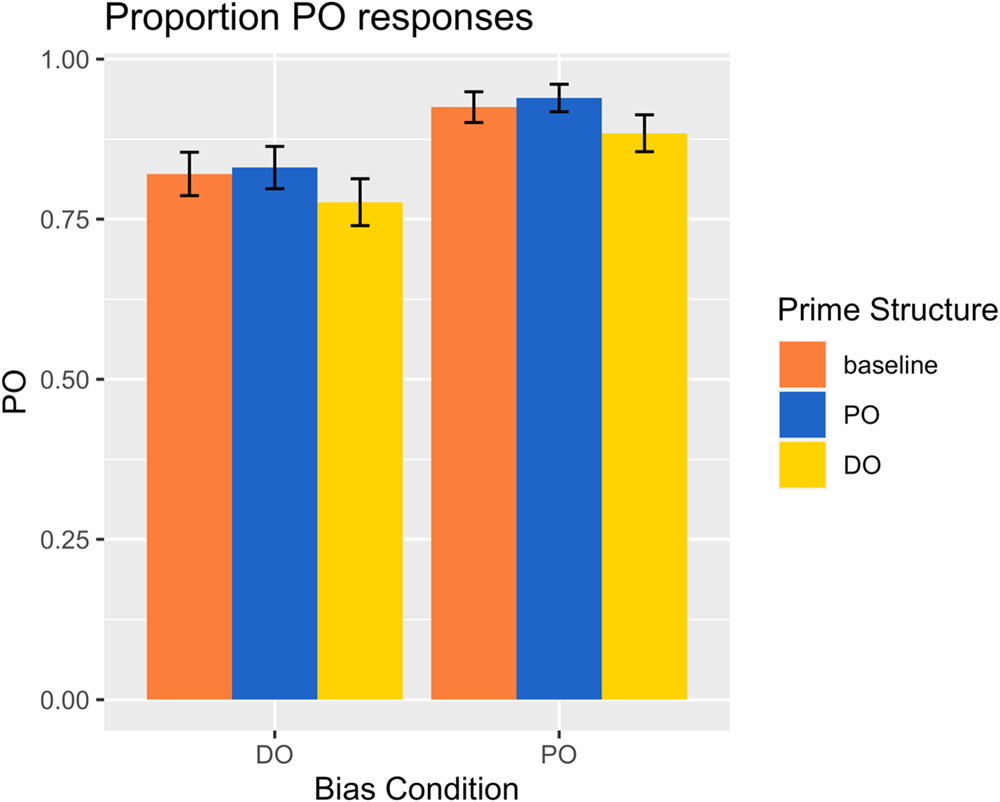
The preference for a structure is determined as the extent to which a participant prefers that particular structure to another. Here, the preferences within PP02 for ditransitives were calculated based on the proportion of PO responses that was spontaneously produced in the sentence production block. Within PP02, there was a clear preference for the most frequent ditransitive structure (88% PO responses in the PO-bias condition vs. 42% in the DO-bias condition), which indicates that participants were sensitive to the frequency manipulation within the AL. In order to find out whether the AL bias condition influenced their L1 utterances in the priming block, we calculated the proportion of PO responses across all priming conditions and compared these between both groups. Within Dutch, both groups showed a clear preference for the PO structure, but this preference was significantly stronger in the PO-bias group (92%) compared to the DO-bias group (81%); see below for analysis. This indicates that the AL frequency indeed had an influence on L1 utterances.
Dutch priming effects
For the priming block, the proportion of PO responses after a neutral prime was compared with the proportion of PO responses after a PO prime (to assess PO priming) and after a DO prime (to assess DO priming). If there is PO priming, the proportion of PO responses should be larger after a PO than after a neutral prime. If there is DO priming, the proportion of PO responses should be smaller after a DO than after a neutral prime. The priming results for each priming condition, separately for each group, can be found in Figure 3. There was little difference in the proportion of PO responses for different types of neutral primes (actives: M = 86%, SD = 27%; passives: M = 85%, SD = 25%; intransitives: M = 90%, SD = 21%).
Proportion of PO responses in Dutch for each priming condition and bias (with 95% confidence intervals).

Confirmatory analyses
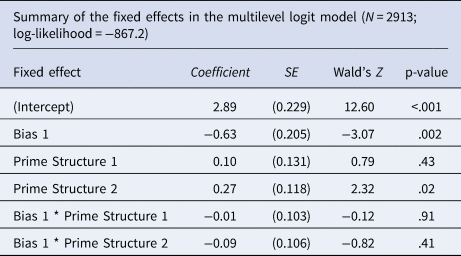
As in the previous studies using the PP02 learning paradigm, priming effects were assessed using generalized linear mixed effects models with PO answer (binomial) as dependent variable. All factors were effects codedFootnote 4. The fixed effects of these models consisted of the interaction Bias (two levels: PO or DO) * Prime Structure (three levels: PO-DO-neutral). We started from the maximal random effects structure (Barr, Levy, Scheepers & Tily, Reference Barr, Levy, Scheepers and Tily2013), which resulted in a singular fit. Hence, the random effects model was reduced until convergence using the method proposed by Bates, Kliegl, Vasishth and Baayen (Reference Bates, Kliegl, Vasishth and Baayen2018). For this, we used the lme4 (Bates, Mächler, Bolker & Walker, Reference Bates, Mächler, Bolker and Walker2015) and afex packages (Singmann et al., Reference Singmann, Bolker, Westfall, Aust, Højsgaard, Fox and Love2016) in R (R Development Core Team, 2017). For model testing with afex (mixed function), we applied the parametric bootstrap method. The final random model consisted of a random intercept for Subject and Item and an uncorrelated random slope for Prime Structure over Items (see Appendix A for the model output). Type III Wald χ2-tests revealed that there was a significant main effect of Prime Structure (χ2(2) = 9.07, p = .011) and Bias (χ2(1) = 9.40, p = .002), but no interaction between them (χ2(2) = 1.18, p = .56). The main effect of Bias showed that the lower proportion of PO responses in the DO-bias condition vs. the PO-bias condition was statistically significant.
Exploratory analyses
The absence of an interaction effect between Prime Structure and Bias made it necessary to perform an additional analysis with regard to the main effect of Prime Structure. In order to find out which level(s) drive(s) significance, post-hoc pairwise comparisons (with Holm correction) were computed using the phia package (De Rosario-Martinez, Reference De Rosario-Martinez2013). There was marginally significant DO priming (DO vs. baseline: χ2(1) = 4.07, p = .087), but no PO priming (PO vs. baseline: χ2(1) = 0.65, p = .42). DO priming did not differ significantly from PO priming (PO - baseline vs. baseline - DOFootnote 5: χ2(1) =0.63, p = .43), but the proportion of PO responses after a DO prime was significantly lower than after a PO prime (χ2(1) = 8.96, p < .01). Furthermore, we tested whether LexTALE score or forward and backward digit span scores modulated the priming. For this, we built generalized linear models with PO answer as dependent variable and the interaction between Prime Structure and the respective variables as fixed effects. None of these interactions were significant (all p's > .40).
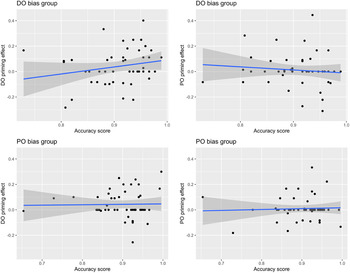
Because our hypotheses contained different predictions depending on which developmental stage the learner has reached, we correlated DO and PO priming effects with AL accuracy, as measure of AL proficiency, to ensure that all participants have reached the same stage of learning. These correlations are plotted in Figure 4. If participants would be in different stages, low proficient participants should only be influenced by L2 frequency. Hence, participants in the PO-bias group should show PO priming and those in the DO-bias group should show DO priming. For high proficient participants in both groups, there should be an influence from the L1 as well in the form of stronger DO priming.
Correlation between priming effects and AL accuracy scores, split up by group.

Given that we cannot be sure that the data are normally distributed, we used Spearman's rank correlation test to assess whether there was a significant correlation between accuracy and priming. In the DO-bias group, accuracy was positively correlated with DO priming (ρ = .29, p < .05), but not with PO priming (ρ = −.18, p = .21), whereas in the PO-bias group, there was no significant correlation between accuracy and DO priming (ρ = −.02, p = .87) or PO priming (ρ = -.03, p = .83). Because there is only a positive correlation for the DO-bias group, but no influence of L2 frequency in the PO-bias group (i.e., even in the participants with the lowest proficiency, there is no PO priming), there is no indication that participants are in different stages of the developmental theory.
PP02 priming effects
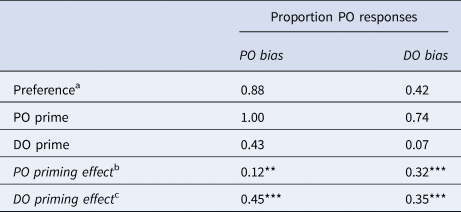
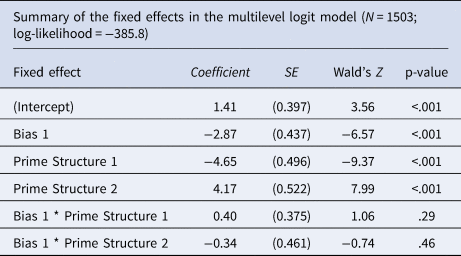
All analyses reported in this section were exploratory. In order to find out whether there was priming of ditransitives within PP02 during the pre-priming block, we calculated the proportion of PO responses after a PO prime vs. the PO responses after a DO prime for both groups. The overall priming effect was 0.67 in the DO-bias group and 0.56 in the PO-bias group. To explore further whether there were any frequency effects in the priming within the AL, the data from the pre-priming block were combined with data from the production block (which can be seen as a baseline for the preference in ditransitives, given that no primes were present). PO priming was calculated as the proportion of PO responses after a PO prime minus the proportion of PO responses in the production block and DO priming as the PO responses after a DO prime minus the proportion of PO responses in the production block. The results of this calculation can be found in Table 2. Note that because the distribution of the primes in the pre-priming block differed across bias groups, the number of observations also differs across conditions. In order to find out whether DO and PO priming were significant, we built generalized linear mixed effects model with the interaction Bias * Prime Structure (here, the ditransitive trials from the production block were taken as baseline trials, hence this was a factor with three levels: baseline, DO, PO) as fixed effects. Similar to the analysis of Dutch targets, the outcome variable was PO answer (binomial). The final model had a random intercept for Subject and an uncorrelated random slope for Prime Structure over subjects (see Appendix B for the model output). Type III Wald χ2-tests indicated that there was no significant interaction between Bias and Prime Structure (χ2(2) = 1.13, p = .57), but there were main effects of Bias (χ2(1) = 43.19, p < .001) and Prime Structure (χ2(2) = 89.17, p < .001). Post-hoc pairwise comparisons showed that there was significant DO priming (DO bias: χ2(1) = 31.19, p < .001; PO bias: χ2(1) = 37.35, p < .001) and PO priming in both bias conditions (DO bias: χ2(1) = 26.31, p < .001; PO bias: χ2(1) = 9.41, p = .002).
Proportion of PO responses in the pre-priming block.

a The preference is calculated as the proportion of PO responses in the sentence production block.
b The PO priming effect is calculated as the difference in the proportion of PO responses in the sentence production block and after PO primes in the pre-priming block.
c The DO priming effect is calculated as the difference in the proportion of PO responses in the sentence production block and after DO primes in the pre-priming block.
Discussion
The goal of this study was to find out how L1 and L2 frequency effects modulate the sharing of syntactic representations during early stages of L2 acquisition. We therefore compared structural priming from an AL to Dutch in two groups of AL learners that either learned a PO-biased version or a DO-biased version of the AL. There was a clear main effect of priming, which was very similar for both bias conditions. As such, there is no evidence that AL frequency affected immediate priming. In addition, the overall proportion of PO responses was larger in the PO-bias compared to the DO-bias condition, which indicates that the AL frequency did affect L1 utterances on a more global scale (i.e., cumulative priming, e.g., Hartsuiker & Westenberg, Reference Hartsuiker and Westenberg2000; Jaeger & Snider, Reference Jaeger and Snider2013; Kaschak, Loney & Borreggine, Reference Kaschak, Loney and Borreggine2006; Scheepers, Reference Scheepers2003). These findings are in contrast with all a priori hypotheses, that either predicted an interaction between priming and bias condition or no priming at all. Instead, it seems that the contribution of L1 and AL frequency is different for immediate and cumulative priming mechanisms, with the former being only influenced by L1 frequency and the latter (at least partly) by AL frequency.
Immediate priming
In both bias groups (i.e., DO and PO) there was a clear structural priming effect. However, when we computed priming effects relative to baseline, there was weak evidence for DO priming, but no evidence for PO priming (note that it is possible that the absence of PO priming in the PO-bias condition results from a ceiling effect, given that there were already over 90% PO responses after a neutral prime, but this is probably not the case in the DO-bias condition, where the proportion of PO responses was always lower than in the PO-bias condition). In other words, there was evidence for priming of the less frequent L1 structure (i.e., DO) instead of the more frequent AL structure (i.e., DO in the DO-bias group and PO in the PO-bias group). Hence, it seems that at least the DO structure is shared between the AL and Dutch. However, it is very likely that the PO structure is shared as well. Indeed, the absence of priming does not necessarily mean that a structure is not shared. For instance, high-frequent structures such as actives (as opposed to passives) sometimes do not show priming within the L1 because the baseline preference for that structure can be close to ceiling. In that case, it is almost impossible to observe an increase in active responses after an active prime, whereas an increase in passives is more easily observed (Ferreira & Bock, Reference Ferreira and Bock2006). Despite the absence of priming, there is no reason to assume that L1 speakers would have no abstract representation of the active structure. Thus, it is possible that both DO and PO are already shared across languages at the start of the priming block.
Because there was no pre-priming block in the previous studies with the PP02 paradigm (Muylle et al., Reference Muylle, Bernolet and Hartsuiker2021, Reference Muylle, Bernolet and Hartsuikerin press; Muylle, Bernolet, et al., Reference Muylle, Bernolet and Hartsuiker2020), we cannot rule out that this additional practice block increased the chance that the participants already shared both PO and DO representations before the start of the priming block. At least, it seems that the inclusion of a pre-priming block is sufficient to evoke structural priming across languages for ditransitives in the AL learning paradigm. This is in line with the idea that the presence of priming conditions with lexical overlap boosts priming in conditions without such overlap, as proposed by Muylle et al. (Reference Muylle, Bernolet and Hartsuikerin press).
Taken together, the immediate priming results do not provide evidence for the claim of Hartsuiker and Bernolet's developmental theory that frequent AL structures are shared before less frequent ones. On the other hand, given that Hartsuiker and Bernolet (Reference Hartsuiker and Bernolet2017) did not make predictions about the modulatory role of frequency effects in priming once structures are shared, it is impossible to say whether the observed priming pattern provides evidence for or against the developmental theory.
Our results indicate that AL frequency has no influence on the immediate AL-to-L1 priming, whereas L1 frequency appears to be an important factor. This idea is in line with experience-based accounts of L2 learning, which state that L2 learners transfer their L1 expectations to L2 during early phases of learning (e.g., Ellis, Reference Ellis2002; MacWhinney, Reference MacWhinney, Robinson and Ellis2008; Montero-Melis & Jaeger, Reference Montero-Melis and Jaeger2019; Pajak, Fine, Kleinschmidt & Jaeger, Reference Pajak, Fine, Kleinschmidt and Jaeger2016). Because L1 speakers of Dutch expect PO structures, they experience a prediction error when encountering a DO structure in the AL. According to implicit learning theories of priming (e.g., Chang et al., Reference Chang, Dell and Bock2006; Reitter et al., Reference Reitter, Keller and Moore2011), such prediction errors form the basis of syntactic learning, which is reflected in structural priming. Because the DO is less expected, the participants will show better learning for this structure in the AL and also more priming from the AL to Dutch. The result is that immediate priming effects are driven by the predictions from L1 (i.e., the PO structure is most likely to appear), whereas there is no strong prediction in the AL yet.
However, this idea is hard to reconcile with the exploratory AL-AL priming analyses and the finding that there was cumulative priming from the AL (see below), which both indicate that participants were sensitive to the AL frequency distribution. Within the AL, significant priming effects were observed for POs and DOs in both bias conditions and participants in the PO-bias condition produced more POs than those in the DO-bias conditions (see also Wonnacott et al., Reference Wonnacott, Newport and Tanenhaus2008). The observation of structural priming within the AL suggests that learners did generate AL predictions based on the received input. Nevertheless, these predictions do not seem to play a role in the AL-Dutch priming. At this point, it is not clear why this is the case. More research is needed to find out whether this finding generalizes to other L2 learning situations.
Cumulative priming
Cumulative priming effects designate a longer-term shift in structural preferences toward a certain structure, which is driven by the repeated exposure to that structure. Our finding that participants in the DO group produced more DOs overall compared to those in the PO group can be considered evidence for such an effect. The presence of cumulative priming effects in our experiment was not anticipated and indicates that the AL frequency distribution influenced structural choices in the L1 on the longer term. Similar to immediate priming, previous studies indicated that cumulative priming within L1 is sensitive to frequency effects; low frequency structures show larger cumulative priming effects than high frequency structures, when these structures appear frequently as a stimulus throughout the experiment (e.g., Fine, Jaeger, Farmer & Qian, Reference Fine, Jaeger, Farmer and Qian2013; Hartsuiker & Westenberg, Reference Hartsuiker and Westenberg2000; Kaschak, Kutta & Jones, Reference Kaschak, Kutta and Jones2011). In addition, two recent studies showed that L1 inverse frequency effects can be transferred to L2 production as well (Kaan & Chun, Reference Kaan and Chun2018; Montero-Melis & Jaeger, Reference Montero-Melis and Jaeger2019). The cumulative priming effect in our study seemed to be driven by AL frequency, although it is possible that L1 frequency plays a role as well, given that we have no data on the initial ditransitive preference of the participants in the study (note that there is no reason to assume that this preference would differ across groups). Therefore, it is unclear whether the difference in the proportion of PO utterances between both bias groups is due to DO priming, PO priming, or both. On the one hand, it could be that there is stronger cumulative priming for the DOs compared to the POs, which would mean that L1 frequency interacts with AL frequency. On the other hand, there could be similar PO and DO cumulative priming, which would mean that the priming was only affected by AL frequency. In any case, the experimental induction of a certain bias in the AL elicited differential cumulative priming in the L1, which suggests that at least the AL frequency distribution plays a role in AL-Dutch priming.
Cumulative priming effects cannot be explained within the lexicalist framework (e.g., Hartsuiker et al., Reference Hartsuiker, Pickering and Veltkamp2004; Pickering & Branigan, Reference Pickering and Branigan1998) that served as a basis for Hartsuiker and Bernolet's developmental account. Despite the fact that the latter theory aimed to describe the development of shared syntax during L2 learning, it does not directly implement the mechanisms through which learners actually form representational nodes for the L2. In line with implicit learning accounts of priming (Chang et al., Reference Chang, Dell and Bock2006; Reitter et al., Reference Reitter, Keller and Moore2011), Hartsuiker and Bernolet (Reference Hartsuiker and Bernolet2017) suggested that implicit learning mechanisms might be responsible for the formation of syntactic representations. According to the implicit learning theories, less frequent structures have weaker connections (see Reitter et al., Reference Reitter, Keller and Moore2011) or are less expected (see Chang et al., Reference Chang, Dell and Bock2006), which makes them more sensitive to weight changes that cause a temporary boost in activation for these structures (resulting in immediate priming), but repeated exposure to such structure can also lead to longer-term weight changes (resulting in cumulative priming).
Future directions
The finding that immediate priming is not affected by AL frequency, whereas the AL frequency elicits cumulative priming, indicates that both types of priming differ qualitatively. A similar conclusion was already drawn by Hartsuiker, Bernolet, Schoonbaert, Speybroeck and Vanderelst (Reference Hartsuiker, Bernolet, Schoonbaert, Speybroeck and Vanderelst2008), based on the finding that immediate priming was modulated by lexical overlap between prime and target (i.e., the lexical boost effect), whereas this was not the case for long-term priming (i.e., when there were intervening sentences between prime and target). Therefore, they proposed that lexically driven, activation-based mechanisms are responsible for immediate priming, whereas long-term priming (and cumulative priming) is driven by implicit learning mechanisms and does not rely on lexical material. This idea was also incorporated in the ACT-R model of structural priming by Reitter et al. (Reference Reitter, Keller and Moore2011).
Despite the fact that the implicit learning theories can account for the data pattern that we observed here, the existing models mainly focus on monolingual priming and need more elaboration when it comes to bilingual situations. This will allow for better predictions about syntactic acquisition in L2 learning. For instance, it is not clear how implicit learning relates to the sharing of syntax in bilingualism. However, in order to make predictions and establish cross-linguistic priming, the learner should at least have a connection between the AL and L1 representations of the structure. This topic merits some further investigation.
Finally, we note that the current study cannot distinguish whether representations are fully shared vs. connected across languages. In their review article on cross-linguistic structural priming, van Gompel and Arai (Reference van Gompel and Arai2018) suggested that weaker priming effects between vs. within languages indicate that speakers’ representations were not shared but rather connected across languages. This issue of shared vs. connected representations in cross-linguistic priming has been the topic of several other studies (e.g., Kantola & van Gompel, Reference Kantola and van Gompel2011), but the current study cannot contribute to this debate because it did not directly compare within- vs. between-language priming.
Conclusions
In the current paper, we put forward three contrasting hypotheses on how AL frequency modulates the sharing of syntax across languages: 1) the most frequent AL structure is shared before the less frequent one, 2) there is no sharing for either structure early on in the acquisition, or 3) both structures are shared or at least connected between languages, and priming effects will be modulated by both AL and L1 frequency effects in an additive way. Our findings suggest that both structures are shared, in line with the last hypothesis, but in contrast to our predictions, immediate priming effects seemed to be modulated by L1 frequency only (i.e., less frequent L1 structures could be primed more easily from the AL). Importantly, cumulative priming effects indicated that AL frequency did exert an effect on L1 structural choices in general (i.e., the overall proportion of PO vs. DO responses was different for both bias groups). This pattern of results is partly in line with implicit learning accounts of structural priming, but did not provide evidence for or against the prediction of Hartsuiker and Bernolet's (Reference Hartsuiker and Bernolet2017) developmental theory that the representations of frequent L2 structures are shared with L1 before less frequent ones. Further studies using the AL learning paradigm might yield better insights into how structural frequency interacts with the sharing of syntax across languages.
Acknowledgements
This research was funded by a grant (G049416N) from the Research Foundation – Flanders (FWO). This study has been preregistered on the Open Science Framework under the title “Are representations of frequent syntactic structures shared before less frequent ones? An artificial language learning study”. The preregistration document can be retrieved from https://osf.io/2vnsc.
Appendix
Model output of the confirmatory PP02-Dutch priming model.

Model output of the exploratory PP02 priming model.