


Introduction
It has been proposed that consonants and vowels play different functional roles during language processing (Nespor, Peña & Mehler, Reference Nespor, Peña and Mehler2003). Nespor et al.’s division-of-labor hypothesis states that, irrespective of the language, vowels are more involved in prosodic and syntactic processes while consonants are more involved in lexically related processes such as speech perception (e.g., Bonatti, Peña, Nespor & Mehler, Reference Bonatti, Peña, Nespor and Mehler2005; Delle Luche, Poltrock, Goslin, New, Floccia & Nazzi, Reference Delle Luche, Poltrock, Goslin, New, Floccia and Nazzi2014), written word recognition (e.g., New & Nazzi, 2014; New, Araùjo & Nazzi, Reference New, Araùjo and Nazzi2008), and word learning (e.g., Nazzi, Reference Nazzi2005; Havy, Serres & Nazzi, Reference Havy, Serres and Nazzi2014; Havy, Bouchon & Nazzi, Reference Havy, Bouchon and Nazzi2016; Havy & Nazzi, Reference Havy and Nazzi2009; Nazzi & Bertoncini, Reference Nazzi and Bertoncini2009; Creel, Aslin & Tanenhaus, Reference Creel, Aslin and Tanenhaus2006). This observed consonant-vowel asymmetry has even led to the proposal that all listeners exhibit an initial bias for consonantal information during lexically related processing (Bonatti, Peña, Nespor & Mehler, Reference Bonatti, Peña, Nespor and Mehler2007; Nespor et al., Reference Nespor, Peña and Mehler2003).
Findings from developmental research, however, suggest that such biases are language-specific; processing biases develop as a by-product of the acoustic-phonetic and lexical properties of the language (Højen & Nazzi, Reference Højen and Nazzi2016; Floccia, Nazzi, Delle Luche, Poltrock & Goslin, Reference Floccia, Nazzi, Delle Luche, Poltrock and Goslin2014). While research has begun to understand how processing biases emerge in children acquiring their first language (L1; e.g., Sebastián-Gallès, Echeverria & Bosch, Reference Sebastián-Gallès, Echeverria and Bosch2005; Bosch & Sebastián-Gallès, Reference Bosch and Sebastián-Gallès2003; Mani & Plunkett, Reference Mani and Plunkett2010; Nazzi, Floccia, Moquet & Butler, Reference Nazzi, Floccia, Moquet and Butler2009; Poltrock & Nazzi, Reference Poltrock and Nazzi2015; Nazzi & New, Reference Nazzi and New2007; Nishibayashi & Nazzi, Reference Nishibayashi and Nazzi2016; Singh, Goh & Wewalaarachchi, Reference Singh, Goh and Wewalaarachchi2015), it remains unclear whether similar biases develop in adults acquiring a second language (L2). Moreover, if phonological biases emerge in an L2, it is an open question whether they are determined through a transfer from native to non-native processing or in response to the properties of the L2 input. The present study addresses these questions by examining L1 and L2 listeners’ lexically related consonantal and vocalic biases in English and Mandarin Chinese.
Origins of L1 processing biases
Research into L1 acquisition has identified at least two potential factors involved in the developmental origin of consonantal and vocalic processing biases (see Nazzi, Poltrock & Von Holzen, Reference Nazzi, Poltrock and Von Holzen2016; Nazzi & Cutler, Reference Nazzi and Cutler2019 for reviews). The “acoustic-phonetic hypothesis” (Floccia et al., Reference Floccia, Nazzi, Delle Luche, Poltrock and Goslin2014) posits that a bias emerges as a result of the various acoustic and phonological phenomena present in a learner's input. Languages vary with respect to the proportion of consonants and vowels in the phonological inventory, how these cues are realized in speech, and each cue's relative informativeness across prosodic, syntactic, and lexical levels. These language-specific differences may modulate the functional role of consonants and vowels (Højen & Nazzi, Reference Højen and Nazzi2016; Nazzi et al., Reference Nazzi, Poltrock and Von Holzen2016; Floccia et al., Reference Floccia, Nazzi, Delle Luche, Poltrock and Goslin2014). For instance, spoken Danish exhibits a relatively high degree of consonant lenition (Pharao, Reference Pharao2011; Grønnum, Reference Grønnum1998; Basbøll, Reference Basbøll2005), which increases the informativeness of Danish vowels. Mandarin Chinese (hereafter ‘Mandarin’) serves as another example. Mandarin vowels carry lexically contrastive fundamental frequency (F0) information (Ho, Reference Ho1976; Xu, Reference Xu1999; Gandour, Reference Gandour1983). This tonal information constrains lexical access immediately, plays a role comparable to that of segments, and makes vowels more informative than consonants (e.g., Malins & Joanisse, Reference Malins and Joanisse2010, Reference Malins and Joanisse2012; Zhao, Guo, Zhou & Shu, Reference Zhao, Guo, Zhou and Shu2011; Wiener & Ito, Reference Wiener and Ito2015; Wiener & Turnbull, Reference Wiener and Turnbull2016; Tong, Francis & Gandour, Reference Tong, Francis and Gandour2008; Repp & Lin, Reference Repp and Lin1990; Lee & Nusbaum, Reference Lee and Nusbaum1993; Gómez, Mok, Ordin, Mehler & Nespor, Reference Gómez, Mok, Ordin, Mehler and Nespor2018). Prioritizing vocalic information may be advantageous for Danish learners, if not essential for Mandarin learners. Speakers of these languages may therefore develop a bias for vocalic information (V-bias) during infancy (e.g., Højen & Nazzi, Reference Højen and Nazzi2016; Singh et al., Reference Singh, Goh and Wewalaarachchi2015; Wewalaarachchi, Wong & Singh, Reference Wewalaarachchi, Wong and Singh2017).
The second potential factor contributing to the development of phonological biases reflects linguistic experience at the lexical level. This “lexical hypothesis” (Keidel, Jenison, Kluender & Seidenberg, Reference Keidel, Jenison, Kluender and Seidenberg2007) states that consonant-vowel asymmetries exist in each language, which cause one broad category of cues to be more informative for coding differences in a speaker's lexicon. For many European languages, consonants outnumber vowels and are therefore more informative for lexical distinctions, i.e., more neighbors can be attained by changing a consonant than a vowel (Hochmann, Benavides-Varela, Nespor & Mehler, Reference Hochmann, Benavides-Varela, Nespor and Mehler2011). As a result, speakers of English, Spanish, and Dutch (among other languages) develop a bias for consonantal information (C-bias) during infancy (see Nazzi and Poltrock, Reference Nazzi, Poltrock, Gaskell, Mirkovic and J2016). In other languages, vowels may be more informative for lexical distinctions. According to the lexical hypothesis, Danish-learning infants may develop a V-bias because Danish vowels outnumber Danish consonants, i.e., the Danish lexicon contains more neighbors that can be attained by changing a vowel than a consonant (Højen & Nazzi, Reference Højen and Nazzi2016; Bonatti et al., Reference Bonatti, Peña, Nespor and Mehler2007).
Thus, a C- or V-bias emerges during infancy as a by-product of the phonological and/or lexical properties of the input. Yet, it remains largely unknown how a fully developed L1 phonological bias affects adults’ lexical processing of non-native speech. Limited evidence from adult artificial language learning suggests that, once a C- or V-bias is acquired in infancy, it may become independent of lower-level acoustic-phonetic differences in speech (e.g., Toro, Nespor, Mehler & Bonatti, Reference Toro, Nespor, Mehler and Bonatti2008a; Toro, Shukla, Nespor & Endress, Reference Toro, Shukla, Nespor and Endress2008b). For example, Toro et al. (Reference Toro, Shukla, Nespor and Endress2008b) created an artificial language in which rules and words were implemented over vowels or consonants. Adult speakers of a language that elicits a C-bias (Italian) used vowels for structural generalizations and consonants for statistical computations. This pattern remained even after the acoustic features of consonants were made more salient and vowels less audible. Toro et al.’s findings imply that while lower-level acoustic differences may affect the acquisition of an L1 phonological bias during early development, these acoustic differences appear to no longer play a direct role in adult processing of (non-native) speech.
While the artificial language learning approach (e.g., Toro et al., Reference Toro, Nespor, Mehler and Bonatti2008a, Reference Toro, Shukla, Nespor and Endress2008b; Creel et al., Reference Creel, Aslin and Tanenhaus2006) has advanced our understanding of processing biases and refined the acoustic-phonetic hypothesis, this approach has two limitations. First, input is typically restricted to short lab-based training sessions. Although developmental research has revealed that biases emerge rapidly in infants – French and Italian infants demonstrate a C-bias from 8 months onward (e.g., Nazzi, Reference Nazzi2005; Hochmann et al., Reference Hochmann, Benavides-Varela, Nespor and Mehler2011; Poltrock & Nazzi, Reference Poltrock and Nazzi2015; Nishibayashi & Nazzi, Reference Nishibayashi and Nazzi2016) – limited lab-based input may be insufficient for phonological biases to fully develop in a native-like manner. Second, artificial language learning studies like Toro et al. (Reference Toro, Nespor, Mehler and Bonatti2008a, Reference Toro, Shukla, Nespor and Endress2008b) cannot speak to whether lexical properties affect adult listeners’ development and application of phonological biases. In this context, behavioral results from adults learning an artificial language may be confounded by the lack of a lexicon.
To overcome these two limitations, the present study examines processing biases in adult L2 learners. This approach allow for a more ecologically valid test of how extended non-native input and L2 lexical development affect adults’ phonological biases in lexical processing.
Word reconstruction task
To examine how previously acquired phonological biases may be applied given new input, this study uses the word reconstruction task (van Ooijen, Reference van Ooijen1996). In this task, a participant hears a spoken nonword and is asked to orally report a word that can be created through a single consonant or vowel substitution; response time and accuracy serve as dependent measures. For example, the English nonword /εltəmət/ can become “ultimate” through a vowel change or “estimate” through a consonant change. This task ensures that lexical access takes place, allows for a direct comparison of the effect of consonant and vowel using the same experimental item between subjects, and removes any potential orthographic confounds. Crucially, the nonword stimulus functions as the “perceptual template of multiple real words” (van Ooijen, Reference van Ooijen1996). These perceptual templates force listeners to activate concurrent lexical candidates containing similar sounding speech cues, constrain all competitors, and ultimately select an intended word, thus mimicking the processes involved in spoken word recognition (e.g., McQueen, Norris & Cutler, Reference McQueen, Norris and Cutler1994, Reference McQueen, Norris and Cutler1999; Marslen-Wilson, Reference Marslen-Wilson and Altmann1990; Samuel, Reference Samuel2011; Cutler, Reference Cutler2012; Connine, Blasko & Wang, Reference Connine, Blasko and Wang1994; Shillcock, Reference Shillcock and Altmann1990; Vitevitch & Luce, Reference Vitevitch and Luce1998, Reference Vitevitch and Luce1999).
In van Ooijen's seminal study (Reference van Ooijen1996), native English listeners changed vowels faster and more accurately than they changed consonants. In a third condition, listeners were free to change either the vowel or the consonant. Given this free choice, participants changed vowels more often and faster than they changed consonants. Replications were run with Spanish and Dutch stimuli, thus providing a further manipulation of vocabulary structure as a possible determinate of the biases (Cutler, Sebastián-Gallès, Soler-Vilageliu & van Ooijen, Reference Cutler, Sebastián-Gallés, Soler-Vilageliu and van Ooijen2000; see also Sharp, Scott, Cutler & Wise, Reference Sharp, Scott, Cutler and Wise2005; Marks, Moates, Bond & Stockmal, Reference Marks, Moates, Bond and Stockmal2002; Cutler & Otake, Reference Cutler and Otake2002). Irrespective of the language tested, participants in these word reconstruction studies exhibited a lexically related C-bias.
These original reconstruction studies, however, exclusively tested listeners of European languages that share relatively similar phonological and lexical characteristics. As a result, the observed C-bias in van Ooijen (Reference van Ooijen1996) and Cutler et al. (Reference Cutler, Sebastián-Gallés, Soler-Vilageliu and van Ooijen2000) may have reflected the phonological and/or lexical properties of English, Spanish, and Dutch. Wiener and Turnbull (Reference Wiener and Turnbull2016) expanded the reconstruction paradigm by testing listeners of Mandarin – a language with heavily constrained syllable phonology in which syllables are maximally (C)V(C), carry a lexical tone, and can stand alone as a morpheme or word (DeFrancis, Reference DeFrancis1986; Packard, Reference Packard2000; Duanmu, Reference Duanmu2007, Reference Duanmu2009; Zhou & Marslen-Wilson, Reference Zhou and Marslen-Wilson1994, Reference Zhou and Marslen-Wilson1995). Wiener and Turnbull also added a tone change condition in which listeners had to change one of four lexically contrastive F0 contours. For example, participants heard the Mandarin nonword /su/ with the low-dipping tone (Tone 3). Depending on the condition the stimulus was presented in, participants could change the tone to create su4 (“fast”), the vowel to create si3 (“death”), or the consonant to create tu3 (“soil”). Unlike listeners tested in the previous European language reconstruction studies, Mandarin listeners demonstrated a lexically related V-bias: participants changed consonants faster and more accurately than they changed vowels. In the free choice condition, consonant changes outnumbered vowel changes. Wiener and Turnbull concluded that the observed V-bias was a by-product of Mandarin's phonological and lexical properties.
Yet, Wiener and Turnbull's results should be interpreted with caution. First, unlike the Cutler et al. (Reference Cutler, Sebastián-Gallés, Soler-Vilageliu and van Ooijen2000) and van Ooijen (Reference van Ooijen1996) stimuli, which counterbalanced the position of the consonant and vowel change across multisyllabic nonwords, Wiener and Turnbull's stimuli consisted exclusively of monosyllabic nonwords with initial consonant changes. Stimuli of this nature were unavoidable since the Mandarin lexicon contains predominantly consonant initial words. Calculations based on the 33.5 million word corpus SUBTLEX-CH (Cai & Brysbaert, Reference Cai and Brysbaert2010) suggest that only around 15% of the Mandarin lexicon contains vowel initial words, such as ang1 (‘filthy’). Thus, Wiener and Turnbull's reconstruction results may have been partially confounded by the positional effects of the consonant and vowel changes.
Additionally, because Wiener and Turnbull tested participants using Mandarin instructions, the task involved changing the initial and final, i.e., language-specific terms more familiar to Mandarin speakers than the western terms for consonant and vowel. As a result, the authors did not test whether stimuli containing a nasal coda or changes to the final involving the addition of a nasal coda differed in response time or accuracy. Because changing a Mandarin final may fundamentally differ from changing a vowel, one aim of the present study is to clarify Wiener and Turnbull's previous findings.
In summary, the word reconstruction task captures listeners’ language-specific phonological biases in lexical processing. Previous reconstruction results indicate that English-L1 speakers exhibit a C-bias while Mandarin-L1 speakers exhibit a V-bias. To examine whether non-native speakers exhibit a C- or V-bias in their L2 and, if so, to what degree such biases are transferred from their L1 or reflect the phonological and lexical information of the stimuli being processed, a series of word reconstruction experiments were carried out. In Experiment 1, English-L1, Spanish-L1, and Mandarin-L1 speakers were tested on English stimuli. The goal of Experiment 1 was to determine whether participants demonstrate the same C-bias in their word reconstruction responses irrespective of their L1. The use of the two L2 groups allowed for a cross-linguistic comparison between speakers who demonstrate an L1 C-bias (Spanish; Cutler et al., Reference Cutler, Sebastián-Gallés, Soler-Vilageliu and van Ooijen2000) and those who demonstrate an L1 V-bias (Mandarin; Wiener & Turnbull, Reference Wiener and Turnbull2016).
Experiment 1A: reconstruction in English as an L1
Method
Participants
Twenty-seven native English speakers (13 male; 14 female; mean age = 21.3; SD = 3.1) from the United States participated in Experiment 1A. All participants were students at an American university, had normal hearing and speech, and had previously studied a European L2 (Spanish, Latin, Italian, French, or German) for three years or less in secondary school. No participant continued to study or speak an L2. All participants in this and the other experiments reported here were paid or given class credit for their participation.
Materials
Sixty nonwords taken from van Ooijen's (Reference van Ooijen1996) study were used as stimuli (see Online Supplementary Materials for full stimuli and all possible changes). Each nonword could be turned into a real English word by changing either a consonant or a vowel. Position of change was roughly controlled for: 35 of the 60 words involved a consonant change before a vowel change while the remaining 25 words involved a vowel change before a consonant change. Roughly half of the nonwords involved more than one possible consonant or vowel change. An additional 70 nonwords were created as fillers along with 12 practice items. The stimuli were recorded at 44.1 kHz with 16-bit resolution using a sound attenuated booth. To ensure that each nonword was acoustically as close as possible to both its alternatives, a phonetically trained female native English speaker first pronounced both the vowel and the consonant real-word alternative before each stimulus nonword i.e., “ultimate, estimate, eltimate”. The order of vowel and consonant recordings was counterbalanced across recordings.
The 60 nonwords were randomly divided into three groups of 20. These groups were rotated across three change conditions, resulting in a within-subject design. Thus, all participants heard the 60 nonwords: a third heard eltimate in the vowel condition, a third heard eltimate in the consonant condition, and a third heard eltimate in the free choice condition.
Procedure
Participants were tested individually in a quiet lab using headphones. Participants first answered a brief language background questionnaire, after which they were given printed and oral instructions that they would hear English nonwords. Depending on which condition the listeners were in (e.g., consonant, vowel or free), participants were told to change a particular sound such that a real-word could be produced. Participants were given four practice trials (with example answers) for each condition and explicitly told to think about the word's sound and not its spelling. As soon as participants thought of a word, they were asked to say the word aloud into a microphone. Participants were not made aware beforehand that they would be asked to make other phonemic changes in other conditions; condition presentation order was counterbalanced across participants. Stimuli were presented using E-prime (Psychology Software Tools, Inc., 2012) with a 10 second timeout period if no response was given. After each trial, participants were required to press a button to proceed to the next trial with a two-second ISI. Verbal responses and response times measured at word onset were recorded using the Chronos response and stimulus device and voice key (Babjack, Cernicky, Sobotka, Basler, Struthers, Kisic, Barone & Zuccolotto, Reference Babjack, Cernicky, Sobotka, Basler, Struthers, Kisic, Barone and Zuccolotto2015). This method of response time logging differed from van Ooijen's (Reference van Ooijen1996) original methodology, which required participants to first press a key before speaking. The experiment took approximately 30 minutes.
Results and discussion
Oral responses were transcribed by a native English speaker. Roughly 5% of responses were removed due to timeout errors (no response given within 10 seconds) or false alarm responses (participants began to respond but stopped before producing a word). The remaining responses were scored as correct or incorrect changes. Because some trials allowed for multiple answers (e.g., “task” or “tusk” for /tɪsk/ in the vowel change condition), any response that involved the appropriate change was scored as correct. Changes that did not follow the instructions, such as a consonant change in the vowel change condition (or vice versa), or changes involving multiple speech sounds were scored as incorrect. Table 1 presents mean error rates and mean correct response times (RT) for the three conditions.
Mean error rates (%) and correct response times (ms) in Experiments 1 & 2.
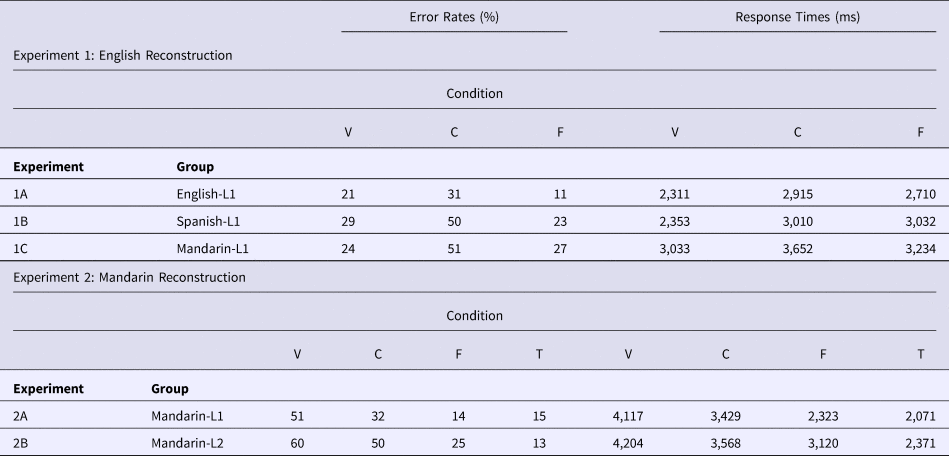
Condition abbreviations: V = Vowel, C = Consonant, F = Free, T = Tone
To test whether error rates and correct response times were statistically different across conditions, mixed-effects logistic regression (accuracy) and linear regression (log transformed RT of correct responses) models were built using the lme4 package (Bates, Maechler, Bolker & Walker, Reference Bates, Maechler, Bolker and Walker2015) in R version 3.3.3 (R Core Team, 2017). This statistical approach was used, as it allows for simultaneous consideration of all the factors that potentially contribute to the data, and tests that observed effects are robust over items and participants (Baayen, Davidson & Bates, Reference Baayen, Davidson and Bates2008; Barr, Levy, Scheepers & Tily, Reference Barr, Levy, Scheepers and Tily2013). Each model's effects structure was evaluated using the lmerTest package (Kuznetsova, Brockhoff & Christensen, Reference Kuznetsova, Brockhoff and Christensen2017) in R, which allows for the elimination of non-significant fixed and random effects.
The logistic regression model included two fixed effects. Participants’ condition (vowel, consonant, free) was contrast coded with the consonant choice as the reference level allowing for two planned contrasts: consonant-vowel and consonant-free. Position of change, i.e., whether a consonant or vowel change came first, was included as a sum coded effect. Random by-participant and by-item intercepts and random slopes for condition were included. R formula: accuracy ~ condition + position +(1|subject) + (condition|item). The linear regression model included the same variables and effects structure but tested correct response times. R formula: log RT ~ condition + position +(1|subject) + (condition|item). Reported p-values for t-distributions were obtained using the lsmeans package (Lenth, Reference Lenth2016).
Vowel accuracy was marginally higher than consonant accuracy (β = 0.78, SE = 0.46, z = 1.67, p = .09); free choice accuracy was significantly higher than consonant accuracy (β = 1.60, SE = 0.47, z = 3.34, p < .001). Position of consonant/vowel change did not affect overall accuracy (β = 0.02, SE = 0.45, z = 0.06, p = .95).
Vowel response times were significantly shorter than consonant response times (β = −0.21, SE = 0.09, t = −2.23, p = .04); free choice and consonant response times did not differ (β = −0.09, SE = 0.09, t = −0.98, p = .51). Position of consonant/vowel change did not affect response times (β = 0.04, SE = 0.08, t = 0.53, p = .60).
Subset analyses of the free choice responses indicated that participants changed vowels significantly faster (2,546 ms) than they changed consonants (2,905 ms) (β = 0.19, SE = 0.08, t = −3.39, p < .001) and made marginally more vowel changes (56%) than consonant changes (44%) (χ 2(1) = 2.92, p = .08).
The response time results in Experiment 1A corroborate van Ooijen's (Reference van Ooijen1996) finding: English-L1 speakers exhibit a C-bias by changing vowels faster than consonants. With respect to accuracy, participants were marginally more accurate at changing the vowel and marginally preferred vowel changes to consonant changes when given the free choice. This marginal effect of condition on response accuracy was unexpected given van Ooijen's fairly robust accuracy difference. This difference between the two studies may be attributed to the present study's different response methodology, the use of U.S. English speakers as opposed to British English speakers, the lower error rate of the participants tested in Experiment 1A (31% error rate in the consonant condition as compared 42% in van Ooijen), or the more conservative mixed-effects statistical modeling approach (see Quené & Van den Bergh, Reference Quené and Van den Bergh2008; Barr et al., Reference Barr, Levy, Scheepers and Tily2013; Matuschek, Kliegl, Vasishth, Baayen & Bates, Reference Matuschek, Kliegl, Vasishth, Baayen and Bates2017).
Despite the marginal effect of condition on response accuracy, Experiment 1A's response time results serve as evidence that English-L1 speakers exhibit a C-bias during lexical processing. Moreover, the null effects of consonant/vowel position on accuracy and response times confirm that these results were not driven by the position of the consonant and vowel change in the nonword stimuli. Experiment 1B next clarifies whether Spanish-L1 English-L2 speakers exhibit a similar C-bias while processing English-L2 speech.
Experiment 1B: reconstruction in English as an L2 (Spanish-L1)
Method
Participants
Twenty-seven native Spanish speakers from nine countries in Latin and South America participated in Experiment 1B. All participants spoke English as an L2, had normal hearing and speech, had completed up to high school in their home country, and were currently studying at an American university. See Table 2 for additional participant information including self-assessed and objective L2 proficiency levels.
Demographics and self-assessed proficiency measures of non-native participants tested in Experiments 1B, 1C, and 2B (results represent group means and standard deviations).
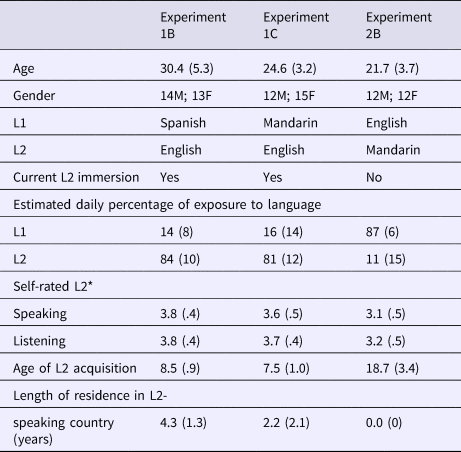
*1: beginner; 2: intermediate; 3: advanced; 4: native-like
Materials and procedure
The materials and procedure were identical to those of Experiment 1A with the instructions given in Spanish and English. Though van Ooijen's (Reference van Ooijen1996) original stimuli were designed to ensure that all potential consonant-change and vowel-change words were high frequency words, four additional non-native English speakers from the same population as the participants (none of whom participated in the study) were asked to orally define the 120 target words. All participants defined the words with 100% accuracy.
Results and discussion
Oral responses were transcribed by a native English speaker and two non-native English speakers from Argentina and China, respectively. Roughly 7% of responses were removed due to timeout errors, false alarm responses or a lack of transcriber agreement. Table 1 presents mean error rates and mean correct response times by condition. To test whether Spanish-L1 participants’ error rates and correct response times were statistically different across conditions, mixed effect models were built identical to those outlined in Experiment 1A.
Vowel accuracy was significantly higher than consonant accuracy (β = 1.24, SE = 0.49, z = 2.51, p = .01); free choice accuracy was significantly higher than consonant accuracy (β = 1.45, SE = 0.45, z = 3.17, p < .01). Position of consonant/vowel change did not affect overall accuracy (β = 0.65, SE = 0.56, z = 1.16, p = .24).
Vowel response times were significantly shorter than consonant response times (β = −0.18, SE = 0.09, t = −2.01, p = .04); response times did not differ between the free and consonant conditions (β = 0.06, SE = 0.07, t = 0.81, p = .69). Position of consonant/vowel change did not affect response times (β = 0.08, SE = 0.05, t = 1.46, p = .15).
Given the free choice, participants changed vowels significantly faster (2,755 ms) than consonants (3,295 ms) (β = 0.13, SE = 0.06, t = 2.01, p = .04) and made marginally more vowel changes (58%) than consonant changes (42%) (χ 2(1) = 3.36, p = .07).
The results from Experiment 1B establish that Spanish-L1 English-L2 speakers exhibit an English C-bias; vowels were changed faster and more accurately than consonants. These results were independent of the position of the consonant/vowel change, mirror the asymmetric pattern observed in Spanish-L1 speakers performing the task in their native language (Cutler et al., Reference Cutler, Sebastián-Gallés, Soler-Vilageliu and van Ooijen2000), and replicate the English-L1 speakers’ results from Experiment 1A. More importantly, Experiment 1B's results serve as initial evidence that non-native speakers exhibit a lexically related phonological bias during L2 lexical processing.
Because Spanish-L1 speakers demonstrate a C-bias in their native language (Cutler et al., Reference Cutler, Sebastián-Gallés, Soler-Vilageliu and van Ooijen2000), the results from Experiment 1B may have been, in part, due to a transfer from the L1 processing system. The goal of Experiment 1C was to examine the behavioral patterns of speakers whose L1 (Mandarin) elicits a V-bias in their lexical processing. If L2 processing biases are transferred, Mandarin-L1 English-L2 speakers should change consonants faster and more accurately than they change vowels. If listeners apply a new processing bias in accordance with their L2, participants should change vowels faster and more accurately than they change consonants.
Experiment 1C: reconstruction in English as an L2 (Mandarin-L1)
Methods
Participants
Twenty-seven native Mandarin speakers from Mainland China participated in Experiment 1C. All participants spoke English as an L2, had normal hearing and speech, had completed up to high school in China, and were currently studying at an American university. See Table 2 for additional participant information.
Materials and procedure
The materials and procedure were identical to those of Experiment 1A and 1B with the instructions given in Mandarin and English. The words for ‘consonant’ and ‘vowel’ were used in both the English and Mandarin instructions.
Results and discussion
Oral responses were transcribed by a native English speaker and two non-native English speakers from China. Roughly 6% of responses were removed due to timeout errors, false alarm responses or a lack of transcriber agreement. Table 1 presents mean error rates and mean correct response times for the three conditions. To test whether Mandarin-L1 participants’ error rates and correct response times were statistically different across conditions, mixed effect models were built identical to those outlined in Experiment 1A.
Vowel accuracy was significantly higher than consonant accuracy (β = 1.58, SE = 0.49, z = 3.19, p < .01); free choice accuracy was significantly higher than consonant accuracy (β = 1.27, SE = 0.48, z = 2.62, p = .01). Position of consonant/vowel change did not affect overall accuracy (β = 0.43, SE = 0.48, z = 0.88, p = .37).
Vowel response times were significantly shorter than consonant response times (β = −0.19, SE = 0.08, t = −2.29, p = .04); response times did not differ between the free and consonant conditions (β = −0.14, SE = 0.08, t = −1.64, p = .24). Position of consonant/vowel change did not affect response times (β = 0.01, SE = 0.06, t = 0.05, p = .96).
Given the free choice, participants changed vowels (3,068 ms) and consonants (3,493 ms) with similar response times (β = −0.03, SE = 0.07, t = 0.34, p = .73). Participants made significantly more vowel changes (58%) than consonant changes (42%) (χ 2(1) = 6.22, p = .01).
The results from Experiment 1C establish that Mandarin-L1 English-L2 speakers exhibit a C-bias during English lexical processing: English vowels were changed faster and more accurately than consonants. These results were independent of the position of the consonant/vowel change. When given the free choice, participants preferred vowel changes to consonant changes, though the two categories were changed with similar response times.
Summary of Experiment 1 – English reconstruction
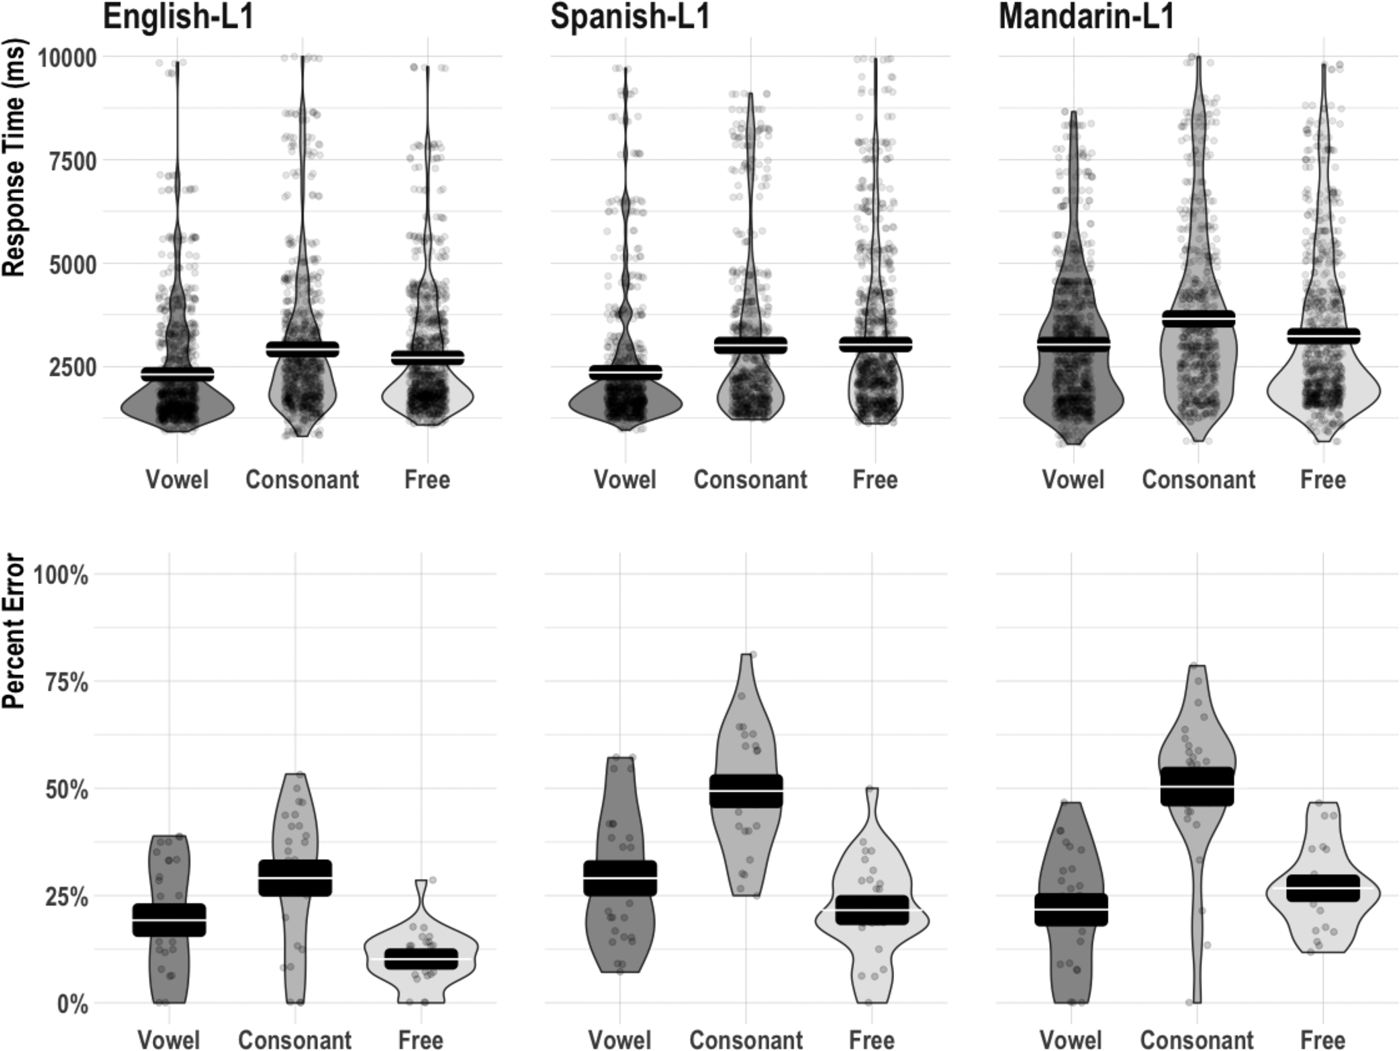
Figure 1 plots individual data points per item (correct RT) and per participant (error rate), violin plots for each condition, 95% confidence intervals (black box), and condition means (white line within confidence interval box). Figure 1 illustrates that participants in all three groups demonstrated a similar C-bias during word reconstruction by changing vowels faster than consonants and changing vowels, on average, more accurately than consonants.
Experiment 1 mean correct response times (ms) and percent error. Black box indicates 95% confidence interval. White line within interval indicates condition mean.
The results from Experiment 1 indicate that adult L2 acquisition involves the development and application of a phonological bias during L2 lexical processing. The phonological bias applied may be similar to a listener's L1 bias: a C-bias was found in non-native English processing by adults that are native speakers of a C-bias eliciting language (Spanish). Additionally, the bias applied may be different from a listener's L1 bias: a C-bias was found in non-native English processing by adults that are native speakers of a V-bias eliciting language (Mandarin).
Adults familiar with the phonological and lexical traits of two languages appear to adapt their phonological bias to the specific demands of the language. Experiment 1C's results suggests that (potential) L1 transfer of biases can be avoided if the L2 demands it. It should be noted, however, that these findings do not necessarily exclude the possibility that the C-bias observed in Spanish-L1 speakers in Experiment 1B was solely due to L1 transfer. Different mechanisms may apply to these two very different bilingual situations.
Taken together, Experiment 1's results support the claim that processing biases develop in response to the phonological and lexical properties of the input. Experiment 2 extends Experiment 1 by using Mandarin as the target language and testing Mandarin-L1 and Mandarin-L2 speakers. Experiment 2 also serves as an initial investigation into whether constraints on the amount of L2 input and a listener's age of acquisition affect the development and application of a new processing bias. Thus, the non-native participants tested in Experiment 2 differed from the non-native participants tested in Experiment 1 in two critical ways.
First, the participants tested in Experiment 2B had a mean age of acquisition nearly a decade later than that of the participants tested in 1B and 1C (see Table 2). Because age of acquisition affects numerous measures of L2 speech perception (e.g., Flege, Reference Flege, Heubner and Ferguson1991, Reference Flege and Strange1995, Reference Flege2007; Flege, Yeni-Komshian & Liu, Reference Flege, Yeni-Komshian and Liu1999; Perani, Paulesu, Galles, Dupoux, Dehaene, Bettinardi, Cappa, Fazio & Mehler, Reference Perani, Paulesu, Galles, Dupoux, Dehaene, Bettinardi, Cappa, Fazio and Mehler1998; Silverberg & Samuel, Reference Silverberg and Samuel2004; MacWhinney, Reference MacWhinney, Kroll and De Groot2005), it may similarly affect the development and application of an L2 processing bias.
Second, the participants tested in 2B were not currently immersed in their L2. Because L2 immersion experience can alter various cognitive and linguistic processes (e.g., Chang, Reference Chang2012, Reference Chang2013; Linck, Kroll & Sunderman, Reference Linck, Kroll and Sunderman2009; DeKeyser, Reference DeKeyser2010; Tokowicz, Michael & Kroll, Reference Tokowicz, Michael and Kroll2004; Sunderman & Kroll, Reference Sunderman and Kroll2009; Hernandez, Li & MacWhinney, Reference Hernandez, Li and MacWhinney2005), immersion may also affect the development and application of an L2 processing bias.
Experiment 2A first tested Mandarin-L1 speakers in their L1 to confirm that Mandarin elicits a V-bias during word reconstruction. Experiment 2A additionally allowed for an examination into whether Wiener and Turnbull's (Reference Wiener and Turnbull2016) results were affected by the nonwords’ syllable structure (e.g., lack/presence of a nasal coda) or participants’ vowel response types (e.g., responding with or without a nasal coda). Experiment 2B tested English-L1 Mandarin-L2 learners to examine whether a non-native V-bias emerges in native speakers of a language that elicits a C-bias (English) despite limited L2 input and a relatively late age of acquisition.
Experiment 2A: reconstruction in Mandarin as an L1
Method
Participants
Twenty-four native Mandarin speakers (12 male; 12 female; mean age = 26.1; SD = 3.3) from Mainland China participated in Experiment 2A. All participants had normal hearing and speech, had completed up to high school in China, and were currently studying at an American university. While participants came from different parts of China, all participants reported Mandarin as the only Chinese dialect spoken or understood.
Materials
Sixty-four CV and CVV nonwords taken from Wiener and Turnbull's (Reference Wiener and Turnbull2016) study were used as stimuli (see Supplementary Materials for stimuli and all possible changes). Each nonword could be turned into a real Mandarin word by changing the consonant, vowel, or tone. Unlike van Ooijen's (Reference van Ooijen1996) English stimuli used in Experiment 1, which counterbalanced the position of the consonant/vowel change, the Mandarin stimuli used in Experiment 2 always contained a potential consonant change before a potential vowel change. An additional 32 CVN items containing a nasal coda were treated as fillers along with 12 practice items. The stimuli were recorded by a phonetically trained female native speaker of Beijing Mandarin following the same recording procedure outlined in Experiment 1 with the order of consonant, vowel, and tone counterbalanced. To ensure that the pronunciation was intelligible to participants, three speakers of Mandarin and another mutually non-intelligible Chinese dialect (Cantonese, Southern Min, Shanghai) were asked to identify the syllable and tone for all 64 nonwords. All participants identified the stimuli with 100% accuracy.
The 64 nonwords were randomly divided into four groups of 16. These groups were rotated across the four change conditions, resulting in a within-subject design identical to that used in Experiment 1.
Procedure
The procedure followed that of Experiment 1 with the addition of the tone change condition. Instructions were given in Mandarin. The Mandarin words for initial and final (rather than consonant and vowel) were used in the instructions, as these terms were more familiar to native speakers. For this reason, participants were not specifically instructed whether the addition of a nasal counted as a correct vowel change (e.g., changing le3 to leng3). These trials involving CV(V)N changes were not analyzed as test items and removed from further analysis (10%). For the same reason, CVN words were not analyzed as test items but considered as fillers.
Results and discussion
Oral responses were transcribed by two native Mandarin speakers. Roughly 5% of responses were removed due to timeout errors, false alarm responses or lack of transcriber agreement. The remaining responses were scored as correct or incorrect changes. Because nearly all trials allowed for multiple answers, any response that involved the appropriate change was scored as correct. Changes that did not follow the instructions, or changes involving multiple speech sounds, were scored as incorrect. Table 1 presents mean error rates and mean correct response times for the four conditions. To test whether Mandarin-L1 participants’ error rates and correct response times were statistically different across conditions, mixed effects regression models were built in R. The logistic regression model included change condition contrast coded with vowel as the reference level allowing for three planned contrasts: vowel-consonant, vowel-tone, vowel-free. Syllable type (CV or CVV) was included as a sum coded variable. Random by-participant and by-item intercepts and random slopes for condition were included. R formula: accuracy ~ condition + syllable type +(1|subject) + (condition|item). The linear regression model included the same variables and effects structure but tested correct response times. R formula: log RT ~ condition + syllable type +(1|subject) + (condition|item).
Vowel response accuracy was significantly lower across all three comparisons: vowel to consonant (β = 0.87, SE = 0.15, z = 5.66, p < .001); vowel to tone (β = 2.03, SE = 0.17, z = 11.36, p < .001); vowel to free (β = 2.06, SE = 0.18, z = 11.51, p < .001). CV/CVV syllable type did not affect overall accuracy (β = −0.06, SE = 0.30, z = −0.22, p = .82).
Vowel response times were significantly slower across all three comparisons: vowel to consonant (β = −0.12, SE = 0.03, t = −3.15, p < .01); vowel to tone (β = −0.66, SE = 0.03, t = −18.14, p < .001); vowel to free (β = −0.58, SE = 0.04, t = −16.12, p < .001). CV/CVV syllable type did not affect response times (β = 0.14, SE = 0.11, t = 1.30, p = .21).
Given the free choice, participants changed vowels (2,515 ms) slower than tones (2,028 ms) (β = −0.21, SE = 0.05, t = −3.63, p < .01) but changed vowels and consonants (2,912 ms) with similar response times (β = −0.10, SE = 0.08, t = −1.31, p = .39). Participants made significantly fewer vowel changes (12%) than consonant changes (27%) (χ 2(1) = 19.4, p < .001) and fewer vowel changes than tone changes (61%) (χ 2(1) = 123.5, p < .001).
The results of Experiment 2A confirmed that native Mandarin speakers demonstrate a V-bias during lexical processing: consonant changes were responded to faster and more accurately than vowel changes. These results were not due to listeners having perceived vowels and tones as perceptually similar information: the two conditions were responded to with statistically different response times and accuracies (e.g., Fu, Zheng, Shannon & Soli, Reference Fu, Zeng, Shannon and Soli1998; McLoughlin, Reference McLoughlin2010; Tong et al., Reference Tong, Francis and Gandour2008; Zeng & Mattys, Reference Zeng and Mattys2017). Furthermore, after removing the CV(V)N stimuli and all vowel changes involving a nasal, as well as testing whether CV or CVV syllable type affected the results, Wiener and Turnbull's (Reference Wiener and Turnbull2016) original finding was replicated: Mandarin-L1 listeners changed consonants faster and more accurately than they changed vowels.
Experiment 2B next tested whether L1 speakers of a C-bias eliciting language (English) demonstrate a similar V-bias in their L2 (Mandarin) despite a relatively late age of acquisition and ongoing, non-immersion L2 classroom input.
Experiment 2B: reconstruction in Mandarin as an L2 (English-L1)
Method
Participants
Twenty-four native English speakers participated in Experiment 2B. All participants had normal hearing and speech, had completed a minimum of three years of Mandarin language instruction at the university level and were currently studying advanced Mandarin at an American university at the time of testing. No participant spoke an additional language fluently. None of the participants had previously lived or studied abroad in a Mandarin-speaking environment. See Table 2 for additional participant information.
Materials and procedure
The materials were identical to those of Experiment 2A. To ensure that the Mandarin-L2 speakers were familiar with the potential consonant, vowel, and tone change words, three additional Mandarin-L2 speakers (drawn from the same classroom population as the participants in the experiment) were asked to define the 192 words that could potentially be created. Since spoken Mandarin is highly homophonous and nearly all items resulted in multiple changes, high frequency Chinese characters of the potential words were shown to the learners. All three speakers correctly read aloud and defined the words with over 95% accuracy.
The procedure was identical to that of Experiment 2A with the instructions given in both English and Mandarin. In the English instructions, the words for consonant and vowel were used, whereas in the Mandarin instructions the words for initial and final were used (i.e., the terminology used in L2 learners’ textbooks). Thus the Mandarin-L2 speakers, like the Mandarin-L1 speakers tested in Experiment 2A, were not specifically instructed whether the addition of a nasal counted as a correct vowel change. For this reason, vowel changes involving a nasal (11%) were removed from further analysis.
Results and discussion
Oral responses were transcribed by one non-native and two native Mandarin speakers.
Roughly 9% of responses were removed due to timeout errors, false alarm responses or a lack of transcriber agreement. The remaining responses were scored as correct or incorrect following the procedure outlined in Experiment 2A. Table 1 presents mean error rates and mean correct response times for the four conditions. To test whether Mandarin-L2 participants’ error rates and correct response times were statistically different across conditions, mixed effect models were built identical to those outlined in Experiment 2A.
Vowel accuracy was significantly lower than free choice accuracy (β = 1.78, SE = 0.37, z = 4.73, p < .001) and tone accuracy (β = 2.71, SE = 0.41, z = 6.52, p < .001). Vowel accuracy was similar to consonant accuracy (β = 0.47, SE = 0.36, z = 1.27, p = .20). CV/CVV syllable type did not affect accuracy (β = −0.35, SE = 0.27, z = −1.26, p = .20).
Vowel response times were significantly slower across all three comparisons: vowel to consonant (β = −0.16, SE = 0.07, t = −2.26, p = .04); vowel to tone (β = −0.58, SE = 0.06, t = −8.91, p < .001); vowel to free (β = −0.34, SE = 0.06, t = −5.15, p < .001). CV/CVV syllable type did not affect response times (β = 0.01, SE = 0.04, t = 0.44, p = .90).
Given the free choice, participants changed vowels slower (4,349 ms) than they changed tones (2,863 ms) (β = −0.40, SE = 0.12, t = −3.16, p < .01), but changed vowels and consonants (3,710 ms) at similar speeds (β = 0.19, SE = 0.14, t = 1.39, p = .34). Participants made fewer vowel changes (7%) than consonant changes (20%) (χ 2(1) = 12.0, p < .001) and fewer vowel changes than tone changes (73%) (χ 2(1) = 96.1, p < .001).
Experiment 2B established that Mandarin-L2 speakers demonstrate a V-bias during Mandarin lexical processing: consonants were changed faster than vowels. When given the free choice, participants made fewer vowel changes than consonant changes. These results, like the Mandarin-L1 speakers’ results in Experiment 2A, were not due to L2 listeners conflating vowel and tone information; accuracy and response times for the vowel and tone conditions were statistically different, supporting the claim that advanced Mandarin-L2 learners perceive the two cues as perceptually dissimilar information (e.g., Wang, Sereno, Jongman & Hirsch, Reference Wang, Sereno, Jongman and Hirsch2003; Shen & Froud, Reference Shen and Froud2016).
Summary of Experiment 2 – Mandarin reconstruction
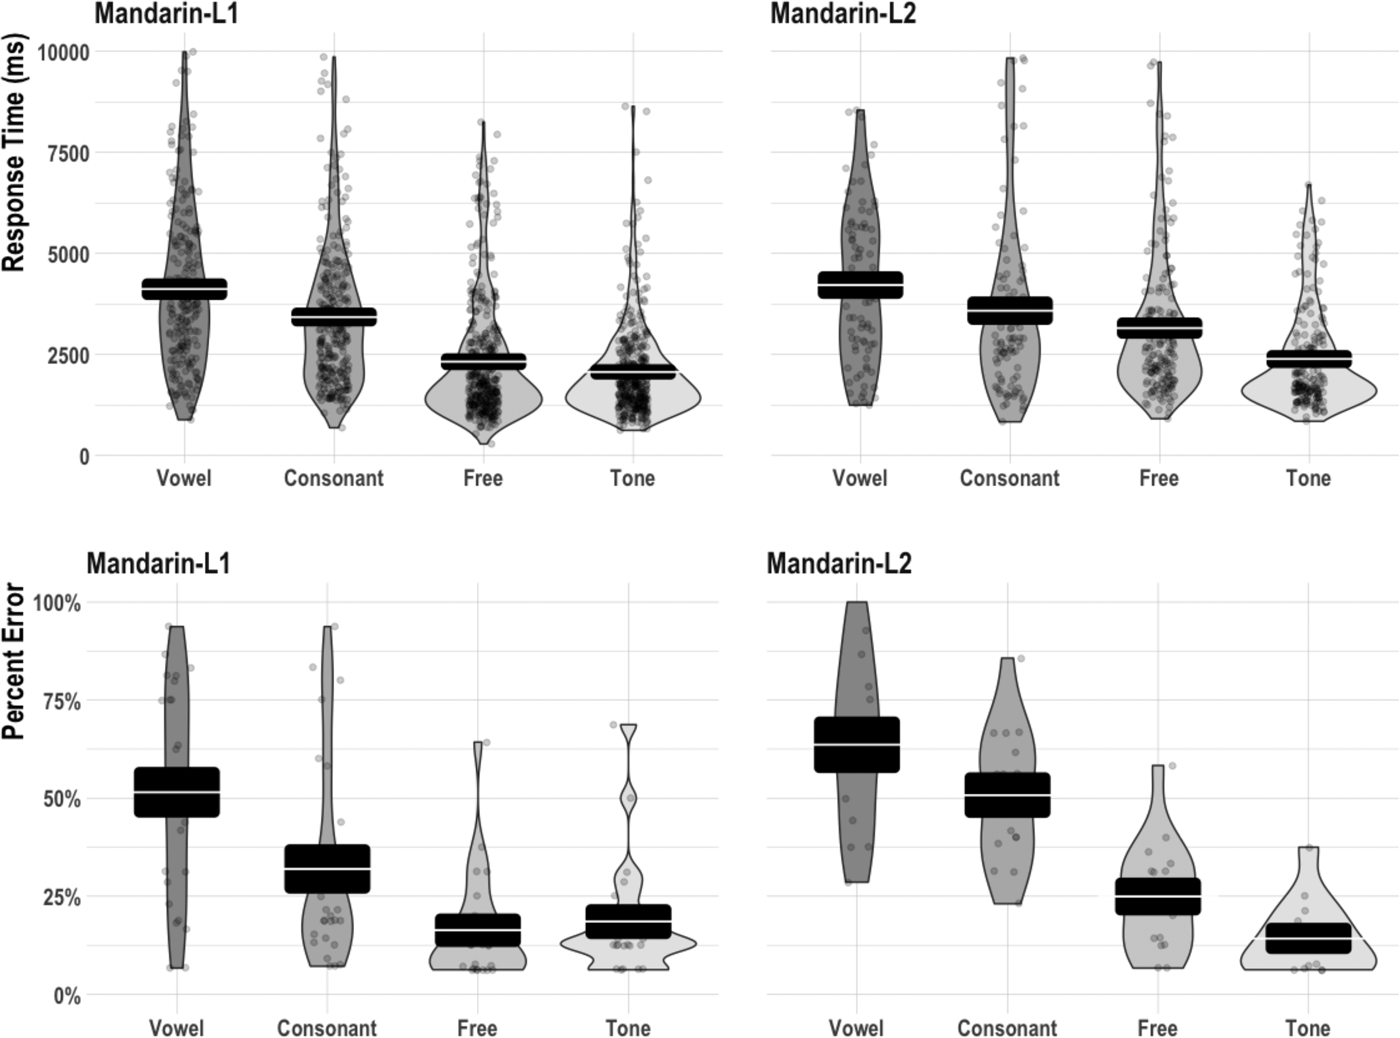
Figure 2 plots the results of Experiment 2 using the same visualization method as Figure 1. This figure illustrates that both Mandarin-L1 and Mandarin-L2 listeners demonstrated a similar V-bias during word reconstruction by changing consonants significantly faster than vowels. Additionally, both groups were, on average, more accurate at changing consonants than vowels. This difference, however, was statistically significant only for Mandarin-L1 speakers.
Experiment 2 mean correct response times (ms) and percent error. Black box indicates 95% confidence interval. White line within interval indicates condition mean.
The results from Experiment 2 corroborate the results from Experiment 1: phonological biases that are applied in an L2 may differ from those applied in a listener's L1 if the language demands it. Importantly, a non-native phonological bias can emerge even in adult listeners who acquire their L2 at a relatively late age and receive limited, non-immersion L2 input.
General discussion
This paper set out to investigate whether adults who speak a non-native language exhibit a lexically related processing bias in their L2, and, if so, whether such a bias is the result of L1 transfer or the phonological and lexical features of the stimuli being processed. To answer these questions, two word reconstruction experiments were carried out. In Experiment 1, English-L1, Spanish-L1, and Mandarin-L1 speakers demonstrated a C-bias in English: vowels were changed faster than consonants and vowels were changed significantly (Spanish-L1 and Mandarin-L1 groups) or marginally (English-L1 group) more accurately than consonants. This observed English-L2 C-bias was therefore similar to Spanish-L1 speakers’ previously reported C-bias (Cutler et al., Reference Cutler, Sebastián-Gallés, Soler-Vilageliu and van Ooijen2000) and different from Mandarin-L1 speakers’ previously reported V-bias (Wiener & Turnbull, Reference Wiener and Turnbull2016).
In Experiment 2, Mandarin-L1 and English-L1 speakers demonstrated a V-bias in Mandarin; both groups changed consonants faster than vowels. Mandarin-L1 listeners also changed consonants significantly more accurately than vowels. This V-bias was observed in both L1 and L2 speakers when tested only on CV(V) syllables (i.e., after removing Wiener and Turnbull's (Reference Wiener and Turnbull2016) problematic items with nasal codas), and when vowel responses involving nasal changes were removed from the analyses. Therefore, despite a relatively late age of acquisition and restricted, non-immersion L2 input, non-native Mandarin learners applied the appropriate phonological bias with nearly native-like efficiency. This pattern of results from Experiment 2B suggests that the observed L2 processing bias may have already emerged prior to learners developing a sizeable lexicon, as may be the case for children acquiring their L1 (e.g., Hochmann et al., Reference Hochmann, Benavides-Varela, Nespor and Mehler2011; Poltrock & Nazzi, Reference Poltrock and Nazzi2015; Bouchon, Floccia, Fux, Adda-Decker & Nazzi,, Reference Bouchon, Floccia, Fux, Adda-Decker and Nazzi2015; Nishibayashi & Nazzi, Reference Nishibayashi and Nazzi2016).
Taken together, the results from Experiments 1 and 2 motivate the claim that adult L1 listeners weight consonants and vowels differently in English and Mandarin during lexical processing. Phonological biases in lexical processing are therefore language-specific (Højen & Nazzi, Reference Højen and Nazzi2016; Floccia et al., Reference Floccia, Nazzi, Delle Luche, Poltrock and Goslin2014). For English-L1 Mandarin-L2 learners and Mandarin-L1 English-L2 learners, lexical processing in an L2 appears to involve adapting a native phonological bias to meet the specific demands of the language, i.e., a C-bias in English and a V-bias in Mandarin. Whereas ample research has documented how a C-bias develops and affects English speakers’ lexical processing (Nazzi et al., Reference Nazzi, Poltrock and Von Holzen2016; Nazzi and Cutler, Reference Nazzi and Cutler2019), far less research has investigated how a potential V-bias emerges in Mandarin infants and to what degree such a bias affects adult Mandarin speakers’ lexical processing. The present study's word reconstruction results contribute to the small but growing body of evidence documenting how Mandarin (and Cantonese) listeners exhibit a lexically related bias favoring vocalic information rather than consonantal information.
Within the developmental literature, evidence suggests that a V-bias may emerge in Mandarin-speaking children. In a word recognition study, Wewalaarachchi et al. (Reference Wewalaarachchi, Wong and Singh2017) demonstrated that Mandarin monolingual 24-month-olds were most sensitive to tone and then to vowel mispronunciations while Mandarin–English bilingual toddlers were most sensitive to vowel and then to tone mispronunciations. Crucially, both the monolingual and bilingual toddlers were least sensitive to consonant variation, suggesting children who speak a tonal language may become more biased towards vocalic information as their lexicon grows (see also Singh et al., Reference Singh, Goh and Wewalaarachchi2015).
Evidence from Cantonese speaking adults further suggests that if indeed listeners of a tonal language develop a V-bias in childhood, such a bias can affect speech segmentation. In an artificial language study, Gómez et al. (Reference Gómez, Mok, Ordin, Mehler and Nespor2018) tested whether Cantonese-L1 adults used consonants or vowels (with tones) to segment speech. The authors found that Cantonese-L1 speakers were unable to use consonantal information alone; vocalic information was required for accurate segmentation. More recently, Poltrock, Chen, Kwok, Cheung, and Nazzi (Reference Poltrock, Chen, Kwok, Cheung and Nazzi2018) demonstrated that a V-bias might even extend to word learning in a tonal language. Poltrock et al. taught Cantonese-L1 speaking adults (along with Mandarin-L1 and French-L1 speaking adults) new label-object associations that differed minimally by a consonant, vowel, or tone. The Cantonese-L1 speakers showed no advantage for consonantal information of newly learned words, suggesting, at the very least, adult Cantonese-L1 listeners exhibit a dampening of a lexically related C-bias.
Thus, limited but converging evidence from word learning, word recognition, speech segmentation, and word reconstruction studies has documented that speakers of Mandarin and Cantonese are less biased towards consonantal information than speakers of non-tonal languages and potentially more biased towards vocalic information than speakers of non-tonal languages. If speakers of a tonal language do, in fact, develop a V-bias, there are at least two possible determinates of this V-bias in line with the “acoustic-phonetic hypothesis” (Floccia et al., Reference Floccia, Nazzi, Delle Luche, Poltrock and Goslin2014) and the “lexical hypothesis” (Keidel et al., Reference Keidel, Jenison, Kluender and Seidenberg2007). From an acoustic-phonetic perspective, vowels carry the bulk of the lexically contrastive F0 information, which in turn may modulate their functional role (e.g., Højen & Nazzi, Reference Højen and Nazzi2016) and cause vowels to become relatively more informative than consonants during lexical processing of a tonal language (e.g., Tong et al., Reference Tong, Francis and Gandour2008; Repp & Lin, Reference Repp and Lin1990; Lee & Nusbaum, Reference Lee and Nusbaum1993).
From a lexical perspective, Mandarin and Cantonese – as well as many other tonal languages (see Yip, Reference Yip2002) – have a relatively simple syllabic phonology in which a syllable can stand alone as a morpheme or word. This results in a corresponding lexicon in which vowels may potentially play a more critical role in lexical distinctions than consonants. Listeners of a tonal language may therefore weight vocalic information more heavily than consonantal information, since more neighbors can potentially be attained by changing a vowel than a consonant.
Given these two non-mutually exclusive hypotheses, Experiment 2's results remain partially incomplete. The Mandarin stimuli used in Experiment 2 – like that used in Wiener and Turnbull (Reference Wiener and Turnbull2016) – consisted entirely of nonwords in which a consonant change always preceded a vowel change. These stimuli differed from van Ooijen's (Reference van Ooijen1996) English nonword stimuli, which counterbalanced the position of the consonant and vowel change across items. It therefore remains an empirical question whether the consonant-initial Mandarin nonwords drove the present results given the potentially privileged status of the beginning of a word (e.g., Mehler, Dommergues, Frauenfelder & Segui, Reference Mehler, Dommergues, Frauenfelder and Segui1981; Connine, Blasko & Titone, Reference Connine, Blasko and Titone1993; Marslen-Wilson & Zwitserlood, Reference Marslen-Wilson and Zwitserlood1989). It is hoped that future studies will make use of other experimental tasks and cross-linguistic comparisons to tease apart whether the reported effects in the present study (and other Mandarin and Cantonese studies) truly capture a V-bias or simply a weakened C-bias.
In conclusion, these word reconstruction results serve as a first step towards better understanding how adults develop and apply non-native phonological biases during L2 lexical processing. The results presented here support the claim that non-native processing biases develop as a by-product of the phonological and lexical properties of the language being processed and not solely through a transfer from native to non-native processing.
Supplementary Material
For supplementary material accompanying this paper, visit https://doi.org/10.1017/S1366728918001165
Acknowledgements
The author is grateful to Christina Bjorndahl, Tianxu Chen, María Pía Gómez Laich, Jieming Li, Tianyu Qin, and Guodong Zhao for their help with the experiments. Members of the Reading and Language Group at the University of Pittsburgh, Melinda Fricke, Brian MacWhinney, Chuck Perfetti, Ana Schwartz, and several supportive, patient reviewers all provided incredibly valuable feedback on earlier versions of this work.



