



%20--%3e%3c!DOCTYPE%20svg%20PUBLIC%20'-//W3C//DTD%20SVG%201.0//EN'%20'http://www.w3.org/TR/2001/REC-SVG-20010904/DTD/svg10.dtd'%3e%3csvg%20version='1.0'%20id='Layer_1'%20xmlns='http://www.w3.org/2000/svg'%20xmlns:xlink='http://www.w3.org/1999/xlink'%20x='0px'%20y='0px'%20width='64px'%20height='64px'%20viewBox='5.5%20-3.5%2064%2064'%20enable-background='new%205.5%20-3.5%2064%2064'%20xml:space='preserve'%3e%3cg%3e%3ccircle%20fill='%23FFFFFF'%20fill-opacity='0'%20cx='37.785'%20cy='28.501'%20r='28.836'/%3e%3cpath%20fill='%23595959'%20d='M37.441-3.5c8.951,0,16.572,3.125,22.857,9.372c3.008,3.009,5.295,6.448,6.857,10.314%20c1.561,3.867,2.344,7.971,2.344,12.314c0,4.381-0.773,8.486-2.314,12.313c-1.543,3.828-3.82,7.21-6.828,10.143%20c-3.123,3.085-6.666,5.448-10.629,7.086c-3.961,1.638-8.057,2.457-12.285,2.457s-8.276-0.808-12.143-2.429%20c-3.866-1.618-7.333-3.961-10.4-7.027c-3.067-3.066-5.4-6.524-7-10.372S5.5,32.767,5.5,28.5c0-4.229,0.809-8.295,2.428-12.2%20c1.619-3.905,3.972-7.4,7.057-10.486C21.08-0.394,28.565-3.5,37.441-3.5z%20M37.557,2.272c-7.314,0-13.467,2.553-18.458,7.657%20c-2.515,2.553-4.448,5.419-5.8,8.6c-1.354,3.181-2.029,6.505-2.029,9.972c0,3.429,0.675,6.734,2.029,9.913%20c1.353,3.183,3.285,6.021,5.8,8.516c2.514,2.496,5.351,4.399,8.515,5.715c3.161,1.314,6.476,1.971,9.943,1.971%20c3.428,0,6.75-0.665,9.973-1.999c3.219-1.335,6.121-3.257,8.713-5.771c4.99-4.876,7.484-10.99,7.484-18.344%20c0-3.543-0.648-6.895-1.943-10.057c-1.293-3.162-3.18-5.98-5.654-8.458C50.984,4.844,44.795,2.272,37.557,2.272z%20M37.156,23.187%20l-4.287,2.229c-0.458-0.951-1.019-1.619-1.685-2c-0.667-0.38-1.286-0.571-1.858-0.571c-2.856,0-4.286,1.885-4.286,5.657%20c0,1.714,0.362,3.084,1.085,4.113c0.724,1.029,1.791,1.544,3.201,1.544c1.867,0,3.181-0.915,3.944-2.743l3.942,2%20c-0.838,1.563-2,2.791-3.486,3.686c-1.484,0.896-3.123,1.343-4.914,1.343c-2.857,0-5.163-0.875-6.915-2.629%20c-1.752-1.752-2.628-4.19-2.628-7.313c0-3.048,0.886-5.466,2.657-7.257c1.771-1.79,4.009-2.686,6.715-2.686%20C32.604,18.558,35.441,20.101,37.156,23.187z%20M55.613,23.187l-4.229,2.229c-0.457-0.951-1.02-1.619-1.686-2%20c-0.668-0.38-1.307-0.571-1.914-0.571c-2.857,0-4.287,1.885-4.287,5.657c0,1.714,0.363,3.084,1.086,4.113%20c0.723,1.029,1.789,1.544,3.201,1.544c1.865,0,3.18-0.915,3.941-2.743l4,2c-0.875,1.563-2.057,2.791-3.541,3.686%20c-1.486,0.896-3.105,1.343-4.857,1.343c-2.896,0-5.209-0.875-6.941-2.629c-1.736-1.752-2.602-4.19-2.602-7.313%20c0-3.048,0.885-5.466,2.658-7.257c1.77-1.79,4.008-2.686,6.713-2.686C51.117,18.558,53.938,20.101,55.613,23.187z'/%3e%3c/g%3e%3c/svg%3e)
%20--%3e%3c!DOCTYPE%20svg%20PUBLIC%20'-//W3C//DTD%20SVG%201.0//EN'%20'http://www.w3.org/TR/2001/REC-SVG-20010904/DTD/svg10.dtd'%3e%3csvg%20version='1.0'%20id='Layer_1'%20xmlns='http://www.w3.org/2000/svg'%20xmlns:xlink='http://www.w3.org/1999/xlink'%20x='0px'%20y='0px'%20width='64px'%20height='64px'%20viewBox='5.5%20-3.5%2064%2064'%20enable-background='new%205.5%20-3.5%2064%2064'%20xml:space='preserve'%3e%3cg%3e%3ccircle%20fill='%23FFFFFF'%20fill-opacity='0'%20cx='37.637'%20cy='28.806'%20r='28.276'/%3e%3cg%3e%3cpath%20fill='%23595959'%20d='M37.443-3.5c8.988,0,16.57,3.085,22.742,9.257C66.393,11.967,69.5,19.548,69.5,28.5c0,8.991-3.049,16.476-9.145,22.456%20C53.879,57.319,46.242,60.5,37.443,60.5c-8.649,0-16.153-3.144-22.514-9.43C8.644,44.784,5.5,37.262,5.5,28.5%20c0-8.761,3.144-16.342,9.429-22.742C21.101-0.415,28.604-3.5,37.443-3.5z%20M37.557,2.272c-7.276,0-13.428,2.553-18.457,7.657%20c-5.22,5.334-7.829,11.525-7.829,18.572c0,7.086,2.59,13.22,7.77,18.398c5.181,5.182,11.352,7.771,18.514,7.771%20c7.123,0,13.334-2.607,18.629-7.828c5.029-4.838,7.543-10.952,7.543-18.343c0-7.276-2.553-13.465-7.656-18.571%20C50.967,4.824,44.795,2.272,37.557,2.272z%20M46.129,20.557v13.085h-3.656v15.542h-9.944V33.643h-3.656V20.557%20c0-0.572,0.2-1.057,0.599-1.457c0.401-0.399,0.887-0.6,1.457-0.6h13.144c0.533,0,1.01,0.2,1.428,0.6%20C45.918,19.5,46.129,19.986,46.129,20.557z%20M33.042,12.329c0-3.008,1.485-4.514,4.458-4.514s4.457,1.504,4.457,4.514%20c0,2.971-1.486,4.457-4.457,4.457S33.042,15.3,33.042,12.329z'/%3e%3c/g%3e%3c/g%3e%3c/svg%3e)
Introduction
Biologically derived materials cultivated from fungi, plants and bacteria are increasingly explored in design as alternatives to conventionally manufactured materials (Gazit Reference Gazit2016). Unlike inert materials, these systems remain metabolically active during fabrication, meaning their growth, morphology and material properties are not fully predetermined but are partially generated through the fabrication process itself, as a result of dynamic interactions between the organism and the environment. This shifts the role of material within the design process. Instead of functioning as stable, predictable inputs, living materials unfold over time and cannot be fully specified in advance. Consequently, designing with living systems moves away from conventional design logic, where material performance is assumed to be known before fabrication begins. Instead, design becomes an iterative, context-dependent engagement with self-organising biological processes shaped by interconnected genetic, phenotypic and environmental parameters (Dade-Robertson and Zhang Reference Dade-Robertson and Zhang2024).
This biological openness is also the source of a persistent methodological problem. While researchers across agricultural science, bioengineering and biodesign have identified environmental variables, such as light, humidity, nutrients and CO2 that influence biological growth, knowing how a material tends to respond is not the same as knowing how to intervene to produce an intended outcome. The system is inherently self-organising and only partially controllable. Designers can regulate boundary conditions but cannot fully determine emergent biological behaviour. This raises the practical question that this paper takes as its starting point: if a designer wants to produce an artefact using a living material, can they develop a form of anticipation sufficient to guide intervention before cultivation begins, drawing on prior observations rather than requiring new full-scale growth trials? The aim is not precise prediction, but a constrained estimate of likely outcomes that supports decisions about form and fabrication conditions, rather than leaving results to be discovered through repeated trial and error. This matters practically, since repeated growth trials are time-consuming and resource-intensive and often yield results too late to inform upstream design decisions about form, assembly or specification. This paper proposes that such anticipation is possible through a representational framework developed from empirical observation.
Existing approaches to this problem, including mathematical growth models (Yang et al. Reference Yang, Zhao, Yu, Wang, Wang and Tang2013), computational biofabrication platforms (Smith et al. Reference Smith, Bader, Sharma, Kolb, Tang and Hosny2020) and digital twin systems (Vu et al. Reference Vu, Funk, Huang and Barati2024), have each made meaningful progress, but under conditions that differ significantly from early-stage design exploration: large, parameterised datasets, engineered organisms or continuous sensing infrastructures. This paper presents an experimental investigation into whether biological variability can be structured to support design reasoning ahead of fabrication. Using Pleurotus ostreatus (oyster mushrooms) as a biological probe, the study examines correlations between environmental drivers, including humidity, CO2, gravitational orientation and substrate amount and morphological outcomes. The choice of mushroom morphology is methodological rather than application-driven. It provides a responsive, measurable growth system through which input–output relationships can be examined with minimal equipment and without the need for genetic modification or specialised sensing infrastructure. The research does not begin with a predefined method. Instead, it begins with a question: whether observed growth tendencies can be translated into a form that supports design reasoning before a growth trial begins. It then proceeds through a series of single-and multi-parameter experiments to explore this question.
The contribution of this work is not a new biological model or predictive system, but a representational framework for translating empirical observations of biological variability into visual and spatial design tools. The method does not predict exact forms; instead, it organises observed growth tendencies into defined fields of potential outcomes, drawing on the mathematical concept of a probability space. By defining zones of likely growth rather than fixed geometries, the PSM enables designers to treat biological variability as a navigable design parameter. Rather than eliminating uncertainty or monitoring it in real time, it renders uncertainty spatial and visual, functioning as a representational framework that translates sparse empirical data into practical design tools, operable before fabrication and without requiring mechanistic simulation or large datasets.
Different approaches to uncertainty in biodesign
The challenge of anticipating biological uncertainty in design contexts has been approached from several directions. Across the literature, there is a shared recognition that living materials resist deterministic prediction, as their behaviour is inherently variable, nonlinear and shaped by environmental interdependencies that no single model can fully capture (Camere and Karana Reference Camere and Karana2018; Cianfano et al. Reference Cianfano, Celli, Marseglia, Rognoli, Nimkulrat, Ferraris and Mattioli2025; Vu et al. Reference Vu, Funk, Huang and Barati2024). Despite this common ground, existing approaches cluster around four main strategies, each taking a distinct stance on what uncertainty is and how it should be treated, ranging from a problem to be narrowed, to a generative condition to be embraced, to something that can be designed around, to something made legible through continuous data (Giaccardi et al. Reference Giaccardi, Murray-Rust, Redström and Caramiaux2024).
The first is predictive modelling, in which mathematical or computational models are used to narrow the uncertainty space before physical experimentation begins. Yang et al. (Reference Yang, Zhao, Yu, Wang, Wang and Tang2013) demonstrate this through quadratic equations, relating temperature and humidity to morphological development in Pleurotus eryngii, producing environmental control ranges that reduce unpredictability in commercial mushroom cultivation. Smith et al. (Reference Smith, Bader, Sharma, Kolb, Tang and Hosny2020) extend this into three-dimensional space through finite-element modelling of chemical diffusion and dose-response curves in living materials, embedding a predictive simulation directly into a CAD environment so that biological outcomes can be anticipated before fabrication.
The second strategy, biotinkering and slow prototyping, reconceives uncertainty as a generative condition rather than a problem to solve. Instead of modelling or engineering predictability, designers accumulate experiential understanding by working directly with living materials across multiple cycles, setting conditions, observing responses and iterating. Like a crafter who learns a material’s behaviour through practice, each cultivation cycle refines the designer’s ability to anticipate likely outcomes, turning biological unpredictability into a navigable design parameter. Camere and Karana (Reference Camere and Karana2018) document this structured yet intuitive experimentation, treating biological variability as a design material in its own right. Cianfano et al. (Reference Cianfano, Celli, Marseglia, Rognoli, Nimkulrat, Ferraris and Mattioli2025) formalise this through slow prototyping and its operative mode biotinkering, an iterative, dialogic engagement with living organisms, where delays and failures are not obstacles but data points that deepen material understanding over time.
The third strategy uses programmed biological behaviour, in which synthetic biology and digital fabrication are used to engineer organisms so that their responses to stimuli become more tractable and replicable. Smith et al. (Reference Smith, Bader, Sharma, Kolb, Tang and Hosny2020) exemplify this through engineered Escherichia coli gene circuits that respond predictably to chemical signals embedded in 3D-printed objects.
The fourth strategy relies on digital tools, using real-time sensing, monitoring and modelling to make biological uncertainty legible and manageable over time. Vu et al. (Reference Vu, Funk, Huang and Barati2024) propose Digital Twins as a framework for this, arguing that dataflow between a physical living system and its digital representation allows designers to navigate rather than eliminate uncertainty. They acknowledge, however, that introducing sensing, modelling and representation layers also generates new forms of uncertainty of its own. Breed et al. (Reference Breed, Karana, Bozzon and Song2026) extend this further, arguing that biodigital systems, which map biological computational functions such as memory, adaptation and evaluation onto digital counterparts, can reduce functional unpredictability by situating organisms within stabilising digital architectures. Zhou et al. (Reference Zhou, Barati, Giaccardi and Karana2022) complement both by mapping the broader landscape of digital tools in biodesign, from visualisation and simulation to fabrication control, showing how the choice of representation fundamentally shapes the designer’s relationship to biological uncertainty.
What remains underexplored is an approach suited to earlier and more constrained conditions, where empirical data is sparse, fabrication constraints are still being discovered and design decisions must be made before those conditions are met, without requiring large datasets, genetically traceable organisms, continuous sensing infrastructure or sufficient time to iterate through multiple growth cycles. The gap is not simply technical but representational, since partial empirical knowledge needs to be structured into a form that actively supports design reasoning before fabrication begins. This is the question the present study addresses.
Methods
While the biological mechanisms of Pleurotus ostreatus are well documented, this research focuses on the epistemological shift involved in translating growth observations into a functional design interface. It develops a representational framework, derived from experimental observations, that structures growth data to support design decision-making. The core methodological question asks whether individual growth tendencies can be synthesised into a bounded field of morphological possibility that supports design reasoning. To explore this, the research integrates biological cultivation and morphological measurement, used to establish baseline growth rules, with the construction of diagrams and spatial models that externalise uncertainty, enabling the designer of growth conditions to navigate biological variability.
This paper follows an exploratory research process in which the Probability Space Method (PSM) was not defined prior to experimentation but emerged from it. The methods described below, establishing biological rules, generating morphological expectations and translating them into design representations, constitute both the experimental process and the conditions through which the PSM took shape. The framework is formally defined in the Results section, where the experimental outcomes necessitated it.
Data extraction and the establishment of biological rules
To investigate the relationship between environmental variables and biological form, this study uses Pleurotus ostreatus (oyster mushrooms) as a probe. Mushrooms provide an effective test system for material fabrication due to their rapid development and pronounced morphological responsiveness to external factors, including air temperature, light intensity, humidity levels, gravitational orientation and substrate amount (Bellettini et al. Reference Bellettini, Fiorda, Maieves, Teixeira, Ávila, Hornung, Júnior and Hoffmann-Ribani2019). This flexibility provides a rich experimental ground for identifying preliminary parameters that govern biological form.
To isolate these factors, this study draws upon a series of single-parameter experiments which were previously published (Ozkan et al. Reference Ozkan, Morrow, Zhang and Dade-Robertson2022). All mushroom samples were grown under standardised baseline conditions (80% humidity, 1000 ppm CO2, 22°C, vertical orientation, dark) with environmental manipulations introduced during the eight-day fruiting phase. Each condition was tested using three replicates. On Day 27, the samples were documented using photography and 3D-scanning to capture precise morphological data.
The scans were digitally overlaid and measured in Rhinoceros. Cap curvature, stalk angle and overall dimensions were measured (Table 1) to identify specific morphological correlations. The reported minimum and maximum values represent the observed range across replicates, while averages correspond to the mean of the three specimens.
Summary of prior single-parameter experiments

Table 1 Long description
A table with four rows and five columns summarizing the effects of different parameters on morphological characteristics. The columns are labeled Parameter, Range, Primary morphological effect, Min, Max, and Average. The rows detail the parameters: Humidity, CO2, Gravity, and Substrate amount. Humidity ranges from 75-95 percent and affects cap curvature in degrees, with minimum 5, maximum 130, and average 65. CO2 ranges from 1000-5000 parts per million and affects cap size in centimeters, with minimum 0.2, maximum 2.4, and average 1.5. Gravity ranges from 0-360 degrees and affects stalk bend angle in degrees, with minimum 0.2, maximum 60, and average 25. Substrate amount ranges from 40-160 grams and affects stalk length in centimeters, with minimum 2.0, maximum 5.9, and average 4.2.
Although a sample size of three is insufficient to establish a statistically robust distribution, it functions here as a proof of concept for defining a preliminary morphological envelope. This envelope can be iteratively refined as the dataset expands and serves to test the feasibility of translating environmental inputs into a three-dimensional design space. The emphasis, therefore, shifts from static statistical validation towards the development of a dynamic, learning-based design system.
The analysis revealed a clear hierarchy of influence: humidity appeared as the primary driver of cap curvature, while CO 2 levels, gravitational orientation and substrate amount were preliminarily associated with cap size, stalk bend angle and stalk size, respectively (Figure 1).
Overlaid 3D mushroom scans illustrating the primary drivers of morphology. The comparison demonstrates the correlational relationship between specific environmental inputs and their corresponding dominant outputs: Humidity-cap curvature, CO2-cap size, gravitational force-stalk bend and substrate amount-stalk size.

Principles identified from the experimental data
Analysis of this prior data established three operational principles, nonlinearity, correlation and thresholds, which serve as guidelines and rules for further multi-parameter mushroom experiments.
-
• Nonlinearity: Prior experiments confirmed that biological systems do not respond proportionally to environmental changes. As illustrated by mushroom growth under varying humidity, an increase in a parameter may produce an incremental change in one range but trigger abrupt morphological shifts near a developmental threshold. Meaning, the relationship between input and output is not linear but characterised by changing slopes, plateaus and discontinuities (DeLanda Reference DeLanda2015). Thus, morphological outcomes exist as tendencies rather than deterministic rules. For design, this requires that the predictions operate in terms of likely ranges rather than precise coordinates. Within limited parameter ranges, organisms may exhibit locally stable tendencies allowing approximate anticipation. Beyond these ranges, however, small changes can produce disproportionate or qualitatively different effects.
-
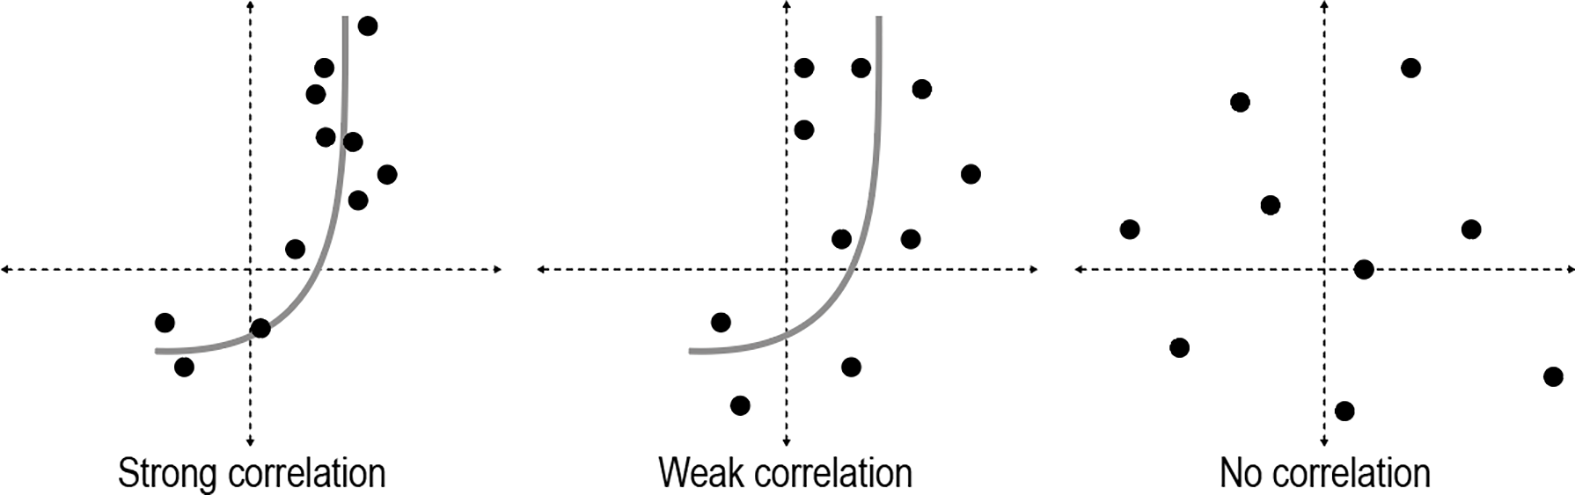
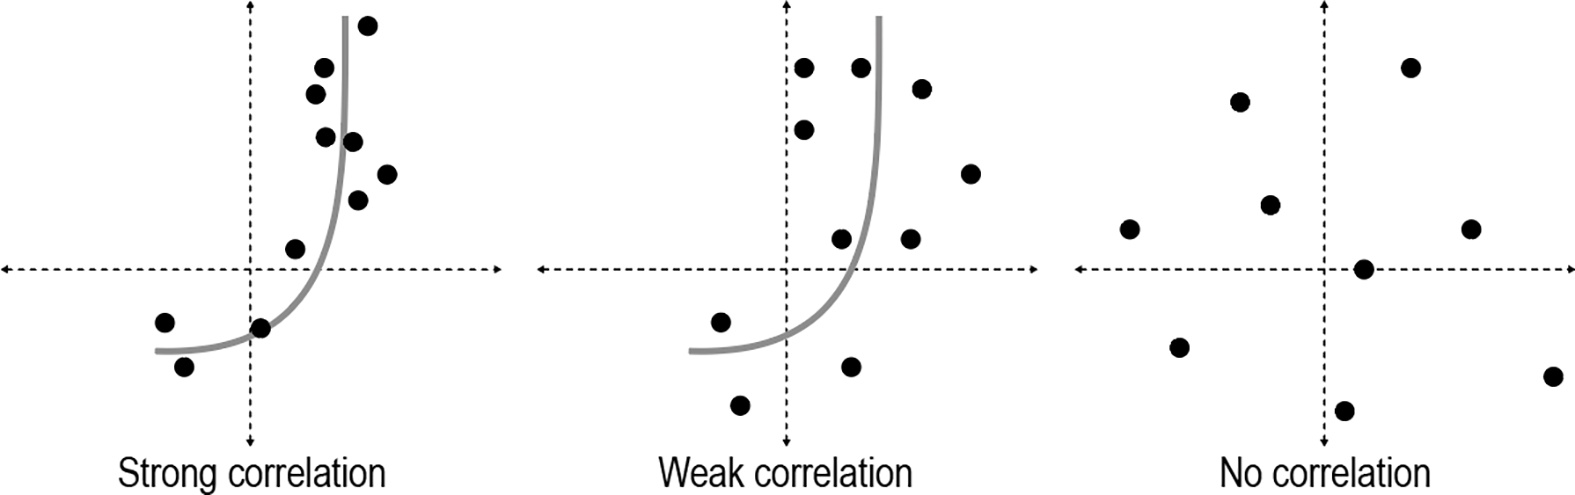
• Correlation: Despite their nonlinearity, the data revealed strong correlations linking environmental parameters to morphological features. For example, if increased humidity consistently corresponded with greater cap curvature, this tendency becomes operationally useful for design even without mapping the underlying biochemistry. These correlations are exploratory and context-specific, not generalised predictions.
In a design context, correlation identifies zones where behaviour is stable (high-correlation zones-low variance) versus zones of high variability (low-correlation) (Figure 2). Critically, these tendencies serve as building blocks for multi-parameter predictions. By isolating the dominant drivers of individual features, such as humidity for cap curvature and CO2 for cap size, designers can hypothesise approximate outcomes of complex conditions. A condition with both high humidity and elevated CO2 can thus be anticipated to produce a larger cap with higher curvature within a bounded range.
-
• Thresholds: The single-parameter data identified critical thresholds where morphological behaviour became less predictable. These transitions arise from physiological constraints or environmental stress. Below a certain humidity level, fruiting may proceed normally; beyond a critical point, caps may fail to form (low humidity) or contamination may dominate (high humidity). Thresholds are used to: (1) define the boundaries of applicability, ensuring predictions are generated only within viable ranges, (2) indicate regions of higher uncertainty, alerting designers that outcomes may become less predictable or qualitatively different as conditions approach tipping points.
Diagram of three types of correlation.
Generating morphological expectations
As a procedural proof of concept, this study conducted a series of multi-parameter experiments to examine whether observed directional tendencies from single-parameter experiments could be synthesised to generate bounded expectations for new environmental configurations. Rather than treating each parameter in isolation, the experiments tested whether previously observed tendencies could be combined to approximate likely morphological ranges.
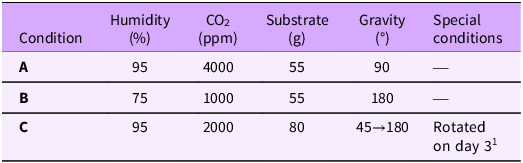
To predict the characteristics of mushrooms grown under new environmental configurations, morphological data were retrieved from earlier experiments, with a focus on the primary drivers identified for each feature (Figure 1). New parameter values were defined within the validated experimental ranges (Table 2), ensuring that all predictions remained within empirically observed boundaries. Three experimental conditions were formulated to test multi-parameter synthesis:
-
• Condition A, high humidity with elevated CO2,
-
• Condition B, inverted gravitational orientation under lower humidity,
-
• Condition C, mid-growth shift in gravitational orientation to test developmental trajectory prediction.
Multi-parameter experimental conditions
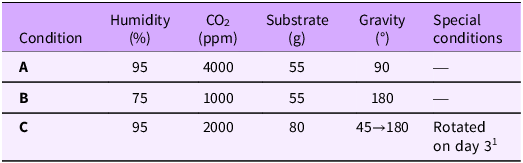
Table 2 Long description
A table comparing experimental conditions for mushroom growth. The table has three rows and six columns. Column headers are Condition, Humidity (percent), CO2 (parts per million), Substrate (grams), Gravity (degrees), and Special conditions. Row 1: Condition A, Humidity 95 percent, CO2 4000 parts per million, Substrate 55 grams, Gravity 90 degrees, Special conditions blank. Row 2: Condition B, Humidity 75 percent, CO2 1000 parts per million, Substrate 55 grams, Gravity 180 degrees, Special conditions blank. Row 3: Condition C, Humidity 95 percent, CO2 2000 parts per million, Substrate 80 grams, Gravity 45 to 180 degrees, Special conditions Rotated on day 3.
1 The predicted stalk bend for the condition C accounts for a lagged biological response to the gravitational shift on Day 3. The ‘Average’ expectation is modelled as the cumulative result of growth trajectories in both the initial (45°) and terminal (180°) orientations.
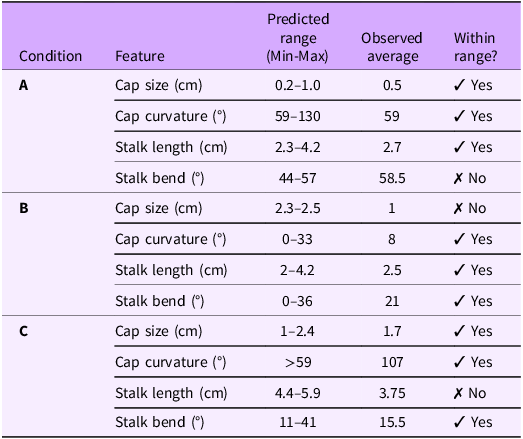
For each condition, expected morphological ranges were derived in Table 3, using proportional interpolation of previously observed tendencies, constrained within the minimum and maximum values from Table 1. For example, if increasing humidity typically led to a certain percentage increase in cap curvature, the curvature at 85% humidity was expected to fall within the range observed at 75% and 95%. To determine the dimension with the higher likelihood, the midpoint between the minimum and maximum curvature values at 85% humidity was calculated. For each condition, minimum, maximum and average values were estimated for cap size, cap curvature, stalk length and stalk bend angle. Predictions were generated prior to cultivation and intended as exploratory design guidance rather than statistical forecasts.
Consolidated results: predicted versus observed morphologies
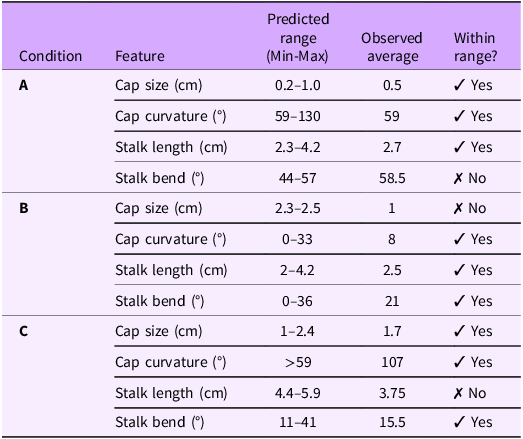
Table 3 Long description
A table comparing predicted and observed morphological features under three different conditions. The table has four columns: Condition, Feature, Predicted range (Min-Max), Observed average, and Within range?. It contains data for three conditions labeled A, B, and C. Each condition includes features such as Cap size (cm), Cap curvature (degrees), Stalk length (cm), and Stalk bend (degrees). For Condition A, Cap size ranges from 0.2 to 1.0 cm with an observed average of 0.5 cm and is within range. Cap curvature ranges from 59 to 130 degrees with an observed average of 59 degrees and is within range. Stalk length ranges from 2.3 to 4.2 cm with an observed average of 2.7 cm and is within range. Stalk bend ranges from 44 to 57 degrees with an observed average of 58.5 degrees and is not within range. For Condition B, Cap size ranges from 2.3 to 2.5 cm with an observed average of 1 cm and is not within range. Cap curvature ranges from 0 to 33 degrees with an observed average of 8 degrees and is within range. Stalk length ranges from 2 to 4.2 cm with an observed average of 2.5 cm and is within range. Stalk bend ranges from 0 to 36 degrees with an observed average of 21 degrees and is within range. For Condition C, Cap size ranges from 1 to 2.4 cm with an observed average of 1.7 cm and is within range. Cap curvature is greater than 59 degrees with an observed average of 107 degrees and is within range. Stalk length ranges from 4.4 to 5.9 cm with an observed average of 3.75 cm and is not within range. Stalk bend ranges from 11 to 41 degrees with an observed average of 15.5 degrees and is within range.
Translating probabilistic data into design representations
To make estimated morphological ranges legible for design, predicted dimensions were translated into two-dimensional diagrammatic drawings. A 0.5 × 0.5 cm grid was established in Adobe Illustrator and AutoCAD to standardise scale and enable visual comparison. For each experimental condition, five potential morphological variations were illustrated within this grid to represent the anticipated range of growth (Figure 3).
A diagram illustrating the locations of the measurement points in 2D for various morphological features. The grid size used was 0.5 × 0.5 cm. Lighter, grey and dashed lines represent a lower likelihood of mushroom growth, whereas darker and thicker lines signify a higher likelihood of mushrooms growing in those forms.

The smallest and largest sizes or degrees of curvature of caps and stalks were depicted in grey using lighter and dashed lines to indicate a lower likelihood within the observed ranges. Conversely, average tendencies were represented by darker and thicker lines to indicate the more probable configurations, as illustrated in Figure 4, top row. These drawings function as exploratory visual probability maps, externalising uncertainty and providing a framework for planning future experiments.
Visual comparison of the A (Column 1), B (Column 2) and C (Column 3) experiments. The top row (expected) shows the drawings of predicted mushroom morphologies. The second row (actual) presents 3D-scanned mushrooms grown under the corresponding experimental conditions, overlying observed morphological variation. The third row overlays predicted drawings with the scanned morphologies, enabling direct visual comparison between anticipated probability range and realised outcomes. All overlays are shown on a 0.5 × 0.5 cm grid. The bottom row presents close-up photographs of the mushroom growth.

Following cultivation, mushroom formations were documented on Day 27 using 3D-scanning. Predicted and realised outcomes were evaluated at a macro scale using two complementary approaches: (1) visual comparison between the 2D diagrams and resulting digital overlaid 3D scans and (2) quantitative comparison to determine whether the recorded measurements fell within the predicted ranges. No statistical validation was conducted; the comparison was intended only to assess the practical utility of the morphological probabilities as a design tool.
Results
Quantitative findings
Across all multi-parameter experiments and replicates, 22 out of 28 evaluated morphological features (approximately 78%) fell within the predicted morphological ranges (Table 3, Figure 4). However, in conditions A and C, one sample from each replicate failed to produce fruiting bodies. When these non-growth events are counted as failures, the overall containment rate drops to 22 out of 36 (approximately 61%). This drop does not merely indicate experimental error; rather, it reveals a viability threshold, the practical limits of the system’s performance. In a design context, these non-growth events are as informative as successful growth; they define the boundaries of the designable space. Incorporating them into probability models is essential for mapping the absolute limits of biological possibility, ensuring that both growth and failure inform design reasoning.
Condition A showed the strongest correspondence between predicted and observed morphologies despite combining extreme parameter values. Predicted outcomes correctly anticipated the coexistence of small cap size (associated with high CO2) and high cap curvature (associated with high humidity), demonstrating that opposing tendencies can be simultaneously approximated within a bounded framework when parameters predominantly affect different features.
Condition B revealed a significant deviation. The observed cap size was consistently smaller than the predicted minimum. This outcome suggests a synergistic interaction, where low humidity levels amplified the size-reducing influence of CO2 beyond the effects observed in isolated, single-parameter trials. While the initial predictive range did not contain this outcome, the consistency of the deviation across all replicates indicates a deterministic, though complex, biological response. These results show that while a linear summation of individual effects provides a functional baseline for most scenarios, a more sophisticated model is required to account for how environmental drivers compound nonlinearly. For the designer, this identifies a nonlinear coupling zone where morphological expectations must be weighted more heavily towards lower bounds to account for combined environmental stressors.
Condition C, involving a mid-growth gravitational shift, demonstrated the method’s capacity to anticipate complex developmental patterns. Most features fell within the predicted ranges, although one stalk length was shorter than expected due to a lack of data for larger substrate amounts. Importantly, the general trends held true; larger substrate volumes led to longer stalks and gravitational shifts resulted in compound bending.
The results demonstrate that nonlinear relationships between environment and morphology can be approximated within bounded ranges, although variation remains significant. These variations are integral parts of the biological parametric relationship. For this reason, it is more appropriate to define potential forms (or values) as areas, rather than single points or lines. These areas represent zones of relatively higher and lower certainty, creating a space of probabilities that covers the full range of possible growth. In this sense, the space of probabilities recognises that living materials vary depending on parameter combinations, supporting range-based anticipation rather than deterministic prediction. This observation forms the basis of the representational framework introduced in the following section.
The probability space method
These results prompted an analogy from the mathematical concept of a probability space. The pattern of findings, including bounded variability, directional tendencies and zones of predictable versus unpredictable behaviour, suggested that biological growth could be treated not as a deterministic outcome but as a distribution of likely states. In mathematics, a probability space is a mathematical framework for representing random phenomena and determining the likelihood of events occurring within a defined set of possible outcomes (Siegmund Reference Siegmund2025). A probability space consists of three key components (Siegmund Reference Siegmund2025):
-
• Sample space (Ω): The set of all possible outcomes. In this study, it represents the full spectrum of potential mushroom morphologies under diverse environmental conditions.
-
• Sigma-algebra (F): A collection of subsets of the sample space, known as events. Here, it refers to specific morphological groups that emerge under a given set of conditions (e.g., all variations possible at 90% humidity).
-
• Probability measure (P): A function assigning likelihoods to events. In this framework, it represents the degree of certainty associated with specific morphological outcomes under given environmental conditions.
Probability theory is widely applied in fields such as finance, chemistry and architecture, where it supports generative design exploration, space allocation optimisation and building performance assessment (Gerber et al. Reference Gerber, Pantazis and Wang2017; Rahbar et al. Reference Rahbar, Mahdavinejad, Bemanian, Davaie Markazi and Hovestadt2019; Tijms Reference Tijms2004; Wang et al. Reference Wang, Li and Sun2025). However, its use in biodesign remains limited. Probabilities can be represented using graphical networks, such as Bayesian and Markov networks, to help understand dependencies among variables and analyse complex systems with interconnected elements (Koller and Friedman Reference Koller and Friedman2009). However, this paper proposes its use as a representation framework in biodesign.
For the generation of the space of probabilities, 2D drawings were initially used as a visual representation of the designer’s predicted morphology for future mushroom growth (Figure 4, expectation drawings). These drawings served as the initial step in creating a probability space, offering insight into the potential form of newly grown mushrooms. However, these planar projections failed to capture the spatial depth of biological development. To address this limitation, a Probability Space Method was proposed. This method focuses less on predicting specific forms and more on predicting the distribution of matter. It encompasses a set of possible forms in the third dimension, providing a more comprehensive understanding of mushroom morphology. It serves as a conceptual representation for describing the likelihood of different outcomes occurring. The proposed probability space method functions as a design framework for a defined specific range in which newly grown mushrooms may form.
The concept of a probability space might be reminiscent of the concept of tolerance; however, it represents a spectrum of morphologies rather than various levels of tolerance. In engineering and biology, tolerance typically reflects an organism’s ability to survive across a range of environmental factors without adverse reactions. As illustrated in Figure 5a, the probability space does not necessarily include tipping points or extreme thresholds where the organism dies. Instead, it represents the potential states of the organism while it remains viable.
(a) The graph depicting various lines along with their range, illustrating the curvature of mushrooms at 80% humidity, generates a probability space. (b). Graphs illustrating the varying levels of certainty of the newly grown mushrooms.

The probability space acknowledges that even under identical conditions, mushrooms exhibit variations in size and curvature; therefore, it is more accurate to define potential outputs as an area of probability rather than a single point or line. As illustrated in purple in Figure 5a and 5b, although mushrooms follow a general morphological trend, each specimen develops a distinct growth pattern, making identical forms impossible. The probability space drawings represent the range of possible three-dimensional forms that may emerge under a specific set of conditions. Currently, the model is based on an average of three samples per condition. While this serves as a functional proof of concept, incorporating larger datasets would make a more robust and definitive probability space.
Visualisation of probability spaces
The two-dimensional predictive drawings translated the anticipated morphological ranges into an inspectable visual format, using line weight and dashing to indicate relative likelihood. While effective for comparing feature boundaries, these planar projections compress three-dimensional biological growth into two dimensions and obscure critical spatial information. Mushroom morphology varies volumetrically, caps curve through space, stalks bend in multiple directions and understanding where in 3D space growth is more or less likely enables designers to reason about spatial constraints, assembly logic and structural performance before physical fabrication occurs.
To overcome the limitations of two-dimensional projection, the PSM extends into volumetric representations using particle-based systems. These three-dimensional probability spaces visualise not only possible forms but also the spatial distribution of morphological likelihood. They address a fundamental design question: under specific environmental conditions, what is the probability of finding an organism’s tissue at a given space coordinate?
To answer this question, three-dimensional probability spaces were generated by aligning and overlaying 3D-scanned mushrooms obtained from single-parameter experiments. These composite volumes were imported into Autodesk Maya, where the nParticle (a particle-based simulation tool) system was used to distribute matter within the boundaries defined by the overlapping scan geometries (Figure 6). Particle density corresponded directly to morphological likelihood. Dense clusters indicated high-probability regions where most specimens intersect, sparse distributions indicated lower-probability extremes and particles extending beyond all scan boundaries represented possible but rarely observed variations (Figure 7).
Diagram illustrating the construction of volumetric probability spaces generated from aligned 3D-scans of mushrooms using Autodesk Maya. Scans were converted into polygon surfaces (nCloth) and used as passive colliders to constrain particle generation. nParticles were then distributed within these volumes, with density proportional to the degree of overlap among scans. Particles were allowed limited extension beyond scan boundaries to represent low-probability morphological extremes, and adjustable parameters such as particle size, stickiness and propagation speed enabled visual differentiation of probability gradients. The resulting particle clouds provide a volumetric representation of spatial uncertainty while remaining analytical rather than predictive.

A probability space illustrating the likelihood of a newly grown mushroom being in a specific area.

To make these volumes analytically useful, the probability spaces were sectioned into a series of plans and elevations. Figures 8 and 9 present vertical sections (AA, BB, CC) and horizontal plans (DD, EE, FF) through probability spaces for mushrooms grown at 95% humidity. These drawings reveal how probability distributions vary spatially: where caps most likely form, how stalk positioning varies and the overall volumetric envelope of possible outcomes. Denser particle concentrations and darker colours indicate higher probabilities, while lighter and more diffuse regions indicate lower probabilities.
Section drawing of probability spaces for mushrooms grown under 95% humidity. The top-left drawing indicates where the section was cut. AA, BB and CC illustrate the section cuts of the probability space. Areas with denser particles or darker colours represent higher probabilities.

Plan drawing probability spaces for mushrooms grown under 95% humidity. The top-left drawing indicates the levels of the plan. DD, EE and FF represent the plans within the probability space. Areas with denser particles or darker colours represent higher probabilities.

These visualisations enable forms of spatial assessment that are not possible with two-dimensional drawings alone. A designer evaluating whether mushrooms can grow within a constrained spatial envelope, such as formwork, can inspect these section cuts to ensure high-probability growth regions remain within the available space. Similarly, these models help designers move beyond idealised assumptions; rather than presuming stalks grow vertically, they can see where stalks are most likely to develop and how the overall form may evolve. This turns biological uncertainty into a navigable, inspectable map for architectural decision-making.
Towards predictive modelling
The long-term goal of this research trajectory is a fully predictive 3D model, with the PSM developed here serving as the foundational representational layer on which such a model would be built. The analytical probability spaces developed in this study suggest a path towards achieving this goal. Such models would generate probability distributions for untested conditions based on prior correlations. This proposed approach would function as a three-step computational process: (i) establish a volumetric matrix at a defined resolution to represent the potential growth volume, (ii) calculate the likelihood of containing organism tissue by synthesising the dominant parameter correlations for each voxel, (iii) translate these probabilities into 3D heat maps where colour indicates likelihood (red = high, blue = low, transparent = none) (Figure 10). The voxel-based method would effectively answer the central design question: given humidity X, CO 2 Y, substrate Z and gravity angle W, how likely is a mushroom to occupy this specific location in space? In constrained fabrication scenarios, such as growing mycelium within a mould or formwork, the probability space shows where tissue has tended to concentrate under given conditions, informing whether a designer can expect growth to remain within the intended cavity or exceed its bounds before committing to cultivation. At the component scale, spatially resolved probability maps indicate whether high-probability growth zones align with load-bearing cross-sections, and whether functionally graded regions, such as denser tissue for acoustic absorption or sparser tissue for thermal insulation, are likely to emerge in the locations the design requires. At the architectural scale, these maps support decisions about clearance, tolerances and assembly sequencing, replacing guesswork with statistically grounded spatial planning before cultivation begins. Beyond architecture, the same principles apply to product design, where mycelium-grown components must conform to precise dimensional envelopes, and the probability space can inform whether that fit is likely before cultivation begins.
The illustration of the proposed 3D model involves populating a matrix with varying probabilities, indicating the likelihood of a voxel containing the organism, some pixels exhibiting a high chance, while others exhibiting a low chance.

However, implementing such models requires substantial computational resources and sophisticated algorithms. The data requirements are significant, including sufficient samples to establish probability distributions at voxel resolution, correlations mapped to spatial coordinates rather than just overall dimensions and methods for interpolating between known data points in three-dimensional parameter space. Additionally, computational demands increase dramatically as matrix resolution rises. Using a finer 3D grid allows more detailed predictions of tissue distribution but requires processing millions of voxels. Due to these constraints, predictive 3D modelling remains future work. The current analytical spaces establish the visualisation framework, demonstrate that particle density effectively communicates spatial probability and provide groundwork for computational implementation once sufficient empirical data and processing capabilities are available. As biofabrication datasets expand and computational methods mature, voxel-based predictive models could integrate into BioCAD workflows. This would enable designers to preview biological growth volumetrically before physical fabrication, a capability currently absent from biofabrication practice.
Implications for design practice
Within the PSM, the design target is not a single predefined morphology but a bounded range of possible forms. Therefore, the designer’s role shifts from form-making to structuring the conditions under which form emerges. Rather than specifying exact geometries, the designer defines parameter ranges, thresholds and acceptable variability. Control is reframed as boundary-setting, establishing viable parameter zones within which the organism retains its adaptive capacity, so that form becomes an outcome of calibrated conditions rather than a fixed objective. The method thus allows designers to anticipate likely tendencies without suppressing biological variability.
This shift also redefines the nature of the design process by turning prototyping into a data-harvesting event. Each cultivation cycle, including those with unexpected deviations, becomes a data point that refines the probability map, moving design practice away from a linear trajectory towards creating a single artefact and towards the continuous mapping of a living material’s performance envelope. Each iteration involves mapping and narrowing the performance envelope through continuous biological feedback.
Designing with living materials thereby becomes a multi-faceted practice where the output is distributed between physical artefacts and methodological systems. On one hand, this framework enables the cultivation of materials with calibrated morphological properties. By anticipating features such as cap curvature or stalk length, designers can develop performative components, such as acoustic panels or functionally graded insulation, where the spatial distribution of fungal tissue directly determines material performance. On the other hand, the research produces a broader framework for systematic interaction with living systems: (i) probability-representation tools, including the 2D drawings and volumetric particle-based spaces that map potential outcomes before cultivation and (ii) transferable protocols in the form of parameter tables and prediction ranges applicable to new environmental configurations beyond those tested here.
In this respect, the PSM addresses a broader methodological gap in biodesign. While substantial empirical knowledge exists on how living systems respond to environmental conditions, these relationships are typically embedded in isolated experiments or organism-specific workflows and are rarely structured into cumulative, transferable frameworks. The PSM introduces an intermediate layer by organising correlations between environmental parameters and morphological outcomes into navigable probability spaces, translating tacit experimental knowledge into an explicit, extensible system. Designers working with new organisms or configurations, therefore, do not begin from zero, but from a representational framework that can grow as new data accumulates. Its contribution is not the discovery of biological input–output relationships, but their formalisation into a scalable approach for range-based design reasoning in biodesign.
Conclusion
This paper has demonstrated the feasibility of a design process that transitions from deterministic specification towards a range-based anticipation of outcomes. Through a series of design experiments mapping the correlations between environmental inputs and morphological outputs, this research establishes the PSM as a viable representational framework for biodesign. The framework adopts the mathematical concept of a probability space to represent, predict and visualise the range of possible outcomes within a biological system under specific conditions. Rather than attempting to force a single, deterministic result, it maps all possible forms and their associated likelihoods within a defined spatial field. By utilising tools such as 3D particle-based systems and volumetric heat maps, this approach acknowledges the inherent variability of living systems, moving away from rigid specification towards a structured identification of high and low growth likelihoods.
Predictions generated using this method showed that nearly four-fifths of the observed morphological features fell within the anticipated ranges. This rate demonstrates that, despite their nonlinear behaviour, biological systems exhibit stable tendencies that can be systematically modelled, allowing designers to treat material variation as a navigable design parameter rather than an unpredictable obstacle. Ultimately, this validates a shift in the design paradigm, moving away from the pursuit of a singular, correct form and towards the identification of high-likelihood growth zones that support reliable architectural decision-making.
To operationalise this, the study proposes a three-step workflow: (1) analysing input-output relationships, (2) identifying correlation types and thresholds and (3) generating predictions based on the outcomes of the previous two steps (Figure 11). By following this process, designers can manipulate environmental variables to achieve specific morphological outcomes. This approach reduces reliance on intuition or trial and error, allowing for adjustments to be made before cultivation.
A list of steps that could be followed to demonstrate how to design a living material based on predictions.

Designing with material probabilities alters the designer’s role, engaging fundamental questions about design agency with autonomous materials. As Carpo notes, although co-designing with nature was once considered a romantic thought from the 19th century, the dream becomes achievable in the 21st century (Reference Carpo, Lorenzo-Eiroa and Sprecher2013). In this framework, the designer transforms from a control-oriented form-maker into a facilitator and range-definer. By navigating within biological limitations and embracing probabilities rather than fixed certainties, the designer acts as a choreographer of conditions, allowing the material to co-produce the final form. This contributes to a broader, more-than-human design discourse, decentring human control and foregrounding that outcomes emerge from designer-organism negotiation rather than unilateral authorship.
Limitations and future work
While this research establishes a foundational framework, several limitations remain that define the trajectory for future development. Currently, sample sizes are limited to a proof-of-concept scale; achieving full statistical robustness will require larger experimental groups to quantify variability ranges and increase the confidence levels of the probability distributions. Furthermore, parameter range boundaries currently limit predictions to conditions that have been tested. Extending predictions requires a systematic exploration of threshold behaviours to map exactly where environmental correlations hold and where biological systems pivot into new states. The integration of non-growth instances also remains a critical area for improvement. Rather than treating non-growth as an experimental failure, future iterations of the PSM must systematically incorporate these outcomes to define the performance envelope of the organism. Additionally, while the 3D predictive model is conceptually validated here, its full implementation requires advanced voxel-level calculations and interpolation algorithms to map spatial correlations in real time.
Despite these constraints, this approach lays the groundwork for computational platforms that integrate material behaviour databases, probabilistic modelling engines and parameter adjustment interfaces. Such a framework would allow designers to interact with living materials as fluidly as they manipulate digital input variables, effectively bridging the gap between biological growth and parametric control.
Finally, future work will investigate the extension of this method beyond morphology to predict functional material properties, such as density, thermal conductivity and structural integrity. By transitioning from form-based anticipation to performance prediction, the PSM will enable a closer alignment between the designer’s intent and the material’s actual behaviour. Ultimately, this shift will reduce experimental waste and provide the necessary rigour to enhance the reliability and sustainability of bio-fabricated architecture.
Data availability statement
The authors confirm that the data supporting the findings of this study are available within the article and its supplementary materials. Additional data from prior experiments are reported in Ozkan, D.; Morrow, R.; Zhang, M.; Dade-Robertson, M. (2022). Biomimetics, 7(2), 60. https://doi.org/10.3390/biomimetics7020060.
Author contributions
Conceptualisation: D.O. Methodology: D.O. Data curation: D.O. Data visualisation: D.O. Writing original draft: D.O. Supervision: M.D.R. All authors approved the final submitted draft.
Financial support
This research received no external funding. The project was completed as part of the overseas student scholarship programme at Newcastle University.
Competing interests
No financial or commercial interests influenced the research design, analysis or interpretation of the results.
Ethical standards
This study involved no human participants, animal subjects or personal data. The research consisted solely of fungal cultivation (Pleurotus ostreatus) and morphological measurement conducted at Newcastle University. No ethical approval or informed consent was required.




 Open access

