


%20--%3e%3c!DOCTYPE%20svg%20PUBLIC%20'-//W3C//DTD%20SVG%201.0//EN'%20'http://www.w3.org/TR/2001/REC-SVG-20010904/DTD/svg10.dtd'%3e%3csvg%20version='1.0'%20id='Layer_1'%20xmlns='http://www.w3.org/2000/svg'%20xmlns:xlink='http://www.w3.org/1999/xlink'%20x='0px'%20y='0px'%20width='64px'%20height='64px'%20viewBox='5.5%20-3.5%2064%2064'%20enable-background='new%205.5%20-3.5%2064%2064'%20xml:space='preserve'%3e%3cg%3e%3ccircle%20fill='%23FFFFFF'%20fill-opacity='0'%20cx='37.785'%20cy='28.501'%20r='28.836'/%3e%3cpath%20fill='%23595959'%20d='M37.441-3.5c8.951,0,16.572,3.125,22.857,9.372c3.008,3.009,5.295,6.448,6.857,10.314%20c1.561,3.867,2.344,7.971,2.344,12.314c0,4.381-0.773,8.486-2.314,12.313c-1.543,3.828-3.82,7.21-6.828,10.143%20c-3.123,3.085-6.666,5.448-10.629,7.086c-3.961,1.638-8.057,2.457-12.285,2.457s-8.276-0.808-12.143-2.429%20c-3.866-1.618-7.333-3.961-10.4-7.027c-3.067-3.066-5.4-6.524-7-10.372S5.5,32.767,5.5,28.5c0-4.229,0.809-8.295,2.428-12.2%20c1.619-3.905,3.972-7.4,7.057-10.486C21.08-0.394,28.565-3.5,37.441-3.5z%20M37.557,2.272c-7.314,0-13.467,2.553-18.458,7.657%20c-2.515,2.553-4.448,5.419-5.8,8.6c-1.354,3.181-2.029,6.505-2.029,9.972c0,3.429,0.675,6.734,2.029,9.913%20c1.353,3.183,3.285,6.021,5.8,8.516c2.514,2.496,5.351,4.399,8.515,5.715c3.161,1.314,6.476,1.971,9.943,1.971%20c3.428,0,6.75-0.665,9.973-1.999c3.219-1.335,6.121-3.257,8.713-5.771c4.99-4.876,7.484-10.99,7.484-18.344%20c0-3.543-0.648-6.895-1.943-10.057c-1.293-3.162-3.18-5.98-5.654-8.458C50.984,4.844,44.795,2.272,37.557,2.272z%20M37.156,23.187%20l-4.287,2.229c-0.458-0.951-1.019-1.619-1.685-2c-0.667-0.38-1.286-0.571-1.858-0.571c-2.856,0-4.286,1.885-4.286,5.657%20c0,1.714,0.362,3.084,1.085,4.113c0.724,1.029,1.791,1.544,3.201,1.544c1.867,0,3.181-0.915,3.944-2.743l3.942,2%20c-0.838,1.563-2,2.791-3.486,3.686c-1.484,0.896-3.123,1.343-4.914,1.343c-2.857,0-5.163-0.875-6.915-2.629%20c-1.752-1.752-2.628-4.19-2.628-7.313c0-3.048,0.886-5.466,2.657-7.257c1.771-1.79,4.009-2.686,6.715-2.686%20C32.604,18.558,35.441,20.101,37.156,23.187z%20M55.613,23.187l-4.229,2.229c-0.457-0.951-1.02-1.619-1.686-2%20c-0.668-0.38-1.307-0.571-1.914-0.571c-2.857,0-4.287,1.885-4.287,5.657c0,1.714,0.363,3.084,1.086,4.113%20c0.723,1.029,1.789,1.544,3.201,1.544c1.865,0,3.18-0.915,3.941-2.743l4,2c-0.875,1.563-2.057,2.791-3.541,3.686%20c-1.486,0.896-3.105,1.343-4.857,1.343c-2.896,0-5.209-0.875-6.941-2.629c-1.736-1.752-2.602-4.19-2.602-7.313%20c0-3.048,0.885-5.466,2.658-7.257c1.77-1.79,4.008-2.686,6.713-2.686C51.117,18.558,53.938,20.101,55.613,23.187z'/%3e%3c/g%3e%3c/svg%3e)
%20--%3e%3c!DOCTYPE%20svg%20PUBLIC%20'-//W3C//DTD%20SVG%201.0//EN'%20'http://www.w3.org/TR/2001/REC-SVG-20010904/DTD/svg10.dtd'%3e%3csvg%20version='1.0'%20id='Layer_1'%20xmlns='http://www.w3.org/2000/svg'%20xmlns:xlink='http://www.w3.org/1999/xlink'%20x='0px'%20y='0px'%20width='64px'%20height='64px'%20viewBox='5.5%20-3.5%2064%2064'%20enable-background='new%205.5%20-3.5%2064%2064'%20xml:space='preserve'%3e%3cg%3e%3ccircle%20fill='%23FFFFFF'%20fill-opacity='0'%20cx='37.637'%20cy='28.806'%20r='28.276'/%3e%3cg%3e%3cpath%20fill='%23595959'%20d='M37.443-3.5c8.988,0,16.57,3.085,22.742,9.257C66.393,11.967,69.5,19.548,69.5,28.5c0,8.991-3.049,16.476-9.145,22.456%20C53.879,57.319,46.242,60.5,37.443,60.5c-8.649,0-16.153-3.144-22.514-9.43C8.644,44.784,5.5,37.262,5.5,28.5%20c0-8.761,3.144-16.342,9.429-22.742C21.101-0.415,28.604-3.5,37.443-3.5z%20M37.557,2.272c-7.276,0-13.428,2.553-18.457,7.657%20c-5.22,5.334-7.829,11.525-7.829,18.572c0,7.086,2.59,13.22,7.77,18.398c5.181,5.182,11.352,7.771,18.514,7.771%20c7.123,0,13.334-2.607,18.629-7.828c5.029-4.838,7.543-10.952,7.543-18.343c0-7.276-2.553-13.465-7.656-18.571%20C50.967,4.824,44.795,2.272,37.557,2.272z%20M46.129,20.557v13.085h-3.656v15.542h-9.944V33.643h-3.656V20.557%20c0-0.572,0.2-1.057,0.599-1.457c0.401-0.399,0.887-0.6,1.457-0.6h13.144c0.533,0,1.01,0.2,1.428,0.6%20C45.918,19.5,46.129,19.986,46.129,20.557z%20M33.042,12.329c0-3.008,1.485-4.514,4.458-4.514s4.457,1.504,4.457,4.514%20c0,2.971-1.486,4.457-4.457,4.457S33.042,15.3,33.042,12.329z'/%3e%3c/g%3e%3c/g%3e%3c/svg%3e)
This discussion relates to the paper presented by Susan Hanlon and Wendy Yeap at the IFoA sessional webinar on 18 September 2025.
Moderator (Dr C. N. Reynolds, F.I.A., C.Act): Welcome to part two of the webinar series on Graduating Mortality Base Tables, which is jointly produced by the IFOA mortality research steering committee and the CMI. I am Chris Reynolds, the chair of the CMI Assurances Committee and I will be chairing today’s session, which explores the principles behind graduating mortality base tables and trying to bridge the theoretical foundations and practical applications.
For part two, I am pleased to say we have two new speakers: Susan Hanlon and Wendy Yeap. Susan (Hanlon) is a pensions actuary in Mercer’s policy, professionalism and research team, where she leads on mortality and longevity research. She has almost twenty years of experience advising pension schemes and their sponsors on mortality issues. She is the current chair of the CMI’s Self-administered Pension Schemes Committee and a former member of the Mortality Projections Committee. Wendy (Yeap) is a Fellow of the Institute and Faculty of Actuaries and she also has nearly two decades of experience in the life insurance sector. She possesses extensive experience in assumption setting and experience analysis.
Wendy (Yeap) currently holds the position of head of risk pricing for retail protection at Legal and General. There, she leads the team in setting reporting assumptions and monitoring experience to support growth and risk management. In addition to her day-to-day work responsibilities, she contributes to the actuarial profession as a volunteer for the CMI assurances committee.
Mrs S. A. M. Hanlon, F.F.A., C.Act: Initially, I will set out an overview of what we were hoping to achieve over the course of these two webinars. Part one set out the theory of graduation, and now in part two we are going to look at how some of that works in practice. We will look at how you might choose the age range over which you will graduate and how you might choose your rating factors. We then look at how you choose a model by reviewing the fit of the graduated rates. Wendy (Yeap) will go on to talk about how you might extend tables beyond the graduated range and checks what you can do to make sure your tables are appropriate and behave sensibly. Finally, she will talk about when and how you should think about communicating with the end users of your tables during the process.
I did want to reiterate the message from part one that there is as much art as science when it comes to graduating mortality tables. Actuarial judgement is going to be required at many points in the process. This session is going to look at some examples of when in the process that might happen and how you might go about it. We are initially going to look at some points to think about in the data preparation and analysis stage, but we will then mostly focus on how to go about fitting models and how to decide between your fitted models.
Getting data preparation right will save a lot of time and effort further down the line. As the saying goes, “garbage in, garbage out.” The key points at each stage of the data preparation process are shown in Figure 1. Regarding the data submission process, if you are collecting data from one or more sources, particularly external sources, it is important to be clear about what data you need and whether you are expecting to receive it in a specific format. Different CMI committees take different approaches to this. The SAPS committee collects hundreds of submissions from individual pension schemes. We set out a very prescribed format in which we expect to receive data so that the process of collating and checking those individual submissions is as efficient as possible. However, the assurances and annuities committees are generally collecting data from a much smaller number of subscribers. They can take a more flexible approach and are more willing to accept data in whatever format the sources send it. They will then check and collate it appropriately. It is very important to document the data you have used and any limitations of it. This is crucial for people to be able to understand whether the tables that you eventually produce are suitable for their purposes. On the processing side, you will need to check the data to determine whether it is valid, complete and reasonable. Depending on the format in which you have received the data, you may also need to do some manipulation to get it into a consistent format. You will want to look at some initial results based on your data. So, look at calculating exposures and death claims for individual lives. It can be helpful to produce a data summary for each submission. This helps to identify any errors in the submission. If you share these with the original submitter, they can confirm that the data you think you have received is in fact the data that they were intending to send you. Comparing data from different sources can help spot any problems with specific submissions. Looking at aggregate results and crude rates for your whole data set and for subsets of your data can also help to detect problems at this stage.
Data preparation.

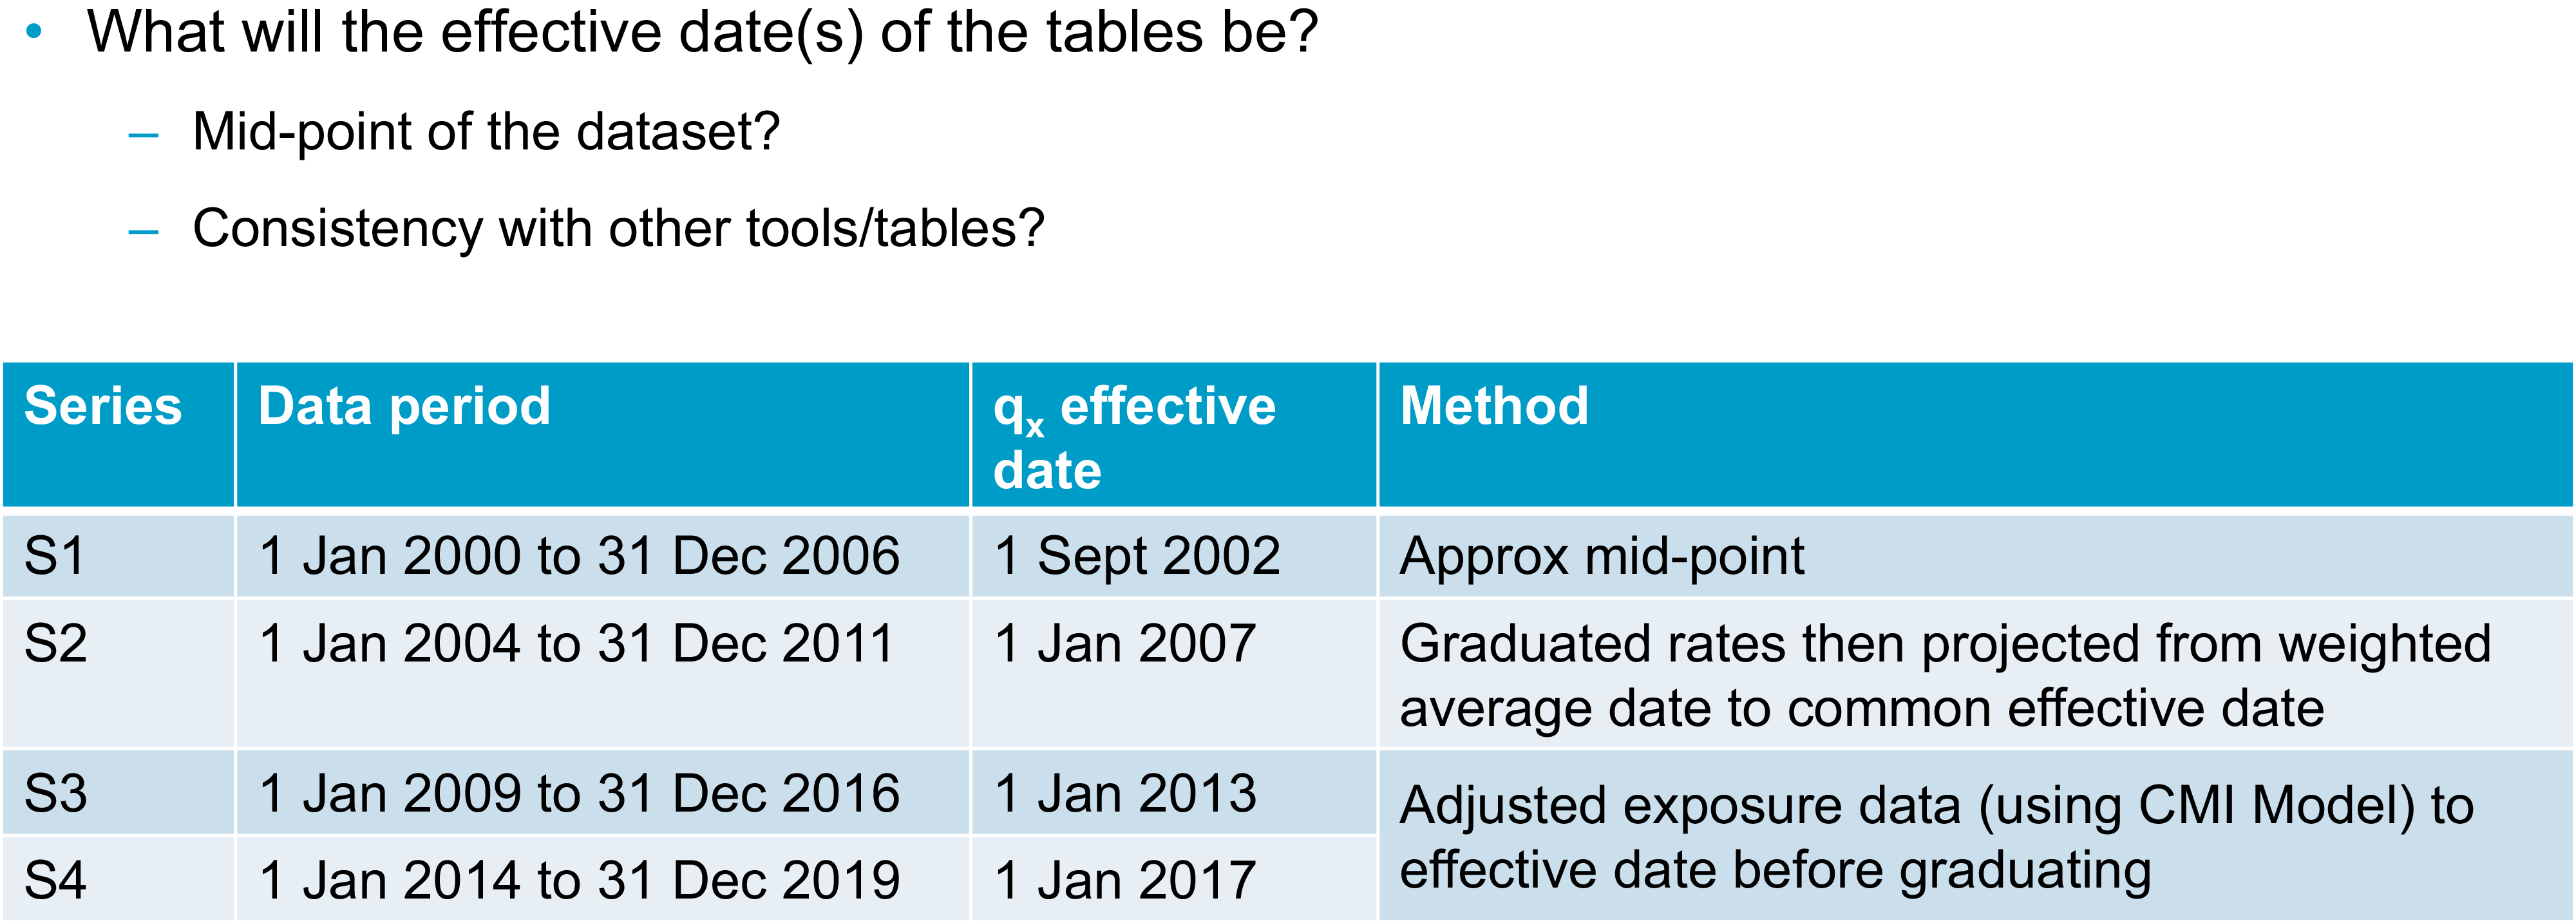
Once you have a data set with which you are reasonably happy, you will need to consider whether there are any adjustments you want to make to the data before you start to graduate it. This could include adjusting the data to a common effective date. Taking a step back though, at some point in the process you will need to decide on the effective date or dates of your tables. We know that mortality rates change over time. For your tables to be most useful, you will need to be clear with your users as to when your tables apply. A common approach to setting an effective date is to take the midpoint of your data set. This minimises the maximum distance between any of your data points and the effective date. You can do this by taking a simple midpoint or you could consider some sort of weighted average approach if your data is not evenly distributed throughout your period of collection. The table in
Figure 2 sets out various approaches the SAPS committee has taken over the years. I should emphasise that all of these approaches are valid and you might take one or more of them, depending on your data set and the purpose for which you are graduating tables. The table in Figure 2 shows the period of the data set for each series of tables, as well as the effective date that was selected and the method used to select it. For the S1 tables, we simply used the approximate midpoint of the data set. For S2, we graduated the data and then projected the graduated rates from their weighted average date to a common effective date. For S3 and S4, we instead adjusted the exposure data in line with mortality improvements over the data period from the CMI’s mortality projections model to get the data to a consistent effective date, and then we graduated the rates. It is worth noting here that I have talked about the midpoint of your data set, but, obviously, different subsets of your data might have different midpoints. You will also need to decide whether to reflect that by having different effective dates for different tables or whether you want to choose a common effective date for all tables. The CMI’s approach is generally to have a single effective date for each series of tables because then it is much easier for users to be clear on what date that is and to make sure they are using the tables correctly.
Choosing the effective date.

As well as thinking about your effective date, you will also need to consider the age range over which you are going to graduate and whether you are going to use the same age range for all your tables. If your data allows, it is usually sensible to start with similar age ranges, but you might find that some tables will need to be graduated over a different range. For example, you might not have enough data at some ages. When graduating some of the S4 female dependents tables for SAPS we originally tried graduating from ages 45 to 95, but there was so little data in this group at the younger ages that the results were unreliable. Instead, we ended up graduating from 60 to 95. We are going to mainly use CMI examples today because that is where our experience in graduating tables comes from. However, the sorts of approaches used should be more widely applicable.
You might also be aware that there are issues in your data outside a particular age range or outside a particular time period. For example, there are known issues with some UK population data if you go too far back in time due to issues with how the data was recorded at that time.
I am going to look more closely at a specific example where data may not be sufficiently homogeneous at particular ages. This is a SAPS example. The charts in Figure 3 show exposure in death data for male pensioners in the SAPS data set and the crude mortality rates that were calculated from them. The coloured sections on the exposure chart highlight some areas of concern. At ages 50 to 55, shown by the red dots, there is an issue as we know that it is generally not possible under UK legislation to retire in normal health before age 55. So, we expect that this exposure mostly relates to people who have retired in ill health. Moving on to the orange section, the group of people retiring between ages 55 and 60 are likely to be a mixture of ill-health retirements or people in normal health taking early retirement. Between ages 60 and 68, however, we would expect to see predominantly normal health retirements due to the typical retirement ages for UK pension schemes. In particular, we see that we have much higher data volumes from age 65 onwards. We can see that the death data appears to have a reasonably sensible pattern by age. It is generally increasing as age increases until it starts tailing off at the highest ages. Looking at the crude mortality rates, however, we can see that below age 60, they are not behaving as we would expect them to. Wendy (Yeap) will talk in more detail later about thinking through your prior expectations about rates. As a simple example, we can see here that mortality does not appear to be increasing with age. In fact, the crude rates are somewhat flat in the section under age 60 but with some ups and downs. Given what we know about the underlying data, and it being a mixture of people retiring in different health statuses, we can be sure that this is being driven by the data not being homogeneous at these ages. When we graduated these tables, we chose to graduate using data from age 60 onwards because that was when we could be sure that the data was more likely to be homogeneous. We could see that the crude mortality rates were behaving as we would expect.
Choice of age range: exposure, deaths and mortality rate.

Your age range will also depend though on what type of data you are working with. Figure 3 was based on pensioner data and the chart in Figure 4 is based on assurances data. In this case, we are looking at critical illness claims for male non-smokers. We can see that there is very limited data below age 25 and above age 65, which is a very different age range to that shown in Figure 3. We can see again that claims, which are the grey bars in Figure 4, tend to be weighted towards older ages. We want to graduate this data in a range where we have both sufficient exposure and sufficient claims data. In this case, the table was ultimately graduated between ages 27 and 65.
Choice of age range: exposure versus claims.

Moving on from age ranges, you will need to choose which rating factors you are going to use to sub-divide your data and some of the considerations around that are set out in Figure 5, which was also discussed in part one. From a practical perspective, you might have some prior expectations about how you plan to divide your data set. For example, you are almost certainly going to want to divide by sex. There are some other considerations when you decide which other factors are important for your data set. These will include the expectations of the users and the purpose of the tables. From the numerical perspective however, you can use, for example, generalised linear models to help you assess the relative importance of different factors in your data set. You can also do some simple crude analysis and an example of this is shown in Figure 6.
Choice of rating factors I.

Choice of rating factors II.

This chart in Figure 6 shows the calculated actual deaths over expected deaths for subsets of the SAPS data set compared to a previously graduated SAPS table. The data here were grouped using pension amount band as one rating factor, which is shown in thousands of pounds. The first dots on the chart are for the £400 to £3,000 amount band. The other rating factor being considered is the Index of Multiple Deprivation (IMD), which runs here from the most deprived decile (one) to the least deprived (ten). We can see clear patterns in Figure 6 by both IMD and pension amount. Mortality generally decreases as you move across the chart to the right, as pension amounts increase, or as you move down through the chart through decreasing levels of deprivation. The fact that we are seeing patterns by both these factors suggests that they are both useful rating factors for this data set. We can also see that there is still a pattern when we consider the combination of both rating factors. We might want to consider a combination of these ratings factors as another way of sub-dividing our data set.
Once you have your data set compiled and chosen your age range and rating factors, you will need to choose the model that you are going to fit to the data. As was mentioned in part one, the CMI tends to use simple Gompertz or Gompertz-Makeham models because these tend to fit our data well while meeting the other objectives that were discussed in part one. I am shortly going to look at an example of how we might determine exactly which model gives the best fit. First, I am going to talk about a possible alternative method of graduating multiple subsets of data at the same time to get a coherent group of tables.
This approach is known as co-graduation. Instead of graduating subsets of the data independently and checking that the results are consistent, which Wendy (Yeap) will talk about later, with a co-graduation approach you graduate a higher-order model and all tables are co-graduated using your total dataset. This higher-order model should pick out all the features that need to be modelled across the dataset. You then apply lower-order adjustments to get a suitable fit to each subset of the data. For the example shown in Figure 7, the Co(4,3) example graduates the top-level table (the PMA table) using a cubic formula. It then makes order 3 quadratic adjustments to the graduated PMA table to give the other sub-groups, which are associated with heavy, middle, and light tables. Although this approach should ensure sensible results for fitting multiple tables simultaneously, the CMI’s approach is only to use co-graduation when the fit is improved sufficiently to justify the use of the more complex approach. What this means in practice is that when we have considered this for the SAPS data sets, it generally has not been worth the additional complexity. We have a sufficiently good fit by graduating subsets of the data individually. There may, however, be other data sets where it is a more useful approach and where you do get a better fit using the more complex method.
Alternative approach – co-graduation.

I will now discuss how we might consider which model best fits a particular data set. Piero (Cocevar) introduced the GoLD chart in part one as a helpful way of visually comparing the fits of different formulae to your data set. The GoLD chart, though, is only one way of comparing the fit of different models or looking for problems of fit with any particular model. Figure 8 shows a selection of other charts that can be considered to spot any anomalies or problems with fit. We would usually consider these charts for each individual run to rule them in and out of consideration, potentially before then going back to the GoLD chart with multiple runs plotted to compare them against each other.
Model selection – example 1.

I will now run through the charts in Figure 8. Comparing the crude and fitted rates on different scales can give a quick indication of whether there are any immediate problems with the fit, with the GoLD chart then providing a more detailed inspection of the fit. We can visually inspect the deviance residuals for any bias or unexpected patterns. Similarly, we can check that our patterns of deaths and exposures are as we would expect and that there are not any obvious issues there. Visual checks can only take you so far though, so we also consider various statistical tests.
Figure 9 shows the output of our graduation software and highlights a selection of results to show how we might choose between models. We can see here that the GM(1,3) model gives a better statistical fit since the right-hand column of green numbers is lower than the left-hand column of green numbers. However, the results are very similar. In this case, the decision was taken to use the simpler G4 approach because it gave a sufficiently good fit, even if it was not the best possible fit. This goes back to some of the points that were made in part one. You are generally looking for the simplest fit that will give you a good fit without being too simple.
Model selection – example 2.

The numbers in Figure 9 based on various information criteria checks. It is hard to see with the text size in the Figure but there are also results for other helpful statistical tests, including the signs and runs tests. It is also possible to make a numerical inspection of the deviance residuals that we saw charted on the previous slide. Now that we have picked a model and have the graduation rates for our selected age range, Wendy (Yeap) will talk about what happens next.
Miss W. M. P. Yeap, F.I.A.: We have got to a point where we have a set of graduated rates over the age range that we have selected. However, it is quite likely due to low data volumes that we will need rates for ages outside of the graduated age range. I am going to talk about some examples from SAPS and assurances where we have extrapolated rates at younger and older ages. I would add that this is an area where potentially high levels of expert judgement are involved. We need to use our expert knowledge because the data at young and old ages can be sparse. We have sought some pragmatic ways to extrapolate rates. We are not saying what we are proposing is the only viable approach. There will be other approaches that will be equally valid. We also need to think about balancing the materiality and complexity of how we extrapolate. For example, at younger ages, the financial impact tends to be less material, so potentially a less complex broad-brush approach could be used, as long as it looks sensible. Older ages will tend to have more material impact, especially on SAPS. We may then need more established methodologies such as the methodology prescribed by the high-age mortality working group to estimate the exposure for the very high ages.
I will now discuss our first example. In Figure 10 we are looking at a SAPS table and looking to extend to younger ages. As Susan (Hanlon) mentioned earlier, SAPS tables are generally graduated between ages 60 and 95, but users will need rates at much younger ages. Here, it has been extrapolated to age twenty. The parent and child concept has been used here. For SAPS tables there can be quite a few subsets, as you can see from the family tree at the bottom of Figure 10. Each subset has its own graduated rates that are derived independently.
Young age extension – parent/child tables, SAPS.

However, to keep them all smooth and sensible and avoid any unwanted crossovers between the different subsets and tables, there is some blending of rates at these younger ages. We will take an example which we can see on the chart on the right-hand side of Figure 10. The parent table is taken as the female amounts-based graduated rates. This is the line in blue. The gold line is the child table, which is a subset of the female table. Here, it is the high-mortality subset. We have set the rates in child and parent tables to be equal at age twenty, then a formula has been used to gradually smooth the parent rates into the child rates as the age increases. This is to ensure you can get a smooth line from the start of the graduation age range, which is 60 for SAPS tables. Then, we can use the relevant graduated rates going forward. Due to time restrictions in this talk, we will not discuss the smoothing formulae here, but you can source them from the relevant working papers.
We have talked about young age extension. We will now move onto old age extension. Remember, the graduated rates for SAPS are generally between 60 and 95, but as users we probably need much older rates than that, and usually rates have been provided up to age 120. When considering how to extrapolate these rates to older ages, first we need to look at whether we can use the population as a “parent” table. To facilitate this, the experience for different subsets at these older ages has been investigated and this is shown in the chart in Figure 11. It shows the ratio of actual experience divided by expected experience for various sub-groups, split by pension amounts.
Old age extension – population table as “parent.”

You can see at the very high ages on the right-hand side of the chart the mortality rates for different sub-groups tend to converge. This demonstrates that even for pensioners with very different pension amounts in each of the subsets, we can expect mortality rates to converge at the highest ages, which is an argument for using the general population table as a parent table to extrapolate to the very old ages. We do not have readily available rates for the general population. A separate graduation was conducted on the population data with exposures being estimated using the Kannisto-Thatcher method, which is also used by the ONS to estimate the exposures. Once we have the graduated general population table, it can be used as a parent table when we do the older age extension.
The next example looks at another different subset of SAPS tables. We are looking at extending the rates at younger ages for people who retired in ill health. This would be a smaller element of the whole, so a broad-brush approach has been used. As you can see in Figure 12, the red line for the rates of ill-health pensioners is set to be at the same level from age 20 to the lowest graduated age range. We would expect anyone with ill health to have higher mortality rates than the general set of pensioners, who are represented by the other lines on the chart. Also, there are very low data volumes at these younger ages and pension amounts are not expected to be high. Thus, we do not expect there to be a material impact and hence a broad-brush approach has been used rather than a complex method. I know that earlier we talked about SAPS using the parent-child approach to extend rates to younger ages. However, this was not used here because ill-health pensioners have worse mortality than the general population.
Young age extension – broad-brush approach, SAPS.

We are going to move onto an example for assurances. Here, we have similar issues to the ones we had previously. We want to have rates that extend to much younger ages than the age range that we have graduated. The initial approach taken was to extend the rates using the graduation formula that has been chosen for these sets. But we found that this approach was not suitable. As you can see on the chart in Figure 13, the dotted lines for male rates increase as we get to younger ages. Thus, we dismissed that approach. An alternative method was used whereby we use factors to reduce the rates from specific ages and ensure that they are smooth. As this is an assurance book, we have smoker and non-smoker rates. We also need to make sure that these remain sensible. That is, the smoker rates should be higher or equal to the non-smoker rates. This is an area where high-level judgement was used. We set factors for individual ages to ensure they converge to 100% of smoker and non-smoker ratios and avoid any crossovers. This is generally done by eye, using the rate of decline between successive ages within our graduated rates.
Young age extension – assurances.

Now we move on to how we extrapolate for old age. Currently, the assurances table gives ages up to age 90, but generally we may not have enough data. You can see from the chart in Figure 14, for non-smokers, the graduated rates increase rather sharply after age 85, as shown by the dotted darker blue line. First, we looked at the high-age approach from the high-age mortality working party. We found that the method works quite well for non-smokers. So, that approach has been taken for non-smokers. However, for smokers, it did not produce smooth rates. Instead, we used an alternative approach based on population mortality. We targeted a mortality rate, at age 100, and then used recursive “goal-seek” to calculate smooth rates.
Older age extension – assurances.

We have discussed some examples of how the CMI has extrapolated our rates for younger and older ages. Given this, we now have rates for all the ages that we need. Before we finish, we need to look for anomalies and review our tables to make sure that they behave sensibly. It is important that we stand back and think about how we expect the rates to behave. We should also consider the expected relationships between our rating factors and our tables and ensure that overall they are consistent. This will ensure that when we have the final graduated rates, the whole set will remain sensible. There are some very important expectations about rates. Examples of these are that mortality should get worse as people get older and smoker rates of mortality should be higher than non-smoker rates. There are other areas where we need to think about what is appropriate, for example, considering whether your lives-weighted rates should be higher than your equivalent amounts-weighted rates. This is not an exhaustive list. There will be other expectations depending on the data that you are graduating. You will have your own list of expectations to which you can refer when you check the tables.
Now we go onto reviewing anomalies post-graduation. We have our expectations of how the tables will behave and we need to check whether there are any anomalies that could invalidate them. If there are, we will need to investigate further. For example, we will have some potential problems because of sparse data at the younger/older ages. We might have some crossovers and we may need to consider a change in approach, for example in age range.
I will give two examples of the treatment of anomalies. First, where we find an anomaly within the data and we have made some amendments to our approach to overcome the anomaly. Second, where the underlying data shows a feature that we want to preserve, although the graduation formula has suggested that we should smooth it out.
I will discuss our first example now. We have an expectation that smokers should have a higher mortality than non-smokers. The red line on the chart in Figure 15 is the ratio of smokers divided by non-smokers. We would expect it to be over 100%, or very close to it. However, you can see on the left-hand side that at the very young ages, before age 33, there are some ratios where it is under 100%, which is not sensible. To overcome this anomaly, we decided that we could set the smoker rates to be the same as those for non-smokers. The background is that this is a critical illness book. Most of the claims here are due to cancer. At these very young ages, we think it is reasonable that smoker status would not have a material impact on the claim rate. Thus, it is not unreasonable to set the smoker and non-smoker rates as being the same. At the older ages after age 60, you can see the red line has a little flick upwards. However, we noted that flick is based on very little data. We concluded that the smoker ratio from age 60 should also apply to ages after 60.
Allowing for anomalies by smoker status.

The second example is one where we want to preserve an underlying feature. Here, we are graduating female critical illness rates. You can see in the charts in Figure 16 that for both smokers and non-smokers there is a hump around age 50 followed by a dip around age 55. This was investigated and we believe this feature is due to the breast cancer screening programme. The hump coincides with screening starting aged 50 and the dip is due to the acceleration of diagnosis through screening. Theoretically, the curve is a poor fit, but we know that there is a strong underlying reason for the feature and that it will very likely continue in the future. Thus, we have reflected the feature in the female critical illness rates. We have deviated slightly and taken another approach for the effective age ranges. We have looked at the combined smoker and non-smoker data set because this increases credibility, especially for the smoker data set, as it has lower volumes. We repeated the graduation process again and found that the B-spline fits the crude rates quite well and G(4) provides smooth rates. We adjusted the rates at the affected ages of 41 to 56 by multiplying the ratio of the B-spline to G(4), then applying it to the original graduation formula, which is G(3). You can see that G(3) is the gold line on the chart. You can see on the chart that the blue and gold lines overlap before age 40 and after age 57 and the different approach that was applied for ages 41 to 56 fits the crude rates rather well.
Allowing for anomalies in female critical illness assurance.

Now, we are going to talk about communication. We will be mainly discussing matters from the viewpoint of the CMI. But whoever your stakeholders are, communication is key between the creators and the users of the graduated tables so that everyone is aware of the judgements made and any limitations of the final tables. All communications should start very early on, not just when the tables are finished.
In the data preparation section, it is important that there is good engagement between data contributors and the people doing the graduation so that the data used can be validated and there is a strong mutual understanding of the data that has been used, especially if there might be slightly different definitions of the key fields. This should ensure that the results are not misinterpreted. Another useful thing to do is to review the experience analyses over time. This will show if anything material has changed.
Once we have done our data validation, we then go onto the choice of models and model fitting. As Susan (Hanlon) said, documentation is key to ensure that all the steps are taken and that all steps are clear and easy to follow. In addition, any areas of subjective judgement then get communicated and discussed with users. This would cover how the models have been chosen and fitted and any justification for the rating factors used and the assumptions made. This would particularly apply to different approaches to extend rates to younger and older ages and to any specific features, for example the breast cancer screening impact. Finally, when we are ready to publish the final output, documentation should be clear as to what types of rates are set out and also if there have been any changes since the consultation. It is definitely very important to have clear guidance for using tables. The end users should be equipped with all the relevant information, for example the effective date of the table, the age definitions, how to read the tables when you have select years, any judgements made and any limitations. And with that point we have now gone through the whole process of creating a set of graduated tables.
Moderator (starting the Q&A session): What tools and processes do you use for data cleaning? Do you ever exclude outliers? Regarding the heterogeneous data between ages 50 to 60, how do you resolve this? Do you do more curve-smoothing here?
Mrs Hanlon: I will take those questions in order. From the CMI perspective, we are very lucky that we have secretariat support provided by Barnet Waddingham. They do a lot of the data cleaning for us as committee members. My understanding is that they have a mixture of Excel-based tools and home-written software that processes the data, checks for outliers and other issues, and manipulates the data into a consistent format. There is not a series of third-party external tools I can refer you to. I think the tools they use are all developed internally.
In terms of excluding outliers, that is one of the areas in which the actuarial judgement that we have referred to on a few occasions comes in. I know that we occasionally exclude entire data submissions. There are several possible reasons for this. The data may not be of sufficient quality or may be sufficiently inconsistent with existing data to suggest that there are issues, or it may not be the sort of data that we are expecting. In terms of excluding individual outliers, you need to be careful to make sure that you are not inadvertently biasing your data and that the outliers you are excluding are not some new phenomena that you should be reflecting in your data. The answer to that question is probably that whether we exclude outliers or not depends on the circumstances. Finally, on the heterogeneous data between age 50 and 60, in that particular case we did not do more curve-smoothing. We effectively just excluded that data from the graduation. We graduated the age range starting at 60. Then we used one of the younger age extrapolation methods that Wendy (Yeap) talked about to extend those rates down to the younger ages.
Questioner: Given that central exposure is used, I guess the graduated rates are central rates. Does the CMI publish the central rate as is or is it converted to initial rates?
Miss Yeap: Here, documentation will need to be clear. For example, there are both qx and mx symbols in the assurances table sixteen series. For SAPS tables, some choice of qx gets published. As end users, it is important that you are clear what is being picked up and that you read through the notes to understand what the rates represent.
Questioner: I did not understand the meaning of the IMA and NMA parent tables referred to in the mortality tables tree diagram.
Mrs Hanlon: Apologies for that. That is a very CMI SAPS-specific nomenclature that we probably should have explained. The PMA tables, which were one of the top tables in that tree, are the pensioner tables. They include pensioners who retire with any health status. Sub-groups of those are the IMA, the ill health tables, or the NMA, normal health tables. These are where we divide the pensioner data set, where we have the data, into people who retired in ill health or people who retired in normal health.
Questioner: Regarding older age extension, the graduation is for ages 60 to 80. I imagine the extrapolation is then only from age 80 and above.
Mrs Hanlon: Generally, we would expect the extrapolation to start at the upper end of the graduated age range. However, there may be circumstances in which we decide to extrapolate from a slightly earlier age. As Wendy (Yeap) mentioned in the discussion of the SAPS approach, we graduate a population table at older ages and that often uses a different graduation formula to the graduation formula that we have used for the age ranges based on the SAPS data. One of the things we need to check is whether extrapolating to the population table from that highest graduated age gives us something sensible. In many cases, it does. Occasionally, we find that it gives a slightly odd shape before, during and after the join. In which case, we might decide that, despite having graduated from ages 60 to 80 or 60 to 95, we might want to start the extrapolation to the parent population table at an earlier age.
Questioner: Do you apply inflation adjustments to your pension amounts or sums insured?
Miss Yeap: We have to be clear when we collect the data what the sums assured that are supplied represent. This allows us to decide whether or not we need to adjust the sums assured accordingly, so that the analysis is at an appropriate time period and we can consider all the results consistently.
Mrs Hanlon: We do apply inflation adjustments to pension amounts. For the data we receive, as Wendy (Yeap) said, we need to obtain clear guidance from submitters about what we are getting. We generally get a pension amount either at the beginning or at the end of the time period for an individual life. We then adjust it to the date at which we want the data to lie. We know that this is a very broad-brush adjustment. We do not know what pension increases, or combination of pension increases, these individual pensioners will be getting, but we do make some adjustment and the details of that are documented when we publish the tables.
Question: I missed the under ages extrapolation piece. Is the mortality hump for young men, i.e. 17 to 22, still as significant as it used to be?
Mrs Hanlon: There is still a mortality hump in population data around those ages. In general, when compiling CMI tables, we do not worry too much about it. Much of the time, we are not graduating our data down to those ages. We are extending in line with some approach and generally, our extensions do not include the mortality hump. We will tend to have smooth extensions down to age 20. There is a feature of the SAPS approach where we graduate smooth rates, or extrapolate smooth rates, down to age 20, but the SAPS table starts at 16 rather than 20 because our users have asked for that. What we do for ages 16 to 20 is to use crude population rates. So, that essentially picks up that mortality hump if it appears in the population data. In fact, that hump is exactly why we do not try to do any smoothing or graduation at the youngest ages and just use the crude rates instead, so we can reflect that feature. Coming back to one of the points Wendy (Yeap) made earlier, we would not expect it to have a financially significant impact when people are using our tables at those ages.
Moderator: Our time is up, so it remains for me to thank our speakers today, Wendy (Yeap) and Susan (Hanlon), and of course, you, the delegates, for joining today’s session.



 Open access

