





Highlights
-
No significant TRE × HIIT interaction was detected across cardiometabolic outcomes.
-
TRE reduced body weight, fat mass, and visceral fat, but also lowered muscle mass.
-
TRE modestly lowered HDL-C, whereas the LDL-C increase was not robust.
-
HIIT improved HbA1c, adiposity, and selected lipid markers in per-protocol analyses.
-
Larger, adequately powered trials are needed to confirm these findings.
According to the WHO, 43 % of adults worldwide were overweight, and 16 % had obesity in 2022(1), and both are strongly associated with cardiometabolic disorders. The primary cause of overweight and obesity is an imbalance between energy intake and expenditure, often driven by overnutrition and physical inactivity. Therefore, lifestyle interventions targeting diet and physical activity remain the foundation of treatment(Reference Lichtenstein, Khera and Anderson2). However, conventional energy-restricted diets are limited by poor long-term adherence and the difficulty of accurately quantifying intake, and sustained participation in structured exercise is similarly challenging in free-living settings, with reported dropout rates of up to 60 % by 4 months(Reference Emerenziani, Gallotta and Migliaccio3). These limitations have motivated growing interest in simpler, more feasible lifestyle strategies that may enhance adherence while still improving metabolic health.
Time-restricted eating (TRE), a form of intermittent fasting that restricts daily food intake to a 4–12 h window, has emerged as a promising intervention for overweight and obesity(Reference Ezpeleta, Cienfuegos and Lin4). Because TRE does not require explicit calorie counting during the eating window, it offers a simpler alternative to conventional caloric restriction. Current evidence suggests that TRE is well tolerated, associated with high adherence and minimal adverse effects, and improves cardiometabolic outcomes in adults with overweight or obesity(Reference Ezpeleta, Cienfuegos and Lin4). In parallel, given that lack of time is among the most commonly cited barriers to meeting physical activity recommendations(Reference Sharifi, Mahdavi and Ebrahimi-Mameghani5), high-intensity interval training (HIIT) has emerged as a time-efficient alternative to traditional continuous exercise. HIIT consists of repeated bouts of high-intensity activity interspersed with rest or low-intensity recovery periods. Growing evidence indicates that HIIT improves cardiovascular and metabolic function in adults with overweight or obesity, with effects comparable to or exceeding those of traditional exercise(Reference Cheng, Song and Shu6,Reference Hosseini Moshkenani, Abedi and Shabkhiz7) . Combining TRE with HIIT is conceptually attractive: both interventions are time-efficient, and they target partly different physiological mechanisms. TRE may align food intake more closely with circadian rhythms in glucose and substrate metabolism and extends the daily fasting period, which can increase fat oxidation and metabolic flexibility(Reference Sutton, Beyl and Early8,Reference Ravussin, Beyl and Poggiogalle9) . HIIT, in contrast, provides a potent stimulus for skeletal muscle mitochondrial biogenesis, glucose transport capacity and insulin sensitivity, and cardiorespiratory fitness(Reference Little, Safdar and Wilkin10,Reference Helgerud, Høydal and Wang11) . Because these pathways are partly distinct but potentially complementary, additive or synergistic benefits when the two interventions are combined appear biologically plausible(Reference Haganes, Silva and Eyjólfsdóttir12). However, direct evidence on their combined effects remains scarce. Most randomised controlled trials (RCT) combining TRE with exercise have evaluated conventional aerobic or resistance training (RT) rather than HIIT and have frequently involved healthy, physically active participants with normal body weight and favourable metabolic characteristics, in whom the cardiometabolic benefits of either intervention may be smaller(Reference Dai, Wan and Miyashita13). A recent systematic review identified 19 RCT of TRE combined with exercise in adults, but none formally tested the TRE × HIIT interaction in women with overweight or obesity using a 2 × 2 factorial design(Reference Dai, Wan and Miyashita13).
To address this gap, we conducted a prespecified secondary analysis of a 2 × 2 factorial RCT to evaluate the independent and combined effects of TRE and HIIT on anthropometric, lipid and glycaemic outcomes in women with overweight or obesity. The factorial design allows the main effects of TRE and HIIT to be estimated efficiently within a single randomised sample while also permitting formal assessment of their interaction(Reference Montgomery, Peters and Little14). We hypothesised that TRE and HIIT would act synergistically, yielding greater cardiometabolic benefit than expected from their individual effects.
Experimental methods
Study design and setting
This prespecified secondary analysis used data from a single-centre, four-arm, parallel-group RCT conducted at the Department of Circulation and Medical Imaging, Norwegian University of Science and Technology, Trondheim, Norway. In the original trial, participants were randomised 1:1:1:1 to control, TRE, HIIT or combined TRE + HIIT using a computer-generated sequence, without blinding of participants or investigators, and followed for 7 weeks(Reference Haganes, Silva and Eyjólfsdóttir12). In the present analysis, the four trial arms were re-organised within a 2 × 2 factorial framework, with TRE (no/yes) and HIIT (no/yes) as the two binary factors, enabling estimation of their independent main effects and their statistical interaction.
Participants
Between 12 August 2019 and 15 January 2021, women were recruited through public advertisements on university webpages and social media and were screened for eligibility by telephone after expressing interest in participation. Eligible participants were women aged 18–45 years with a BMI ≥ 27 kg/m2 and the ability to walk on a treadmill or ride a bicycle for at least 60 min. Exclusion criteria included pregnancy, breastfeeding within 24 weeks before study commencement, CVD, type 1 or type 2 diabetes, use of antihypertensive, glucose-lowering or lipid-lowering medication, a habitual eating window of ≤12 h/day, HIIT participation ≥1 time/week, body mass variation ≥4 kg during the previous 3 months and night-shift work. Sample size was based on a prior HIIT study, with recruitment of at least 120 participants planned to retain 24 per group after accounting for dropout, incomplete blood sampling and COVID-19-related attrition. In total, 131 participants were included: control, n 33; TRE, n 33; HIIT, n 33; and TRE + HIIT, n 32. The flow of participants through the present 2 × 2 factorial secondary analysis is shown in Figure S1.
Study procedures
The trial included two separate baseline assessment days, followed by one baseline week, 7 weeks of intervention and two separate post-intervention assessment days. Laboratory assessments were identical before and after the intervention. One test day comprised fasting blood sampling, a 2-hour 75-g oral glucose tolerance test, measurement of vital signs and body composition, and completion of the International Physical Activity Questionnaire. The second test day consisted of a cardiorespiratory fitness test. Assessments were scheduled during the follicular phase in women with regular menstrual cycles when feasible, and participants were instructed to avoid vigorous physical activity for at least 48 h before testing. After randomisation, participants completed one baseline week while maintaining their habitual diet and physical activity before initiating the assigned intervention on day 8. Participants were also asked not to initiate any other dietary or exercise regimens during the intervention period. Post-intervention assessments were conducted 48–72 h after the final exercise session in the HIIT and TRE + HIIT groups, whereas TRE was maintained until the evening before the follow-up assessments.
Intervention
Participants allocated to TRE were instructed to restrict all energy intake to a self-selected eating window of no more than 10 h/day and every day and were advised to consume their final meal no later than 20:00 h. No advice was given on macronutrient composition or total energy intake. Non-energy-containing beverages, including coffee, tea and zero-calorie soft drinks, were permitted during the fasting period.
Participants allocated to HIIT completed three supervised exercise sessions per week. Two weekly sessions consisted of 4 × 4-minute intervals at 90 %–95 % of maximal heart rate (HRmax), separated by 3 min of moderate-intensity recovery, and the third session consisted of 10 × 1-minute intervals at ≥90 % HRmax, separated by 1 min of low-intensity recovery. All sessions included a 10-minute warm-up at 60 %–70 % HRmax and a 3-minute cool-down, corresponding to a total planned exercise time of 108 min/week. Exercise intensity was monitored with heart rate monitors, and treadmill speed and incline were adjusted during the study to maintain the prescribed intensity. Two participants unable to complete treadmill walking or running performed the sessions on a stationary bicycle. Participants in the TRE + HIIT group followed both protocols, whereas those in the control group received no intervention and were asked to maintain their habitual diet and physical activity throughout the study. All participants received weekly contact by phone or e-mail for motivational support.
Outcome measurements
The outcomes of interest were anthropometric, lipid and glycaemic outcomes, assessed at baseline and post-intervention using standardised procedures. Height was measured with a standard stadiometer, and body weight and composition were assessed by bioelectrical impedance analysis during morning visits after a ≥ 10-h fast. Fasting venous blood samples were collected for biochemical analyses of lipid and glycaemic markers, and participants completed a 2-hour 75-g oral glucose tolerance test, from which indices such as insulinogenic index, Matsuda index and insulin disposition index were derived. In addition, physical activity, energy expenditure and dietary intake were assessed to aid the interpretation of cardiometabolic changes. Physical activity and energy expenditure were measured by questionnaire, and dietary data were used to estimate total energy intake and macronutrient composition.
Assessment of compliance
Adherence to TRE was assessed from self-reported compliance with the prescribed ≤10-h daily eating window under an ad libitum, non-calorie-restricted protocol. For HIIT, adherence was defined as completion of the 21 scheduled sessions, and exercise compliance was quantified by heart rate responses during the final portion of each interval. In the original trial, adherence was high for both interventions: TRE was followed on approximately 6 days per week (86 % of days), and attendance and completion of the prescribed HIIT sessions were similarly high(Reference Haganes, Silva and Eyjólfsdóttir12). Intervention-related behavioural changes are reported in Tables S6–S7. HIIT increased physical activity and energy expenditure, whereas TRE reduced total energy intake without materially changing macronutrient composition, consistent with adherence to the prescribed intervention.
Statistical analysis
Baseline characteristics after multiple imputation were presented as n (%), mean ± sd or median (interquartile range), as appropriate. Missing data were handled in RStudio using multiple imputation by chained equations with the mice package, generating ten imputed datasets. Under this approach, incomplete variables were imputed iteratively using information from the other variables included in the imputation model. Convergence was assessed visually using trace plots, which showed stable trajectories and adequate mixing across iterations, indicating acceptable convergence of the imputation procedure (Figure S2). The percentage of missing data is reported in Table S1.
Anthropometric, lipid and glycaemic outcomes were classified as primary outcome domains, whereas physical activity, energy expenditure and dietary intake were classified as secondary outcomes used to support interpretation of the primary findings. The primary analysis followed the intention-to-treat (ITT) principle after multiple imputation, with the main effects of TRE and HIIT and their interaction specified a priori as the effects of interest. Intervention effects were evaluated according to the intention-to-treat principle using linear mixed-effects models fitted with the lmerTest package separately in each imputed dataset and pooled using Rubin’s rules. For each outcome, the model included fixed effects for time point (baseline and post-intervention), TRE (no/yes), HIIT (no/yes) and all interaction terms, including the time point × TRE × HIIT interaction. Age group was included as an adjustment variable, and participant was included as a random intercept to account for repeated measurements within individuals.
Estimated marginal means and model-based contrasts were obtained using the emmeans package, with within-group changes over time and differences in change (DiC) reported alongside 95 % CI. The main effect of each intervention was defined as the DiC between the two levels of each factor (TRE: yes v. no; HIIT: yes v. no). The factorial intervention effect was assessed using the time point × TRE × HIIT interaction term, testing whether the combined effect of TRE and HIIT differed from that expected from their individual effects. Interaction p-values were adjusted for multiple testing within each outcome domain using the stepwise Holm–Bonferroni method, which controls the family-wise error rate while remaining less conservative than the standard Bonferroni correction. This domain-wise approach reflects the physiological correlation among outcomes within each domain. Because main-effect p-values were not adjusted for multiplicity, findings were interpreted primarily by effect sizes and 95 % CI rather than statistical significance alone; isolated associations near the null were treated with caution. Per-protocol sensitivity analyses used the same modelling strategy after excluding dropouts and were reported alongside the ITT results. These analyses were considered exploratory because of their greater susceptibility to selection and attrition bias.
The original trial was powered to detect between-group differences across four parallel arms, not specifically to test a 2 × 2 factorial interaction(Reference Haganes, Silva and Eyjólfsdóttir12). Therefore, our interaction analyses were prespecified as exploratory and interpreted as hypothesis-generating rather than confirmatory, given the available sample size and statistical power.
All analyses were performed in RStudio (Version 2026.04.0-daily+381). All tests were two-sided, and p < 0·05 was considered significant.
Ethical approval
All participants provided written informed consent before enrolment. The original trial was conducted in accordance with the Declaration of Helsinki and was approved by the Regional Committee for Medical and Health Research Ethics in North Norway (REK no. 2019/851). The trial was registered at ClinicalTrials.gov (NCT04019860)(Reference Haganes, Silva and Eyjólfsdóttir12). The present secondary analysis used only de-identified, publicly available data.
Results
Characteristics of study participants
Table S2 presents the baseline characteristics of the 131 randomised participants included in the intention-to-treat population after multiple imputation. Baseline characteristics were generally comparable across the four factorial groups (Control, TRE, HIIT and TRE + HIIT). Participants were predominantly aged 26–45 years and had obesity at study entry, with a median body weight of 90·1 kg and a median BMI of 30·7 kg/m2. Adiposity was high overall, with a mean body fat percentage of 40·9 % and a mean visceral fat area of 181·3 cm2. During follow-up, twenty-one participants discontinued the intervention, including ten because of COVID-19-related reasons.
Anthropometric outcomes
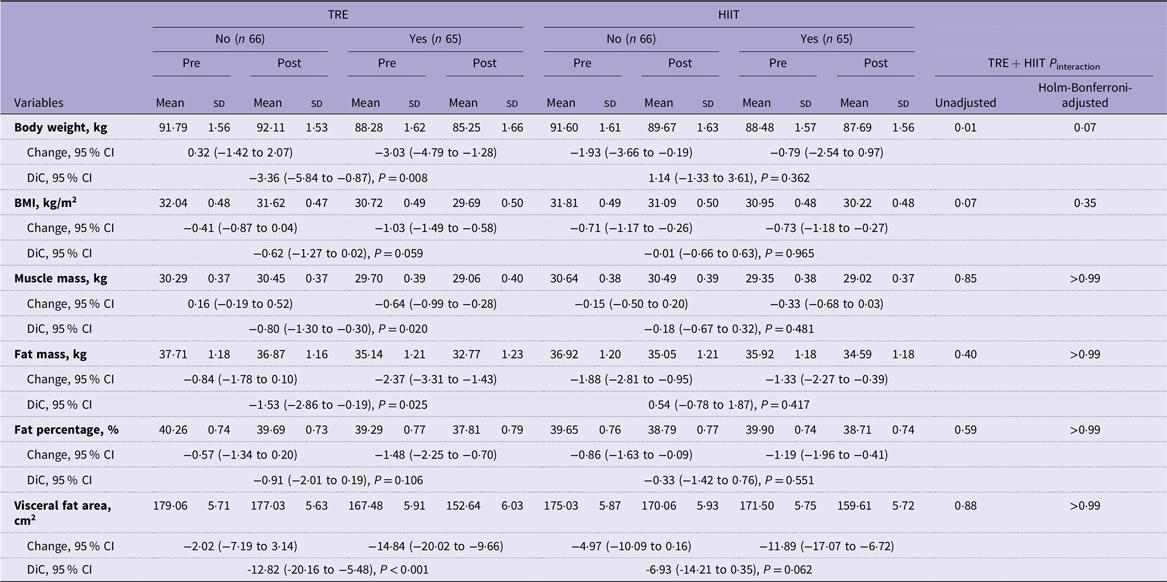
Body weight, BMI, fat mass, visceral fat area and muscle mass generally decreased after the intervention, with no significant TRE × HIIT interaction detected for any anthropometric outcome (Table 1).
Anthropometric outcomes at pre- and post-intervention according to TRE and HIIT, with main effects (differences in change) and TRE × HIIT interaction p-values (intention-to-treat analysis)

Table 1. Long description
The table presents anthropometric outcomes at pre- and post-intervention according to TRE and HIIT, with main effects and TRE x HIIT interaction p-values. It includes data for body weight, BMI, muscle mass, fat mass, fat percentage, and visceral fat area. The table is divided into columns for different groups: TRE No, TRE Yes, HIIT No, HIIT Yes, and TRE + HIIT interaction. Each group has pre- and post-intervention data with mean and standard deviation values. Row labels include variables such as body weight, BMI, muscle mass, fat mass, fat percentage, and visceral fat area. The table also includes changes, confidence intervals, and p-values for each variable. For example, body weight in the TRE No group changes from a mean of 91.79 kg pre-intervention to 92.11 kg post-intervention, with a change of 0.32 kg and a p-value of 0.008. Similar detailed data is presented for all variables and groups.
DiC, difference in change; HIIT, high-intensity interval training; TRE, time-restricted eating.
Pre- and post-intervention values are estimated marginal means ± se from the linear mixed-effects models. Changes and differences in change are model-estimated contrasts presented as mean differences (95 % CI). All models include randomised participants in the intention-to-treat population after multiple imputation. The TRE × HIIT P interaction indicates whether the combined effect of both interventions differed from that expected based on their individual effects. P interaction values were corrected for multiple testing using the Holm–Bonferroni method to control the family-wise error rate.
P values for comparisons by intervention assignment (TRE: yes v. no; HIIT: yes v. no).
In the main-effect analysis, TRE was associated with significantly greater reductions, relative to no TRE, in body weight (DiC − 3·36 kg, 95 % CI − 5·84 to −0·87, p = 0·008), fat mass (DiC − 1·53 kg, −2·86 to −0·19, p = 0·025) and visceral fat area (DiC − 12·82 cm2, −20·16 to −5·48, p < 0·001; Table 1). However, TRE was also associated with a significant reduction in muscle mass (DiC − 0·80 kg, −1·30 to −0·30, p = 0·020). No significant TRE main effects were observed for BMI or body fat percentage, and no significant HIIT main effects were observed for any anthropometric outcome in the ITT analysis.
In the per-protocol sensitivity analysis, no TRE × HIIT interaction was observed, but both TRE and HIIT showed independent reductions in BMI, fat mass, body fat percentage and visceral fat area, while the TRE-related muscle mass reduction was attenuated (Table S3).
Lipid profiles
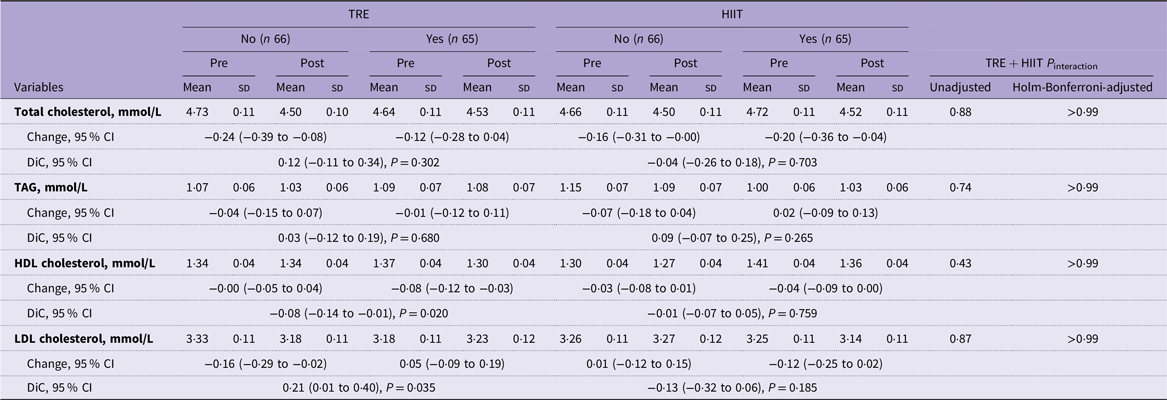
Total cholesterol, TAG, HDL cholesterol and LDL cholesterol changed modestly over the 7-week intervention, and no significant TRE × HIIT interaction was observed for any lipid outcome (Table 2).
Fasting lipid profile at pre- and post-intervention according to TRE and HIIT, with main effects (differences in change) and TRE × HIIT interaction p-values (intention-to-treat analysis)

Table 2. Long description
A table comparing lipid profiles pre- and post-intervention across different exercise groups. The table has 4 rows and 13 columns. Column headers are Variables, No (n 66) Pre Mean, No (n 66) Pre SD, No (n 66) Post Mean, No (n 66) Post SD, Yes (n 65) Pre Mean, Yes (n 65) Pre SD, Yes (n 65) Post Mean, Yes (n 65) Post SD, No (n 66) Pre Mean, No (n 66) Pre SD, No (n 66) Post Mean, No (n 66) Post SD, Yes (n 65) Pre Mean, Yes (n 65) Pre SD, Yes (n 65) Post Mean, Yes (n 65) Post SD, Unadjusted, Holm-Bonferroni-adjusted. Row labels are Total cholesterol, mmol/L, Change, 95% CI, TAG, mmol/L, Change, 95% CI, HDL cholesterol, mmol/L, Change, 95% CI, LDL cholesterol, mmol/L, Change, 95% CI. The table presents mean and standard deviation values for total cholesterol, TAG, HDL cholesterol, and LDL cholesterol pre- and post-intervention for different exercise groups. It also includes changes and 95% confidence intervals for these variables.
DiC, difference in change; HIIT, high-intensity interval training; TRE, time-restricted eating.
Pre- and post-intervention values are estimated marginal means ± se from the linear mixed-effects models. Changes and differences in change are model-estimated contrasts presented as mean differences (95 % CI). All models include randomised participants in the intention-to-treat population after multiple imputation. The TRE × HIIT P interaction indicates whether the combined effect of both interventions differed from that expected based on their individual effects. P interaction values were corrected for multiple testing using the Holm–Bonferroni method to control the family-wise error rate.
P values for comparisons by intervention assignment (TRE: yes v. no; HIIT: yes v. no).
In the main-effect analysis, TRE was associated with a significant decrease in HDL cholesterol (DiC –0·08 mmol/L, 95 % CI –0·14 to –0·01, p = 0·02) and a significant increase in LDL cholesterol (DiC + 0·21 mmol/L, 0·01 to 0·40, p = 0·035) compared with no TRE (Table 2). However, both lipid findings were attenuated and no longer statistically significant in the per-protocol sensitivity analysis; the ITT CI for LDL cholesterol also closely approached the null (Table S4). HIIT showed no significant main effects on any lipid outcome in the ITT analysis (Table 2); however, the per-protocol sensitivity analysis suggested reductions in total cholesterol and LDL cholesterol (Table S4).
Glycaemic outcomes
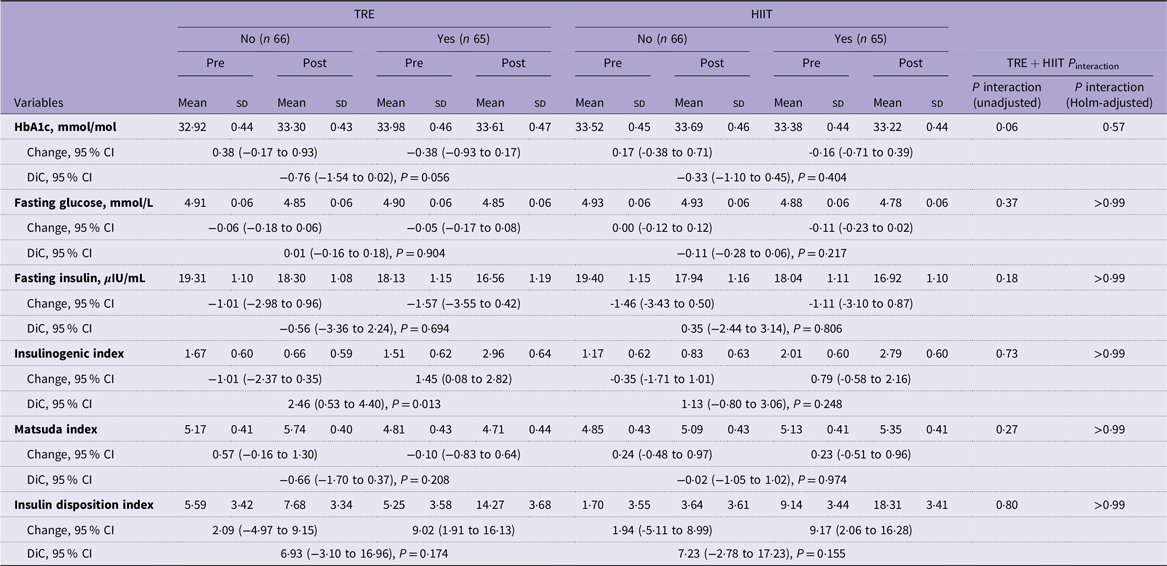
HbA1c, fasting glucose, fasting insulin, Matsuda index and insulin disposition index showed small changes over the intervention, with no significant TRE × HIIT interaction for any glycaemic outcome (Table 3).
Glycaemic outcomes at pre- and post-intervention according to TRE and HIIT, with main effects (differences in change) and TRE × HIIT interaction p-values (intention-to-treat analysis)

Table 3. Long description
The table presents glycaemic outcomes at pre- and post-intervention according to TRE and HIIT, with main effects and TRE×HIIT interaction p-values. It includes data for HbA1c, fasting glucose, fasting insulin, insulinogenic index, Matsuda index, and insulin disposition index. The table is divided into columns for different intervention groups: No TRE, Yes TRE, No HIIT, Yes HIIT, and TRE+HIIT interaction p-values. Each group has pre- and post-intervention mean values with standard deviations, changes with 95% confidence intervals, and directionality with 95% confidence intervals and p-values. The variables are listed in rows, with each row providing detailed data for the respective variable. Notable trends and interactions are highlighted with p-values for unadjusted and Holm-adjusted interactions.
DiC, difference in change; HIIT, high-intensity interval training; TRE, time-restricted eating.
Pre- and post-intervention values are estimated marginal means ± se from the linear mixed-effects models. Changes and differences in change are model-estimated contrasts presented as mean differences (95 % CI). All models include randomised participants in the intention-to-treat population after multiple imputation. The TRE × HIIT P interaction indicates whether the combined effect of both interventions differed from that expected based on their individual effects. P interaction values were corrected for multiple testing using the Holm–Bonferroni method to control the family-wise error rate.
P values for comparisons by intervention assignment (TRE: yes v. no; HIIT: yes v. no).
In both the main-effect and per-protocol sensitivity analyses, TRE was associated with a significant increase in the insulinogenic index (Table 3 and Table S5). However, because HbA1c, fasting glucose, fasting insulin, Matsuda index and insulin disposition index did not improve, this isolated finding should be interpreted cautiously. No other significant main effects of TRE or HIIT were observed in the ITT analysis. In the per-protocol sensitivity analysis, HIIT was additionally associated with a significant reduction in HbA1c (DiC − 0·68 mmol/mol, 95 % CI − 1·31 to −0·05, p = 0·033), and the TRE main effect on the insulinogenic index was preserved (DiC + 2·22, 95 % CI 0·19 to 4·25, p = 0·032; Table S5).
Physical activity, energy expenditure and dietary intake
No significant TRE × HIIT interaction was observed for any behavioural outcome (Table S6-S7). In the main-effect analysis, TRE reduced total energy intake compared with no TRE (DiC –253·53 kcal/day, 95 % CI –392·71 to –114·36, p ≤ 0·001; Table S6), with a similar reduction in the sensitivity analysis (DiC –278·46 kcal/day, 95 % CI –426·73 to –130·20, p ≤ 0·001; Table S7). HIIT was associated with greater increases in physical activity (DiC + 0·05 MET/day, 95 % CI 0·01 to 0·10, p = 0·025; Table S6) and total energy expenditure (DiC + 161·07 kcal/day, 95 % CI 63·20 to 258·93, p = 0·001; Table S6) compared with no HIIT, with consistent findings in the sensitivity analysis (Table S7).
Discussion
Main findings
In this secondary 2 × 2 factorial analysis of an RCT in women with overweight or obesity, we found no significant TRE × HIIT interaction for any cardiometabolic outcome. Given the limited power for factorial interaction testing, this finding should be interpreted as a lack of detectable interaction in the present analysis, rather than as evidence that the interventions act independently. Overall, TRE improved adiposity-related measures but was accompanied by muscle mass loss and a modest decrease in HDL cholesterol. HIIT effects were modest in the ITT analysis and clearer in the per-protocol sensitivity analysis. TRE was also associated with an isolated increase in the insulinogenic index, without improvements in fasting glucose, fasting insulin or HbA1c. These findings suggest that the adiposity benefits of TRE should be weighed against potential adverse effects on lean mass and lipid profile.
Comparison with previous trials of combined fasting and high-intensity interval training
Our findings differ from earlier trials reporting greater benefits when fasting-based interventions were combined with HIIT(Reference Martínez-Rodríguez, Rubio-Arias and García-De Frutos15,Reference Batitucci, Faria Junior and Nogueira16) . Batitucci et al. (2022) found that reductions in body weight and body fat in women with obesity occurred only with intermittent fasting plus HIIT(Reference Batitucci, Faria Junior and Nogueira16). Martínez-Rodríguez et al. (2021) also reported reduced fat mass with intermittent fasting plus HIIT, but not HIIT alone, in active women(Reference Martínez-Rodríguez, Rubio-Arias and García-De Frutos15). Several factors may explain this divergence. The current trial used a daily ≤10 h TRE window with only a modest energy reduction, approximately 12 % by the end of the trial (Table S6). In contrast, Batitucci et al. (2022) used a 5:2 intermittent fasting regimen with severe restriction to 25 % of energy needs on two non-consecutive days(Reference Batitucci, Faria Junior and Nogueira16), and Martínez-Rodríguez et al. (2021) combined a ≤ 10-h feeding window on alternate days with a hypocaloric Mediterranean diet (10 %–20 % energy reduction)(Reference Martínez-Rodríguez, Rubio-Arias and García-De Frutos15). These more intensive approaches may have promoted greater fatty acid and ketone utilisation, thereby enhancing fat oxidation(Reference Derron, Güntner and Weber17–Reference Andriessen, Doligkeit and Moonen-Kornips19). The Mediterranean diet may also have contributed to reductions in body weight, body fat and visceral adipose tissue, particularly when combined with exercise(Reference Sood, Sylivris and Sualeheen20). Second, participant characteristics differed across studies. Although both the current trial and Batitucci et al. (2022) included women with overweight or obesity, participants in the current trial had a lower median BMI than those in Batitucci et al. (2022) (30·7 v. 34·0 kg/m2)(Reference Batitucci, Faria Junior and Nogueira16), whereas Martínez-Rodríguez et al. (2021) studied young, active women with normal BMI(Reference Martínez-Rodríguez, Rubio-Arias and García-De Frutos15). Finally, intervention duration may have played a role. The current 7-week trial was shorter than the 8-week intervention in Batitucci et al. (2022)(Reference Batitucci, Faria Junior and Nogueira16) and the 12-week intervention in Martínez-Rodríguez et al. (2021)(Reference Martínez-Rodríguez, Rubio-Arias and García-De Frutos15), which may have limited the time needed for synergistic adaptations to emerge.
Comparison with studies using 16:8 time-restricted eating plus exercise protocols
The absence of a detectable TRE × HIIT interaction in women with overweight or obesity is consistent with several studies using similar 16:8 TRE protocols combined with exercise. In comparison with RT, our results align with Tinsley et al. (2019), who reported that adding a 16:8 TRE window to a supervised RT programme in resistance-trained females did not improve fat-free mass accretion or fat loss compared with a regular diet(Reference Tinsley, Moore and Graybeal21). Likewise, Stratton et al. (2020) found that TRE did not enhance fat mass reductions beyond those achieved by caloric restriction alone during a 4-week resistance training intervention in active males(Reference Stratton, Tinsley and Alesi22). The neutral effects on cardiometabolic markers observed here are also consistent with Richardson et al. (2023)(Reference Richardson, Tovar and Davis23) and Brady et al. (2021)(Reference Brady, Langton and Mulligan24), who showed that 4 to 8 weeks of 16:8 TRE promoted fat loss in runners without significant changes in blood lipids, glucose or insulin. The muscle mass loss observed with TRE in the current ITT analysis is consistent with Liu et al. (2023), who reported a comparable decrease in lean tissue mass when combining 16:8 TRE with walking among female students with occult obesity(Reference Liu, Chen and Ji25). This loss of muscle mass may reflect insufficient mechanical loading or protein intake to offset the catabolic effects of prolonged daily fasting(Reference Williamson and Moore26). In the per-protocol analysis, the reduction was attenuated and no longer significant (Table S3), suggesting less lean mass may be lost among adherent participants. Finally, the absence of glycaemic or lipid improvement in our study contrasts with the benefits reported by Moro et al. (2021) after 12 months of 16:8 TRE combined with RT in healthy males(Reference Moro, Tinsley and Pacelli27). This difference may reflect variation in intervention duration and study population, as Moro et al. (2021) studied healthy males for 12 months(Reference Moro, Tinsley and Pacelli27), whereas our study included women with overweight or obesity over 7 weeks. Together, these findings suggest that when a strong exercise stimulus such as HIIT or RT is already present, adding short-term restriction of food intake timing may offer limited additional benefit for body composition or metabolic outcomes(Reference Tinsley, Moore and Graybeal21–Reference Brady, Langton and Mulligan24).
Clinical interpretation of time-restricted eating-related muscle, lipid, fat mass and glycaemic changes
We found that the TRE-associated 0·8 kg loss of muscle mass is clinically relevant, since preserving lean mass is an important goal of weight management. Muscle loss can lower resting energy expenditure, promote weight regain and impair long-term metabolic and functional health(Reference Cava, Yeat and Mittendorfer28). Our finding is consistent with the TREAT trial, in which approximately 65 % of TRE-related weight loss without prescribed exercise was lean mass, exceeding the 20–30 % typically expected with conventional caloric restriction(Reference Lowe, Wu and Rohdin-Bibby29). It also aligns with Liu et al. (2023)(Reference Liu, Chen and Ji25), who reported similar lean mass loss with TRE plus walking. This loss may be mitigated, though not eliminated, by RT and adequate protein intake(Reference Tinsley, Moore and Graybeal21,Reference Moro, Tinsley and Bianco30) , possibly through effects on skeletal muscle autophagy via the mTOR and AMPK pathway(Reference Xinyan, Yajie and Shangfan31). The modest HDL decrease is consistent with transient lipid changes during active weight loss(Reference Dattilo and Kris-Etherton32) and with the modest TRE-associated weight loss of 3·36 kg, or 3·7 %, which is sufficient to improve TAG, glucose and HbA1c but generally below the threshold needed to improve LDL cholesterol, HDL cholesterol or blood pressure(Reference Jensen, Ryan and Apovian33). Although LDL cholesterol did not increase significantly within the TRE group in our study, LDL cholesterol increases have been reported in some TRE trials(Reference Zhang, Liu and Wang34,Reference Martens, Rossman and Mazzo35) . Because lipid markers may require 6 to 12 months to reach a new steady state(Reference Lin, Cienfuegos and Ezpeleta36,Reference Liu, Huang and Huang37) , longer follow-up is needed to determine whether these changes are transient or sustained. Overall, the clinical case for TRE in this population rests mainly on adiposity reduction, which should be weighed against muscle mass loss and changes in the lipid profile. RT, adequate protein intake and continued lipid monitoring may help mitigate these concerns.
Our findings further suggest that the early clinical effects of TRE may be expressed more clearly through energy balance and adiposity than through short-term glycaemic changes. TRE reduced energy intake by approximately 254 kcal/day despite no prescribed caloric restriction, supporting the concept that restricting the daily eating window can induce a spontaneous energy deficit without deliberate calorie counting, as reported in ad libitum TRE studies(Reference Lin, Cienfuegos and Ezpeleta36). This reduction in energy intake was accompanied by concordant decreases in body weight (–3·36 kg), fat mass (–1·53 kg) and visceral fat area (–12·82 cm2), indicating a broader reduction in overall and central adiposity rather than an isolated change in body weight. The visceral fat reduction may be particularly relevant because visceral adiposity is an established risk factor for insulin resistance, type 2 diabetes, atherosclerosis and CVD beyond general measures of obesity(Reference Neeland, Ross and Després38). In contrast, the limited glycaemic response may partly reflect the relatively favourable baseline metabolic status of this cohort. Consistent with this interpretation, a 12-week randomised trial in adults with overweight or obesity without diabetes found no significant improvement in insulin sensitivity, insulin secretion or β-cell function with TRE(Reference Bantle, Lau and Wang39). Recent randomised evidence likewise indicates that TRE effects vary across metabolic outcomes and intervention characteristics(Reference Chen, Tsai and Tu40). Thus, in women with overweight or obesity without overt metabolic disease, reductions in energy intake and adiposity may represent more readily detectable early responses to TRE, whereas glycaemic adaptations may be less apparent over a short intervention period.
Strengths and limitations
To our knowledge, this is the first study in women with overweight or obesity to use a randomised 2 × 2 factorial design to formally test the TRE × HIIT interaction for cardiometabolic outcomes. By estimating the TRE and HIIT main effects within the same randomised sample while also testing their interaction, this analysis extends the original four-arm comparison and generates new hypotheses about the added value and clinical trade-offs of combining TRE with HIIT. Strengths also include multiple imputation, prespecified per-protocol sensitivity analyses and Holm–Bonferroni adjustment of interaction tests.
Several limitations should also be considered. First, this secondary analysis repurposed a trial originally randomised and powered for four-group comparisons rather than specifically for factorial interaction testing, which generally requires a larger sample. The non-significant TRE × HIIT interactions should therefore be interpreted as indicating no detectable synergy within the available sample, not as evidence of true independence. Although the interaction estimates were consistently non-significant, including after Holm–Bonferroni adjustment and in sensitivity analyses, a smaller clinically meaningful interaction cannot be excluded. These findings should therefore be considered hypothesis-generating rather than confirmatory. Second, the 7-week intervention was sufficient to detect changes in weight and fat mass but may have been too short to capture longer-term lipid, glycaemic and lean-mass adaptations. Third, the sample was limited to women aged 18–45 years with overweight or obesity and without diabetes or major cardiometabolic disease, limiting generalisability to men, older adults, individuals with diabetes and those at high cardiovascular risk. Fourth, the study was conducted during the COVID-19 period, which may have affected diet, physical activity and retention. Fifth, body composition was assessed using bioelectrical impedance analysis rather than dual-energy X-ray absorptiometry or MRI. Because bioelectrical impedance analysis is sensitive to hydration and fasting status(Reference Kyle, Bosaeus and De Lorenzo41), changes in fat and muscle mass should be interpreted cautiously. Sixth, although TRE reduced total energy intake, detailed data on dietary quality, absolute protein intake and meal distribution within the eating window were unavailable, limiting separation of meal-timing effects from other dietary changes. Seventh, as a secondary analysis of a publicly deposited dataset, the main novel contribution is the formal factorial interaction testing with per-protocol and multiple imputation analyses; randomisation and allocation concealment were not independently verified beyond the original publication(Reference Haganes, Silva and Eyjólfsdóttir12). Finally, the supervised HIIT protocol and prescribed TRE window may limit generalisability to less-controlled real-world settings, where adherence, exercise intensity and implementation of the eating window may vary.
Conclusion
In this exploratory secondary analysis of women with overweight or obesity, no significant TRE × HIIT interaction was detected across anthropometric, lipid or glycaemic outcomes over 7 weeks. TRE reduced adiposity but was accompanied by muscle mass loss and a small unfavourable change in HDL cholesterol, suggesting that its benefits should be weighed against potential harms through monitoring of lean mass and lipid profile. Further adequately powered, longer-term factorial trials using imaging-based body composition assessment, alternative TRE windows and more diverse populations are needed before firm clinical recommendations can be made.
Supplementary material
For supplementary material/s referred to in this article, please visit https://doi.org/10.1017/S0007114526108484
Data availability statement
This study is a secondary analysis of a publicly available dataset distributed under the Creative Commons Attribution 4.0 International (CC BY 4.0) license. The original dataset can be accessed through Mendeley Data at: https://data.mendeley.com/datasets/4pgkkd54n3/2.
Acknowledgements
The authors express their appreciation to all participants and investigators whose contributions made this study possible.
T.Q.D.: Data curation – Lead, Investigation – Lead, Methodology – Lead, Supervision – Lead, Visualisation – Lead, Writing – original draft-Lead, Writing – review & editing – Lead; K.N.D.: Data curation – Equal, Investigation – Equal, Writing – review & editing – Equal; P.N.Q.: Investigation – Equal, Software – Equal, Validation – Equal, Writing – review & editing – Equal.
The authors reported no funding received for this study.
The authors report no conflicts of interest.


 Open access

