





Globalisation and industrialisation are transforming food environments in low- and middle-income countries (LMIC) through changes in how people access, afford and consume food(Reference Popkin1–Reference Turner, Kalamatianou and Drewnowski3). These transformations span food availability, accessibility and pricing, alongside rising incomes, shifting cultural norms and intensified marketing influences that collectively shape dietary behaviour(Reference Swinburn, Kraak and Allender2,Reference Hawkes, Ruel and Salm4) . Understanding these interconnected dimensions is critical to addressing nutrition challenges and designing effective regulations and interventions to promote healthier diets.
Across LMIC, rural populations are experiencing accelerated shifts in their food environments due to economic growth, market integration and the expansion of industrial food production. Packaged food manufacturers are leveraging traditional distribution networks to penetrate rural markets, increasing access to ultra-processed products(Reference Gómez and Ricketts5,Reference Baker, Machado and Santos6) . Concurrently, the rise in modern retail and household income has catalysed an expansion of food market landscapes bringing a mix of healthy and unhealthy food options to rural areas(Reference Reardon, Echeverria and Berdegué7,Reference Pingali8) . South Asia, home to the world’s largest rural population, exemplifies this duality(Reference Baker and Friel9,Reference Reardon, Timmer and Barrett10) . While urban markets have long been saturated with diverse food choices, rural markets are increasingly exposed to Western fast food and industrialised products even in remote regions(Reference Pingali8,Reference Baker and Friel9) . However, the increased availability of food options in other countries has not translated into better health outcomes(Reference Kadiyala, Aurino and Cirillo11,Reference Pingali and Sunder12) .
Despite emerging rural markets, existing research has largely concentrated on urban settings and high-income countries, resulting in a gap in understanding rural food systems in LMIC and designing effective interventions to improve food environments tailored to their needs(Reference Pinard, Byker Shanks and Harden13,Reference Choudhury, Bi and Medina-Lara14) . These gaps include limited conceptual integration of food environment attributes into diet research, methodological challenges in mapping local markets and insufficient data on rural consumer behaviour(Reference Neufeld, Nordhagen and Leroy15). In South Asia, traditional retail structures such as haats (temporary markets) and mandis (organised markets) are well documented in economic literature, yet their influence on dietary choices remains underexplored. The ongoing transition from traditional to highly industrialised food environments presents a narrow window of opportunity to implement pre-emptive interventions that protect rural consumers from the nutritional risks of ultra-processed and fast foods.
This study addresses evidence gaps by examining rural food environments in districts across Bangladesh, India and Nepal. Specifically, the study integrates rural household- and individual-level dietary data with market-level food environment indicators and examines multiple key domains of the food environment across different age groups in multiple South Asian countries, providing comparative evidence. Following the framework proposed by Turner et al., we hypothesise that availability and affordability shape the set of foods that are economically and physically obtainable, while accessibility reflects the ease with which individuals can acquire these foods(Reference Turner, Aggarwal and Walls16). Desirability captures preferences, perceptions and social norms that influence selection among available options. In general, higher availability, greater affordability and easier accessibility of foods are hypothesised to be associated with higher consumption, while greater desirability reflects stronger preferences that increase the likelihood of selection and intake. The study seeks to answer two key questions: (1) What are the defining characteristics of food environments in rural South Asia? and (2) How do key attributes including affordability, availability, accessibility, desirability and convenience influence diet quality and food choice?
Methods
Data
The Transforming Agrifood Systems in South Asia (TAFSSA) survey was conducted between February and May 2023 across five locations: Nalanda district in Bihar, India (n 1000 households); Surkhet (n 500) in Karnali Province and Banke (n 500) in Lumbini Province, Nepal; and Rangpur (n 1000) in Rangpur Division and Rajshahi (n 1000) in Rajshahi Division, Bangladesh. Survey locations were selected based on being hot spots for challenges related to poverty, climate, malnutrition and social inclusion and having research staff presence. The household surveys are representative at the rural district level. Respondents included one adult female (aged 20+), one adult male (aged 20+) and one adolescent (aged 10–19) per household. To assess food environments, market surveys were conducted in the same villages as the household surveys. In each village, after conducting a census of all vendors, six retailers (local grocers, green grocers and meat or milk vendors) and two to three restaurants and tea stalls were randomly selected and interviewed regarding vendor information, customer profiles, sales, essential goods, prices, supply chains, food waste, infrastructure, hygiene and marketing practices. This study was conducted according to the guidelines laid down in the Declaration of Helsinki, and all procedures involving human subjects/patients were approved by the institutional review boards of the International Food Policy Research Institute in Washington, DC (approval number PHND-23-0209); the Institute of Health Economics, University of Dhaka, Bangladesh (approval number IHE/IRB/DU/03/2023/Final); Centre for Media Studies, Delhi, India (approval number CMS-IRB/Ag/2023/005); and the National Health Research Council, Kathmandu, Nepal (approval number 43/2023). Verbal informed consent was obtained from all subjects/patients. Verbal consent was witnessed and formally recorded. Additional details are available in supplemental information (S1).
Outcomes
Two sets of primary dietary outcomes were analysed. Set 1 comprised the weekly frequency of consumption of twenty-five foods assessed using a brief FFQ with a 7-d recall period. Set 2 comprised diet quality measured using the Global Diet Quality Score (GDQS) app(Reference Moursi, Bromage and Fung17), including both the GDQS+ (healthy components) and GDQS− (unhealthy components) metrics based on 24-h recall. Respondents reported all foods and beverages consumed at home and outside, from waking until bedtime, across seven pre-defined eating occasions: pre-breakfast, breakfast, mid-morning, lunch, afternoon, dinner and post-dinner. The GDQS plus score was calculated by summing points from sixteen healthy food groups (range: 0–32 points), while the GDQS minus score summed points from seven unhealthy food groups and two groups that are unhealthy when consumed in excess (range: 0–17 points). These two GDQS metrics were the primary dietary outcomes. FFQ and GDQS capture complementary aspects of diet, with the FFQ reflecting longer-term, food group-specific consumption aligned with purchasing behaviour and price indicators, and the GDQS providing a validated summary measure of overall diet quality. See online Supplementary methods for details (S2 and S3).
Descriptive analysis
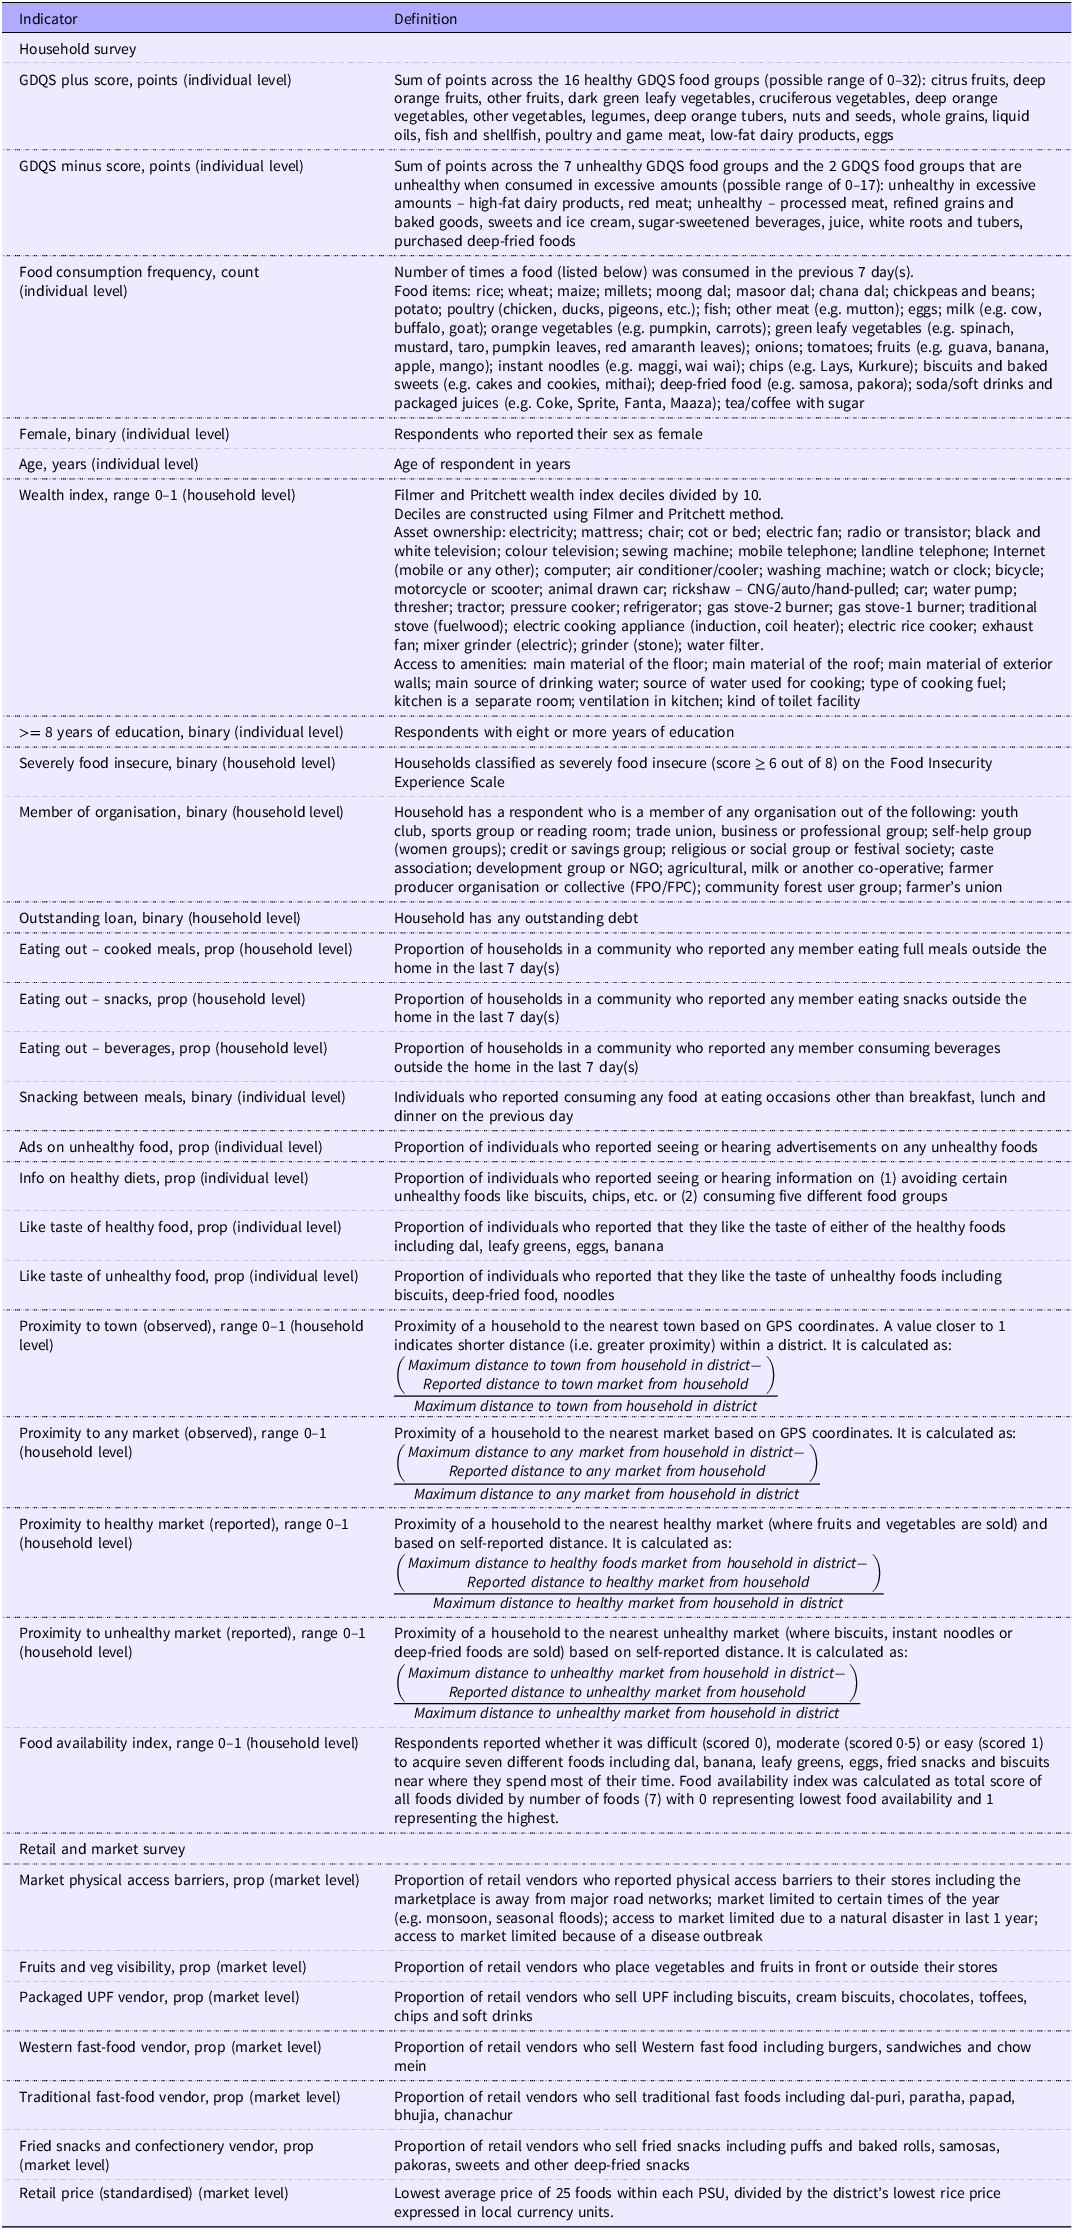
Detailed definitions for all indicators used in the study are available in Table 1.
Definitions of individual-, household- and market-level indicators used in the study

Table 1. Long description
Panel A: Table listing indicators and their definitions used in a study. The table includes columns for Indicator, Household survey, and Definition. Each row provides detailed definitions for various indicators related to household surveys, individual levels, and market levels. Panel B: Detailed definitions for indicators such as household survey, food consumption frequency, age, wealth index, education level, food insecurity, membership in organizations, outstanding loans, eating out habits, snacking behavior, advertisements on unhealthy food, information on healthy diets, taste preferences for healthy and unhealthy foods, proximity to markets, and food availability index. Panel C: Market survey details including physical access barriers, visibility of fruits and vegetables, presence of packaged UPF vendors, traditional fast food vendors, fried snack and confectionery vendors, and retail price standardization.
GDQS, Global Diet Quality Score; CNG, compressed natural gas; NGO, non-governmental organisation; GPS, global positioning system; UPF, ultra-processed foods; PSU, primary sampling unit.
Sample characteristics were described using means and standard deviations for all variables within each district. Outcome distributions were visualised using kernel density curves by district. The frequency and sources of advertisements and information on unhealthy foods were graphed across districts and household wealth categories. Wealth deciles were constructed using principal component analysis, following the methodology described by Filmer and Pritchett(Reference Filmer and Pritchett18). District-level maps were created to assess geographic differences in the distribution and prevalence of unhealthy food vendors. Finally, the distribution of eating out (full meals, beverages and prepared snacks) and snacking (eating at occasions other than breakfast, lunch and dinner) were visualised using kernel density curves to gauge normality and variation.
Association between weekly food consumption and the food environment
For the analysis of the four key domains – accessibility, availability, affordability and desirability – we used the weekly frequency of the twenty-five FFQ foods because it captures habitual, smoothed consumption patterns over a longer recall period (e.g. weekly), which aligns more closely with household food purchasing behaviour and price exposure. Separate multivariate regressions were estimated using Equation (1). For individual i, in household h, community c, district d and food f
 $\eqalign{ Foo{d^{\,f}}_{i,h,c,d} = & \;{\beta _0} + \;{\beta _1}Proximit{y_{h,c,d}}\; + \;{\beta _2}Availablit{y_{i,h,c,d}} \cr & + \;{\beta _3}Price^{\,f}_{c,d} + \;{\beta _4}Ifo^{\,f}_{i,h,c,d} + \;{\beta _5}Wealt{h_{h,c,d}} \cr & + \mathop \sum \limits_{j = 6}^J {\beta _j}{X_{j,i,h,c,d}}\; + {\varepsilon ^{\,f}}_{i,h,c,d} \cr} $
Food represents the weekly intake of twenty-five foods (online Supplementary Table S3).
 $Proximity$
(accessibility) represents normalised distance measures ranging from 0 to 1, with higher values reflecting shorter distances to the nearest market (Table 1).
 $Availablity$
index also ranges from 0 to 1 and captures the reported perception of healthy (dal, banana, leafy greens or eggs) and unhealthy food (fried snacks or biscuits) availability in nearby markets (0 = difficult to find and 1 = easy to acquire).
 $Price$
(affordability) represents the community price of each food item standardised by the lowest rice price in the district(Reference Debreu19).
 $Info$
(desirability) is a binary indicator representing whether an individual heard messages promoting healthy food consumption (used as exposure for healthy foods) or saw ads promoting unhealthy food consumption (used as exposure for unhealthy foods).
 $Wealth$
(reflecting desirability and affordability) is an indicator ranging from 0 to 1 in increments of 0·1 units representing deciles of higher household socio-economic status. Wealth serves as a proxy for desirability and affordability, capturing aspirational consumption patterns after adjusting for price effects because wealthier households are likely to consume more desired or aspirational foods due to greater purchasing power(Reference Darmon and Drewnowski20).
 ${X_{j,i,h,c,d}}$
includes age (in years), sex (female) and district fixed effects. District fixed effects were included to control for unobserved district-level heterogeneity and confounding. Standard error estimates are clustered at the household level to relax the independent errors assumption to account for intra-household correlation within household. All districts are assigned equal frequency weights to account for larger samples in Bangladesh relative to India and Nepal. In additional analyses, we interact availability, proximity, prices and information with wealth to test for any effect modification for poor v. non-poor households.
Drivers of diet quality
For the second set of regression models examining associations between multiple determinants and overall diet quality, we used GDQS as the outcome to maintain model parsimony and interpretability. GDQS provides a summary measure of healthy and unhealthy dietary components, allowing us to assess broader associations with diet quality in a statistically efficient manner. Multivariate regressions were run using Equation (2). For individual a, in household h, community c and district d,
 $GDQ{S_{i,h,c,d}} = {\beta _0} + \;{\beta _1}Exposur{e_{i,h,c,d}} + \mathop \sum \limits_{j = 2}^J {\beta _j}{X_{j,i,h,c,d}}\; + {\varepsilon _{i,h,c,d}}$
Regressions were conducted separately for each food environment variable to avoid biases due to multicollinearity. Standard errors are clustered at the household level.
 $GDQS$
represents two diet quality metrics (GDQS plus and GDQS minus).
 $Exposure$
refers to three specific domains of interest, including behaviour, market access and the food environment.
The behaviour domain includes the proportion of respondents who reported consuming full meals, snacks or beverages outside the home was used to estimate eating out at the community level, snacking between meals (binary), saw ads on unhealthy or healthy food and taste preferences that were captured by individual responses to questions regarding liking the taste of healthy (dal, eggs, bananas and green leafy vegetables) and unhealthy (biscuits and fried snacks) foods. The indicators for tastes were taken from the previously validated Food Environment Rapid Assessment tool (online Supplementary Table S10)(Reference Choo21). The market access domain includes two proximity variables that were created using GPS coordinates: the first captures shortest distance from households to markets (haats in Bangladesh and city market in Nalanda) or retailers (in Nepal), and the second captures the distance from households to the nearest town. Two additional proximity variables measure distance from households to markets where healthy and unhealthy foods are sold, as reported by respondents. Market access barriers were proxied by vendors who reported usual obstacles to store access (their shop being far from major road networks, open only during certain times of the year or access issues due to natural disasters or disease outbreaks). The food environment domain includes the food availability index, the visibility of fruits and vegetables in retail stores, as well as the prevalence of vendors selling diverse types of unhealthy food: packaged ultra-processed food, Western fast food, traditional fast food or fried snacks.
 ${X_{j,i,h,c,d}}$
includes socio-economic controls such as age (in years), sex (female), education (8 or more years), household wealth index, household severe food insecurity (calculated using the Food Insecurity Experience Scale (FIES)(Reference Cafiero, Viviani and Nord22), which captures the extent of food-related constraints experienced by households), organisational membership (to account for the potential influence of community groups), outstanding loans and district fixed effects.
In interpreting the results, statistical significance is assessed using CI and P-values, while substantive importance is evaluated based on the magnitude of the estimated coefficients. This distinction allows us to highlight associations that are meaningful in size even when statistical precision varies.
Results
Individual diets and household demographics
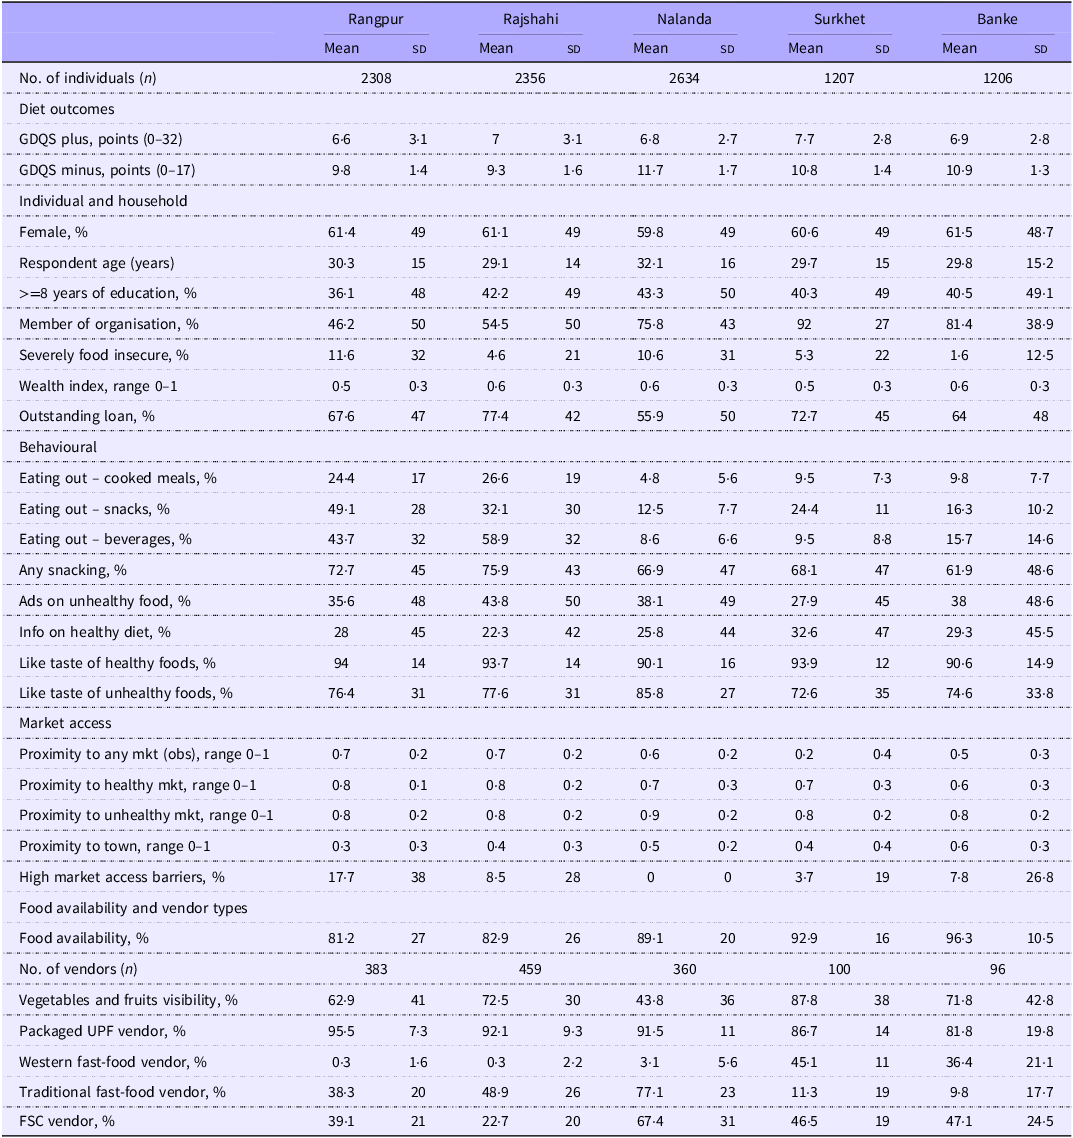
Across all districts (n 9711 individuals), 60–62 % of respondents were female, with an average age of 29–32 years. Rajshahi and Banke had a higher proportion of non-poor households, and over one-third of respondents across districts had 8 or more years of education (Table 2). The severe food insecurity was lowest in Banke (2 %) and highest in Rangpur (12 %). In Nalanda, Banke and Surkhet, more than 75 % of households were members of an organisation. Over half of households in all districts had an outstanding loan.
Sample characteristics for individual-, household- and market-level indicators

Table 2. Long description
The table presents data on individual, household, and market-level indicators across five districts: Rangpur, Rajshahi, Nalanda, Surkhet, and Banke. It includes columns for each district with mean and standard deviation values. The table is divided into sections: Diet outcomes, Individual and household, Behavioural, and Market access. Each section contains various metrics such as GDQS points, percentage of females, respondent age, education level, membership in organizations, food insecurity, wealth index, outstanding loans, eating out habits, market proximity, and food availability. Notable trends include high percentages of females and individuals with outstanding loans across all districts. Banke shows the lowest severe food insecurity at 1.6 percent, while Rangpur has the highest at 11.6 percent. Membership in organizations is notably high in Nalanda, Banke, and Surkhet. Market access barriers are highest in Rangpur and lowest in Nalanda. Food availability is consistently high across all districts, with Banke showing the highest percentage at 96.3 percent.
GDQS, Global Diet Quality Score; Info, information; Mkt., market; UPF, ultra-processed foods; FSC, fried snacks and confectionery.
Staples including rice, wheat, potatoes, tomatoes and onions were the most frequently consumed foods. Other healthy foods including lentils, leafy vegetables and animal-source foods were consumed intermittently through the week (online Supplementary Table S3). Sweetened tea with sugar accompanied by baked sweets were the most consumed unhealthy foods across all districts (online Supplementary Table S3). Other unhealthy foods like fried snacks, chips, soft drinks and noodles were also consumed at least once a week in all districts. GDQS plus scores (healthy) across districts ranged from 6·6 (sd 3·1) out of 32 in Rangpur to 7·7 (sd 2·8) in Surkhet, indicating a low intake of healthy foods (Table 2 and online Supplementary Figure S4). GDQS minus scores (unhealthy) varied from 9·3 (sd 1·6) out of 17 in Rajshahi to 11·7 (sd 1·7) in Nalanda, reflecting a moderate intake of unhealthy foods.
Eating behaviours and exposure to advertising
Consumption of cooked meals (27 %), snacks (32 %) and beverages (59 %) outside the home was most prevalent in Rajshahi and Rangpur (Table 2 and online Supplementary Figure S5). Over one-third of respondents reported exposure to advertisements promoting unhealthy foods, while less than 20 % reported seeing messages about avoiding unhealthy foods across districts. Most respondents indicated that advertisements for sugar-sweetened beverages were seen through media sources such as television and mobile phones (online Supplementary Figure S6), with respondents from non-poor households more likely to be exposed to such ads (online Supplementary Figure S6). Snacking prevalence was high, with more than two-thirds of respondents reporting consumption of at least one eating occasion outside of breakfast, lunch and dinner (Table 2 and online Supplementary Figure S5).
Food environments
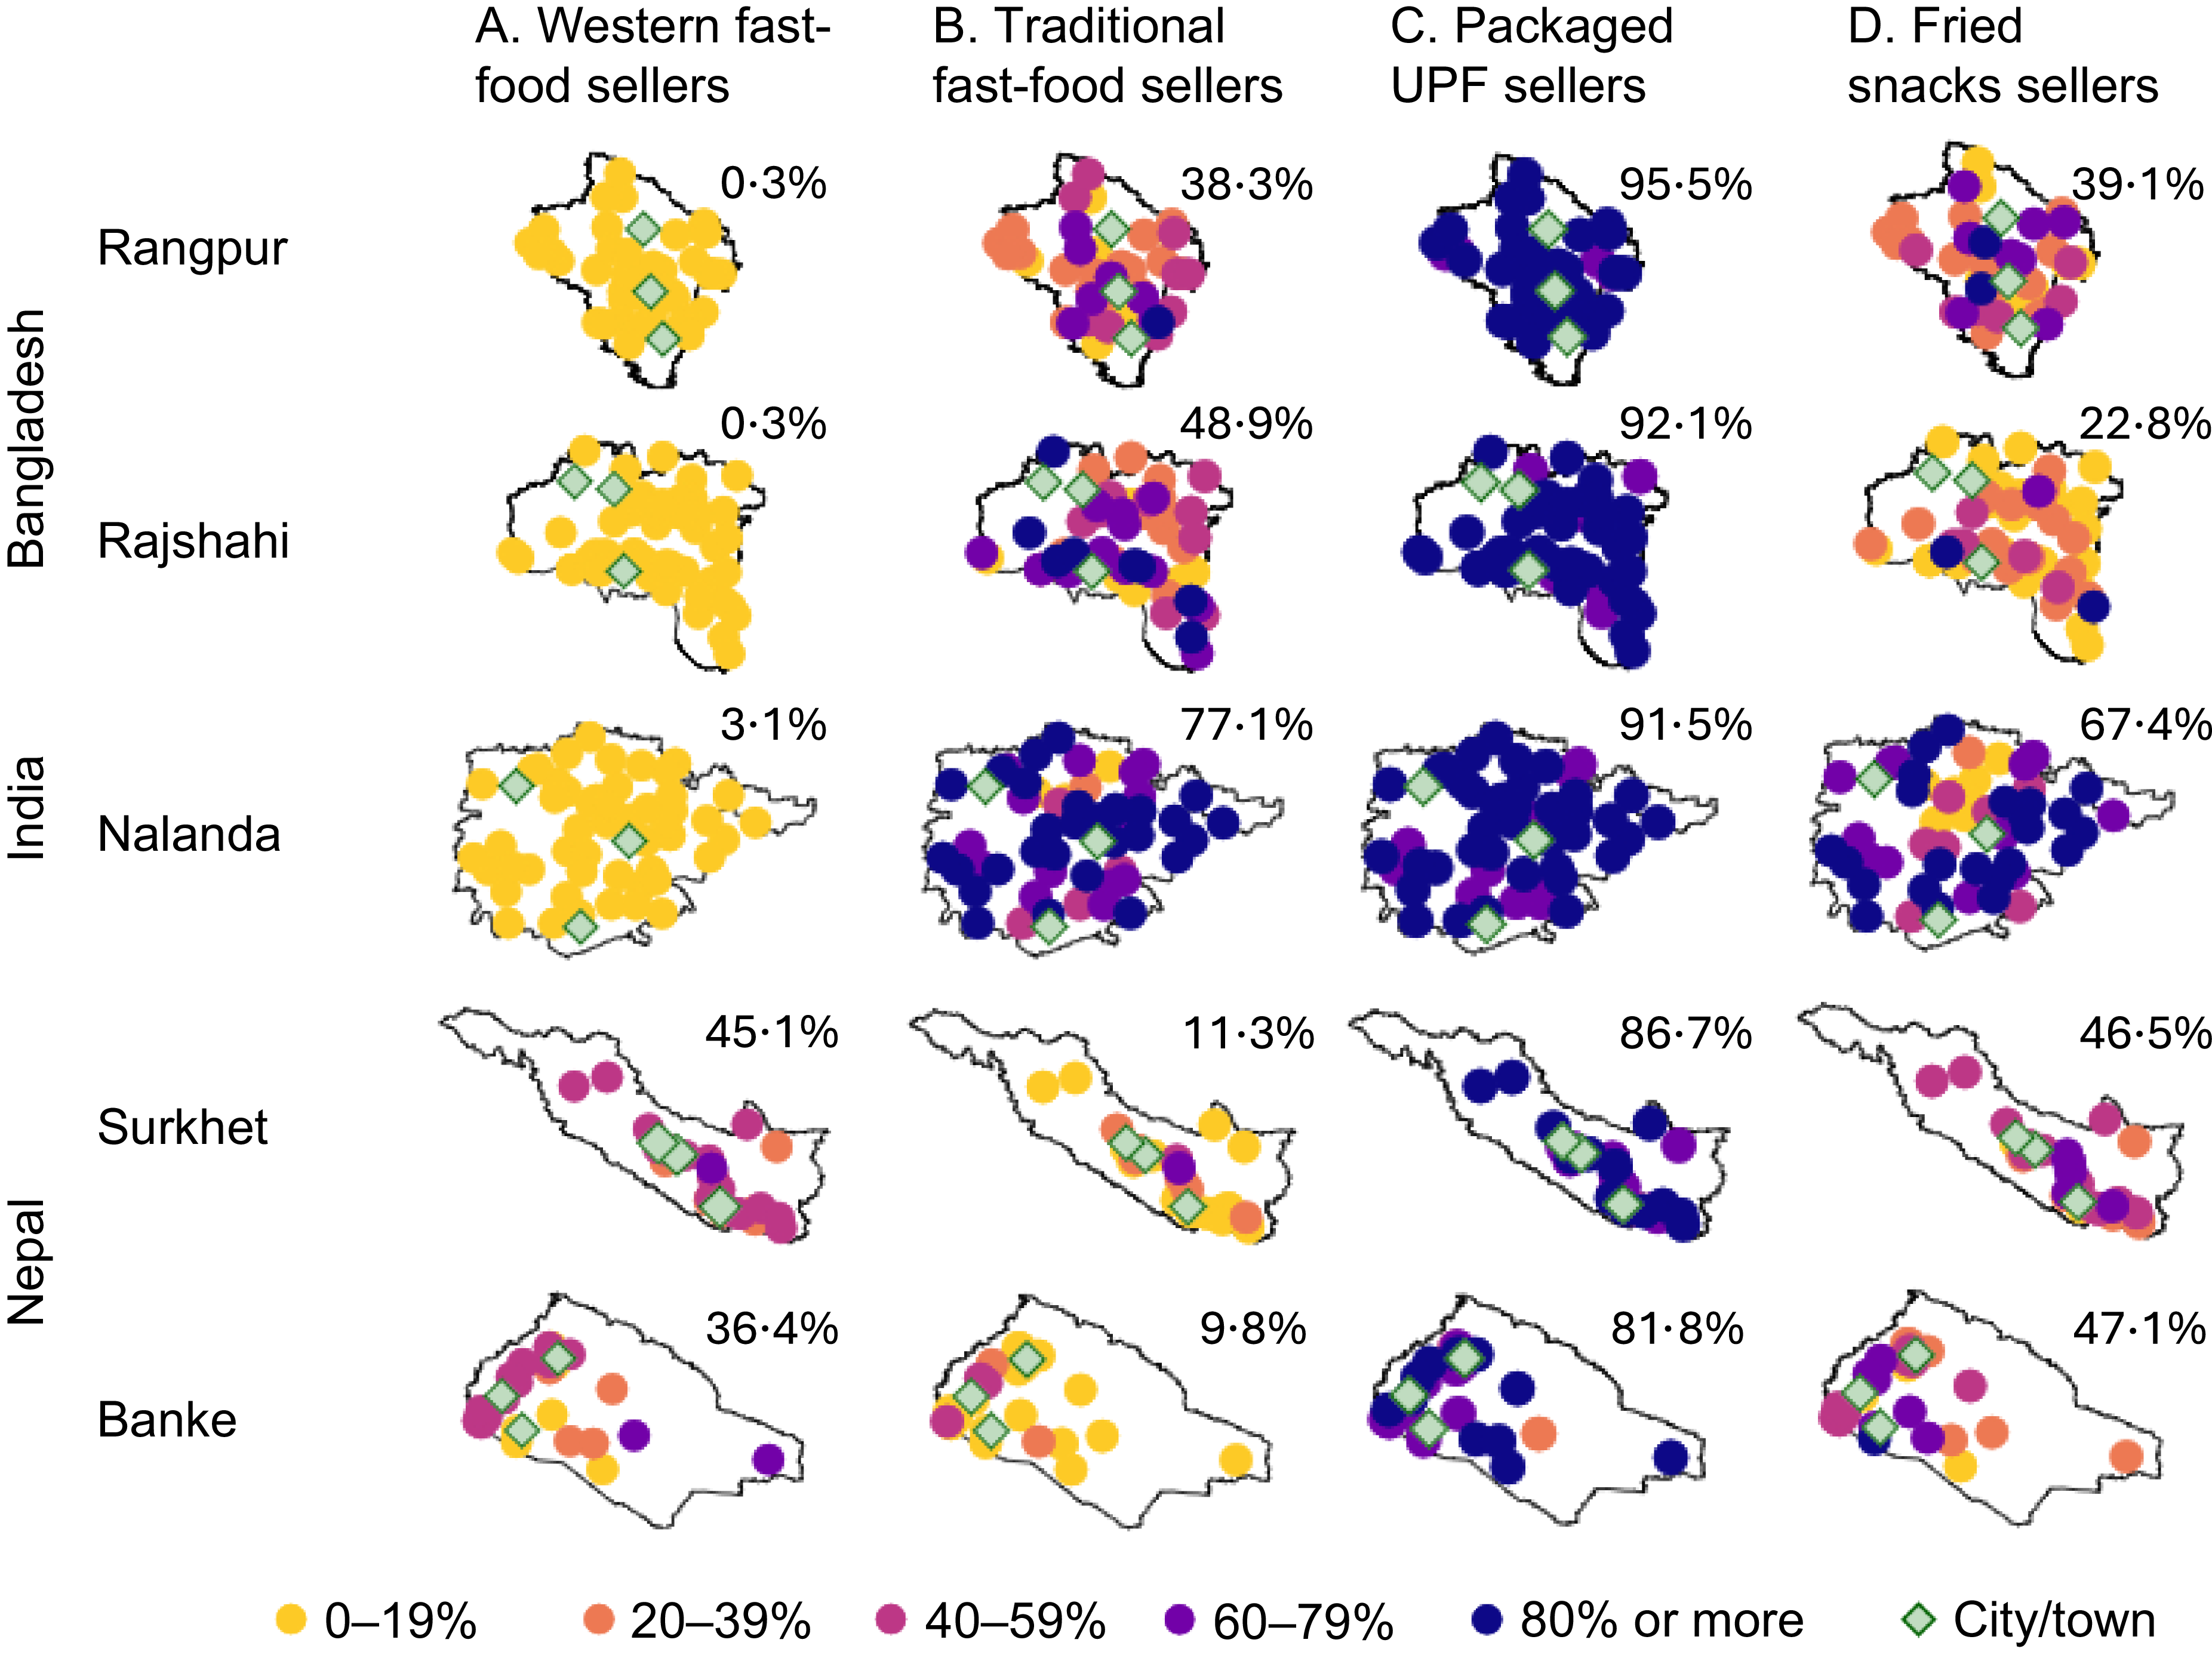
Reported food availability was high across districts (> 80 %) (Table 2). The visibility of fruits and vegetables at retail outlets was lowest in Nalanda (44 %) and highest in Banke (96 %). Packaged UPF sellers were the most common type of retail vendors (> 82 %) (Figure 1 and Table 2). The maps show that packaged UPF sellers are nearly ubiquitous across villages, while traditional and fried snack vendors are more locally clustered and Western fast-food outlets are largely limited to parts of Nepal, highlighting clear differences in the spatial spread of vendor types across districts.
Prevalence of ultra-processed and fast-food vendors in communities across districts. The figure presents the spatial distribution of vendor typologies across five rural districts in South Asia: Rangpur, Rajshahi, Nalanda, Surkhet and Banke. Each point on the map represents a community from the study area. The variation in shading intensity represents the relative prevalence of each indicator, with the indicators divided into five quintiles and represented by the corresponding colours. The diamonds represent major cities or towns in each district. Fried snacks vendors include confectionery sellers. Indicator definitions are in Table 1. UPF, ultra-processed food.

Figure 1. Long description
Panel A: This map shows the prevalence of Western fast-food sellers across five districts: Rangpur, Rajshahi, Nalanda, Surkhet, and Banke. The shading intensity varies from yellow to dark blue, representing the prevalence in five quintiles. Diamonds mark major cities or towns. Panel B: This map illustrates the prevalence of traditional fast-food sellers in the same districts. The color scheme ranges from yellow to dark blue, indicating different prevalence levels. Panel C: This map displays the prevalence of packaged ultra-processed food sellers. The color gradient from yellow to dark blue shows varying prevalence levels. Panel D: This map represents the prevalence of fried snacks sellers, including confectionery sellers. The color scheme ranges from yellow to dark blue, indicating different prevalence levels. Each point on the maps represents a community from the study area.
In Rangpur, Rajshahi and Nalanda, households have relatively high proximity to any market measured using GPS. Moreover, measured proximity closely aligns with the proximity to healthy and unhealthy markets reported by households (Table 2). However, in Banke and Surkhet, the reported proximity to markets from households was higher compared with measured proximity. Across all districts, unhealthy food markets were located closer to households than healthy markets. Market access barriers were most commonly reported by vendors in Rangpur (18 %), Rajshahi (9 %) and Banke (8 %).
Association between affordability, accessibility, availability, desirability and food choice
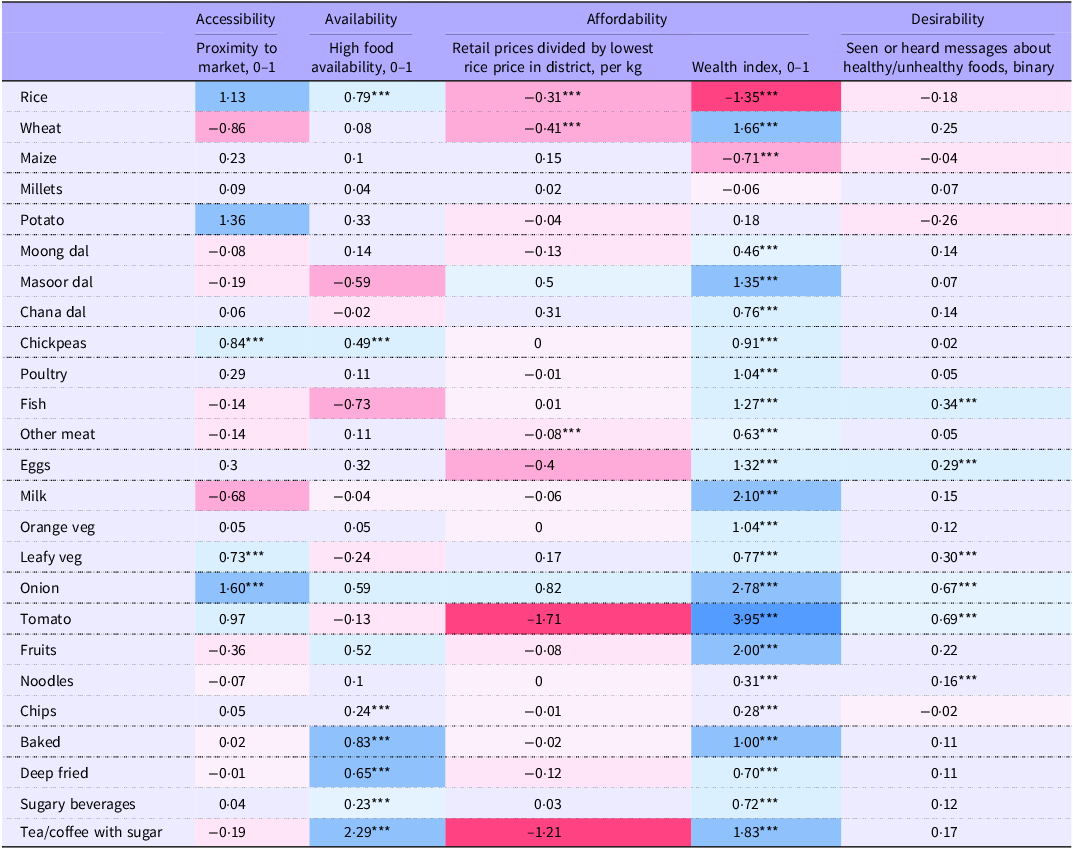
Table 3 and online Supplementary Table S7 present the regression estimates, Bonferroni-corrected P-values and 95 % CI derived from Equation (1). Proximity to markets, as a measure of accessibility, was significantly associated with higher weekly consumption of chickpeas, onions and leafy vegetables (P < 0·0005). Increased reported food availability in markets consistently predicted higher weekly consumption of unhealthy foods such as chips, baked snacks, fried foods, sugary beverages and tea/coffee with sugar (P < 0·0005). Higher retail food prices were negatively associated with most foods or food groups, especially rice, wheat, and other meat (P < 0·0005). Messaging designed to increase desirability of healthy foods (through information on healthy diets) showed positive associations with consumption of fish, eggs, orange vegetables, leafy vegetables, onions and tomatoes (P < 0·0005). Ads on unhealthy foods were significantly correlated with consumption of noodles (P < 0·0005). A combination of desirability (revealed preference) and affordability (higher wealth), proxied by comparing wealth gradients (poor to non-poor households), was a strong predictor of higher consumption of all foods (P < 0·0005), except for millets and potatoes. In interaction models, only rice and animal-source foods showed clearly significantly lower consumption with higher prices among wealthier households (online Supplementary Table S11).
Ordinary Least Squares regression coefficients for associations between affordability, accessibility, availability and desirability and weekly frequency of food consumption

**Bonferroni-adjusted significance at P < 0·0005.
Outcomes are measured as the number of times a food was consumed in the previous week. Coefficients from multivariate regression (equation 1) show associations between weekly food consumption frequency and food environment indicators. Explanatory variables included in the regression are age, sex and district fixed effects. Standard error estimates are clustered at the household level. Coefficients for indicators ranging discretely from 0 to 1 and are interpreted as comparing a value of 1(highest level in sample) to 0 (lowest level). Blue and red cells indicate positive and negative associations, respectively, with colour intensity proportional to coefficient magnitude. Shading facilitates identification of the strongest associations across multivariate regressions. See Table 1 for detailed definitions of indicators used in regression and online Supplementary Table S7 for 95 % CI.
Food environment, socio-economic and behavioural drivers of diet quality
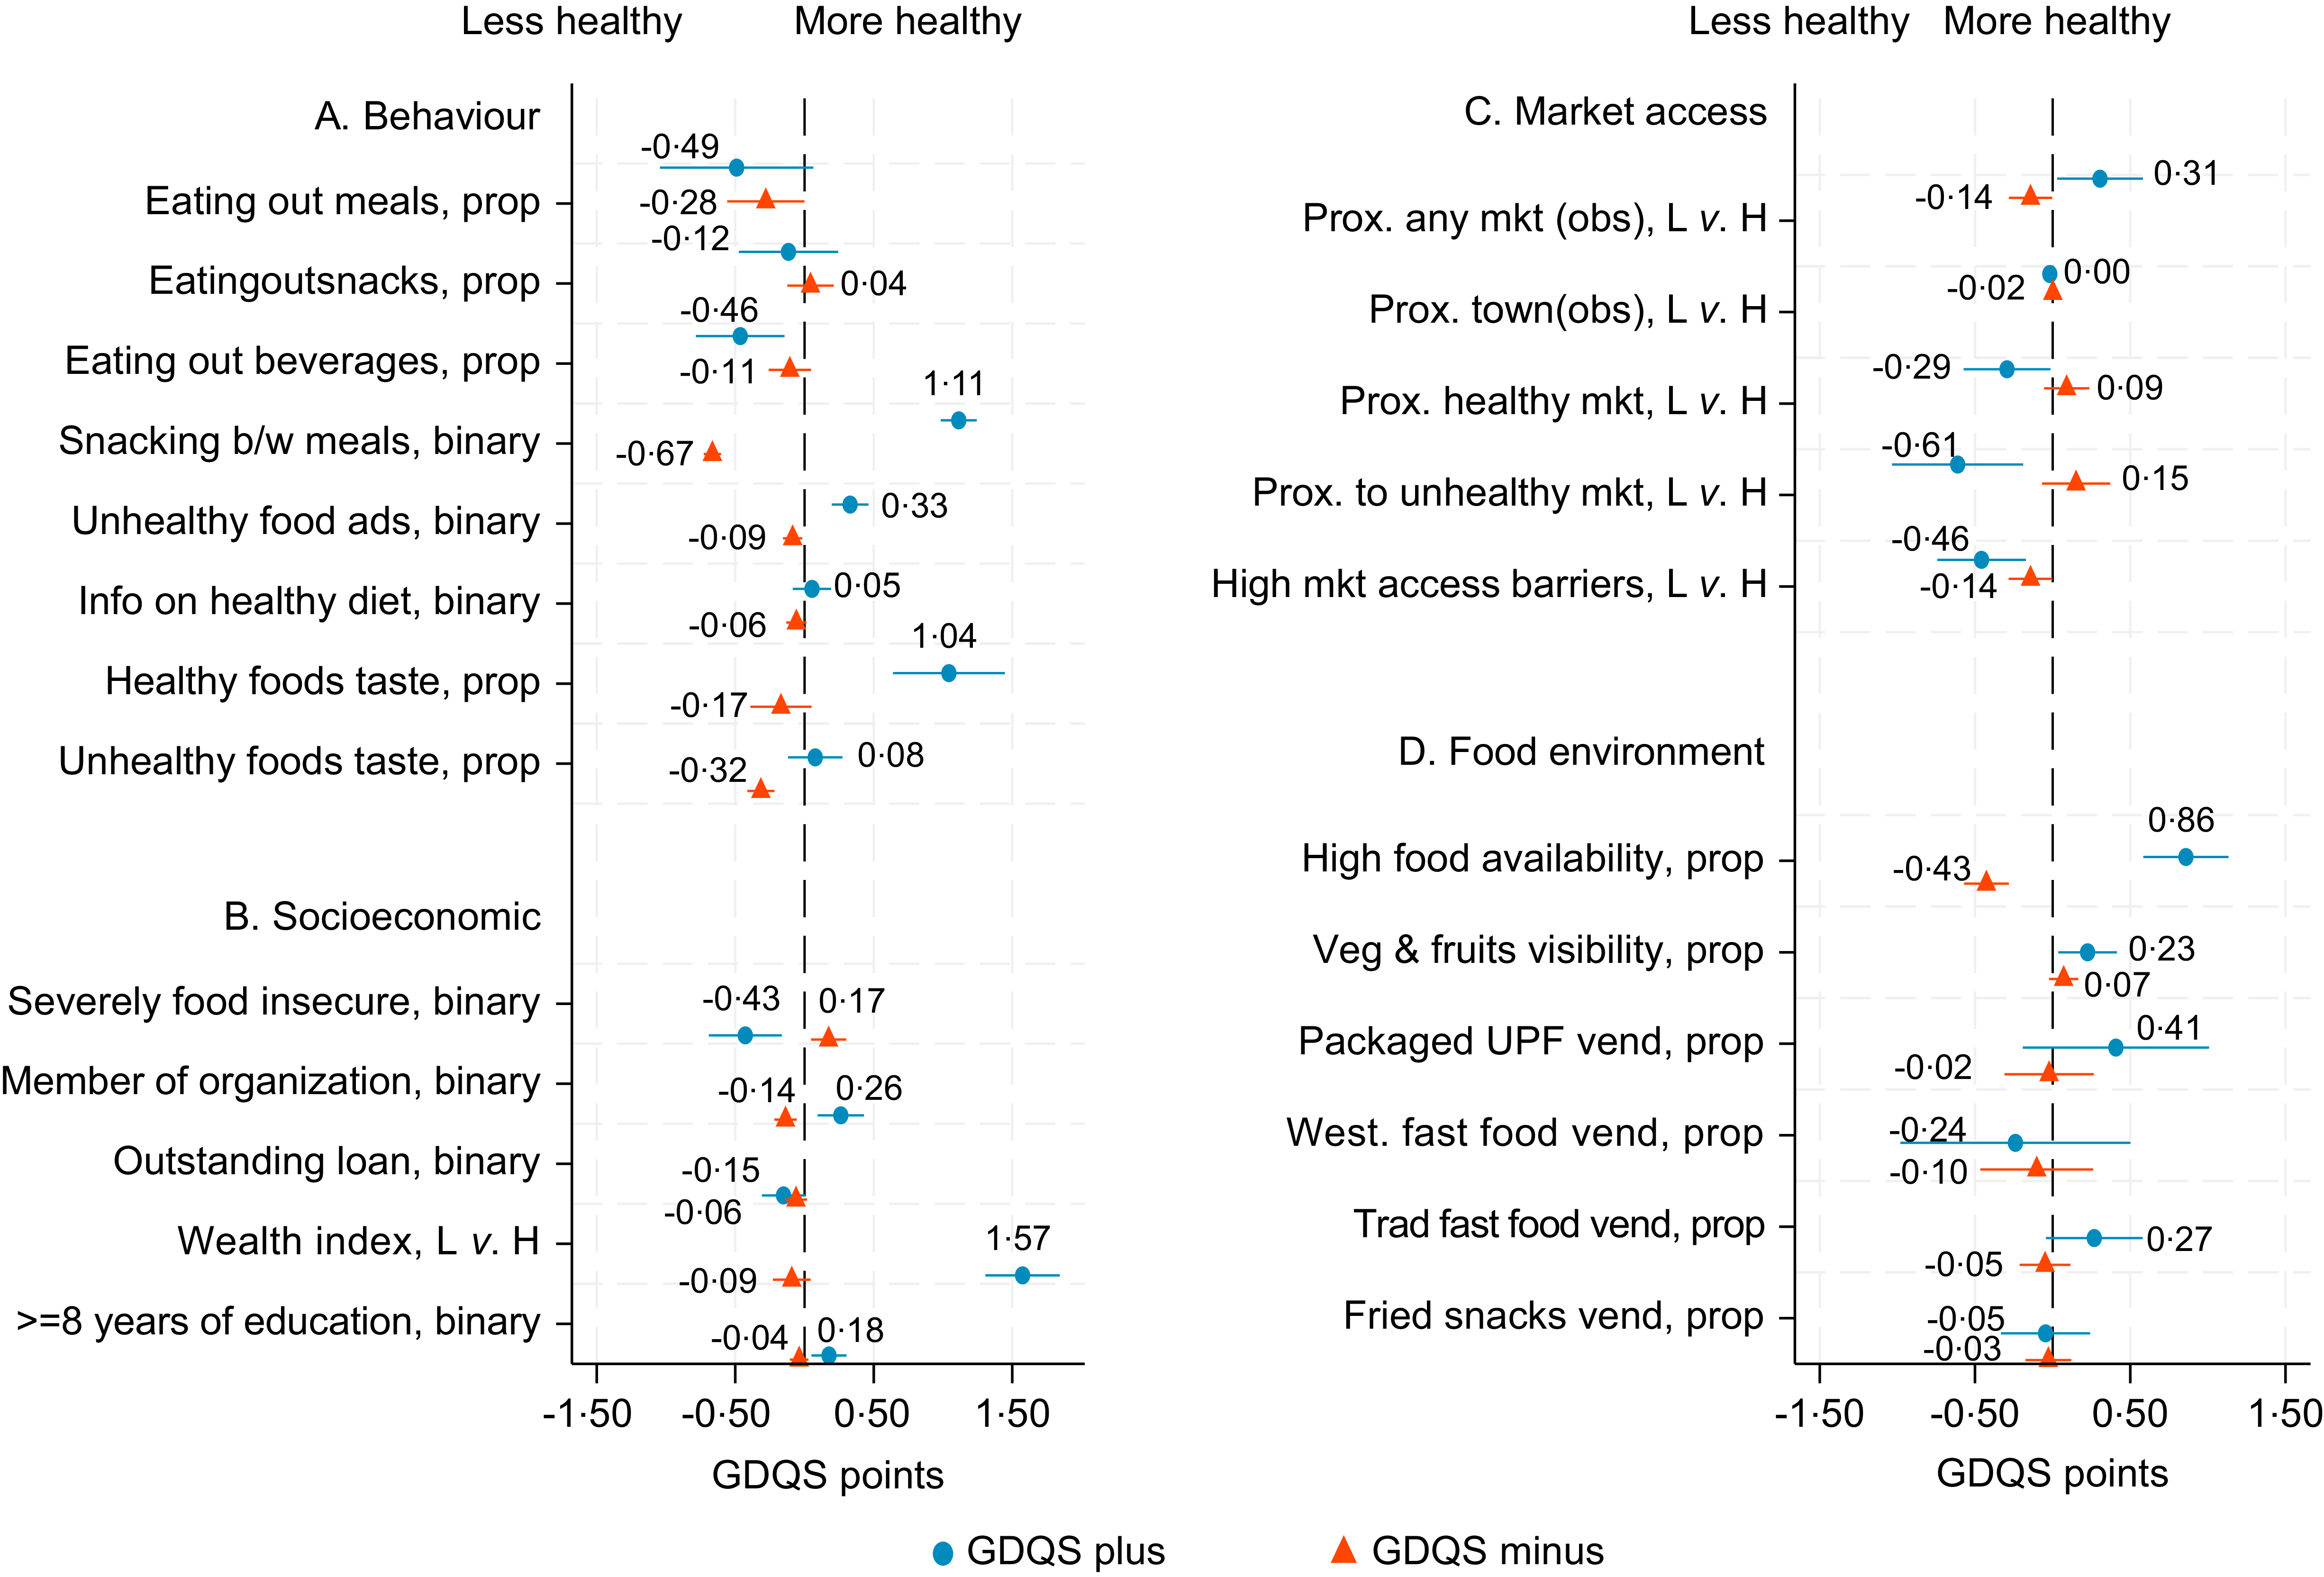
To aid interpretation, GDQS component scores can be contextualised using their empirical distributions in global samples. GDQS plus below 8 and GDQS minus below 10 are generally at the lower (unhealthy) end across countries (online Supplementary Figure S7). Figure 2 and online Supplementary Table S8 present the multivariate regression estimates derived from Equation (2). Snacking emerged as the strongest predictor of diet quality, showing a positive association with both healthy food intake (+1·11 GDQS plus; CI: 0·984, 1·244) and unhealthy food intake (−0·67 GDQS minus; CI: −0·727, −0·603). Liking the taste of healthy and unhealthy foods was also strongly associated with an increase in healthy (+1·04 GDQS plus; CI: 0·639, 1·446) and unhealthy (−0·32 GDQS minus; CI: −0·413, −0·218) food consumption. Consuming cooked meals outside the home predicted greater intake of unhealthy foods (−0·28 GDQS minus; CI: −0·558, −0·001), while drinking beverages outside the home predicted lower consumption of healthy foods (−0·46 GDQS plus; CI: −0·784, −0·145). Exposure to food advertising was associated with higher consumption of both unhealthy foods (−0·09 GDQS minus; CI: −0·155, −0·016) and healthy food consumption (+0·33 GDQS plus; CI 0·197, 0·461).
Food environment, socio-economic and behavioural drivers of diet quality. For details on indicators, refer to Table 1. The figure presents coefficients with 95 % CI from multivariate regression models (see equation 2) examining the association between diet quality indicators, GDQS plus (blue circles) and GDQS minus (orange triangles) across four domains. Scores with positive values indicate higher intake of healthy food and lower intake of unhealthy food. Zero (vertical dashed black line) represents no association. Models A, C and D are adjusted for all predictors from model B. That is, age, sex, household food insecurity, member of organisation, outstanding loan, wealth, education and district fixed effects. Standard error estimates are clustered at the household level. L v. H, low v. high; b/w, between; info, information; Prox, proximity; Mkt, market; UPF, ultra-processed foods; vend, vendor; GDQS, Global Diet Quality Score; obs, observed measurements per 10 km radius.

Figure 2. Long description
The figure contains four panels (A, B, C, D) of scatter plots with error bars, showing the association between diet quality indicators (GDQS plus and GDQS minus) and various factors across four domains: Behaviour, Socioeconomic, Market access, and Food environment. Each panel includes blue circles for GDQS plus and orange triangles for GDQS minus, with the vertical axis representing GDQS points ranging from -1.50 to 1.50. The horizontal dashed line at zero indicates no association. Panel A (Behaviour) includes factors like eating out meals, snacks, beverages, snaking between meals, unhealthy food ads, information on healthy diet, taste of healthy and unhealthy foods. Panel B (Socioeconomic) includes factors like severe food insecurity, membership in organizations, outstanding loans, wealth index, and education. Panel C (Market access) includes factors like proximity to any market, town, healthy market, unhealthy market, and high market access barriers. Panel D (Food environment) includes factors like high food availability, visibility of vegetables and fruits, packaged ultra-processed food vendors, western fast food vendors, traditional fast food vendors, and fried snacks vendors. Each factor’s association with diet quality is shown with coefficients and 95% confidence intervals, adjusted for various predictors including age, sex, household food insecurity, membership in organizations, outstanding loans, wealth, education, and district fixed effects. Standard error estimates are clustered at the household level.
Among socio-economic covariates, being a member of an organisation (+0·26; CI 0·095, 0·429), wealth index (+1·57; CI 1·306, 1·843) and having 8 or more years of education (+0·18; CI 0·050, 0·303) predicted higher intake of healthy foods (GDQS plus). As expected, severe food insecurity predicted lower healthy (−0·43 GDQS plus; CI: −0·691, −0·165) and unhealthy (+0·17 GDQS minus; CI: 0·047, 0·301) food intake, indicating a severe lack of resources.
Proximity to any market was associated with higher consumption of healthy foods (+0·31 GDQS plus; CI 0·029, 0·582) and unhealthy foods (−0·14 GDQS minus; CI −0·282, −0·003), while proximity to unhealthy foods market predicted lower healthy food consumption (−0·61 GDQS plus; CI −1·034, −0·190). Market access barriers (reported by vendor) predicted lower GDQS plus and GDQS minus scores, while greater food availability (reported by consumer) predicted higher consumption of healthy (+0·86 GDQS plus; CI 0·585, 1·133) and unhealthy (−0·43 GDQS minus; CI −0·571, −0·282) foods. Additionally, higher visibility of fruits and vegetables in retail outlets predicted increased consumption of healthy foods (+0·23 GDQS plus; CI: 0·037, 0·414), as was the presence of traditional fast-food vendors (+0·27 GDQS plus; CI: −0·042, 0·579).
Discussion
This study examined the relationship between food environments and diets in rural South Asia. Key findings include (i) the coexistence of healthy and unhealthy foods within the same markets; (ii) a strong positive association between wealth (affordability) and overall food consumption; (iii) a highly prominent role of snacking and taste preferences in shaping diet quality; (iv) higher food consumption with greater market access and food availability and (v) higher intake associated with advertising and market exposure.
The current study reveals that the prevalence of suboptimal diets in five rural districts across Bangladesh, India and Nepal is characterised by low consumption of healthy foods and moderate consumption of unhealthy foods, reflecting a need to promote more balanced dietary patterns. The GDQS plus – a higher score indicating higher healthy food consumption – in these districts falls within the range of many middle-income countries; however, their GDQS minus – a higher score indicating lower consumption of unhealthy foods – is higher than many countries like Mexico (9·7) and Indonesia (9·4) (online Supplementary Figure S9) which shows that there is scope for reversing or at least halting the consumption of unhealthy foods. Further, the prevalence of snacking in between meals is high across all districts (> 60 %), and about a third of the households are exposed to food advertisements. A high proportion of households, particularly in Bangladesh districts, consume food from outside, especially sugar beverages. On the supply side, the availability of both healthy and unhealthy food is high (> 80 %) and a high proportion of vendors sell UPF, traditional fast foods and fried snacks.
Our results show that rural diets in South Asia are under pressure. Emerging food environments resemble ‘food swamps’, a situation reflecting high availability of both healthy and unhealthy foods(Reference Cooksey-Stowers, Schwartz and Brownell23). Although the concept of ‘food swamps’ has primarily been applied in urban, high-income settings, our findings suggest its relevance in rural South Asia, where the coexistence of healthy and unhealthy food availability indicates that diets are shaped not by the absence of healthy options but by the simultaneous presence of energy-dense, nutrient-poor foods alongside healthier alternatives, increasing the likelihood of mixed dietary patterns. Collectively, eating out, high exposure to food advertisements and tastes and preferences for unhealthy foods that correlate with high wealth create an encouraging environment for unhealthy food consumption. Countries like Thailand, China and Brazil that are currently grappling with a high burden of non-communicable diseases had similar food environments before transitioning to diets heavy on unhealthy foods like processed foods and higher proportion of fats and animal-sourced foods in staple diets(Reference Popkin24–Reference Kosulwat26).
We examined four key domains in this study: accessibility, availability, affordability and desirability. A systematic review of rural LMIC finds that food availability and accessibility are the most studied and consistently associated with dietary and nutrition outcomes, while affordability remains a key barrier to healthy diets(Reference Choudhury, Bi and Medina-Lara14). However, the evidence base is limited and heterogeneous, with few high-quality studies and major gaps in other food environment domains, health outcomes and intervention evidence. Previous studies in China and India show positive associations between number and type of food outlets and unhealthy food consumption were reported(Reference Abdumijit, Zhao and Zhang27–Reference Ghosh-Jerath, Kapoor and Barman29). Participants from studies conducted in Myanmar and Namibia reported lack of availability of healthy foods like eggs, dairy products, meat, nuts and seeds, resulting in low dietary diversity(Reference Heim30,Reference Downs, Glass and Linn31) . A longitudinal study from China (CHNS) finds that living 1 km closer to a market is associated with an about 8 % increase in overall dietary quality(Reference Huang and Tian32). Moreover, respondents across studies in Myanmar, Kenya, Nairobi, Vietnam and South Africa reported that higher food prices constrained consumption of nutrient-rich foods, including fruits, vegetables and animal-source foods. While some were able to consume these foods only by purchasing lower quality that were sold at lower prices(Reference Spires, Delobelle and Sanders33–Reference Downs, Fox and Mutuku35). These studies also show that taste, preferences and cultural norms influence food consumption patterns.
Starting with accessibility, our results show households living closer to markets have higher consumption of perishable and market-dependent foods like rice, potato, poultry, etc., whereas households distant from markets have higher consumption of wheat and milk reflecting dietary patterns rooted in local agricultural and cultural preferences and potentially less influenced by markets and policy reforms. These patterns suggest that while strengthening connectivity and market development is required, it is simultaneously important to have policies that strengthen the local food systems through village-level food markets without undermining the traditional dietary patterns.
Next, the availability of food is associated with higher consumption of both healthy and unhealthy foods. The increased availability of healthy food alone may not guarantee healthier dietary patterns because increased exposure to unhealthy foods also creates a trade-off for rural households under affordability constraints. The abundance and prominent placement of unhealthy products in high-traffic retail areas and the presence of ultra-processed food sellers in proximity to households normalise their consumption, potentially exacerbating diet-related health risks(Reference Shaw, Ntani and Baird36). Addressing this requires comprehensive regulatory approaches, such as restricting the placement of unhealthy foods in retail settings and introducing front-of-pack nutrition labelling to highlight the health risks of ultra-processed foods(Reference Shaw, Ntani and Baird36). Several countries have strengthened regulatory frameworks by adopting front-of-pack nutrition labelling models, including Nutri-Score, traffic light labels, health star ratings and warning labels. Engaging with alternative front-of-pack nutrition labelling approaches suitable for rural populations remains a priority research area to establish their relative effectiveness(Reference Shaw, Ntani and Baird36).
Affordability remains a key barrier in South Asia, where nutrient-dense foods such as fruits, vegetables and protein-rich foods are often too expensive for many households(Reference Turner, Aggarwal and Walls16,Reference Herforth, Bai and Venkat37) . Household wealth has a strong association with food consumption. For rural resource-constrained communities, our findings suggest that as wealth increases, households are likely to consume more of both nutrient-dense foods and ultra-processed foods. Moreover, we found that many foods were responsive to prices, and hence addressing affordability also requires innovative policy solutions that involve subsidising healthy foods and taxing unhealthy foods. For the former, integrating nutrient-rich foods into school feeding programmes, combining nutrition-focused behaviour change communication with safety nets like food or cash transfers or piloting food voucher programmes specifically for enabling consumers to access fruits and vegetables while stimulating local markets may be helpful(Reference Hidrobo, Hoddinott and Peterman38,Reference Alderman and Bundy39) . In addition, countries in South Asia struggle with horticultural productivity and supply chain issues for fruit and vegetables, warranting agricultural investments to reduce prices and food losses(Reference Faqeerzada, Rahman and Joshi40). Further, fiscal instruments such as taxes on sugary beverages and foods high in fat, sugar and salt are also critical policy tools to reduce the affordability of unhealthy options and incentivise healthier consumption(Reference Teng, Jones and Mizdrak41).
Lastly, desirability encompasses knowledge of healthy foods, food marketing and personal preferences which in turn determine eating behaviours(Reference Turner, Aggarwal and Walls16). We found that snacking, which we found to be the strongest predictor of higher intake of both healthy and unhealthy foods, may be a lever to increase dietary diversity, particularly in low-income settings where main meals often consist of repetitive food choices in a single day. Snacks provide a more feasible opportunity to introduce nutrient-rich foods which may not be consumed during the main meals(Reference Nicklas, Baranowski and Cullen42). Community, primary health care and school-based campaigns can promote behaviour change by encouraging the use of low-cost, nutrient-dense foods in traditional snacks to improve diet diversity(Reference Hawkes, Ruel and Salm4,Reference Neufeld, Nordhagen and Leroy15) .
Ultra-processed foods and sugary beverages often have attractive packaging, taste appeal and widespread accessibility, making them highly desirable(Reference Monteiro, Cannon and Levy43). Our results show that exposure to information is positively linked to healthy and unhealthy food consumption. The strong presence of ultra-processed food advertisements in South Asia likely offsets some of the positive impacts of healthy food messaging(Reference Monteiro, Cannon and Levy43–Reference Finlay, Jones and Cummins45). Although the WHO has developed specific recommendations to reduce marketing exposure of children and adolescents towards unhealthy food and beverages, South Asians are exposed to advertisements through television as well as print and digital platforms(46). A high volume of advertisements is predominantly observed for UPF, whereas promotion of healthy food options is almost non-existent(Reference Dixon, Scully and Wakefield44,Reference Finlay, Jones and Cummins45) . More research in South Asia is needed on how food intake is affected by exposure to unhealthy food advertisements and healthy food messages through various platforms and in different age groups(Reference Scrinis, Popkin and Corvalan47).
Our results show that exposure to unhealthy food advertising occurs mainly through media channels such as mobile apps and television in South Asia. Fast-food companies are leveraging mass media platforms, particularly during large events without much regulatory oversight(48). For instance, there is no restriction on advertising unhealthy foods and beverages during the plethora of sports events that attract hundreds of millions of daily viewers. Likewise, companies offering quick food delivery are also rapidly expanding into peri-rural areas, with little regulation over the types of foods they promote on their applications(49). For example, in India, popular food delivery apps sold over 50 million pizzas and 20 million sugary drinks and processed noodle packs in 2024, highlighting the effectiveness of corporate marketing strategies and magnitude of the regulatory challenge.
Promoting the desirability of healthy foods, therefore, requires a strategic, multi-pronged approach. Lessons can be drawn from tobacco control campaigns, where impactful campaigns and strict bans on advertising have significantly influenced consumer behaviour. Governments should adopt an equally serious approach to regulating unhealthy foods, as diet-related deaths in South Asia were comparable to those caused by tobacco in 2024(50). Moreover, behaviour change campaigns should adopt corporate-style marketing strategies and use similar platforms to promote healthy food choices and create awareness about the health risks of unhealthy food consumption. Partnering with media outlets to prioritise healthy food advertisements, especially during high-viewership events, can also effectively reach large audiences.
Strengths of the study include the examination of multiple dimensions of rural food environments: affordability, accessibility, availability and desirability, among others. The study uses robust analytical techniques, controlling key covariates, including socio-economic, demographic and geographic factors, to reduce threats from omitted variables. The study leverages primary data to measure the unique characteristics of South Asian food environments, making the findings highly relevant to policymakers and researchers in similar settings. The inclusion of diverse rural districts across South Asia enhances the generalisability of the findings to similar LMIC settings.
However, our study is not without limitations. The cross-sectional nature of the analysis makes it difficult to infer causal relationships due to threats from residual confounding. Thus, the estimates from the regression models should be interpreted as associations rather than causal. Future research should prioritise longitudinal and experimental designs to better identify causal relationships between food environment domains and diet quality. Longitudinal data would allow for examination of how changes in availability, affordability and exposure over time influence dietary behaviour, while experimental or quasi-experimental studies could help isolate the effects of specific interventions (e.g. pricing policies or marketing regulations). In addition, as self-reported recall-based dietary data is subject to inaccuracies, participants’ 24-h or 7-d dietary recall may underestimate or overestimate consumption, especially for less frequent food items. For instance, the association between advertising exposure and both healthier and less healthy food intake should be interpreted with caution. Advertising exposure may proxy unmeasured socio-economic characteristics, such as higher income or greater media access, or commercialised food environments, which are also associated with higher consumption of both healthy and unhealthy foods. The observed association between wealth and advertising is best interpreted as reflecting wealth-driven differences in exposure opportunities, particularly via media access, rather than a causal effect of advertising on wealth. Further, the study provides a static view of food environments and dietary behaviours, missing seasonal variations in food availability or affordability. In addition, taste preference measures are inherently subjective and may reflect self-reported perceptions rather than objective characteristics of foods. However, consistent with microeconomic models of consumer choice, preferences are typically treated as latent determinants of demand that shape food selection conditional on prices and availability. Further, most food environment domains are multidimensional and not fully captured by single measures. For example, desirability is proxied by exposure to food-related messages, which reflects only one dimension of demand. These indicators provide useful signals, but more comprehensive measures are needed in future work. Nevertheless, these results provide a robust foundation for future research, particularly studies that explore the direct linkages between market data and household consumption patterns to further enrich our understanding of rural food environments.
Conclusion
This study shows that healthy and unhealthy foods widely coexist within rural South Asian food environments. Affordability is a key driver of diets, with wealthier households consuming more of all types of foods. Greater market access and food availability further expand this choice set, increasing overall consumption rather than selectively improving diet quality. Within this environment, everyday behaviours such as snacking and taste preferences play an important role in shaping how people choose between healthy and unhealthy foods. These findings highlight two key policy priorities: improving the relative visibility, affordability and convenience of healthier foods within existing markets, and shaping snacking patterns and taste preferences towards healthier options through behaviour change approaches embedded in everyday food environments. While snacking offers a potential entry point to increase dietary diversity and reduce consumption of unhealthy foods at relatively low cost, it also correlates strongly with higher unhealthy food intake, suggesting the need for carefully crafted interventions. These insights call for a multisectoral approach, uniting policymakers, producers and consumers. The future of South Asia’s food systems lies in ensuring that modernisation nurtures rather than erodes the foundations of rural diets.
Supplementary material
For supplementary material/s referred to in this article, please visit https://doi.org/10.1017/S0007114526107831
Acknowledgements
Funding for this work was provided by the CGIAR Trust Fund through the Transforming Agrifood Systems in South Asia initiative and the CGIAR Better Diets for Nutrition Program.
A. C.: Conceptualisation-Supporting, Software-Lead, Data curation-Equal, Investigation-Equal, Visualization-Equal, Formal analysis-Equal, Methodology-Supporting, Writing – original draft-Equal and Writing – review & editing-Equal; S. P. S.: Methodology-Supporting, Visualization-Equal, and Writing – review and editing-Equal; W. J.: Methodology-Supporting and Writing – original draft-Supporting; N. K. M.: Writing – original draft-Supporting; P. M.: Funding acquisition-Lead, Project administration-Lead; S. C.: Conceptualisation-Lead, Formal analysis-Equal, Methodology-Lead, Data curation-Equal, Investigation-Equal, Visualization-Equal, Writing – original draft-Equal, Writing – review and editing-Equal and Supervision-Lead. All authors have read and agreed to the final version of the manuscript. The authors used a large language model (ChatGPT, based on GPT-5.3, OpenAI) to assist with language editing and clarity of expression.
The authors declare that there are no conflicts of interests.
The datasets analysed during this study are publicly available and can be accessed at https://www.cgiar.org/news-events/news/open-access-agrifood-system-data-from-4000-households-across-bangladesh-india-and-nepal/ and https://dataverse.harvard.edu/dataverse/IFPRI/?q=%22TAFSSA+District+Agrifood+Systems+Assessment%22+AND+%22Market%22+AND+%22Retail%22


 Open access

