


The political and social consequences of studying abroad have long been a topic of interest, given that international students often occupy influential positions upon returning home and can serve as channels for transnational diffusion of political norms. Studying abroad sits at the center of foundational debates in political socialization over whether the political values of young adults are reshaped by exposure to alternative institutions, as well as debates over how citizens form judgments about their own political institutions (Chu Reference Chu2021; Zhao Reference Zhao2019). While scholarship on democratic diffusion has generally concluded that migrants, including short-term visitors such as students, often internalize the political norms of host countries and integrate them into their identities (Chauvet and Mercier Reference Chauvet and Mercier2014; Levitt Reference Levitt1998; Mercier Reference Mercier2016; Spilimbergo Reference Spilimbergo2009), more recent work has challenged these conclusions. In particular, research on Chinese students in the United States over the past decade finds that rather than adopting more liberal or critical perspectives towards their home institutions, many develop stronger patriotic sentiments and heightened support for their government (Dong Reference Dong2017; Hail Reference Hail2015; He Reference He2014; Jiang Reference Jiang2021). These conclusions have implications for policy making. Research suggesting that overseas study may not instill liberal values, and may even reinforce support for authoritarian regimes, has fueled calls in some democracies to restrict visas for students from authoritarian contexts amid fears that such exchanges aid strategic competitors.
In this paper, we intervene in this debate by conducting a four-year longitudinal study (2019–2023) of 987 Chinese college students in China and the United States, tracking them from the start of their freshman year through their graduation. Prior research on Chinese international students has largely relied on small, cross-sectional samples or samples observed over a short duration. These studies often lack baseline measures of students’ attitudes before extended exposure to the US education system and do not include comparisons with students who remain in China for their college education. Our study addresses these gaps through a longitudinal design with comparison of Chinese students who pursue higher education in the United States with those who remain in China for university, allowing us to isolate changes among overseas students during their time in the United States from pre-existing differences and broader temporal trends affecting all students. This design provides stronger analytical leverage for understanding the relationship between studying abroad and preferences.
Our findings challenge dominant assumptions in the literature in three key ways. First, we show that at the beginning of freshman year, before any extended exposure to the US social and political environment, students who attend college in the United States already differed significantly in their ideology – organized, coherent preferences (Converse Reference Converse and Apter1964) – from their peers in China. Compared to students in China, students studying in the United States are more pro-democratic and more pro-market, as well as less traditional and less nationalistic in their policy preferences. This suggests that selection plays an important role in shaping observed differences in beliefs and preferences. Second, contrary to expectations that students will assimilate to their host country’s democratic political values or redouble support for China’s political system, we find that ideology among Chinese students in the United States, as well as those in China, remains remarkably stable over their four years of college. However, we also observe a notable decline in support for China’s political institutions and system as well as identity-based patriotism following the implementation of China’s stringent pandemic control policy in 2022, with stronger shifts among students in the United States. Taken together, these findings push against an assumption, implicit in much of the diffusion and socialization literature, that overseas study primarily operates by treatment in the host country. Outcomes typically attributed to host-country exposure may instead be due to selection, and migrants’ assessments of their home country from abroad may matter alongside what they learn from host-country institutions.
Changes in Ideology, Attitudes, and Identity among Overseas Students
A large literature on democratic diffusion suggests that students from non-democratic contexts may develop greater attachment to democratic norms and preferences when studying in democratic societies. Migrants, including short-term visitors such as international students, adopt democratic values while living in democracies and transmit them back to their countries of origin (Grewal Reference Grewal2020; Levitt Reference Levitt1998; Mercier Reference Mercier2016; Pérez-Armendáriz and Crow Reference Pérez-Armendáriz and Crow2010; Spilimbergo Reference Spilimbergo2009). However, research focused on overseas Chinese students has largely come to the opposite conclusion: that studying in democracies – particularly the United States – reinforces, rather than erodes, support for China’s status quo political institutions. Based on analysis of online forums and interviews, He (Reference He2014) argues that overseas Chinese students’ primary and secondary education in China has primed them to act as defenders of China in the face of perceived Western attacks while abroad. Several studies suggest that Chinese students react negatively when encountering criticisms of China abroad (Hail Reference Hail2015), and such encounters may increase identity-based patriotism and support for the Communist Party of China (He Reference He2014; Jiang Reference Jiang2021). Dong (Reference Dong2017) treats Chinese students’ rising patriotism and antagonism against democratic values as given, attributing it in part to disillusionment with democratic societies that fail to meet students’ expectations.
The results from existing work on Chinese overseas students may be due to a lack of specificity of what outcomes are affected by overseas study and how they are affected. Moreover, most studies rely on small samples of interviews or online posts without baseline measures for comparison. Critically, they do not include parallel data from students who remain in China. Without such comparisons, it is difficult to determine whether observed shifts reflect the overseas experience or broader cohort-wide trends among Chinese youth.
We address these gaps by specifying two mechanisms through which overseas study may affect students abroad – social contact and comparison – and by distinguishing among ideology, attitudes, and identity as distinct outcomes that may respond differently to overseas exposure.
Ideology, Attitudes, and Identity
We distinguish among ideology, attitudes, and identity. Following Converse (Reference Converse and Apter1964), we define ideology as a coherent and constrained system of political beliefs – preferences regarding political institutions, the economy, society, and the role of the nation – that help individuals interpret events as they reflect a sense of how the world should work. Decades of research in democratic contexts have consistently found ideological predispositions to be stable in adulthood (Campbell et al. Reference Campbell, Converse, Miller and Stokes1960; Peterson et al. Reference Peterson, Smith and Hibbing2020; Zaller Reference Zaller1992), but malleable in childhood and in early adulthood due to the socialization influences of family and schooling (Jennings and Markus Reference Jennings and Markus1984; Alwin and Krosnick Reference Alwin and Krosnick1991; Stoker and Jennings Reference Stoker and Jennings2008). In contrast, attitudes are evaluations of specific political objects, such as the government or a political party, which research has found to be responsive to events and elite cues (Lenz Reference Lenz2012; Jennings and Niemi Reference Jennings and Niemi2014). Lastly, identity includes three components: (a) categorical identification, which refers to the groups to which individuals perceive themselves as belonging; (b) affective attachment, which captures warmth and pride individuals feel towards those groups; and (c) perceived group status, which reflects assessment of how well those groups are performing relative to others (Oyserman et al. Reference Oyserman, Elmore and Smith2012; Tajfel Reference Tajfel1981).
These concepts are related but analytically distinct. Ideology provides a broad interpretive framework that can shape how individuals understand political life, whereas attitudes reflect evaluations of specific political objects that may change with new information or events (Zaller Reference Zaller1992). Identity can shape both ideology and attitudes by linking political judgments to group membership and status concerns (Tajfel Reference Tajfel1981). At the same time, these components may not move together. Individuals may revise their evaluations of a particular government or policy without altering their broader ideological commitments or categorical identification, especially when new events change evaluations of performance but not underlying values.
Baseline Mechanism: Evaluative Updating
Before disentangling the effects of overseas study, we establish a baseline expectation: regardless of physical location, individuals engage in evaluative updating. Theories of performance legitimacy argue that people form attitudes towards political systems based in part on their observations of how well those systems perform, especially during salient events when performance becomes highly visible (Easton Reference Easton1975; Zhu Reference Zhu2011). When a government handles a crisis well, approval tends to rise; when it performs poorly, approval tends to decline.
Evaluative updating therefore primarily affects attitudes but not ideology or categorical identity. Observing that a government performed poorly in a specific instance does not necessarily alter one’s underlying beliefs about what constitutes a good political system, nor does it alter categorical identification: a person does not cease to identify as Chinese because their government mishandled a crisis. However, evaluative updating may affect perceived group status and affective identification. Because affective attachment tracks perceived group performance – individuals bask in reflected glory after success and distance themselves after failure (Cialdini et al. Reference Cialdini, Borden, Thorne, Walker, Freeman and Sloan1976; Bizman and Yinon Reference Bizman and Yinon2002) – visible policy failures can depress patriotic affect and perceived group standing.
Importantly, evaluative updating should operate for both domestic and overseas students. Both groups observe the same major events, consume overlapping streams of information from domestic media, and can revise their assessments accordingly. This baseline is important because it implies that any attitudinal shifts observed among overseas students that also occur among domestic students in China should not be attributed to the effects of overseas experience. The absence of domestic comparison groups in prior research on Chinese overseas students means that evaluative updating may have been conflated with overseas-specific effects.
Overseas Education
What does overseas education do? We argue that two mechanisms may shape how overseas study propels or hinders democratic diffusion: (a) social contact, and (b) comparison.
Social contact
Drawing on social identity theory and contact theory (Tajfel Reference Tajfel1981; Crisp and Turner Reference Crisp and Turner2009), the social contact mechanism posits that meaningful interpersonal contact and socialization with outgroup members can reduce intergroup anxiety, foster empathy and perspective-taking, and ultimately reshape self-conception and identity (Wang et al. Reference Wang, Johnston and Wang2021). Applied to overseas students, sustained interactions with host-country nationals may shift categorical identification – for example, from exclusively Chinese towards bicultural or more cosmopolitan self-understandings. Such identity change can lead students to revise both attitudes and ideology, not because they receive new information about government performance, but because their sense of who they are changes. A student might come to value press freedom not because they conclude that China’s censorship performs poorly, but because the norm becomes part of their political identity. When identity drives change, we expect both ideology and attitudes to evolve gradually as students’ underlying self-understandings shift, rather than changing abruptly in response to events. The effects of social contact should be moderated by social integration: for students with more host-country friends, cross-cultural interactions should exhibit larger changes. Identity shifts produced through social contact should also be relatively persistent, and resistant to movement in the face of salient events or shocks.
Comparative reference points
The second mechanism, comparative reference points, is based on the idea that overseas students may experience a stronger version of evaluative updating because they gain a comparative reference point unavailable to those who remain at home. Individuals rarely evaluate regime performance in a vacuum but relative to available benchmarks (Festinger Reference Festinger1954; Besley and Case Reference Besley and Case1995; Kayser and Peress Reference Kayser and Peress2012; Huang Reference Huang2015). Overseas students observe home-country events while simultaneously observing experiences in the host country, making performance differences more salient. This mechanism is a cognitive extension of evaluative updating as it operates through the same channel – assessment of performance – but the presence of a reference point can amplify perceived successes or failures. Its predictions therefore resemble evaluative updating but differ only in magnitude: overseas students should exhibit larger attitudinal shifts and more pronounced changes in perceived group status and affective identification in response to the same salient events. However, because comparison does not change what individuals value or how they categorize themselves, ideology and categorical identity should remain stable. We expect this mechanism to be event-driven, and moderated by information access – students with greater exposure to host-country institutions and information should exhibit stronger responses. These changes should also be reversible if performance shifts.
It is important to note that social contact and comparative reference points are not mutually exclusive and may operate simultaneously. A student could form new categorical identities through deep friendships with host-country peers while also updating their evaluation of the political system of the home country by comparing how home and host-country governments respond to crisis. However, the two mechanisms have different observable implications. Gradual change in ideology accompanied by shifts in categorical identification among overseas students, especially those with greater social integration, would be consistent with social contact. In contrast, abrupt shifts in attitudes following salient events among both overseas and domestic students – but with greater magnitude among overseas students – together with changes in affective attachment and perceived group status, would be more consistent with the evaluative updating amplified by comparison.
Data and Methods
To examine how studying abroad shapes students’ ideology and attitudes, we conduct a longitudinal study of Chinese students in the United States and in China between 2019 and 2023.
Student Sample
We recruited Chinese students studying in the United States and in China using a snowball sampling strategy. In the United States, we recruited through the Chinese social media platform WeChat and through US-based Chinese student networks with the assistance of ten research assistants based at five US colleges.Footnote 1 The research assistants recruited first-year undergraduates at their own universities and at other universities through their personal networks. To broaden our reach, our research team also employed a snowball sampling strategy to contact Chinese students at as many of the top 100 US universities (according to the 2019 US News rankings) as possible. Recruitment in China followed a similar approach, including outreach via WeChat and assistance from research assistants at three top-tier public universities in Beijing, Shanghai, and Guangzhou.Footnote 2 In addition, research assistants in China conducted in-person outreach at locations such as student canteens.
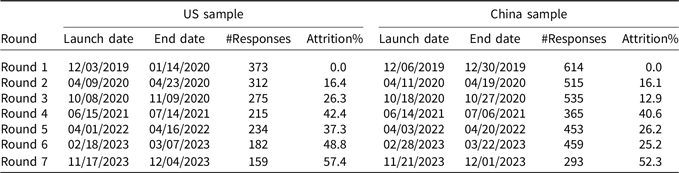
For both samples, initial recruitment was based on the following criteria: students had to be (1) Chinese nationals, (2) born between 1995 and 2002,Footnote 3 (3) enrolled in a four-year college, (4) in their first year of study, and (5) have completed their high school education in mainland China. This resulted in the recruitment of 373 consenting student participants from 66 US institutions for the first wave of our survey. We refer to this group as the US sample.Footnote 4 A total of 614 first-year consenting student participants from the three Chinese universities, which we refer to as the China sample, were recruited (see Table 1 for the number of respondents and attrition rates by survey wave). As shown in Table A1 in the Supplementary Materials (SM), due to selection into studying abroad and enrollment at elite colleges in China, our samples over-represent students from more affluent families and those whose parents are college educated and therefore do not constitute a representative sample of Chinese college-educated youth; nevertheless, this group remains substantively important to study as it is more likely to produce future elites. Note that students in the US sample are enrolled at US universities, but following the widespread shift to online instruction in 2020, many respondents in the US sample were temporarily residing in China while continuing their studies remotely (see Table A1 in the SM).
Survey attrition rate across rounds

Table 1. Long description
The table presents survey attrition rates across seven rounds for US and China samples. It has seven rows and eight columns. The columns are labeled Round, Launch date, End date, #Responses, and Attrition% for both US sample and China sample. The rows are labeled with round numbers from 1 to 7. Each row provides the launch date, end date, number of responses, and attrition percentage for each round. For the US sample, the attrition percentages are 0.0, 16.4, 26.3, 42.4, 37.3, 48.8, and 57.4. For the China sample, the attrition percentages are 0.0, 16.1, 12.9, 40.6, 26.2, 25.2, and 52.3.
Survey
We conducted seven rounds of surveys from the fall of 2019, when students began their freshman year, to fall of 2023, after most students had received their undergraduate degree. Each survey was fielded for approximately one month for respondents in China and the United States (see Figure 1). Respondents in both samples were compensated in cash or by gift card, and recontacted via their university and personal email addresses they provided during the initial recruitment.
Survey timeline.
Note: the figure displays the timeline of all seven survey waves for both the United States (blue) and China (red) samples. The length of each rectangle represents the start and end dates of the corresponding survey wave. The shaded gray area marks China’s 2022 Zero-Covid lockdown period (April to June 2022).

Table 1 shows the launch and end date for each survey round, the number of survey responses, and the attrition rates across the US and China samples. Attrition was relatively low through Round 3 in both samples but rose in Round 4 – likely due to disruptions caused by Covid-19, such as remote or online instruction. While attrition rates remained similar in the US sample in subsequent rounds, attrition was low in Rounds 5 and 6 in the China sample. It was not until the final round, which took place after student graduation and was affected by changes in participant availability, that attrition was higher in the China sample. We discuss the potential influence of attrition in the results. (See Table A1 in the SM for summary statistics of each round. Basic demographics, family background, and media consumption remain stable across survey waves.)
The surveys we fielded contained eight main sections: (1) students’ basic demographics and family background, (2) education, including major and course selection, (3) graduation plans, (4) cultural exposure and socialization experiences, (5) media consumption, (6) ideology, patriotism, and regime support, (7) Covid-19 experiences, and (8) other ad hoc questions.
Measurement
Questions related to ideology, patriotism, and regime support were included in all rounds. Converse (Reference Converse and Apter1964) defines ideology as the ‘configuration of ideas and attitudes in which the elements are bound together by some form of constraint or functional interdependence’. We adopt this definition. Following Pan and Xu (Reference Pan and Xu2018) and Pan and Xu (Reference Pan and Xu2025), we measure ideology using a large battery of questions grouped into four domains: political, economic, social, and nationalistic policies.Footnote 5 Questions from other sections of the survey were not included in every round, and some were adapted over time to reflect students’ progression through college (see Section A1 in the SM for details on each survey section).
We measure ideological preferences over time using an Item Response Theory approach. Specifically, for each policy domain, we estimate a graded response model suited for ordinal responses – such as the answers of students in our sample to policy questions – and allow for missing data (Samejima Reference Samejima1969). The model is implemented in BUGS using full Markov chain Monte Carlo methods (Curtis Reference Curtis2010). For each domain, the estimated ideological scores (defined as the mean of the posterior distribution) are standardized using responses from Round 1 as the baseline. That is, the combined distribution of the US and China samples in Round 1 has a mean of zero and a standard deviation of one.Footnote 6 We construct four ideological measures: a political liberalism index, which captures preferences for political institutions such as free speech and elections; a free market index, which reflects preferences on economic policies and the relative roles of the market and state in resource allocation; a traditionalism index, which captures preferences related to traditional values, norms, and practices – particularly those associated with Confucianism – as well as views on issues such as sexual freedom and same-sex marriage; and a nationalism index, which reflects preferences related to China’s place in the international order and how international relations work (for a list of questions in each index, see Section A1 in the SM).
In addition, using the same methodology, we construct two additional measures: a patriotism index, which captures affective identification with Chinese identity and affective polarization towards outgroups; and a regime support index, which measures evaluation and support for the current political regime in China. For detailed question wording, see SM A1. It is important to note that we use ‘nationalism’ to refer to a dimension of ideology, whereas we use the term ‘patriotism’ to denote pride in identifying as Chinese and perceived group status. What we term patriotism is sometimes labeled nationalism in prior research on Chinese overseas students.
Interviews
During the summer of 2023, we randomly sampled 20 per cent of respondents who participated in Round 6 and reached out to those who had indicated in Round 6 of the survey that they were willing to be interviewed. We contacted interview candidates via email and text from the contact information they provided. In total, we conducted 30-minute semi-structured interviews via Zoom with seventeen participants from the China sample and ten participants from the US sample in June 2023. Two authors conducted the interviews in the respondents’ preferred language (English or Mandarin). The detailed interview questions are in Section A2 in the SM.
Initial Differences in Ideology
Overseas Chinese students attending college in the United States exhibit substantial ideological differences from students who remain in China for higher education at the beginning of their freshman year. Figure 2 shows the baseline differences between the two groups in political, economic, social, and nationalism domains. Relative to students enrolled in Chinese universities, students enrolled in US institutions are more pro-democratic, more supportive of market allocation, more socially liberal and cosmopolitan. They express stronger support for liberal political institutions, such as free speech and competitive elections, and greater support for market mechanisms in allocating resources. They are also more supportive of policies such as legalization of same-sex marriage and sex education in primary school, and less supportive of state-led nationalism, where the state is the key actor defending national interests. Respondents in the US sample report lower levels of patriotism and weaker support for the Chinese Communist Party. These contrasts highlight meaningful pre-college differences that precede any extended exposure to the US social or educational environment.
Ideological preferences at the baseline.
Note: the figure shows that students in the United States and China have different preferences at the beginning of freshman year (Round 1 in Dec. 2019). All measures are based on responses from both samples combined and are standardized to have a mean of zero and a standard deviation of one. The means for each sample are indicated by the vertical line, with the red solid for the China sample and the black dashed line for the US sample. The distribution in blue is for the US sample and the red one is for the China sample. The p-value for the difference in means between the two samples for each index is less than 0.01.

These baseline differences suggest that a two-sided selection process – selection by students along with selection by US universities – is at work. On the student side, students (and their families) select into applying to universities in the United States. Based on analysis of respondents’ participation in the SAT/ACT, which is required for admissions to US universities, versus the Gaokao, China’s domestic university entrance exam, sorting into the US undergraduate track may occur well before the formal college application stage (see SM Section A5.1), as few in the US sample report taking the Gaokao exam. This further suggests that observed baseline differences reflect earlier educational and family-level selection rather than short-term exposure to US institutions.
On the institutional side, US universities act as gatekeepers, selecting applicants based on academic preparation, English proficiency, extracurricular records, and ability to pay tuition. In contrast to China’s Gaokao-centered system, admission to US institutions is not only based on standardized tests (for example, SAT/ACT) but also on high school performance, recommendation letters, and demonstrated financial capacity. Institutional incentives, including reliance on full-tuition-paying international students, may have broadened access for applicants with sufficient economic resources and credentials. As a result, admission decisions likely select on observable academic and socio-economic characteristics that, perhaps are not designed to screen for, but nonetheless correlate with political orientations.
Ideological Stability
Given prior work suggesting that ideology is most likely to shift during young adulthood (Alwin and Krosnick Reference Alwin and Krosnick1991; Jennings and Markus Reference Jennings and Markus1984; Stoker and Jennings Reference Stoker and Jennings2008), it is striking that we find substantial stability in the ideological preferences of overseas students regarding political liberalism, free market orientation, and traditionalism during their four years of college.
Figure 3 shows the means and the 95 per cent confidence intervals for each policy domain across four rounds (Round 1, Round 3, Round 5, and Round 7) for the US (blue) and China (red) samples. In the political, economic, and social domains, there are no statistically significant changes over the course of the four years of undergraduate education for the US sample. The stability of political, economic, and social preferences over all survey rounds for the US sample is important as it suggests that there was no differential attrition related to ideology.
Stability in ideological preferences (2019–2023).
Note: this figure includes all respondents who participated in each round. The means for each sample and each round are indicated by dots, with red for the China sample and blue for the US sample. The error bars represent the 95 per cent confidence interval.

Figure 3. Long description
The image contains four sets of graphs, each with four panels labeled R1 (Dec 2019), R3 (Oct 2020), R5 (Apr 2022), and R7 (Sep 2023). Each set compares ideological preferences between the China and the US samples across different indices. Panel A shows the Political Liberalism Index, Panel B shows the Free Market Index, Panel C shows the Traditionalism Index, and Panel D shows the Nationalism Index. Each panel contains two sets of data points, one for the China sample (red circles) and one for the US sample (blue triangles). The x-axis represents the sample mean in R1, with -1 SD in R1 on the left and +1 SD in R1 on the right. The y-axis is not explicitly labeled but implies a range of ideological preferences. The graphs show the stability and changes in ideological preferences over the specified time periods for both countries. The data points include error bars indicating the standard deviation. The trends suggest stability in political liberalism, free market support, traditionalism, and nationalism between the China and the US samples over the four years of college.
The only statistically significant changes in ideology occur in the China sample, in preferences for political, social, and nationalism policies in Round 7 and in economic policies in Round 5, relative to the baseline level in Round 1.
Changes during the Zero-Covid Lockdowns
In contrast to stability in ideology, Figure 4 shows that respondents in the US sample experienced significant changes in patriotism, support for China’s political system and institutions, and graduation plans from Round 1 (December 2019) to Round 7 (November 2023). Starting in Round 5, which was fielded at the beginning of China’s 2022 Zero-Covid lockdown period, we observe substantial declines in patriotism, regime support, and plans to return to China after graduation among US-based students compared to their freshman-year levels (blue estimates in Figure 4). However, we also observe declines in patriotism and regime support among students in the China sample, starting in Round 5, which become pronounced by Round 7 (red estimates in Figure 4 (A)).
Change in patriotism, regime support, and graduation plan.
Note: the left panel includes all respondents who participated in each round. The means for each sample and each round are indicated by dots, with red for the China sample and blue for the US sample. The error bars represent the 95 per cent confidence interval. The right panel presents the proportion of respondents in the US sample who indicated their short- to medium-term plans to return to China after graduation (the exact survey wording was ‘in the next few years’). During the final round (R7), for the majority of students who have graduated, we record their actual location, and record location preferences for those who had yet to graduate.

Figure 4. Long description
Panel A: Two line graphs depict patriotism and regime support indices for respondents from China and the US over different time periods. The patriotism index graph shows data for December 2019, October 2020, April 2022, and September 2023. The regime support index graph also shows data for the same time periods. Both graphs use a scale from -1 to +1 standard deviations in R1, with the sample mean in R1 marked at 0. The red markers represent China, and the blue markers represent the US. Panel B: One line graph depicts the proportion of US respondents planning to return to China over different time periods (R2, R3, R4, R5, R6, R7). The x-axis represents the proportion of US respondents, ranging from 0.0 to 0.6.
To facilitate a more complete view of how attitudes shift over time, we present the distribution of the regime support index in Figure 5 (A) among respondents who participated in all four rounds. First, the density plots for Round 1 reaffirm clear baseline differences: on average, students in the US sample (blue) are less supportive of the regime than their peers in China (red), a difference reflected across the full distribution rather than driven by outliers. Second, over subsequent rounds, the distributions for both US and China samples shift leftward, indicating declining regime support in each sample. Third, by Round 7, students in the United States have shifted substantially more, underscoring that the US sample experienced a steeper decline in regime support.
Regime support index.
Note: Figure 5 (A) presents the distribution of the regime support index in Round 1, Round 3, Round 5, and Round 7 among all respondents who participated in each round. Figure 5 (B) presents the distribution of the regime support index in Round 1, Round 3, Round 5, and Round 7 adjusted using entropy balancing. We subset respondents from Round 1 and restricted the sample to those with a baseline regime support index greater than –1, since very few respondents from China hold such strongly negative evaluations of the regime at baseline, which makes balancing impossible. We then apply entropy balancing based on the four baseline ideological measures, gender, and the regime support index. The US sample is in blue and the China sample is in red.

One might wonder whether the observed divergences in opinion are simply driven by students’ predispositions at the baseline. While we cannot answer this question definitively with these observational data, we can attempt to adjust for baseline differences to make the two groups more comparable. Because our primary interest lies in opinion shifts among students in the United States, and because the China sample is larger, we reweight the China sample to more closely resemble the US sample. The reweighting proceeds in two steps. First, we exclude students from both samples whose regime support index in Round 1 is less than −1. This is because very few students in the China sample hold such strongly negative evaluations of the regime at baseline, making it impossible to construct a balanced comparison group. After trimming, the sample sizes for the US and China samples are reduced to 116 and 291, respectively. Second, we apply entropy balancing to reweight the China sample based on gender, the four baseline ideology indices, and the baseline regime support index. This procedure constructs a synthetic China sample whose average characteristics across these covariates match those of the trimmed US sample, allowing for more meaningful comparisons of how regime support evolves over time.
Figure 5 (B) presents the distribution of the regime support index over time using this balanced sample. At baseline (Round 1), the distributions for the trimmed US sample (blue) and the reweighted China sample (red) are nearly identical, as expected given the reweighting procedure. In subsequent rounds, the regime support distribution for the US sample shifts markedly to the left, and the distribution for the reweighted China sample moves slightly in the leftward direction. This pattern suggests that even after adjusting for baseline differences, we still observe students based in the United States becoming less supportive of China’s political system and institutions relative to their counterparts in China.Footnote 7
Regression analysis
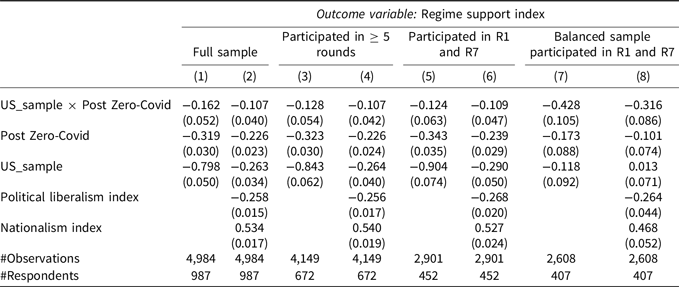
To further quantify the shift in regime support between students in the US and China samples before and after the implementation of the Zero-Covid lockdowns, we turn to regression analysis, which allows us to control for additional potential confounders and provides a more flexible framework for statistical inference. Specifically, we apply a difference-in-differences estimator and report the results in Table 2. Importantly, we do not interpret the coefficients on the key interaction term as causal; rather, they represent the difference in how the two groups – students in the China sample and in the US sample – on average, changed in the outcome measure over time (Xu et al. Reference Xu, Zhao and Ding2026). In Models (1), (3), (5), and (7), we do not include additional covariates, while Models (2), (4), (6), and (8) include measures of political liberalism and nationalism as controls to isolate shifts in regime support that are not mediated by changes in ideological orientation. These controls may constitute ‘bad controls’, as they could themselves be affected by the Zero-Covid lockdowns. However, accounting for them provides a conservative estimate of the divergence in regime support between the US and China samples. Models (1) and (2) include all respondents; Models (3) and (4) are limited to those who participated in at least five survey rounds; Models (5) and (6) restrict the sample to respondents present in both Round 1 and Round 7; and Models (7) and (8) use the trimmed US sample and reweighted China sample as described above.
Change in regime support: US vs China samples

Table 2. Long description
The table presents regression analysis results on regime support index, comparing US and China samples before and after Zero-Covid lockdowns. It includes eight models, each with different sample conditions and covariates. The columns are labeled as Full sample, Participated in>= 5 rounds, Participated in R1 and R7, and Balanced sample participated in R1 and R7. Each column has two sub-columns representing different models. The rows include interaction terms and covariates such as US_sample x Post Zero-Covid, Post Zero-Covid, US_sample, Political liberalism index, Nationalism index, and the number of observations and respondents. Each cell contains regression coefficients with standard errors in parentheses. The table aims to quantify shifts in regime support while controlling for other covariates.
Note: standard errors clustered at the respondent level are in parentheses. The dummy variable, Post Zero-Covid, indicates surveys R5–R7. R5 was fielded in April 2022, shortly after the beginning of China’s Zero-Covid lockdowns.
Not surprisingly, Table 2 shows results consistent with Figure 5. Students in the US sample expressed lower levels of regime support than those in the China sample prior to the Zero-Covid period. This is reflected in the negative coefficient on the US Sample dummy, which captures baseline differences in regime support between US-based and China-based respondents before the implementation of Zero-Covid policies. Second, regime support declined in both samples after the Zero-Covid period, as indicated by the negative coefficient on the Post Zero-Covid dummy, which captures common time trends across all respondents.
More importantly, the interaction term between US Sample and Post Zero-Covid captures the divergent trends in regime support between the two groups following the implementation of the Zero-Covid lockdowns. It shows that after Zero-Covid, the average regime support among the US sample decreased 0.1–0.4 standard deviations (depending on model specification and sample) compared to the China sample. This divergence emerged even though students in the US sample were less likely to have experienced Zero-Covid policies firsthand, suggesting that comparative vantage points may have shaped the views of students in the United States.Footnote 8 We do not interpret this coefficient as the causal effect of directly experiencing Zero-Covid policies in China as students across our samples had different experiences, but the pattern is clear that students in the US sample became significantly less likely than their counterparts in China to support the regime after the onset of these 2022 lockdowns. This result is robust and statistically significant across model specifications – including those that control for political liberalism and nationalism – and holds across different subsamples. Since attrition in the US sample remained largely stable from Round 4 to Round 7, we consider it unlikely that the observed pattern is driven by selective attrition (see SM Section A4.2 for tests of non-random attrition).
Subgroup analysis
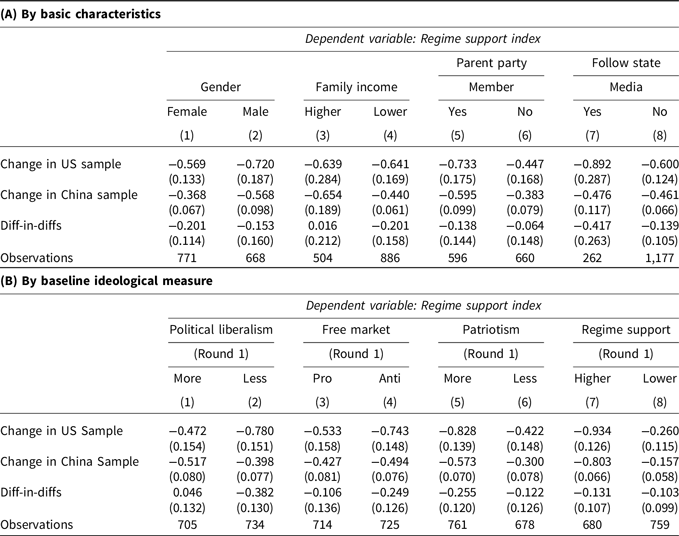
To assess whether the decline in regime support varies by subgroup, we conduct subgroup analyses based on baseline covariates, including gender, family income, household membership in the Chinese Communist Party, and students’ self-reported exposure to state media such as CCTV, as well as the baseline ideology measures from R1. The first rows of Table 3 (A) and (B) report the shift in the regime support index among students in the US sample by subgroup; the second rows show the corresponding shift among students in the China sample; and the third rows report the difference-in-differences estimates, capturing the divergence in opinion between the US and China samples within each subgroup, where negative values indicate that students in the US sample became less supportive of the regime relative to their counterparts in China.
Estimated change in regime support from R1 to R7 by subgroups

Table 3. Long description
Panel A: By basic characteristics. The table has 8 columns and 4 rows. Columns are labeled: Gender (Female, Male), Family income (Higher, Lower), Parent party Member (Yes, No), and Follow state Media (Yes, No). Rows are labeled: Change in US sample, Change in China sample, Diff-in-diffs, and Observations. Values are provided for each subgroup. Panel B: By baseline ideological measure. The table has 8 columns and 4 rows. Columns are labeled: Political liberalism (More, Less), Free market (Pro, Anti), Patriotism (More, Less), and Regime support (Higher, Lower). Rows are labeled: Change in US Sample, Change in China Sample, Diff-in-diffs, and Observations. Values are provided for each ideological measure.
Note: robust standard errors clustered at the respondent level are in parentheses.
Overall, we find that regime support declined substantially across nearly all subgroups in both samples. The divergence between the US and China samples is relatively consistent across gender. However, it is more pronounced among students from lower-income families, households with party members, and those who reported regular exposure to state media (Table 3 (A)). It is also more pronounced among students who were less favorable towards political liberalism, more favorable towards state-led resource allocation, more patriotic, and more supportive of the regime at baseline (Table 3 (B)). These findings suggest that students who were initially more aligned with pro-regime views experienced a greater attitudinal shift, especially those in the US sample.
Understanding Stability and Change
The results show ideological stability in the US sample alongside declines in patriotism and regime support for both samples, with larger attitudinal shifts among the US sample. What explains these patterns?
After the initial Wuhan lockdown of April 2020, China’s strict quarantine and testing policies allowed the country to function relatively normally, while the United States experienced prolonged shutdowns, remote learning, and mounting public frustration and anger.Footnote 9 This contrast became a focal point of competing narratives, with the Chinese government actively promoting its containment record as evidence of regime capacity relative to US government mismanagement (Christensen Reference Christensen2020; Verma Reference Verma2020). Students viewed the Chinese government’s initial handling of Covid-19 (in April 2020) as an indication of state capacity and regime strength. Open-ended responses from survey Round 2 (April 2020) confirm this view. One participant from the US sample said: ‘China’s system has unique advantages in emergency situations like the Covid-19 pandemic’.Footnote 10 Another US participant expressed the view that the data on initial death rates show why China handled the pandemic better than the United States and some European countries.Footnote 11 Respondents from the China sample voiced a similar assessment.Footnote 12 One US participant said: ‘Even though China failed to disclose the outbreak at the very beginning due to the Wuhan government’s efforts to cover it up, China remains the country that managed the pandemic most effectively’.Footnote 13
However, when the highly transmissible Omicron variant reached China in late 2021 and the government’s stringent Zero-Covid policies led to sweeping community-wide lockdowns, mass testing, and growing economic strain in 2022, respondents in both the China and the US samples reversed their assessment of government performance. An interviewee in the China sample who personally experienced the 2022 lockdown said: ‘In the later stages of the pandemic, we hoped that things in the country and society would improve, but the government’s actions made people very unhappy’.Footnote 14 Another respondent from the China sample said: ‘At the beginning, supplies were very limited. Mid-April [2022] was the most difficult period, with extreme scarcity of goods. Later, community group buying emerged, but before that, there was no systematic distribution in place’.Footnote 15 These negative sentiments were echoed by those in the US sample, including students who had returned to China and those who remained in the United States during Covid-19. One interviewee from the US sample who was living in China during Zero-Covid lockdowns while taking classes online said: ‘My community was locked down at least three times…every time I was very upset and angry; I was locked in my home for no apparent reason. This up-close and personal experience of the arbitrary application of power made me not want to work in China’.Footnote 16 Another interviewee from the US sample, but one who did not return to China during Zero-Covid lockdowns, shared: ‘I might have still been somewhat pro-regime in my first year of college. But later on – especially after experiencing the pandemic – I began to question the government’s credibility. A major reason I don’t plan to return to China is because I feel the quarantine policies went too far, including what happened in Shanghai’.Footnote 17
The Chinese government’s sudden reversal of the Zero-Covid policy in December of 2022 further exacerbated these critical evaluations. One China respondent said of government controls: ‘during the middle period, they became excessively strict, and the reopening happened all of a sudden – there was simply no adequate preparation’.Footnote 18 Echoing this sentiment, another participant from the China sample said: ‘The reopening came without warning – everyone around me was testing positive. There was no way to avoid getting infected, so people just gave up. When I got Covid, I didn’t even have access to antigen tests; I judged based on my symptoms, which matched all the typical ones. I even shared it on my WeChat Moments, and everyone said I was a mild case. There was no medication. I got through it with just hot water and rest. All deliveries were strictly controlled’.Footnote 19
Despite negative evaluations of the regime, interviewees in the US sample maintained categorical attachment to Chinese identity, and explicitly distinguished between their identification with the nation and their evaluation of the regime. One interviewee from the US sample, who chose to stay in the United States after graduation, said: ‘Regarding changes of China, I find myself more approving of the American system. For me, China’s political and economic reforms were a big push. I identify more with Chinese national identity, but the current regime has made the choice between the United States and China easier for me’.Footnote 20 Other interviewees in the US sample similarly maintained a strong Chinese identity. One said: ‘I find it hard to imagine becoming Chinese American…I might change my citizenship, but I don’t think I could ever see myself as American’.Footnote 21 Another drew a distinction between national identity and government: ‘I’m a Chinese national; I’m a foreigner, not an immigrant. I don’t consider myself Chinese American…I can separate the government [from my national identity]’.Footnote 22 This distinction between enduring categorical identification as Chinese and regime evaluation supports the view that the decline in patriotism reflects a change in the affective dimension of national identity – reduced warmth and pride – rather than a change in group membership. Students maintained their Chinese identity, while their affective attachment to it weakened in response to regime performance.
Taken together, the qualitative and quantitative evidence is more consistent with evaluative updating intensified by comparison that produces changes in affective identification – reduced warmth and attachment towards the national group – than with ideological change through categorical identity change predicted by social contact and socialization theories. Over the course of the pandemic, students in both samples revised their assessment of regime performance in response to observable government actions. This is what we would expect with evaluative updating: targeted attitude change in response to shocks and new information. Crucially, the ideological preferences of US-based students remained stable throughout, which is not consistent with identity shift and subsequent ideological change that social contact would predict for students living abroad. The decline in patriotism is observed in both samples. Students are less likely to agree that they feel ‘lucky and proud to be Chinese’ or prefer Chinese citizenship. In interviews, respondents in the US sample explicitly distinguish between their enduring Chinese identity and their evaluations of the regime. The larger decline in regime support and patriotism in the US sample further suggests that the comparative reference point afforded by access to uncensored media, alternative narratives, and linkages to both countries amplified evaluative updating.
While we cannot rule out identity change via social contact – we do not quantitatively measure categorical identity change – several features of our evidence suggest it is not the primary mechanism. In addition to US students’ ideological stability and declines in patriotism in both samples, we also find that close friendship networks in the US sample remained predominantly co-national throughout college (see SM Section A5.2), suggesting limited deep social integration with host-country peers, which is a prerequisite for the contact-based identity change that socialization theories emphasize. That said, the Covid-19 period may have been unusual in limiting cross-national relationship formation, and we cannot assess other dimensions of identity change beyond what this friendship data captures.
Altogether, the Covid-19 pandemic intensified comparative evaluation. Chinese students in the United States could observe both countries’ responses in real time, and often had direct personal relationships in each country. Our findings suggest that this comparative vantage point intensified evaluative updating, producing steeper declines in regime support among US-based students than among their peers in China, even as US students’ broader ideological structure remained stable.
Conclusion
This study reveals ideological stability along with changes in political attitudes and patriotism among Chinese students studying in the United States and those who remained in China between 2019 and 2023. We find that although overseas students enter college with more liberal and cosmopolitan orientations than their peers in China, their ideological preferences – related to political liberalism, economic policy, social values, and nationalism – remain stable over four years. In contrast, patriotism declines, as does regime support, with larger declines among students studying in the United States following China’s 2022 Zero-Covid lockdowns. This decline is evident even after adjusting for baseline differences between the two groups, and is especially pronounced among students who were initially more supportive of the Chinese regime.
Several limitations should be kept in mind when interpreting these findings. First, although the longitudinal design allows us to track within-individual changes over time, we cannot make definitive causal claims about the effects of study abroad or specific political events due to the observational nature of the data. Second, despite efforts to mitigate attrition and re-balance samples, our findings are limited to students who remained in the sample over multiple years. Third, it is possible that those in the China sample felt more uncomfortable or less safe expressing more negative opinions towards the regime in absolute terms and relative to how they feel, especially prior to Round 7 when we observe a decline in assessments.
Nonetheless, these results shed light on how selection, stability, and shock shape political attitudes among Chinese college students during a period of extraordinary global upheaval. They also offer implications for democratic diffusion beyond the Chinese student context. First, selection can play an important role in the democratic diffusion process. Our finding that Chinese students bound for the United States were already more politically liberal, market-oriented, and cosmopolitan before departure suggests that observed differences between overseas-educated and domestically educated populations may reflect selection in addition to treatment effects. This means that studies lacking pre-departure baselines may overstate the causal impact of overseas education on political attitudes.
Second, studies of democratic diffusion should treat ideology as distinct from attitudes. Attitudes towards specific policy issues including overall support for a political system may respond to salient events without changes in preference configuration towards political, economic, and social issues. While democratic diffusion can encompass both attitudes and ideology, they should not be treated as interchangeable.
Third, home-country events should be taken into account along with host-country exposure. The democratic diffusion literature emphasizes student experience in democratic host countries, while our findings suggest that what students observe about their home country while abroad also matters. The significant decline in support for China’s political system came after China’s 2022 pandemic response – a home-country event – not from cumulative exposure to American democracy. The early pandemic period, when China’s response appeared effective relative to the chaotic US response, produced no such shift. It was only when China’s lockdowns became visibly arbitrary and coercive, while other countries returned to normal, that attitudes moved. This suggests that future studies should incorporate home-country cohort comparisons to avoid overstating the impact of overseas education.
Lastly, these findings suggest that short-term migrants’ linkages to both host and home countries should be considered. This dual linkage means that changes may stem from updated evaluations of the home country especially in comparison to the host country. Existing research on democratic diffusion has focused on how attitudes and preferences change through shifts in group membership and self-conception arising from interpersonal contact and socialization. This research suggests that overseas education may contribute to democratic diffusion by providing a different vantage point for evaluating home-country performance in addition to socialization.
These findings speak to a broader literature on political change in non-democratic countries. While attitudes often appear stable, they can shift rapidly when state actions collide with personal experience. The Zero-Covid period served as such a shock: it revealed the limits of the Chinese state not in abstract theoretical terms, but through direct, lived experience. China’s white paper protests underscore how political stability in non-democratic contexts can be undermined by crisis that disrupt everyday governance and expose the government’s shortcomings in adapting to evolving social conditions (Slater 2010). The decline in regime support is notable given the extensive literature on the high level of legitimacy and support for the central government in prior studies of Chinese politics (Tang Reference Tang2016; Shi Reference Shi2001). Explaining these shifts requires attention to both long-term selection and short-term shocks (Geddes et al. Reference Geddes, Wright and Frantz2018), as well as to how domestic political events interact with international exposure to reshape how individuals interpret state authority and legitimacy (Brownlee Reference Brownlee2007).
Supplementary material
The supplementary material for this article can be found at https://doi.org/10.1017/S0007123426101756.
Data availability statement
Replication data for this article can be found in Harvard Dataverse at: https://doi.org/10.7910/DVN/JKH9OJ.
Acknowledgements
The authors thank Jessica Chen Weiss, Yiqin Fu, Matthew Kohrman, Marshall Mo, Mingcong Pan, Leo Yang, Xu Xu, and Xueguang Zhou for helpful comments; and their incredible research assistants Xiaoxuan Ji, Jiaao Ji, Jason Lee, Marshall Li, Luxi Peng, Yongkang Tai, Nikol Tang, Scott Xiantao Wang, Yassi Xiong, Aoyu Xu, Dy Yu, Yuxin Yang, Liangyuan Zeng, Carol Zhang, Yaqi Zhang. The authors also extend their special thanks to Vivi Shaw for her invaluable assistance with this research. All opinions are our own.
Financial support
This research was funded by China Data Lab at the 21st Century China Center, UCSD, Stanford China Fund, the Stanford Center on China’s Economy and Institutions, and Stanford PACS.
Competing interests
None.
Ethical standards
This research was conducted in accordance with protocols approved by the Institutional Review Boards of Stanford University (Protocol #42945) and Princeton University (IRB #15655). All participants provided informed consent and were compensated for their participation.




 Open access

