

Sources
The principal sources of information on which this chronicle is based are British Broadcasting Corporation, Monitoring Global News line – Asia-Pacific Political and British Broadcasting Corporation, Monitoring Global News line – Asia-Pacific Economic. These sources, now only available electronically, do not have reference numbers and are only identifiable by date of publication of material. The inclusion of each of these dates would unnecessarily clutter the text and such dates have therefore been omitted, except, at many points, for the original sources from which the BBC reports themselves are taken.
Abbreviations
- XHNA
Xinhua (New China) News Agency
- CNA
Central News Agency (Taipei)
- RTHK
Radio-Television Hong Kong
- ZTS
Zhongguo tongxun she (China Reporting Agency), Hong Kong
- ZXS
Zhongguo xinwen she (China News Agency), Beijing
- RMRB
Renmin ribao (People's Daily)
- SCMP
South China Morning Post
- KCNA
Korean Central News Agency
1. Internal Developments
a13th Session of the National People's Congress Standing Committee
bThird Session of the 11th National People's Congress
cParty and Political Affairs
dEconomic Affairs
eStatistical Communiqué on National Economic and Social Development during 2009
fMedia and Information
gHuman Rights
hSocial Developments
iDefence
jTibet
kXinjiang
lHong Kong Special Administrative Region
2. Foreign Relations
aDiplomatic Tours
bMultilateral Conferences
cCountries, Territories and Regions
dClimate Change
1. Internal Developments
a 13th Session of the 11th National People's Congress Standing Committee (NPCSC)
The NPCSC held its 13th session from 24 to 26 February, presided over by Wu Bangguo, Chairman of the Standing Committee. The main business of the session was to prepare for the Third Plenum of the National People's Congress on 5 March. The session reviewed the draft major documents for the Plenum and also reviewed the draft law on mobilization for national defence (third reading) and a draft amendment to the law on state secrets (second reading). It also considered amendments to the Administrative Supervision Law and the Copyright Law (first reading). The session ratified the Consular Agreement signed with the Philippines in October 2009, and passed the National Defence Mobilization Law and amendments to the copyright law. It approved the agenda for the NPC Plenum and the work report of the Standing Committee (XHNA, 26 Feb.).
b Third Session of the 11th National People's Congress (NPC)
The Third Session of the 11th NPC opened on 5 March and closed on 14 March. It was presided over by Wu Bangguo, Chairman of the NPC Standing Committee, and the main item of business was the report on the work of the government delivered by Premier Wen Jiabao on behalf of the State Council (full text taken from the live broadcast by Chinese Central Television TV-1, 5 Mar.). The Session also heard reports on the budget, the National Economic Plan, the work of the NPC Standing Committee (text in XHNA, 17 Mar.), the work of the Supreme People's Court and the work of the Supreme People's Procuratorate. It also passed an amendment to the Electoral Law (text in XHNA, 14 Mar.), the most noteworthy provision of which was to allow for equal representation by urban and rural residents. A preparatory meeting held on 4 March set the agenda and elected Wang Zhaoguo as Secretary General of the Presidium for the duration of the session (XHNA, 4 Mar.).
Review of Government Work
Wen Jiabao's government work report was divided into a review of 2009 and an outline of the main tasks for 2010.
Against a background of 2009 being “the most difficult year for our country's economic development since the beginning of the new century,” China had become the first country in the world to achieve economic turnaround. Headline numbers were GDP growth of 8.7 per cent, fiscal revenue up 11.7 per cent, a record grain harvest, the creation 11.02 million urban jobs, and net per capita increases in rural and urban incomes of 8.5 and 9.8 per cent.
He listed China's achievements in 2009 under five main headings:
(i) Strengthening and improving macro-economic control and promoting steady and rapid economic development: Under the mantra of a carrying out a “proactive fiscal policy and a relatively easy monetary policy,” China had introduced and constantly refined its plan for addressing the effects of the global financial crisis, which had ensured funding for social and economic development, effectively boosted domestic demand and quickly reversed the slowdown in economic growth. He noted in particular the measures taken to expand consumer spending, pointing to subsidies worth 45 billion yuan to rural consumers, cutting purchase tax on smaller vehicles, and reducing taxes on home purchases. As a result retail sales had risen 16.9 per cent overall, car sales had risen 46.2 per cent, and “commodity housing” sales by 42.1 per cent. In similar vein, the government had promoted rapid growth in investment, and had guided and stimulated non-government investment by means of well-leveraged government investment. The centrepiece had been the 4 trillion yuan stimulus package over two years. In 2009, central government public investment was 924.3 billion yuan (503.8 billion more than in 2008). Fixed asset investment increased by 0.1 per cent nationally, and the investment growth “effectively compensated for the shortfall created by shrinking external demand … and laid a solid foundation for long-term economic and social development.”
(ii) Vigorously carrying out economic restructuring, shoring up the foundation for long-term development: Wen noted the continued emphasis on work related to improving conditions in agriculture, rural areas and for farmers. Central government's direct support for rural areas had increased by 21.8 per cent. The price of grain had been raised significantly, and numerous projects had been undertaken to improve rural welfare and living conditions and to fight poverty. Industrial restructuring had been intensified, with substantive programmes of restructuring and invigorating ten key industries. Efforts had been made to restrict excess production capacity, while redundant development and backward facilities in certain industries had been eliminated. Solid progress was made in conserving energy, reducing emissions and protecting the environment. Over the first four years of the current five-year plan, energy consumption per unit of GDP fell by 14.38 per cent. China responded vigorously to climate change and set out its targets and policies for controlling greenhouse gas emissions by 2020. Regional development was better distributed, structured and co-ordinated.
(iii) Steadfastly deepening reform and opening up, and constantly improving institutions and mechanisms conducive to developing scientifically: Wen noted a number of fiscal and financial reforms: VAT reform, price reform for refined oil products, commercializing the China Development Bank and a pilot project in using the yuan as the settlement currency for cross-border trade. More efforts had been made to open the economy further, with policies to stabilize foreign demand. More foreign direct investment had been used, reversing a previous trend, and more Chinese companies had invested abroad. China had played a constructive role in the joint response to the global financial crisis.
(iv) Striving to improve people's well-being and accelerating the development of social programmes: Wen listed achievements in employment policy (which brought about “basic employment stability”), the social security system (pensions, low-income housing, and an overall increase of spending on social security funds of 44.2 per cent), education (increase in government spending, better teacher training, support for poor families, and achievement of “more equitable” education), and healthcare (improved health insurance, reform of the pharmaceutical system, control of H1N1 influenza).Wen said that it had not been easy to do all this against a backdrop of the global financial crisis and negative growth in the world economy, and attributed the success to the overall planning and correct leadership of the Party Central committee with Comrade Hu Jintao as General Secretary, as well as the strenuous efforts of the people of China. He concluded that China had learned that it was necessary to continue to make use of both market mechanisms and macro-control, making best use of the socialist systems advantages which enabled them to make decisions efficiently and organize effectively. China needed to make it a long-term policy to boost domestic demand, and quickly formulate a pattern in which domestic demand and foreign demand drive domestic growth in concert. It was necessary to remember that developing the economy was inseparable from improving people's well being and safeguarding social fairness and justice.
Premier Wen described 2010 as “a crucial year for continuing to deal with the global financial crisis, maintaining steady and rapid economic development and accelerating the transformation of the pattern of economic development.” The development environment was slightly better than last year, but they still faced a very complex situation. Internationally, the global economy would hopefully turn around and the financial markets stabilize. But many uncertainties remained. The foundation for global recovery remained weak, financial risks had not been eliminated, many countries faced difficult choices in phasing out their stimulus policies, commodity prices were likely to fluctuate and protectionism was rising. Domestically, China was in a period of strategic opportunity; market confidence was increasing, domestic demand was being successfully stimulated, and enterprises were becoming more competitive.
He highlighted eight main areas on which work would concentrate in 2010:
(i) Exercising better macro control and maintaining steady and rapid economic development: China would continue with its “proactive fiscal policy and moderately easy monetary policy.” China needed to maintain the balance between steady and rapid economic development, to consolidate the momentum of the economic recovery but also to accelerate restructuring and to push forward the transformation of the pattern of economic development. It was necessary to manage inflation expectations and keep prices stable.
In order to achieve this, China would implement a proactive fiscal policy, keeping the deficit and government bonds at appropriate levels. Revenue would increase only slowly as last year's one-off measures to increase revenue would not be repeated. Expenditure would continue on the stimulus package and spending would increase to complete work on projects already underway. China would implement a structural tax reduction policy to expand domestic demand and promote economic restructuring. It would improve the structure of expenditure and spend money where it counts the most, notably in the rural areas. Government debt management would be improved, to fend of latent public finance risks.
The moderately easy monetary policy had a number of constituent elements and aims. The government would ensure that that there were proper and sufficient supplies of money and credit (with M2 increasing around 17 per cent). The credit structure would be improved (guaranteeing credit in areas that needed it and limiting it on others). Direct financing would be expanded, improving capital markets and increasing financing by selling equities and issuing bonds. Risk management and financial oversight and supervision would be improved. There would be energetic efforts to improve consumer demand, through a mixture of subsidies and income support for the low paid, and the development of areas of high consumption (such as information, tourism, subculture and various services). There would be improvements in the way investment was used. Government investment would be concentrated on the most important areas and the launching of new projects would be strictly controlled. There needed to be closer oversight of publicly financed projects to prevent the construction of vanity projects in the name of boosting demand.
(ii) Accelerating the transformation of the pattern of economic development and adjusting and optimizing the economic structure: Key industries would be revitalized and transformed by intensifying technological upgrading, encouraging the merger and reorganization of enterprises, comprehensively raising product quality and fostering emerging industries of strategic importance (new energy sources, new materials, energy conservation, environmental protection, biomedicine, information networks and high-end manufacturing). Small- and medium-sized enterprises (SMEs) would be encouraged through setting up a sound service system and continuing fiscal support (10.6 billion yuan in direct support and preferential tax policies for low-profit enterprises), and better financial support (improved access to credit, the establishment of a loan risk compensation fund, and tax support). China would also accelerate the development of the service sector, and raise its proportion of the national economy. In view of the weak services in rural areas, the establishment of a sound system of rural workplace and consumer services needed to be developed.
China would strive to conserve energy and reduce emissions. It would energetically promote energy conservation and raise the efficiency of energy consumption especially in industry, transport and communications. Energy saving capacity would be increased by 80 million tons of standard coal equivalent, and desulphurization equipment would be deployed for every coal-fired power-generating unit. Environmental protection would be increased (improving the environment in key watersheds, upgrading urban sewage systems, and cleaning up heavy metal pollution). China would develop a “circular economy” to save energy, water land and materials. China would respond actively to climate change, improve its adaptive ability, develop low-carbon technologies, develop new and renewable energy sources, increase forest carbon sinks, and build an industrial system and consumption pattern with low-carbon emissions.
China would promote balanced economic development between its regions. Growth would be accelerated in economic priority zones, the old revolutionary areas, ethnic minority areas (especially Xinjiang, Tibet and the Tibetan ethnic areas in other provinces), border areas and poverty-stricken areas. China would focus on reversing the growing gap in economic and social development between regions.
(iii) Improving the balance between urban and rural development and strengthening the foundation for the development of agriculture and the rural areas: The successes of six consecutive years in increasing grain production and rural incomes needed to be kept up. Solving the problems faced by agriculture and the rural areas remained a top priority. Grain production would remain stable, there would be a continued increase in the sown area of oilseed and increased supplies of important agricultural products, and steps would be taken to ensure the security of grain and vegetable supplies. There would still be direct subsidies for grain producers, and an increase in the subsidy for purchasing agricultural supplies. Minimum grain prices would be raised further.
Agricultural infrastructure would be improved with the priority on fixed investment that improved the well-being of rural residents. Proceeds from transfer of land use rights would be used as a priority for developing agricultural land and building rural infrastructure, and the central government would allocate 818.3 billion yuan to the rural areas, an increase of 93 billion yuan. Rural reform would be deepened, and the existing land contract relationships would be maintained over the long term. Supervision and service support for the transfer of contracted land use rights would be improved. Tenure in collective forests would be reformed, and the reform of state tree farms would be started. The system of use of the grasslands would be reformed. The development of specialized farmers' co-operatives would be supported. China would make efforts to balance promoting urbanization and building a new countryside. It was important to adhere to the strictest possible systems of protecting arable land and economizing on land use to protect the legitimate rights and interests of farmers. The household registration system would be reformed and requirements for registration in towns and small- and medium- sized cities would be relaxed. The employment and living problems of rural migrant workers in the cities would be tackled.
(iv) Fully implementing the strategies of reinvigorating China through science and education and strengthening the nation through human resource development: High priority would be given to the development of education, focussing on five major areas: systematic reform of the system for operating schools, curricula, teaching methods and evaluation systems; promoting the balanced development of compulsory education (speeding up the renovation of school building in the central and western regions, providing multimedia distance-learning facilities for rural primary and secondary schools); strengthen vocational education; reform the managements and admissions systems of institutes of higher learning (give them more decision-making power and encourage them to adjust curricula to employment needs, develop a number of first-class universities that produce outstanding personnel); improve the ranks of teachers (attract better quality applicants, improve teacher training especially for the rural areas). China would vigorously develop science and technology, in order to build an innovative country. There would be far-sighted support for basic research and research in cutting edge technologies in biology, nanoscience, quantum control, information networks, climate change, aerospace and oceanography. The system of managing science and technology would be reformed to bridge the gap between science and technology and the economy. The development of China's human resources would be accelerated, with a focus on producing innovative scientists and engineers, and experts and professionals in key areas of economic and social development, and attract high calibre personnel from overseas.
(v) Energetically promoting cultural progress: Wen said that culture is the spirit and soul of a nation and the determining factor on whether it is truly strong or not. If China did not develop an advanced culture and improve the whole nation's cultural and ethical levels then it could never truly modernize. He said that they would draw on and carry forward the fine traditional culture of the Chinese nation, draw on and make use of the achievements of cultures of other nations, and build a home of spirit shared by the whole Chinese nation. High priority would be given to the primary level in allocating resources, making admission to more museums, libraries and galleries free of charge. They would promote the development of philosophy, the social sciences, radio, television, film, the press, publishing and archives; they would make literary creation flourish and strengthen the protection of cultural relics. Cultural exchanges with foreign countries would be developed and an exercise campaign for the whole public would be launched.
(vi) Vigorously ensuring and improving people's well-being and promoting social harmony and progress: The top priority in this area was to increase employment. The employment situation would remain serious in 2010 and there could be no relaxation. China would continue with a proactive employment policy, and emphasis would be given to finding jobs for college graduates, rural migrant workers, people experiencing employment difficulty, and demobilized military personnel. The government would encourage different forms of flexible employment, including starting businesses and finding jobs independently.
Improvements to the social security system for urban and rural residents would be speeded up. The pilot programme for a new old-age insurance system for rural residents would be expanded to 23 per cent of counties, and a series of other pensions related measures would be introduced, including an increase of 10 per cent in the basic pension for enterprise retirees. Governments at all levels needed to spend more on social security, and the central government had allocated 318.5 billion yuan for this. They would encourage and support the development of charities.
The income distribution system would be reformed so that distribution according to work is dominant and multiple forms of distribution coexist giving due consideration to efficiency and fairness. Firstly the government would gradually increase the proportion of national income that went to individuals, and the proportion of the primary distribution of income that goes to wages and salaries. Secondly, the income distribution system of monopoly industries would be reformed (and strict standards would be set for the income of executives, especially senior ones). Thirdly, China would standardize the pattern of income distribution, protect legitimate income, regulate excessively high income, ban illegal income and resolutely reverse the widening income gap.
Steady and sound development of the real-estate market would be promoted; and the precipitous rise of housing prices in some cities would be curbed and the people's basic need for housing satisfied. There would be an expansion of low-income housing projects (building 3 million new units and renovating 2.8 million others). Support would continue to be given for buying houses as residences for their owners, and the land supply for building small- and medium-sized condominiums for low and medium prices would be increased. Speculative house purchasing would be controlled and the real estate market would be rectified and standardized.
There would be a speeding-up of reform in healthcare. The coverage of guaranteed basic medical care would be increased, and a basic drug system (to encourage the use of basic drugs) would be installed in 60 per cent of community medical institutions run by the government. There would be a pilot reform of public hospitals, the non-profit nature of basic medical services would be maintained, medical costs would be controlled, the quality of medical service would be raised, and relations between medical service providers and consumers would be improved. China would continue to do a good job in family planning work, and to maintain a low birth rate. Good family planning services would be provided for the floating population. Rural families that complied with family planning regulations would continue to be rewarded.
(vii) Firmly advancing reform and further expanding opening up: Reform would be deepened in key areas: there would continue to be strategic adjustments in the distribution and structure of the state-owned sector (introducing a corporate system in state owned companies, diversifying their ownership and improving corporate governance); prices for resources products and environmental charges would be reformed; fiscal and taxation systems would continue to be reformed, with a strengthened public finance system and greater transparency of the fiscal budget. Wen said that improving the financial system was an important measure for countering the impact of the global financial crisis, and China needed to improve corporate governance in financial institutions in which the state held a controlling stake.
Wen went on to say that “without political restructuring, it would not be possible for economic restructuring and the modernization drive to succeed. We will develop socialist democracy, and effectively safeguard the democratic rights of the people as masters of the country, particularly their rights to vote and to stay informed about, participate in, express views, and oversee government affairs.” He pledged to expand primary-level democracy and improve the system of democratic administration at primary level so that the people can better participate in the management of public affairs.
China would steadily develop its foreign trade, focussing on opening new markets and adjusting the structure and promoting the balance of foreign trade. China would improve the export mix, stabilize exports of labour-intensive products, increase exports of electromechanical products and new and high-tech products; the export of resources and products whose production was energy intensive would be controlled. China would encourage more foreign investment in high-end manufacturing, new industries, services, and new energy conservation and environmental protection industries. Foreign investment should be used for improving and upgrading Chinese companies, and China looked to attract both investment and talent from overseas. Chinese industry would be encouraged to “go global,” including encouraging industries whose products are in demand internationally to transfer their production capacity overseas, supporting mergers and acquisitions. Examination and approval procedures would be simplified, and enterprises which had gone global would have decision-making power over their overseas investment. China would deepen its multilateral business co-operation, and make full use of high-level economic dialogues with other countries. It would actively participate in the Doha round, and was opposed to protectionism in all forms.
(viii) Working hard to build a service oriented government that the people are satisfied with: Wen noted that the government had paid particular attention to promoting democracy, listening to the masses and protecting their interests. Civil servants were devoted and diligent, but the government's work still fell short of popular expectations. There was still too much government interference in the micro-economy, and public administration services were relatively weak. Some government officials gave too little consideration to carrying out their official duties in accordance with the law. In response, the public service system would be improved, especially the mechanisms for responding to natural disasters. The handling of complaints needed to be improved, and those who were derelict in their duty, failed to do their jobs or did them irresponsibly needed to be held accountable. There would be high priority given to fighting corruption and encouraging integrity. Leading officials needed to abide by the central regulations calling on them to declare their assets and those of their families. Extravagant behaviour, including the construction or remodelling of Party or government offices would be controlled. The numbers of meetings and documents, particularly meetings, celebrations and forums that were long on form and short on substance would be curtailed.
There was brief reference to the armed forces, but with little detail, stating that this year China would focus on the overall work of the Party and Government and strengthen all aspects of the army in accordance with the principle of making it more revolutionary, modern and standardized so that it can complete its missions in the new century.
Hong Kong and Macau received a similarly brief mention with a commitment to implement the principle of “one country, two systems” in each and support them in maintaining their long-term prosperity and stability. Mention was made of the Hong Kong–Zhuhai–Macau Bridge project and deepening co-operation between Guangdong and the two regions. No reference was made to political development in either of them.
Relations across the Taiwan Strait “made important progress from a historic new starting point and a positive trend toward peaceful development emerged.” Wen noted the important steps taken in 2009 to normalize economic relations, and said that they would strengthen economic trade and financial contacts in the 2010. He said that they would “set up an economic co-operation mechanism that reflects the characteristics of both sides by negotiating and signing an economic co-operation framework agreement. Cultural and educational exchanges would be expanded, and people-to-people exchanges would increase. “We will uphold the principle that the mainland and Taiwan belong to one and the same China, strengthen the political foundation for the peaceful development of cross-Strait relations, and enhance mutual political trust between the two sides.”
He concluded with a further brief reference to the “important results in our diplomatic work last year” and China's active participation in international co-operation to respond to the global financial crisis and climate change, where it played a unique and constructive role. In the coming year China would use the G20 and other major multilateral activities as its main platform for actively participating in the change of the international system and safeguarding the interests of developing countries. China stood ready to work with the international community to respond to risks and challenges, share development opportunities, and make new contributions to world peace and development.
Budget and Economic Plan
On 5 March the Finance Minister reported on the budget outturn for 2009 and the draft budget for 2010 (Text in XHNA, 16 Mar.). Like Premier Wen, he set the report in the context of the most difficult year China had experienced this century, but thanks to the economic policies adopted by the government, central and local budgets were satisfactorily implemented and new progress was made in the reform and development of public finance.
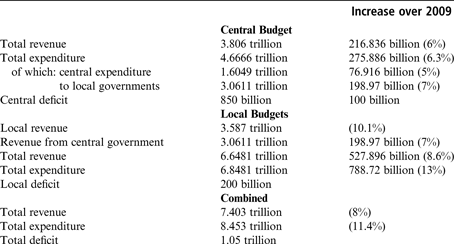
He announced that the projected total revenue (central and local revenues together with a transfer of 10 billion Yuan from the central budget stabilization fund) would be 7.403 trillion yuan, and expenditure was projected at 8.453 trillion with a total estimated deficit of 1.05 trillion yuan, corresponding to 2.8 per cent of GDP in 2010. This percentage would be basically the same as in 2009. The figure was based on the consideration that although the Chinese economy was showing signs of revival, its base was still not solid, and therefore the government needed to maintain continuity and stability in its fiscal policy. He also announced that it was essential to keep the deficit to under 3 per cent of GDP. Table 1 gives a more detailed breakdown of the overall figures.
Central and Local Budgetary Estimates for 2010 (figures in yuan)
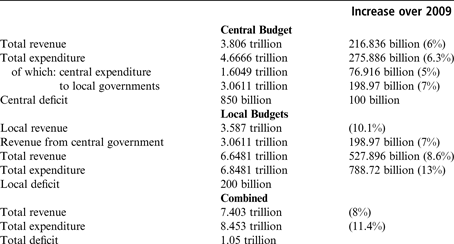
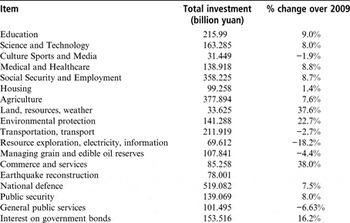
The Minister noted that the public finance environment was more favourable than in 2009, but the situation remained complex. Revenues should increase through economic growth and an increase in prices, but tax reforms and rebates to stimulate the economy would eat into this. Taxes on foreign trade would not be returning to their pre-crisis levels, and some industries were showing low profits which made increases in corporation tax unlikely. Last year's special expenditure measures would continue with huge sums of money needed to support ongoing projects. Money would also be needed to raise the incomes of low-income groups, improve social security, and deal with “key links in economic and social development.” Money would still be needed for post-earthquake reconstruction, reform of the pharmaceutical and healthcare systems, and the pilot pension scheme in rural areas. All this added up to a difficult year for public finance. Table 2 gives a breakdown of the major items of budgeted expenditure.
Central Budgetary Investment Allocations (2010 plan)

Ma Kai, Chairman of the National Development and Reform Commission, delivered the Report on the Implementation of the 2009 Plan for National Economic and Social Development and on the 2010 Draft Plan for National Economic and Social Development on 5 March. He outlined China's achievements in the past year in broadly similar terms to Wen but with considerably more statistical detail. As background to the plans for 2010, he noted that although the world economy was beginning to recover, many uncertainties remained and the foundation for recovery was still weak. Unemployment in major developed countries was high, trade protectionism was rising and prices for commodities and exchange rates could fluctuate wildly. At home, the internal driving force of economic growth was still weak, consumer spending was unlikely to grow significantly, and there was a danger that the effects of the stimulus package might wear off, which made it hard to expand domestic demand. International demand would remain sluggish. China was under pressure to transform its pattern of development and adjust its economic structure (investment and consumption were disproportionate, and growth still relied too heavily on high consumption of energy and other resources). It was difficult to promote energy conservation and emissions reduction, as the economic situation improved energy intensive industries expanded considerably. The foundation for promoting steady development in agriculture was still weak. The employment situation was grim. There was excessive growth in money and credit supplies, and housing prices in some cities were rising too fast.
In the light of all this, the main objectives for 2010 were:
(i) Maintaining steady economic growth: GDP growth would be about 8 per cent, to show that the focus of economic work was not on reckless pursuit of growth but on putting efforts into transforming the structures, improving the quality of development and making it more sustainable.
(ii) Improving the economic structure: Agriculture would be developed and emerging industries of strategic importance and service industry would be promoted. The share of GDP of the various sectors would be 10.1 per cent, 46.6 per cent and 43.3 per cent respectively. Urbanization rate would reach 47 per cent, and regional development would be better balanced.
(iii) Ensuring and improving the people's well-being: More than 9 million urban jobs would be created and registered unemployment would be kept below 4.6 per cent.
(iv) Keeping overall prices basically stable: The rise in the Consumer Price Index (CPI) would be around 3 per cent. In China, aggregate supply exceeded aggregate demand, but there were still price pressures including the prices of commodities from abroad which would increase the pressure on prices.
(v) Improving the balance of payments: Total trade would grow by about 8 per cent and the trade surplus would shrink.
The Judiciary
Reports on the work of the courts and the procuratorates were delivered by Wang Shengjun, President of the Supreme People's Court and Cao Jianming, President of the Supreme People's Procuratorate. Wang said the number of cases handled by the courts at all levels had risen by 6.3 per cent to 11.37 million. The overall number of criminal cases remained virtually steady, rising by only 0.2 per cent to 767,000, but there was a significant rise in the number of major gang cases dealt with, up 13.8 per cent (to 527), and a small rise in the number of cases dealing with severe crimes (such as homicide, kidnapping and undermining national security), up 2.3 per cent involving the sentencing of 375,000 criminals. There were substantial increases in the number of civil (7.7 per cent) and contract (8.6 per cent). Cases involving labour disputes rose again by 10 per cent to 317,000. There was a 16 per cent increase in the number of civil cases involving foreign parties, up 16 per cent to 11,000. Cao Jianming noted that the procuratorates had investigated about 41,000 officials (down 3.3 per cent) for embezzlement, bribery, dereliction of duty and other work related crimes in 2009, including eight at ministerial level, and 2,670 above country level. The China Daily noted that in the last three decades about 4,000 corrupt officials had fled to Canada, the US, Australia and other countries (China Daily website, 12 Mar.).
c Party and Political Affairs
The Central Disciplinary Commission held a news briefing on 7 January on its activities in the previous year. In the first 11 months of the year, discipline inspection and supervision departments at all levels had received over 1,318,362 complaints. They had identified 140,825 cases of violation of discipline and punished 106,626 individuals (85,353 by Party discipline and 29.718 by Government discipline). Economic losses worth 4.44 billion yuan had been recovered. Five main types of case had come to their notice: a) violation of laws and discipline in the implementation of major policy decisions (particularly with regard to land use and environmental protection); b) corruption, where 3,743 officials at county level or above had been punished and 764 cases transferred to the judiciary; c) cases of commercial bribery or serious harm to the interests of the masses; d) cases of the investigation and handling of mass incidents and corruption relating to major accidents; and e) cases of the violation of the law in key areas (including construction, real estate development, special topic slush funds and so on) (XHNA, 7 Jan.).
The Central Disciplinary Commission held a plenary session on 11 to 13 January, presided over by He Guoqiang who delivered a work report entitled “Comprehensively Implementing the Spirit of the Fourth Plenum of the 17th CCP Central Committee, Push to a Deeper Level the Building of the Party's Work Style and Clean Administration and the Anti-corruption Struggle.” President Hu Jintao delivered an important speech to the meeting. Hu told the meeting that the Party should “fully recognize the situation of the fight against corruption,” which was “persistent, complicated and arduous.” He said that no corrupt official should consider themselves above the law or Party discipline, and that efforts should be made to investigate cases of power abuse, corruption and embezzlement, as well as dereliction of duty. In 2009, 15 ministerial level officials, including heads of SOEs, were investigated for corruption and nine of them were prosecuted, among whom was a former Vice President of the Supreme People's Court. Since the last session, the Commission had instituted a requirement for officials to report their properties and investment as well as that of their spouses and children, and initial tests of the system had been held in Zhejiang, Shanghai and Xinjiang (XHNA, 12 Jan.).
In parallel to the Central Discipline Inspection Commission meeting the armed forces held a Discipline Inspection Work Conference on 13 January which was addressed by Xu Caihou, a member of the Politburo and Vice Chairman of the Central Military Commission and chaired by Li Jinai, Director of the General Political Department. Xu said that “All levels of leaders should profoundly study and understand the decisions and instructions of the party Central Committee and Chairman Hu and further strengthen their sense of responsibility and urgency in combating corruption and building a clean administration in the armed forces” (XHNA, 13 Jan.).
In separate reports on 15 January it was revealed that that Qiao Hong, the former General Manager of Kweichow Moutai, had been sentenced to death, with a two-year reprieve, after being convicted of corruption charges in Zhunyi. Elsewhere Kang Rixin, former General Manager of China National Nuclear Corporation, was dismissed from his posts and stripped of Party membership for serious abuses of authority and taking bribes. His case was referred to the courts for prosecution (XHNA, 15 Jan.). Huang Songyou, former Vice President of the Supreme People's Court, was sentenced to life imprisonment for taking bribes and embezzlement on 19 January by a court in Hebei. It was also reported that Chen Shaoyong, former Secretary General of Fujian Party Committee, was sentenced to life imprisonment in Nanjing for taking huge bribes. Both Chen and Huang were reported to have co-operated with the authorities during their investigation (XHNA, 19 Jan.).
On 23 February the Central Committee issued a Code of Ethics for Leading Cadres with Party Membership to ensure honest behaviour in their work and to prevent corruption. The guidelines specified 52 unacceptable practices, including accepting cash or financial instruments as gifts or using their position to advance their families. A code was first introduced on a trial basis in 1997. A teleconference was held to propagate the code and was addressed by He Guoqiang, Secretary of the Discipline Inspection commission. He said that ethical conduct by leading cadres was a basic requirement and that the code needed to be fully implemented (XHNA, 23 Feb.).
A meeting to assign tasks in the follow up to Hu Jintao's speech on anti-corruption work to the Discipline Inspection commission in January was held on 2 March. He Guoqiang, Secretary of the Discipline Inspection Commission, addressed the meeting and called for “Quickening the building of the anticorruption and clean-administration systems, preventing and checking corruption from sources” (XHNA, 2 Mar.).
The third conference on clean government work was convened by the State Council on 23 March. Wen Jiabao addressed the meeting. In his speech, he stressed: “This year, China's tasks related to the reform, development and stability are tremendous. The governments at all levels should therefore earnestly carry out the central government's various plans to combat corruption and promote clean government. They should address both the symptoms and the root causes, carry out comprehensive treatment, resort to both prevention and punishment, pay attention to prevention, take the key areas and crucial links as the breakthrough points, step up institution building, as well as strengthen supervision and control of the exercise of administrative powers in order to achieve new results in spurring on the efforts to combat corruption and promote clean government” (XHNA, 23 Mar.).
Three new Vice Ministers of Foreign Affairs were appointed by the State Council on 4 January: Fu Ying (former ambassador to the UK), Cui Tiankai and Zhai Jun. Fu Ying was put in charge of Europe, Hong Kong, Taiwan, and translation and interpretation, Cui Tiankai is responsible for American and Oceanian affairs, and Zhai Jun for West Asia and North Africa and Africa. Vice Ministers Wu Dawei and He Yafei were removed from their positions. Wu became Special Representative for the Korean Peninsula and He became Permanent Representative to the UN in Geneva (XHNA, 4 Jan.).
Luo Huining was appointed acting Governor of Qinghai province on 12 January. Luo, 55, is a native of Anhui and holds a doctorate in economics. He had been Deputy Party Secretary of Qinghai since 2003, and had previously served in Anhui as Head of the Propaganda Department (XHNA, 12 Jan.).
Padma Choling was elected governor of Tibet at that Regional People's Congress on 15 January. He was born in 1951 and served 17 years in the army before entering the Tibet local administration in 1986. He was elected a Vice Chairman of the Regional People's Government in 2003 (XHNA, 15 Jan.).
Chen Quanguo was formally elected Governor of Hebei province on 16 January, having been appointed acting Governor on 15 December. He was born in Henan and served as Deputy Secretary of the Henan Provincial Party Committee from 2003 to 2009 (XHNA, 16 Jan.).
Huang Qifan was formally elected Mayor of Chongqing on 26 January. He was born in 1952 and had been Vice Mayor of Chongqing from 2001 and acting Mayor since December 2009. He has a masters in Business Administration from the China–Europe International Business School. He started his working life as a worker in Shanghai coking plant and later worked in the administration of Shanghai (XHNA, 26 Jan.).
China announced the establishment of National Energy Commission to head up strategic policy making and co-ordination in the energy sector. It will be responsible for drafting a national energy development plan, reviewing energy security and major energy issues, and co-ordinating domestic energy development and international co-operation. It will be headed by Premier Wen Jiabao, with Vice Premier Li Keqiang as the Deputy Head. Its general affairs office would be headed by Zhang Ping (XHNA, 27 Jan.).
Luo Huining was elected Governor of Qinghai on 30 January. He was born in 1954 in Zhejiang, and holds a doctorate from Renmin University. He worked in Anhui for more than 30 years as a worker, and then as a Party and government official. He has been a Deputy Secretary of the Qinghai Party Committee since 2003 and was appointed acting Governor earlier in the month (XHNA, 30 Jan.).
Vice Premier Li Keqiang was appointed Chairman of the newly established State Council Food Safety Commission on 10 February. Vice Premiers Hui Liangyu and Wang Qishan were named as Vice Chairmen (XHNA, 10 Feb.). Zhang Yong was appointed head of its office, at Ministerial level.
d Economic Affairs
Central document No. 1, as is customary, was on the subject of agricultural policy. A press report of 31 January said that China would be putting more investment, subsidies, fiscal and policy support into the rural areas (XHNA, 31 Jan.).
The Ministry of Finance held a national work conference on 11 January. The Minister of Finance, Xie Xuren, highlighted three major focuses of work in the coming year. The first would be structural adjustments to the system. The second would be to boost consumption. Measures would include the suspension of purchase tax on vehicles of 1.6 litres or less; other tax reduction and exemption polices would be examined. The third focus was to improve the people's livelihood. Against the political backdrop of continued implementation of a proactive financial policy, the Ministry expected that stepped-up government investment in education, healthcare, employment, social security, safeguard-type housing and other areas that impact people's livelihood would continue to be the “most important of important undertakings in 2010” (XHNA, 11 Jan.).
Southwest China experienced its worst drought for over 30 years. By the end of January in Yunnan 2.91 million people and 57.5 per cent of the crops had been seriously affected. Rainfall was 207 millimetres lower than average. Reports from Guizhou and Guangxi also noted areas that had been hard hit. On 29 January the Ministry of Finance announced that it was allocating 50 million yuan for relief measures in the region (XHNA, 28 and 29 Jan.). The drought had still not broken in mid-February, by which time about 5.97 million people in Yunnan were suffering from water shortages and nearly 3.56 million hectares of crops were damaged. The Office of the State Flood Control and Drought Relief Headquarters said that over 640 million yuan had been allocated to help with relief measures. It was also reported that northern provinces of China were beginning to suffer from a drought that had lasted 40 days (XHNA, 20 Feb.). By the end of March the drought was reported to have affected 61.3 million people in Guizhou, Yunnan, Chongqing, Sichuan and Guangxi. Eighteen million people were suffering severe water shortages, and losses were estimated at 23.7 billion yuan (XHNA, 30 Mar.). The drought was said to have affected 7.7 million hectares of arable land (out of a total of 122 million hectares). A Vice Minister of Water Resources said the effect on grain production would not be serious (XHNA, 31 Mar.).
On 30 March, the Foreign Ministry spokesman dismissed as groundless reports that China's damming of the Lancang River was contributing to the dramatic fall in water levels of the Mekong. He said that south-western provinces of China were suffering from an unprecedented drought, and that China had always taken a responsible attitude to the use of water resources and fully considered the concerns of countries downstream” (XHNA, 30 Mar.).
Xinjiang was hit by the worst winter for many years and a total of 690 million yuan was spent in relief funds for those affected. Economic losses were estimated to be as high as 2.66 billion yuan (XHNA, 9 Mar.).
Concerns rose over a real-estate bubble, particularly in the bigger cities. On 10 January the General Office of the State Council issued a notice requiring governments at all levels to strengthen their management over the real-estate market, stabilize market expectation and facilitate stable and sound development of the market. It noted a phenomenon of excessively rising house prices in some cities. It called for action on 11 measures including improving the supply of low cost housing for low income families. It required city governments to draw up their plans for residential housing construction in the period 2010–2012 with specific commitments on low-cost housing. Mortgages would be made more difficult for second and subsequent homes, and the down-payment should be at least 40 per cent for such purchases (XHNA, 10 Jan.). House prices in 70 cities rose 7.8 per cent in December 2009 compared with the previous year, and 1.5 per cent over November (XHNA, 14 Jan.). The People's Bank of China reported that individual home mortgage lending had risen 1.4 trillion yuan, up 47.9 per cent from the previous year (XHNA, 21 Jan.). On 29 January the government issued a draft regulation on compensation calling for those whose homes were demolished for redevelopment to be compensated at market prices (XHNA, 29 Jan.). In a pre-NPC exchange with the people over the internet, Premier Wen Jiabao said that he was determined to tame the “wild horse” of the housing market and keep property prices at a reasonable level. House prices in January rose at 9.5 per cent from the previous year, the fastest pace in 19 months. Premier Wen said that the government would increase the housing supply, implement various tax and other policies to help people buy their own homes, and crack down on illegal activities which drove up prices (XHNA, 27 Feb.). On 25 February, the National Statistic Bureau issued figures showing only a 1.5 per cent annual increase in house prices. On 5 March, the Director of the Bureau admitted that there were mistakes with the methodology, and that the figure might not fully reflect price fluctuations. He claimed it was an honest mistake and that the Bureau would take effective measures to improve (XHNA, 5 Mar.). Prices rose again in February by 10.7 per cent (XHNA, 9 Mar.).
Figures released by the General Administration of Customs on 10 January suggested that China might become the world's largest exporter, despite a fall of 13.9 per cent in exports over the year. December showed the first increase for over a year when exports rose 17.7 per cent from the previous year. Total exports in 2009 were valued at US$1.2 trillion, down 16 per cent from 2008. Meanwhile imports reached a monthly record of US$112.3 billion, an increase of 55.9 per cent from the same period the previous year. In 2009 imports were US$1.01 trillion, down 11.2 per cent. They included huge increases in the import of iron ore (up 41.6 per cent) and crude oil (up 13.9 per cent). In total, China's foreign trade dropped 13.9 per cent and the annual surplus fell 34.2 per cent to US$196.1 billion (XHNA, 10 Jan.).
e Statistical Communiqué on National Economic and Social Development during 2009
[Note: The figures showing percentage changes in production over 2008 are taken verbatim from the National Bureau of Statistics [NBS] communiqué. They do not always coincide with the estimates that would be obtained from a comparison of the 2009 estimates with those for 2008 given in “Quarterly Chronicle” in CQ, No, 198, pp. 513-523.
Data in square brackets show data/annual percentage increases in 2008 over 2007, and are included for comparative purposes.]
The latest statistical communiqué was issued by National Bureau of Statistics (NBS) on 25 February (http://www.stats.gov.cn/english/newsandcomingevents/t20100226_402623115.htm). The brief introductory remarks noted that national economic performance had recovered and was heading in a good direction thanks to the proactive fiscal policy and relatively easy monetary policy, and the package of reforms aimed at dealing with the international financial crisis in an all-round way.
The main features of China's economic performance in 2009 are summarized below:
Overview
Preliminary estimates indicated that in 2009, GDP rose by 8.7 [9] per cent in terms of comparable prices to reach 33,535.3 billion yuan. Agricultural growth slowed somewhat in 2009, up 4.2 per cent compared with 5.5 per cent the previous year. Primary sector growth remained significantly lower than that of both industry (9.5 [9.3] per cent) and services (8.9 [9.5] per cent) which held steady compared to 2008. Sectoral shares of GDP were 10.6 [11.3] per cent (primary), 46.8 [48.6] per cent (secondary) and 42.6 [40.1] per cent (tertiary).
Agriculture
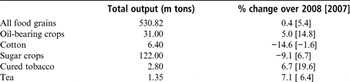
2009 saw a further expansion of the grain-sown area by 2.17 million hectares (ha) to 108.97 million ha; the sown areas' oil-bearing crops both increased (by 0.76 million ha), the area under cotton declined sharply (by 0.8 [0.17] million ha), and that under sugar fell 0.11 million ha after an expansion the previous year.
The output of major farm crops is shown in Table 3.
Output of Major Farm Products, 2009

Total meat output rose by 5.0 [5.9] per cent to 76.42 million tons. Output of pork, beef and mutton all increased (by 5.8 [7.6], 3.6 [−0.5] and 2.4 [−1.8] per cent respectively). Total output of aquatic products was 51.20 million tons, or 4.6 per cent more than in 2008. Timber production dropped sharply by 14.4 per cent [having increased the previous year] to 69.38 million cubic metres.
Effective irrigation was extended to an additional 1.471 [1.179] million ha of arable land, in addition to which an extra 1.826 [1.39] million ha were brought under guaranteed water-saving irrigation facilities.
Industry
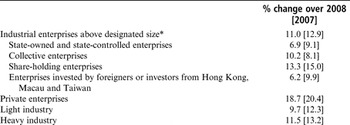
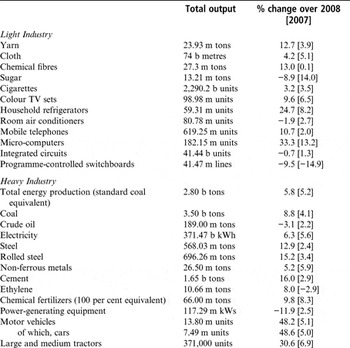
Industrial value-added grew by 8.3 [9.5] per cent in 2009. Further details are given in Table 4. The outputs of important industrial products are shown in Table 5. Industrial profitability continued to improve in 2009, at a slightly faster pace than in 2008. The overall rate of increase in profits in enterprises of above-designated size was 7.8 [4.9] per cent (January–November only). Concealed in this figure were the following changes in profitability by different enterprise ownership category during the same period:

Rate of Growth of Industrial Value-added, 2009

Note:
* i.e. all state-owned enterprises and those non-state-owned enterprises with an annual sales income over 5 million yuan.
Output of Major Industrial Products, 2009

Construction industry growth accelerated from 7.1 per cent to 18.2 per cent, and construction enterprises generated profits of 266.3 billion yuan (23.9 per cent above the 2008 level).
Fixed investment
In 2009 the rate of expansion of fixed-asset investment increased significantly (from 25.5 to 30.1 per cent). Relevant disaggregated data are shown in Table 6.
Fixed Investment Growth by Sector and Region

Urban investment in the primary sector rose by a further huge amount 49.9 [54.5] per cent in 2009; the corresponding figures for urban secondary and tertiary fixed investment were 26.8 [28.0] per cent, and 33.0 [24.1] per cent. Regional levels and rates of fixed investment in 2008 were as follows:

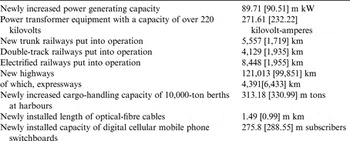
Table 7 summarizes the net impact of capital construction investment on production capacity in 2009.
New Increases in the Production Capacity of Selected Industries, 2009

Transport and telecommunications
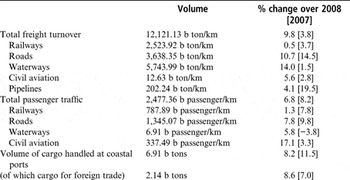
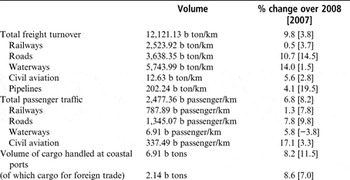
There was continued growth in both passenger and freight transport in 2009, as shown in Table 8.
Passenger and Freight Traffic in 2009
The turnover of post and telecommunication services increased by 14.6 [20.7] per cent. The total number of fixed-line subscribers fell again to 313.69 million [340.81] – 211.78 [232.0] million in cities, and 101.912 [108.81] million in rural areas. There were 106.14 [93.9] million new mobile phone subscribers, taking the total number of users to 747.38 [641.23] million at the end of 2009. Thus, the total number of telephone users reached 1,061.07 [982.04] million; on average, telephone coverage reached 79.9 [74.3] for every 100 members of the Chinese population. The number of internet users rose from 300 to 380 million and broad-band users reached 350 [270] million.
China received 126.48 million international visitors in 2008 – 2.7 per cent fewer [–1.4] than in 2008. Of these, 21.94 [24.33] million were “foreigners” (a fall of 9.8 per cent [–6.8]); and 104.54 [105.70] million were “Chinese compatriots” from Hong Kong, Macau and Taiwan (down by a mere 1.1 [–0.1] per cent). Foreign exchange earnings from international tourism totalled US$39.7 billion, or 2.9 per cent less than in 2008. Some 47.66 [45.84] million Chinese made overseas visits, of whom 42.21 [40.13] million undertook private visits (up 5.2 [14.9] per cent). Revenue from domestic tourism was 1,018.4 billion yuan (a rise of 16.4 [12.6] per cent).
Domestic trade
In 2009, real growth in the value of retail sales of consumer goods was up 15.5 [21.6] per cent to reach 121,534.3 billion yuan (up by 15.5 [22.1] per cent in cities, and 15.7 [20.7] per cent in rural areas). More disaggregated estimates of sales growth are shown below (all figures in percentages):

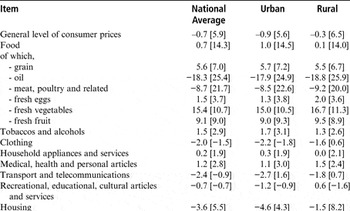
Overall prices fell in 2009 and China experienced deflation. The general consumer price index fell by 0.7 [+5.9] per cent. Manufactured goods producer prices fell sharply by 5.4 per cent after an increase of 6.9 per cent the previous year, and purchase prices for raw materials, fuels and power fell by 7.9 [+10.55] per cent. In marked contrast to previous years, agriculture producer prices fell by 2.4 [+20.3] per cent. Sales prices for housing in 70 large and medium cities were almost flat (+1.5 per cent) after a 7.1 per cent rise the previous year. Consumer price changes for specific goods, or categories of goods, are shown in Table 9.
Change in the Consumer Prices of Selected Goods, 2009 [2008] (%)

Foreign trade and external relations
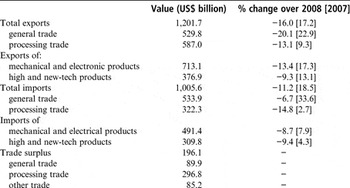
Under the impact of the global economic downturn, foreign trade was hard hit, with both exports and imports turning negative and falling considerably (see Table 10).
Levels of and changes in imports and exports, 2009

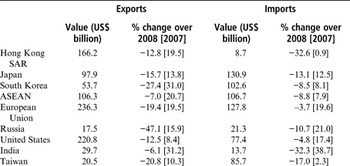
The combined value of exports and imports fell by 13.9 [+17.8] per cent to US$2,207.2 billion. The value of China's exports was US$1,201.7 billion (down by 16.0 [+17.2] per cent), while imports fell slightly less by 11.2 [+18.5] per cent to US$1,005.6 billion. Foreign-funded enterprises generated exports worth US$790.6 billion (up by 13.6 [26.9] per cent); the value of their imports rose by 10.8 [18.4] per cent to US$620 billion. The corresponding figures for state-owned enterprises were US$257.2 and US$353.8 billion (recording rises of 14.4 and 31.1 per cent, respectively). Overall, China enjoyed a merchandise trade surplus of US$196.1 billion, or US$102.0 [+ $32.8] billion less than in the previous year. A geographical breakdown of China's exports is shown in Table 11.
The Direction of China's Foreign Trade, 2009

Foreign investment also slowed. Inflows of utilized foreign direct investment (FDI) fell by 2.6 [23.6] per cent to reach US$90.0 billion. Manufacturing absorbed US$46.7billion – a fall of 6.3 per cent over 2008, and a further US$16.8 billion were allocated to real estate (a fall of 9.7 per cent).
At the end of 2009, China's foreign exchange reserves totalled US$2,399.2 billion – US$453.1 billion more than a year earlier. During the same period, the exchange rate with the US dollar remained stable, increasing only 0.1 per cent to stand at RMB 6.8282 to US$1, following appreciations of 6.9 per cent in the two previous years.
Banking and insurance
The NBS Communiqué noted that at the end of 2009, savings deposits lodged in all kinds of financial institutions totalled 61,200.6 [47,844.4] billion yuan, 27.7 [19.3] per cent higher than at the end of 2008. Savings by enterprises reached 22,435.7 billion yuan – a rise of 36.5 [13.5] per cent. Savings by urban and rural residents totalled 26,467.1 billion yuan (up 19.5 [25.7] per cent).
There were significant increases in the money supply. The volume of cash in circulation (M0) rose by 11.8 [12.7] per cent to 3.8 trillion yuan; the corresponding rates of increase for narrow (M1) and broad (M2) money were 32.4 [9.1] per cent, and 27.7 [12.7] per cent.
Welfare, living standards and employment
Per capita cash disposable income of urban residents reached 17,175 [15,781] yuan in 2009 [2008] (a real rise of 9.8 [8.4] per cent over that of the previous year). Rural residents' average per capita net income was 5,135 [4,761] yuan: this represented a real increase of 8.5 [8.0] per cent. The urban and rural Engel coefficients were 36.5 [37.9] and 41.0 [43.7] per cent, respectively. The number of rural residents living in poverty (i.e. with an annual net per capita income of less than 1,196 yuan) was estimated to be 35.97 [40.07] million.
There were also improvements in both urban and rural social security provision. By the end of 2009, 234.98 [218.9] million people (177.03 [165.97] million employees and 57.95 [52.93] million retirees) were enrolled in basic pension programmes. Some 127.15 [124] million urban residents had joined unemployment insurance schemes, while 400.61 [316.98] million were covered by basic health insurance (including 43.35 [42.49] million migrant workers). Work accident insurance was provided for 148.61 [138.1] million people, including 55.80 [49.76] million migrant workers. Some 108.6 [91.81] million were enrolled in maternity insurance programmes. For the third year running, the number of people who received unemployment insurance payments fell, from 2.61 to 2.35 million. Finally, 23.48 [23.24] million urban residents were in receipt of minimum income relief from the government, while the corresponding figure for rural residents was 47.593 million up from 42.91 million in 2008.
Total employment in 2009 was 779.5 million (5.15 million more than in 2008). The net increase in urban employment was 9.1 [8.6] million, and total urban employment was 311.2 [302.1] million. The official rate of registered urban unemployment was 4.3 per cent – 0.1 per cent above that of 2008.
Population
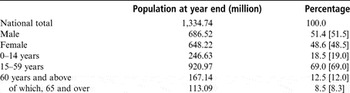
China's total population at the end of 2009 was 1,334.74 [1,328.02] million. Of this total, urban residents numbered 621.86 [606.67] million (46.6 [45.7] per cent of the total); rural residents totalled 712.88 [721.35] million, or 53.4 [54.3] per cent of the total.
Vital rates for 2008 are shown in Table 12; the sex ratio and age structure of China's population are shown in Table 13. The sex ratio at birth was 119.45.
Vital Population Rates, 2009 [2008]

Sex Ratio and Age Structure of China's Population, 2009 [2008]

Resources and environment
Land reclamation and redevelopment programmes added 269,000 [229,600] ha of cultivated land. But this was more than offset by a loss of 319,000 ha (an increase of 44 per cent over the previous year) of agricultural land to construction use.
In 2009 the average per capita availability of water fell to 1,784.9 [2,048] cubic metres, more than wiping out the gains of the previous year. At the end of the year, water storage in China's large reservoirs was 180.5 [196.2] billion cubic metres. Total water consumption increased by 0.4 [0.4] per cent to 593.3 billion cubic metres. Of this, consumption for living purposes increased by 2.9 [0.6] per cent, for industrial use it fell by 0.6 per cent, but for farm use it rose after falling for two years by 0.6 [−0.2] per cent. Per capita water consumption averaged 445.7 [440.9] cubic metres. Water consumption per 10,000 yuan of GDP and per 10,000 yuan of industrial value-added declined by 7.6 [−7.9] and 8.2 [−7.0] per cent, respectively.
Based on monitoring of 408 sections of China's seven major water systems, 57.1 [55] per cent satisfied the national quality standard of Grades I–III for surface water, while 18.4 [20.8] per cent fell below Grade V level. There was some improvement in the quality of oceanic water at the higher end of the scale with 72.9 per cent of stations meeting Grade I or II standards (up 2.5 per cent), but equally at the lower end there was an increase in the number at Grade IV or below, now comprising 21.1 per cent of all stations. Impressive achievements were claimed for air quality with 504 of 612 cities monitored reaching Grade II or above and only eight falling below Grade III.
Since there was no event comparable to the Wenchuan earthquake, economic losses caused by natural disasters resumed a more “normal” rate, estimated at 252.4 billion yuan (compared to 1,175.2 billion yuan in 2008 and 236.6 in 2007). The area of crop land affected by natural disasters rose from 39.99 to 47.21 million ha. Meanwhile, man-made disasters continued to exact a heavy toll, although in 2008 the number of traffic accidents – 238,000 [265,000] – for the fifth year running showed a significant decline. Some 68,000 [73,000] people were killed and 305,000 [380,000] were injured in such accidents. Traffic accidents caused direct property losses estimated at 910 million [1.01 billion] yuan. The death toll as a result of work accidents in mining, industrial and commercial enterprises fell again by 8.8 [10.2] per cent to 83,195. In particular, the death toll associated with the production of each million tons of coal declined by 24.5 [20.4] per cent.
Newly discovered mineral resources included 1,120 [1,340] million tons of crude oil, 723.4 [647.2] billion cubic metres of natural gas, and 50,360 [23,110] million tons of coal.
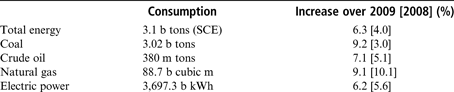
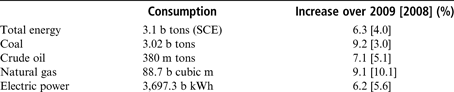
The preliminary 2008 estimates of energy consumption provided by the NBS communiqué are shown in Table 14.
Consumption of Energy, 2009
f Media and information
A spokesman of the State Council Information Office told the Chinese press that China's regulation of the internet was legal and should be free from unjustifiable interference. China had regulations such as the Constitution, the Law on the Protection of Minors, the NPC Decision on Internet Safety, the PRC Telecommunications Regulations, and the Internet Information Service and Management Methods which provided legal authority for the prohibition of online material which incited subversion, violence or terrorism or included pornographic content, and this had nothing to do with “restrictions on internet freedom.” China was willing to discuss internet development and management with other countries, but was firmly opposed to any defiance of Chinese law or interference in China's domestic affairs under the guise of “internet management.” China now had 384 million netizens and over 3.68 million websites. He said that
[i]n China, there are now more than one million online forums and 200 million bloggers. Netizens publish more than 4 million pieces of blog writings each day. There are incalculable BBS postings at various kinds of online forums every day. Such huge numbers of forums, blog writings, and postings are hard to imagine in other countries. Chinese netizens, within the framework of law, can fully express their views (XHNA, 24 Jan.).
On 25 January, a spokesman of the Ministry of Industry and Information Technology denied any Chinese government involvement in cyber attacks. “Accusation that the Chinese government participated in cyber attack, either in explicit or inexplicit way, is groundless and aims to denigrate China. We are firmly opposed to that.” He said that Chinese law prohibited hacker attacks and claimed that China was in fact the biggest victim of such attacks. He claimed that in 2009 more than one million computer IP addresses in China were controlled from abroad and 42,000 websites were tampered with by hackers. China was determined to oppose any form of network attack and had developed numerous regulations and methods to prevent them (XHNA, 25 Jan.).
Following reports in the New York Times that cyber attacks on Google and other firms had been traced back to Lanxiang Vocational School in Shandong, the school responded that it had carried out investigations and found no trace of such activity, and that the school had no connection with the Chinese military. Shanghai Jiaotong University was also mentioned in The New York Times and professed itself shocked and indignant at the allegations (XHNA, 20 Feb.). On 25 February, a spokesman for the Ministry of Defence said that associating hackers' cyber attacks with the Chinese government and military was groundless and irresponsible. He said that the “Chinese government attaches great attention to combating cyber crimes and is committed to improving co-operation in this regard with other countries and international organizations” (XHNA, 25 Feb.).
On 10 January, Xinhua reported that Google had apologized to the Chinese Writers' Association for scanning a number of books under Chinese copyright for its digital library. The company promised to work out a settlement proposal and a framework agreement on the subject by March 2010. The Chinese Writers' Association claimed that Google had scanned about 18,000 titles from 570 Chinese authors without offering or paying any copyright (XHNA, 10 Jan.).
On 12 January Google announced that it needed “to review the feasibility of our operations in China,” and that the company might have to shut down Google.cn and possibly its offices in China if it could not operate uncensored within the law. It complained that a number of its Gmail accounts, particularly those belonging to human rights activists, were being “routinely accessed” by third parties. It went on to say that “[w]e have decided we are no longer willing to continue censoring our results on Google.cn, so within the next few weeks we will be discussing with the Chinese government the basis on which we could operate an unfiltered search engine within the law, if at all” (Kyodo News Agency, 13 Jan., and BBC news website, 13 Jan.). Chinese authorities professed themselves unaware of Google's intentions, and an official of the State Council Information Office was quoted as saying that “it is hard to say whether Google will quit China or not. Nobody knows” (XHNA, 13 Jan.).
The Chinese Foreign Ministry spokeswoman said on 14 January that China's internet was open and welcomed international companies to conduct business within China according to the law (XHNA, 14 Jan.). The US government was soon involved. Mrs Clinton issued a statement on 15 January noting that “We have been briefed by Google on these allegations, which raise very serious concerns and questions. We look to the Chinese government for an explanation. The ability to operate with confidence in cyberspace is critical in a modern society and economy” (Ming Pao website, 15 Jan.). Vice Foreign Minister He Yafei was quoted as saying that the case had been “over interpreted” and should not be linked to Sino–US relations. If foreign companies experienced difficulties in China they should seek solutions in accordance with Chinese law, and the Chinese government was willing to help them in this (XHNA, 21 Jan.). Mrs Clinton made a major speech on internet freedom on 21 January which contained some criticism of China and called for China to lift its restrictions on citizens' use of the internet. In response, the Chinese Foreign Ministry spokesman said that the US should respect facts and stop unreasonable accusations against China, since China's internet was open and China had seen the most active development of the internet in the world (XHNA, 22 Jan.).
A Xinhua commentary claimed that Google's decision to invite the National Security Agency to help with its inquiry into cyber attacks could pose serious threats to other countries' national and commercial security (XHNA, 25 Feb.). On 12 March, the Minister for Industry and Information Technology responded to remarks by Google executives that they were firm in their decision to stop censoring internet results in China, and would quit if necessary. He said: “If Google decides to stay in China, we welcome and it will help boost the development of the country's Internet industry … [i]f it decides to quit, we will follow our procedures.” The minister said that he hoped Google would obey Chinese law, and that it would be irresponsible and unfriendly if it were to insist on doing something against the law and would have to bear the consequences (XHNA, 12 Mar.). On 23 March, Chinese officials claimed that Google had violated a written undertaking when it decided to stop censoring its Chinese-language search results, and was redirecting Chinese users to a site in Hong Kong. A Chinese official from the State Council Information Office was quoted as saying that Google had violated a written promise it made when entering the Chinese market by stopping filtering its searching service and blaming China by insinulation for alleged hacker attacks. The official said that this was totally wrong and China was uncompromisingly opposed to the politicization of the issue. He claimed that Chinese officials had met Google executives twice on 29 January and 25 February to hear the company's view (XHNA, 23 Mar.).
g Human Rights
The lawyer Li Zhuang was sentenced to two and half years in prison for having himself given false evidence and for inciting others to do so in one of the Chongqing gangland cases on 8 January. Li had been assigned as defence lawyer to Gong Gangmo, one of those charged with gang-related offences. Li was alleged to have advised Gong to retract his confession and to fabricate an allegation of torture by the police during the interrogation (XHNA, 8 Jan.). At his appeal hearing on 2 February, he admitted all charges against him but insisted on being allowed to appeal (XHNA, 2 Feb.). His sentence was cut to one and a half years on appeal, but according to the Hong Kong press, he claimed that he had only pleaded guilty as part of a deal to get him a suspended sentence, on which the authorities had reneged (SCMP website, 10 Feb.).
On 9 February, Tan Zuoren, an activist who had been investigating the shoddy building that contributed to the losses in the Sichuan earthquake, was sentenced to five years for subversion in Chengdu, Sichuan. The charges related to articles he had written commemorating Tian'anmen, and contacts with the overseas dissident Wang Dan, rather than his activities investigating the earthquake tragedy (Kyodo News Agency, 9 Feb.).
On the same day, the Supreme People's Court issued new guidelines on limiting the use of the death penalty through a policy of “justice tempered with mercy.” It reaffirmed that that the death penalty should be used “resolutely” against those convicted of extremely serious crimes, but that the punishment should be reserved for the tiny minority of criminals against which there is valid and ample evidence. The policy was first enunciated in a document approved by the Party Central committee in 2006 (XHNA, 9 Feb.).
The Beijing Intermediate Court rejected Liu Xiaobo's appeal against his sentence and upheld the original verdict on 11 February (XHNA, 11 Feb.). Commenting on the case, the South China Morning Post noted that in recent years there had been a sharp increase in the number of dissidents being jailed in China. In 2008 more than 1,700 individuals were arrested on charges such as endangering state security (compared with 742 in 2007 and 296 in 2005) (SCMP website, 12 Feb.).
China published a report on 12 March on the US record on human rights in retaliation for the Country Reports on Human Rights published by the State Department on 11 March. Chinese officials noted that: “as in previous years, the [US] reports are full of accusations of the human rights situation in more than 190 countries and regions including China, but turn a blind eye to, or dodge and even cover up, rampant human rights abuses on its own territory” (XHNA, 12 Mar.).
China described Britain's annual report on human rights, which had named China as one of 22 countries of concern, as “an ideological political show.” The Foreign Ministry spokesman asked why the concentration was on developing countries and no mention was made of some Western countries that violated human rights. He added that China was committed to promoting and protecting its people's human rights and fundamental freedoms (XHNA, 18 Mar.).
The Japanese Government expressed concern over China's announced intention to execute a convicted Japanese drug dealer. Both the Prime Minister and the Foreign Minister expressed their regret at the decision and said that they had made representations to the Chinese authorities. The individual in question was named as Mitsunobu Akano, and would be the first Japanese national to be executed since relations were normalized in 1972 (Kyodo News Agency, 30 Mar.).
h Social Developments
Reform of the household registration was one of the leading topics of discussion in the lead up to the National People's Congress. In a highly unusual move, just before the session opened, a joint editorial was published in 13 newspapers across the country calling on the Congress to abolish the “hukou system.” The editorial attacked the system in strong terms describing it as unconstitutional and a flagrant violation of human rights:
China's people have been suffering from the hukou system for a long time…We believe people are born to freedom and … the right to migrate… We jointly release this editorial, asking all representatives of the NPC and CPPCC to make good use of your political power to urge the authorities to launch a reform with the aim of doing away with the ossified hukou system.
According to the editor, it had been proposed by the Economic Observer two months previously (SCMP website, 2 Mar.). The government subsequently ordered the editorials to be removed from the papers' websites, and senior staff at the Economic Observer were reported to have received disciplinary warnings. Premier Wen did refer to reform of the system in his work report to the NPC but without making any clear commitments (SCMP website, 6 Mar.).
The annual meeting on religious affairs work was held on 12 January. Important instructions were given by Jia Qinglin, member of the Politburo Standing Committee and Chairman of the CPPC, and by Vice Premier Hui Liangyu, also a member of the Politburo (XHNA, 12 Jan.).
The Head of China's Religious Affairs Bureau, Wang Zuo'an, was reported to have claimed in an article in Qiu Shi that there was a rise in mass incidents related to religion which should be seriously noted and measures should be taken to improve China's ability to deal with them. He also said that external forces were still using religion to infiltrate the country (Kyodo News Agency, 1 Feb.).
In Hong Kong, Ming Pao reported that two Buddhist monks who had been involved in demonstrations in Tiananmen in 1989 had been appointed to senior posts in the Buddhist Association of China. Master Chuan Yin was appointed Chairman and Master Jing Hui a Vice Chairman of the Association. They had led over 120 monks to back the hunger strikers in Tiananmen (Ming Pao website, 1 Feb.). The Chinese state media reported that the Chinese-recognized 11th Panchen Lama had also been appointed a Vice Chairman of the Association (XHNA, 3 Feb.).
Premier Wen Jiabao led discussion of the draft “State Guidelines for Middle- and Long-Term Educational Reform Development Plan,” which seeks to draw up directions for educational policy to 2020. The drafting process began in August 2008 and a leading group under Premier Wen was set up to oversee the drafting. Wen said the reform plan must stick to principles including emancipation of the mind from shackles of traditional concepts and systems to realize scientific development in education, letting teaching faculty, instead of the administrative staff, play a leading role in schools, and advancing an equal distribution of educational resources (XHNA, 7 Feb.). The document was released on 28 February. The press reports of its release said that the aim of the reform was to improve the quality of education and enable people to enjoy equal access to education through more investment and reform. The target was to raise the percentage of GDP spent on education from its present 3.48 per cent to 4 per cent. China would invest more to improve facilities in elementary and middle schools, such as school buildings, teaching equipment, libraries, sports facilities and lodging conditions, particularly for rural schools. More college graduates will be encouraged to teach at elementary and middle schools in remote and poor areas. Private education would be encouraged and unfavourable policies eliminated (XHNA, 28 Feb.).
As of 31 December, China reported 648 deaths from the A/H1N1 influenza. Some 120,000 cases had been reported, of whom 110,000 had recovered. Almost 50 million people had been vaccinated against the disease. Fewer cases were now being reported although it was expected that pressure would rise in the next two months especially over the New Year period (XHNA, 2 Jan.).
i Defence
China announced on 11 January that it had successfully conducted a test on a ground based mid-course missile interception system, and that the test was defensive in nature and not targeted at any country. Unnamed Chinese analysts related the test to the US decision on selling Patriot missiles to Taiwan (SCMP website, 12 Jan.). The Hong Kong Chinese press quoted Chinese military experts as saying that the test had nothing to do with US arms sales to Taiwan (Wen Wei Po website, 12 Jan.). It also quoted Hong Yuan, a researcher at the Centre for Arms Control and Non-Proliferation at the Chinese Academy of Social Sciences, as saying that while there was no way to tell if the events were related, if the US continued to hurt China's core interests, China had more trump cards up its sleeve: “China's strategic countermeasures against the United States will steadily intensify. The era when the United States can do what it wants and have its own way is gradually slipping away” (Wen Wei Po website, 13 Jan.).
j Tibet
In preparation for the Fifth Central Work Conference on Tibet, the Politburo held a meeting on 8 January to discuss Tibet's development and its long-term stability. The meeting was presided over by Hu Jintao. It noted that solid achievements had been secured since the Fourth Work Conference. Participants agreed that Tibet's development was important to the building of a well-off Chinese society, safeguarding China's national security and the fundamental interests and long-term development of the Chinese nation (XHNA, 8 Jan.).
In Tibet on 10 January, the annual session of the Regional People's Congress announced that Tibet would be completing a registration and recording of all places of religious activity and the qualifications of living Buddhas, monks and nuns in the course of the year. Efforts would be made to crack down on the use of religion to engage in divisive and disruptive activities (XHNA, 10 Jan.).
The Fifth Central Work Conference on Tibet was held in Beijing between 18 and 20 January. In contrast to previous such meetings comparatively little information was published on the content of the discussions. The Chinese press headlined the meeting as making plans for achieving great leap in the development and lasting stability in Tibet, and that great efforts should be made to improve the living standards of people in Tibet as well as ethnic unity and stability.
President Hu Jintao made a speech in which he said that work on Tibet was of great importance to China's overall development and vital to ethnic unity, social stability, and national security as well for a favourable international environment. Hu said that the principal contradiction for Tibet remained that between the growing material or cultural needs of the people and the backwardness of social production. Tibet also faced a special contradiction between the people of all ethnic groups. The speech contained no direct reference to the disturbances in Tibet in 2008 and was noticeable for the lack of sustained rhetoric against the Dalai Lama, although he did call for firm action against the “penetration and sabotage” by “Tibet independence” separatists. But there was no evidence of any substantial change in China's basic policies towards Tibet, which remained firmly based on economic development. President Hu called for greater efforts to be made improve the living standards of farmers and herdsmen. The meeting reaffirmed that the Party's policies on Tibet “in the new era were totally correct, suited to national condition, Tibet's actual conditions and the fundamental interests of people of all ethnic groups in Tibet.” In the future, Tibet should focus on development and stabilization to promote the standards of people's material and cultural life, to improve the environment and establish an united, rich, civilized and harmonious Tibet. Hu called for per capita income in Tibet to reach national levels by 2020. Speeches were also given by Wen Jiabao, who said that priority should be given to people's livelihood, social services, infrastructure, industries with regional features and environmental protection, and by Jia Qinglin, Chairman of the CPPCC Standing Committee (XHNA, 22 Jan.).
Representatives of the Dalai Lama, led by Lodi Gyari and Kelsang Gyaltsen, travelled to China on 26 January for a ninth round of dialogue. The previous round had come to a halt when the Chinese rejected the memorandum on the autonomy of Tibet presented by the Tibetan side (SCMP, 26 Jan.). The Chinese Foreign Ministry spokesman gave little away, acknowledging that contacts would be taking place, and saying that the Chinese government hoped that the Dalai Lama would cherish the opportunity of fresh contacts and respond positively to the request of the central government. He added that China's policy towards the Dalai Lama was consistent and clear (XHNA, 26 Jan.). On 1 February, the United Front Work Department of the Party announced that officials had met private envoys of the Dalai Lama. The Chinese side was led by Du Qinglin, Head of the United Front Work Department, and Zhu Weiqun Executive Vice Minister of the United Front Work Department, and included Sita, Vice Minister of the United Front Work Department and Nyima Cering, Vice Chairman of the Standing Committee of the Tibet Regional People's Congress. “During the meetings, CPC officials introduced the achievements made by the Tibet Autonomous Region over the past years under the leadership of the CPC and reiterated that no concessions would be made on issues concerning China's national sovereignty.” The Dalai Lama's envoys had “expressed their opinions on relevant issues.” The Director of the United Front Work Department, Du Qinglin, said that the central government had been consistent and clear in policy concerning the Dalai Lama:
The door for contacts and talks is open, and the policy has not been changed so far… If the Dalai Lama really hoped to make progress in contacts and talks and remedy relations with the central government, [he should] respect history, conform to the times, clearly understand the reality, and cast aside illusions (XHNA, 1 Feb.).
Subsequent Chinese official statements were even more dismissive of the meetings noting that positions between the two sides were sharply divided as usual. They said that the private representatives “have no legal status to discuss with us the affairs about Tibet Autonomous Region… They are only the Dalai Lama's private representatives, so they can only talk about the prospect of the Dalai Lama, at most, the prospects of a small party around him” (XHNA, 2 Feb.). According to the Kyodo News Agency, the envoys expressed disappointment over the results of the talks. They had urged the Chinese to stop calling the Dalai Lama a separatist and engage with him on the future of Tibet. Major differences had emerged over the situation in Tibet and the envoys had proposed a common effort to study the reality on the ground. The Chinese had briefed on the recent Work Conference on Tibet (Kyodo News Agency, 2 Feb.).
On 10 March, the second anniversary of disturbances in Tibet, the Dalai Lama made a speech in Dharamsala in which he accused China of trying to “annihilate Buddhism” in Tibet: “Today, the Chinese authorities are conducting various political campaigns, including a campaign of patriotic re-education in many monasteries in Tibet. They are putting the monks and nuns in prison-like conditions depriving them the opportunity to study and practise in peace.” He said that although there had been no positive response from China “our stand to continue with the dialogue remains unchanged” (Press Trust of India, 10 Mar.). Reaction from China was dismissive, saying that no matter what new wording he used, his ultimate political attempt of sabotaging ethnic solidarity and splitting China had never changed (XHNA, 10 Mar.). The Foreign Ministry spokesman said on 11 March that “[t]he Dalai Lama distorted the true situation in Tibet and attacked the central government's policies in the region in a bid to trumpet his separatist claims of independence or semi-independence,” and urged him to cease such activities so as to create conditions for contacts and talks with the central government (XHNA, 11 Mar.).
k Xinjiang
The Chairman of the Xinjiang Regional People's Congress Standing Committee announced that revised “Regulations on Comprehensive Management of Social Security of Xinjiang Uyghur Autonomous Region” would come into force on 1 February. These would further enhance the authorities' ability to strike hard at the “three evils” of terrorism, separatism and extremism (XHNA, 6 Jan.).
Text messaging services were restored in Xinjiang on 17 January following a series of earlier relaxations on access to selected internet sites. Online banking and other services were also resumed. All internet connections and text messaging services had been cut in Xinjiang after the riots in July (XHNA, 17 Jan.). Restrictions on a further 27 sites were relaxed on 6 February. Restrictions on e-mails and text messages were lifted on 21 March (XHNA, 21 Mar.).
On 26 January, Zhou Yongkang, member of the Politburo Standing Committee and Secretary of the Central commission on Political Science and Law, presided over a meeting of the leading group for the preparation of the Central Work Conference on Xinjiang. He noted that there had been a Politburo meeting recently at which it was decided to hold a Central Work conference on Xinjiang in 2010 to make major plans for Xinjiang's development and ensuring its lasting peace and stability. The meeting heard reports from various government and Party departments which had sent study groups to Xinjiang in advance of the conference (XHNA, 27 Jan.). A meeting on the development of Xinjiang was held in Beijing on 29 and 30 March at which more central government support was promised. The lead speakers were Vice Premier Li Keqiang and Zhou Yongkang. The Central Work Conference is scheduled for the first part of the year (XHNA, 1 Apr.)
A ceremony was held in Urumqi on 8 February to mark the establishment of an elite unit in the People's Armed Police in Xinjiang which would constitute a mobile operations force based in Urumqi but capable of deployment all over the region. Its members were drawn from all over Xinjiang and also took in the “cream of the crop” from PAP units nationwide. It was referred to as the Sixth Detachment of the Xinjiang Division of the PAP (XHNA, 9 Feb.).
Nur Bekri, chairman of the Xinjiang Regional People's Government, told reporters that China had now sentenced 198 people in 97 separate cases in connection with the riots in Xinjiang in July, although the final figure would be higher (XHNA, 7 Mar.).
l Hong Kong Special Administrative Region
The South China Morning Post reported that tens of thousands of people had demonstrated outside the building of the Central Government Liaison Office on the evening of 1 January calling for genuine universal suffrage. Police put the numbers at about 9,000 but the organizers claimed 30,000 (SCMP website, 2 Jan.).
On 11 January, the Civic Party and the League of Social Democrats announced that five of their legislators would resign on 27 January to bring about a by-election which they would portray as a referendum on democracy and universal suffrage (RTHK, 11 Jan.). The Hong Kong government responded that this move would only obstruct the community focussing on discussion of how to democratize Hong Kong further. It considered the resignation unnecessary. The spokesman noted that there was no provision in the Basic Law for any kind of referendum, and that the Basic Law clearly specified the means by which amendments to electoral methods should be achieved.
On 15 January, the State Council Hong Kong and Macau Affairs Office issued a statement saying that the “five districts referendum” had no legal basis in the Constitution and violated the Basic Law. The National People's Congress Standing Committee had already made arrangements for the development of Hong Kong's political system, including the principles and procedures that a universal suffrage of the Chief Executive and Legislature should follow. It praised the Chief Executive for saying that the Hong Kong Government would not recognize any form of referendum on the issue and said that no matter how different the opinions on the constitutional development of the SAR were, the Basic Law should be obeyed (XHNA, 15 Jan.). The five legislators submitted their resignations on 26 January. The Liberal Party said it boycotted the by-election and the pro-Beijing Democratic Alliance for the Betterment of Hong Kong (DABHK) was considering following suit. The Chief Executive, Donald Tsang, said that that the government deeply regretted the resignation, and that many members of the public would be disappointed over their refusal to back down, even though many people had expressed concerns that the legislators were wasting money and abusing the political process. He added that the so-called referendum had no basis in law and would not be recognized by the government (RTHK, 26 Jan.).
Vice President Xi Jinping met the Hong Kong and Macau delegation to the National People's Congress and the CPPCC on 4 March. Referring to the consultation on electoral reform, he said that the majority of citizens hoped that Hong Kong's political system would move forward in 2012 on the basis of the Basic Law and the NPC Standing Committee decision. He added that “the central government wholeheartedly hopes that Hong Kong people from all walks of life will keep on holding rational and pragmatic discussion in view of Hong Kong's interests as a whole, reaching wide consensus and pushing forward the democratic development in the special administration region in a gradual and orderly manner” (SCMP website, 5 Mar.).
2. Foreign Relations
a Diplomatic Tours
Foreign Minister Yang Jiechi's tour of Africa
As is customary, Foreign Minister Yang Jiechi visited a number of African countries in early January. His visit was part of a major outreach to Africa in January, to underline the importance that China attaches to Africa. In addition to Yang's visit, the Minister of Commerce visited Ethiopia and Mozambique from 12–14 January, and Wang Jiarui, Head of the Party's International Liaison Department visited a further six African countries from 15–26 January.
En route, Foreign Minister Yang visited the Maldives, where he met President Mohamed Nasheed to discuss a range of issues including climate change, tourism, fisheries, health and trade and investment. The Maldives sought Chinese investment in reef fishery and aquaculture. Foreign Minister Yang assured the President that China would honour its Copenhagen commitments and fully co-operate with the Maldives over a viable climate agreement (Miadhu News website, 6 Jan.).
Yang arrived in Kenya on 6 January and met President Kibaki. They discussed ways of further enhancing mutual co-operation. President Kibaki thanked China for its commitment to the Lamu port development project, and its help with numerous infrastructure projects. China extended a further grant of 540m shillings (US$6.8 million) to support other projects (Kenya Broadcasting Corporation, 6 Jan.). Foreign Minister Yang also called on the Prime Minister, Raila Odinga, and had talks with the Foreign Minister Moses Wetang'ula. Yang said that China and Africa should forge a new type of strategic partnership and that one of the important missions of his visit to Africa was “to show to Africa the sincerity of the Chinese government, discuss with African countries the implementation actions on the ground, and bring the outcomes of the conference (the Fourth Ministerial of the Forum on China–Africa Co-operation) to the African people” (XHNA, 6 Jan.).
On 8 January he arrived in Nigeria for a one-day visit and talks with the Foreign Minister, Ojo Maduekwe, and the Vice President, Goodluck Jonathan. Both sides spoke highly of the strategic partnership of co-operation that they had established in 2005, and the subsequent strong momentum in bilateral relations. Yang said that China wanted to co-operate in economy and trade, further enrich the strategic elements of the bilateral relationship and realize win–win benefits for the people of the two countries. A number of (unspecified) co-operation agreements were signed (XHNA, 8 Jan.).
Yang visited Sierra Leone on 9 January and had talks with the Foreign Minister, Zainab Hawa Bangura, and President Ernest Bai Koroma, and attended the handover ceremony for a Chinese-donated school (XHNA, 9 Jan.).
In Morocco, on 11 January Yang had talks with the Minister of Foreign Affairs and Co-operation, Taieb Fassi Fehri, and they signed agreements on Moroccan recognition of China's market economy status and on a Chinese donation to the Diplomatic Academy of Morocco (RTM TV Rabat 11 Jan.). The following day he met the Prime Minister, Abbas el Fassi, and they discussed the further development of bilateral relations (XHNA, 12 Jan.).
Foreign Minister Yang concluded his tour in Saudi Arabia on 12 and 13 January where he met the Saudi Foreign Minister, Prince Saud bin al-Faisal. Yang said that China wished to deepen co-operation in energy, infrastructure, finance, and science and technology in order to inject new dynamism into the economic relationship. He also wished to see new cultural and educational exchanges. The Saudi Foreign Minister spoke of their desire to promote friendly and strategic relations with China. They also discussed some regional and international issues (XHNA, 13 Jan.).
Foreign Minister Yang Jiechi's European tour
Yang Jiechi had talks with the Turkish Foreign Minister, Ahmet Davutoglu, during his visit to Istanbul for the Afghanistan conference and the two sides reached an important consensus on advancing friendly and co-operative relations. Yang said the two countries should bring into play their complementary advantages to broaden space for their economic and trade co-operation, and to strengthen co-ordination on important international and regional issues. The Turkish Foreign Minister expressed his hope that China would invest and participate in large-scale infrastructure projects in Turkey (XHNA, 27 Jan.).
Yang visited Cyprus as part of his European tour. He had talks with President Demetris Christofias to discuss bilateral ties. He noted that the relationship had made new progress, and said that China was willing to broaden channels of co-operation and increase mutual investment to push the relationship to a new level (XHNA, 1 Feb.). He also had talks with the Speaker, Marios Karoyian (XHNA, 2 Feb.).
Yang travelled to France on 3 February. He had talks with the French Foreign Minister, Bernard Kouchner, on 3 February. Yang noted that 2010 was an important period for the relationship and the two parties should further implement the important consensus reached by their leaders and continue to respect and take heed of each other's mutual concerns. He added that he expected the two countries to oppose trade and investment protectionism. They also discussed climate change and other international and regional issues of mutual concern (XHNA, 3 Feb.). He met President Sarkozy on 4 February to discuss bilateral relations, and gave a speech on China's relations with France and the European Union to the French Institute for International Relations.
Foreign Minister Yang then went on to visit Germany to attend the Munich Security Conference from 5 to 7 February. During the conference, he delivered a major foreign policy speech in which he said that while focussing on their own development, the Chinese were taking more international responsibilities in a transforming and closely linked world, and wanted to seek a peaceful international environment to develop themselves and at the same time contribute to the cause of world peace through their own development (XHNA, 5 Feb.).
Vice President Xi Jinping's tour of Europe
Vice President Xi Jinping visited Russia, Belarus, Finland and Sweden from 20 to 30 March. He visited Russia from 20 to 24 March, and had meetings with President Dmitry Medvedev, Prime Minister Putin and Chairman of the State Duma Boris Gryzlov. He also attended the opening of the “Year of Chinese Language,” and the second round of the strategic dialogue between the two sides. China's trade with Russia totalled US$38.8 billion, down from a peak of US$58.8 billion in 2008, but recovered strongly in the first two months of 2010 (XHNA, 20 Mar.). His first stop was in Vladivostok where he attended a symposium on strengthening China–Russia interregional co-operation, and 15 co-operation documents were signed totalling US$1.6 billion (XHNA, 21 Mar.). He met the Mayor of St Petersburg on 21 March. Vice President Xi met Boris Gryzlov on 23 March and said that the Sino–Russian strategic co-operation and partnership had played an important part in facilitating smooth relations and safeguarding the international strategic balance and stability. He met Prime Minister Putin on 24 March and reiterated China's wish for closer co-operation with Russia, which he said had always been a priority of China's foreign policy. Xi also spoke highly of the relationship between the Chinese Communist Party and the United Russia Party since relations were established 11 years before. After the meeting they attended the signing ceremony for a series of documents on bilateral co-operation on economy, technology and people-to-people exchanges. The total value of the agreements was about US$6.7 billion. Later on, the two leaders attended the opening ceremony of the “Year of Chinese Language.” Xi also made a speech to the opening session of the second round of dialogue between the Chinese and Russian ruling parties (XHNA, 24 Mar.).
Xi arrived in Belarus on 24 March to exchange views on political co-operation, trade, economy and mutually beneficial investment. He had talks with Prime Minister Sergei Sidorsky and speakers of the parliament. He and the Prime Minister witnessed the signature of a series of co-operation agreements between financial institutions and enterprises worth US$3.4 billion. He also met President Alexander Lukashenko (XHNA, 26 Mar.).
Xi arrived in Finland on 25 March and during his visit met the Finnish President Tarja Halonen, Prime Minister Matti Vanhanen and Parliament Speaker Sauli Niinisto (XHNA, 27 Mar.).
Vice President Xi was in Stockholm on 29 March where he addressed a forum on co-operation between Swedish and Chinese enterprise saying that both countries should promote an open market and free trade and reject all forms of trade protectionism. He held talks with Swedish Prime Minister Fredrik Reinfeldt and met Swedish Parliament Speaker Per Westerberg (XHNA, 29 Mar.). He met the Swedish King Carl XVI Gustaf on 30 March (XHNA, 31 Mar.).
b Multilateral Conferences
Foreign Minister Yang Jiechi visited Tokyo on 15 and 16 January for the foreign ministers' meeting of the Forum for East Asia–Latin America Co-operation (FEALAC). The meeting was scheduled to discuss such issues as environment and sustainable development, economic and financial crisis, and social inclusion such as reducing disparities. Yang said that the Forum should be based on mutual understanding, focus on practical co-operation and aim to meet global challenges (XHNA, 16 Jan.).
Vice Premier Li Keqiang paid an official visit to Switzerland from 25 to 28 January to attend the 2010 World Economic Forum at Davos. He met the Swiss President Doris Leuthard on 26 January. He gave a major speech to the Forum on 28 January (text in XHNA, 31 Jan.).
c Countries, Territories and Regions
Africa (South Africa, Zambia, Zimbabwe)
South African Minister of International Relations and Co-operation Maite Nkoana-Mashabane visited China from 24 to 27 February. He had talks with Foreign Minister Yang Jiechi on 25 February and they agreed to upgrade their strategic partnership. Yang said that China was willing to work with South Africa to strengthen high-level contacts, mutual co-operation and personnel exchanges (XHNA, 25 Feb.).
Zambian President Rupiah Banda paid a state visit to China from 24 February to 4 March. He had talks with President Hu Jintao, Chairman of the National People's Congress Standing Committee Wu Bangguo and Premier Wen Jiabao. After his stay in Beijing he visited Guangxi and Guangdong. The two Presidents agreed to make joint efforts to take the bilateral relationship to a new high level. Hu Jintao called for increased co-operation in agriculture, mineral resources, infrastructure and other areas. He said China would support businesses with strong capacities and good qualifications investing in Zambia. They agreed to co-operate on international issues such as the financial crisis, climate change, food security and poverty eradication. After the talks, they witnessed the signature of a number of agreements on subjects ranging from the economy to culture (XHNA, 25 Feb.). The Zambian press said that five agreements had been signed: one relating to partnership in the development of the multi-facility economic zones in Zambia, one on economic and technical co-operation for the construction of a national stadium in Lusaka, one regarding financial support for projects to be agreed by the two sides, one on mining to promote exchanges in geology, and one on the executive programme on culture (The Post website, Lusaka, 4 Mar.).
According to opposition Zimbabwean press sources, Xin Shunkang, Chinese Ambassador to Zimbabwe, said that China has provided US$300 million in aid to Zimbabwe in the past three years, and has also agreed to provide the state-run mobile phone service provider, NetOne, with a loan of US$50 million. China had also selected 300 officials a year to be trained in China and built the China–Zimbabwe Friendship Hospital at a cost of US$410 million (Newzimbabwe.com website, 22 Jan.). The Foreign Minister of Zimbabwe, Simbarashe Mumbengegwi, visited China from 23 February to 2 March. He met Vice President Xi Jinping on 26 February and had talks with Foreign Minister Yang Jiechi on the bilateral relationship and international issues. Yang said China wanted to work more closely with Zimbabwe in politics, economy and culture (XHNA, 26 Feb.).
Americas (Haiti, Jamaica)
China responded quickly to the earthquake in Haiti on 12 January. Eight Chinese policemen attached to the UN were among those believed to have been buried in the rubble, and the other 142 Chinese members of the peacekeeping force were accounted for. A Chinese emergency rescue team was dispatched quickly, leaving on 13 January, and on 15 January emergency aid of US$30 million was announced, the first shipment of which left by air on 16 January. The bodies of all eight Chinese victims were found by 17 January and were to be returned home. Four had been members of the peacekeeping force and four were members of a delegation that had just arrived in the city for consultations (XHNA, 16 and 17 Jan.). On 21 January, China announced that it would contribute a further US$2.6 million in cash and send a 40-member medical team to the island (XHNA, 21 Jan.).
The Jamaican Prime Minister Bruce Golding visited China from 1 to 5 February, and had talks with President Hu Jintao, Premier Wen Jiabao and Vice President Xi Jinping. On 3 February he met Wen Jiabao, who pledged to continue China's support for Jamaica's economic development and suggested that the two sides expand co-operation in infrastructure construction, mining and tourism. He met Hu Jintao on 4 February and they agreed to explore new ways and areas of co-operation. China's trade with Jamaica was US$219 million in 2009. During the visit the two sides signed agreements on economics, trade, infrastructure construction and social development (XHNA, 5 Feb.).
Australasia (Australia, New Zealand)
On 11 January, Chinese police concluded their investigations into the Rio Tinto Zinc affair and handed the cases of the Australian Stern Hu, Head of the RTZ Shanghai Office, and three local Chinese employees (Liu Caikui, Ge Minqiang and Wang Yong) to the prosecuting authorities, on suspicion of infringing state secrets and bribery (XHNA, 11 Jan.). The Chinese Foreign Ministry spokeswoman said on 12 January that the case would be handled fairly according to the law, and that Australia had been notified of the case (XHNA, 12 Jan.).
As the build up to the trial was taking place, the Australian government sought to have consular officials attend the process and the Australian Prime Minister said that the world would be watching how China conducted the process. The trial began on 22 March. Reporters were not allowed in to the proceedings although Australian consular officers were permitted to attend part of them. Part of the trial relating to commercial secrets was held in closed court and no outsiders were permitted, despite the Consular Convention with Australia which provided for consular officials attending the trials of their nationals. Chinese law experts were quoted as saying that it was reasonable for the Chinese court to prevent Australian officials from observing part of the trial, as Chinese law stipulated that in commercial secrets cases the trial could be held in private if one party so desired (XHNA, 22 Mar.).
All four defendants were found guilty on 29 March. Stern Hu was sentenced to ten years in prison for bribe taking by non state employees and for infringement of commercial secrets, and was ordered to pay one million yuan in fines and seized assets. Wang Yong, Ge Minqiang and Liu Caikui were sentenced to 14 years, eight years and seven years in prison respectively and ordered to pay 5.2 million yuan, 800,000 yuan and 700,000 yuan in fines and seized assets. The court found that they had used their positions on numerous occasions to demand and receive money and to seek profits from other people in the course of iron ore trading with China between 2003 and 2009. They obtained commercial secrets through improper means, such as offering financial inducements causing Chinese enterprises to pay an additional 1.018 billion yuan in 2009. While they were being investigated on the charges of infringing commercial secrets they were said to have confessed voluntarily to taking bribes. The Chinese news media stated that the case had been tried in accordance with the pertinent provisions of the criminal law. The bribe taking charges had been heard in open court, while the commercial secrets charges were closed at the request of the aggrieved parties. The Australian Consulate General in Shanghai had been fully informed of the times and venue of the trial, and had been allowed to attend the open but not the closed sessions. The defendants were properly defended by defence lawyers (XHNA, 29 Mar.).
Rio Tinto Zinc reacted promptly to the news announcing that the four employees had been sacked and that a far-reaching independent review of their operations in China would be undertaken. The Australian Prime Minister, Kevin Rudd, was quoted as saying on 30 March that
[t]he trial on the second charge was held in secret with no media and no Australian officials present for it. This has left, therefore, serious unanswered questions about this conviction. In holding this part of the trial in secret, China, I believe, has missed an opportunity to demonstrate to the world at large transparency that would be consistent with its emerging global role” (Radio Australia, 30 Mar.).
The Chinese Foreign Ministry complained about “irresponsible remarks” made by the Australian government on the issue saying that the Australian side should respect the verdict (XHNA, 30 Mar.).
The New Zealand Foreign Minister Murray McCully visited China from 23 to 25 March. He had talks with the Chinese Foreign Minister, Yang Jiechi, on 24 March. Yang said that China would work with New Zealand to enhance comprehensive co-operation between the two countries. Foreign Minister McCully said that New Zealand was willing to further deepen co-operation with China with respect to the economy, trade, agriculture, environmental protection and other fields, and to strengthen co-ordination in major international and regional issues. He also had a meeting with Vice Premier Li Keqiang (XHNA, 24 Mar.).
Central Asia (Afghanistan, Kazakhstan)
Radio Afghanistan reported that China and Afghanistan had signed an agreement on military co-operation. No details were provided but the report noted China's commitment to assisting Afghan forces and its wish to play its part in the reconstruction of Afghanistan through military assistance and the training of Afghan officers (Radio Afghanistan in Dari 1 Jan.).
Foreign Minister Yang Jiechi travelled to Istanbul for the 26 January regional summit on Afghanistan as the special representative of President Hu Jintao. At the meeting Yang said that China supported trilateral co-operation between Turkey Afghanistan and Pakistan. He said China actively supported and participated in Afghanistan's post-war peace and reconstruction effort and would continue to do so in so far as it was able. He said top priority should be given to capacity building and human resources development, and countries should engage with Afghanistan on transport and trade facilitation, energy, communications, drug control and education. He said regional countries should strengthen their co-ordination but avoid getting caught up in too many overlapping mechanisms. During his stay in Istanbul, he met the Afghan President Hamid Karzai and conveyed President Hu's best regards. He reiterated China's commitment to provide assistance to Afghanistan (XHNA, 26 Jan.).
Shortly afterwards Yang went on to London where he took part in the London Conference on Afghanistan on 28 January. Yang spoke highly of the conference which had covered issues of security, economic development and governance. In a brief speech to the conference (text in XHNA, 28 Jan.), he put forward four proposals for the future: a) ensure security (and the transfer of responsibility from the international community to the Afghan government should proceed in a measured way); b) develop the economy (China supported channelling more assistance through the Afghan government and making more investment in Afghanistan's infrastructure; c) improve governance (we should let the Afghan people choose their own governance model most suited to their circumstances; and d) enhance co-operation (XHNA, 28 Jan.).
During his time in London Yang had separate meetings with his Russian, US, British and EU counterparts to discuss bilateral ties and global issues of common concern (XHNA, 29 Jan.). President Hamid Karzai made a state visit to China from 22 to 24 March. He held talks with President Hu Jintao and met Wu Bangguo, Chairman of the NPC Standing Committee, and Premier Wen Jiabao. He also delivered a speech at Beijing University. He met President Hu Jintao on 24 March, who said the visit would definitely advance practical co-operation and lift the two countries' comprehensive partnership to new levels. After the meeting they witnessed the signature of new agreements on aid, tax reduction and training. China has given more than 900 million yuan in aid since 2002 and announced the donation of a further US$75 million over the next five years. Trade has been growing rapidly and reached US$155 million in 2008 (XHNA, 24 Mar.). According to Afghan television, three co-operation agreements worth 160 million yuan [US$23.4 million] were signed, providing 120 two-month scholarships in six fields (such as communications, commerce, economy, counter-narcotics, education, health) and exemption of customs taxes between the two countries (National Afghanistan TV, 24 Mar.). At the end of the visit the two sides issued a joint statement (full text in XHNA, 25 Mar.).
Kazakhstan's Secretary of State and Foreign Minister Kanat Saudabayev visited China from 22 to 24 February. He had talks with Foreign Minister Yang Jiechi and with Premier Wen Jiabao. They discussed the bilateral relationship and major international issues. Yang said that China was ready to work with Kazakhstan to deepen co-operation in transportation, economy, trade and other areas (XHNA, 23 Feb.).
Europe (Austria, Croatia, France, Germany, Spain, Switzerland, UK)
The Austrian President Heinz Fischer paid a four-day state visit to China from 19 to 22 January, where he had talks with Hu Jintao, Wu Bangguo and Wen Jiabao. His itinerary included Beijing and Shanghai. He had visited China in 1974 when he was Minister of Science and Technology. His delegation included representatives from economic cultural and science and technology circles. President Fischer had talks with President Hu Jintao on 20 January and they exchanged views on further strengthening and developing their bilateral relationship. Hu put forward a standard four-point proposal: a) strengthen friendly exchanges and enhance mutual political trust: b) expand mutually beneficial co-operation; c) promote humanities exchanges; and d) maintain communication and co-ordination on the international stage. After the meeting they witnessed the signature of documents on co-operation between relevant departments of the two countries in health, quality inspection, science, technology, personnel training, teaching of Chinese and other areas (XHNA, 20 Jan.).
Croatian Foreign Affairs and European Integration Minister Gordan Jandrokovic visited China from 28 February to 4 March. He had talks with Vice President Xi Jinping and with Foreign Minister Yang Jiechi for exchanges on bilateral and international issues. Vice President Xi spoke of the desire to expand co-operation in issues such as trade, tourism and culture, and to promote a bilateral comprehensive and co-operative partnership (XHNA, 1 Mar.).
The German Foreign Minister, Guido Westerwalle, paid a two-day visit to Beijing with a delegation of lawmakers and business executives. He met Foreign Minister Yang Jiechi on 15 January. The principal topics of their conversation were the Iran issue, climate change and bilateral relations. In the press conference after their meeting, Foreign Minister Yang said that China's relations with the EU were generally good, despite trade frictions stemming from anti-dumping measures, and that China attached great importance to its comprehensive strategic partnership with the EU. He also said that China hoped that Germany as a major power in Europe would continue to make great efforts to advance China Europe relations. He also met Premier Wen Jiabao. Premier Wen noted the continuing strong trading relationship between the two countries and suggested that they should take a long-term view, enhance mutual trust and deepen co-operation to bring the bilateral relationship to a new high (XHNA, 15 Jan.).
The Spanish Ambassador in Beijing was quoted by the Spanish press as saying that Spain had pledged to promote the lifting of the arms embargo during its Presidency of the EU. The paper noted that Chinese officials had been calling Spain China's best ally in the European Union, which went down well with the Spanish government. Similar remarks were made by the Spanish Foreign Minister who said that Spain would try to use its Presidency to improve relations with China and tackle all matters pending (including the arms embargo). The initiative did not go down well with others. The EU Ambassador in China was quoted as saying that “I do not think we gain anything by making this debate public … it is a very sensitive subject … and it is best to reach consensus first … and not complicate the situation” (La Razon website, 26 and 27 Jan.). The Chinese Foreign Ministry spokesman, when asked to comment on the reports, said: “The Chinese side hopes the EU will make an early political decision, immediately lift the arms embargo against China unconditionally and completely, so as to remove obstacles for the healthy development of Sino–EU relations” (XHNA, 28 Jan.).
China made a formal protest at the decision of the Swiss government to allow two Uyghurs who had been imprisoned in Guantanamo Bay to remain in Switzerland. The Foreign Ministry spokesman on 4 February described them as terrorists and members of the East Turkestan Islamic Movement which was a UN proscribed body. He said the decision would undermine Switzerland's relations with China.
The British Foreign Secretary David Miliband visited China from 14 to 17 March. He went first to Shanghai where visited the Shanghai Expo and then to Beijing. In Beijing, he had talks with State Councillor Dai Bingguo, Foreign Minister Yang Jiechi and Premier Wen Jiabao. It was agreed that China and Britain would raise their strategic dialogue mechanism to a higher level and the first round would be between the Foreign Secretary and State Councillor Dai. In the talks with Premier Wen, the two sides agreed to make joint efforts to promote free trade and oppose protectionism. David Miliband also visited the UN Peacekeeping training centre at Langfang and called for more co-operation between the two sides on this. In his talks with Foreign Minister Yang, David Miliband said: “The Britain–China strategic partnership is maintaining a good development momentum. The two sides share wide-ranging common interests and face many common challenges. The differences between the two countries should not affect the overall development of bilateral relations. Britain welcomes the upgrading of the Britain–China strategic dialogue and is ready to further strengthen co-operation with China on economy, trade and other areas and make a joint effort to fight trade protectionism.” The two Ministers exchanged views on matters of common concern and on climate change (XHNA, 16 Mar.).
East Asia (Japan, Democratic People's Republic of Korea [DPRK], South Korea)
The Chinese Foreign Ministry stated that Japan's decision to build facilities on the Okinotori atoll, 1,740 km south of Tokyo, would not change the island's legal status. The Foreign Ministry said that under the UN Law of the Sea rocks which cannot sustain human habitation or an economic life of their own could have no exclusive economic zone or continental shelf (XHNA, 7 Jan.).
In the sidelines of a Foreign Ministers' meeting on East Asian–Latin American co-operation, Foreign Minister Yang met the Japanese Foreign Minister, Katsuya Okada. According to the Japanese press the meeting was a slightly tetchy one. Okada told Yang that Japan would take “certain” actions if China went against the bilateral agreement to jointly explore gas resources in the East China Sea and moved ahead with gas production in one of the disputed areas. Yang expressed his strong opposition but indicated that China was prepared to keep to the 2008 accord between the two sides. They had more constructive exchanges on North Korea, and reaffirmed the need to consult regularly (Kyodo News Agency, 17 Jan.).
The report of the joint history research project between Japan and China was released on 31 January. The project was inaugurated in 2006 and covers ancient, medieval and modern history from the perspectives of the two sides with papers on various subjects by both Japanese and Chinese historians. Predictably there was no real meeting of minds on some of the more controversial aspects of wartime history, and the post-war history section was not disclosed at the request of the Chinese panel members. Both sides termed the Japanese invasion of China as an “act of aggression” but differences remained on many key issues including the Nanjing massacre (Kyodo News Agency, 31 Jan.).
There was a flurry of activity over North Korea in February. Wang Jiarui, Head of the Party's International Liaison Department, paid a visit to North Korea from 6 February, in what was seen as a mission to try to resume the Six-Party Talks. Wang had talks with Kim Yong Il, Director of the International Affairs Department of the KWP (XHNA, 7 Feb.). The following day he had talks with Kim Jong Il and, according the Chinese media, Kim repeated North Korea's “persistent” stance on the issue of the Six-Party Talks and noted that the “sincerity” of the relevant parties to resume talks was very important (XHNA, 8 Feb.). On 9 February, the Foreign Ministry confirmed that Lynn Pascoe, UN Undersecretary for Political Affairs, had visited Beijing on his way to Pyongyang. He had talks with Foreign Minister Yang Jiechi. The spokesman reiterated China's position that the DPRK nuclear issue is complex and sensitive, involving interests of various parties, and can only be resolved through dialogue and negotiation. Peaceful solutions through political and diplomatic means are the right choices that serve interests of all parties. He urged the relevant parties to make concerted efforts and to continue contact and dialogue and to show flexibility to create the conditions necessary for the revival of the nuclear talks, and added that the Chinese side has made continuous efforts towards this goal and will work with the international community to achieve the denuclearization of the Peninsula, normalized diplomatic relations between the relevant states and lasting peace in northeast Asia (XHNA, 9 Feb.). The Foreign Ministry also announced that Wu Dawei had been appointed special representative for Korean Peninsula affairs and would be in charge of the Six-Party Talks from the Chinese side. At the same time it announced that he had had talks with the lead Korean negotiator Kim Kye Kwan who was visiting China at his invitation (XHNA, 10 Feb.). Later in the month, Kim Yong Il, the Head of North Korea's International Liaison Department, paid a return visit to China and met Wang Jiarui on 23 February for an in-depth exchange of views (XHNA, 23 Feb.). Kim was later received by Hu Jintao (XHNA, 23 Feb.).
It was reported that the US Special Representative for North Korea, Stephen Bosworth, would travel to China, Japan and South Korea to explore ways to restart the Six-Party Talks. He would go to Beijing on 24 February for talks with Wu Dawei (Kyodo News Agency, 23 Feb.).
The South Korean Foreign Minister, Yu Myung-hwan, visited China from 17 to 19 March and had talks with Foreign Minister Yang Jiechi, Premier Wen Jiabao and Meng Jianzhu, Minister of Public Security. In his talks with Yang Jiechi they agreed to seek and early resumption of the Six-Party Talks while working closely with the other participants. In his talks with Meng Jianzhu Yu looked for Chinese support in handling North Korean defectors to China (Yonhap News Agency, 19 Mar.).
Latin America (Chile, Peru)
President Hu Jintao sent a message of condolence to the Chilean President, Michelle Bachelet, following the massive earthquake on 27 February, and offered emergency assistance. No Chinese nationals were reported lost in the earthquake (XHNA, 28 Feb.). China provided immediate aid of US$1 million in cash, and a further US$2 million worth of emergency relief materials (XHNA, 4 Mar.).
The Foreign Minister of Peru, José García Belaúnde, visited China from 25 to 29 March. He had talks with Foreign Minister Yang Jiechi and they agreed to further promote bilateral ties. Garcia welcomed Chinese investment in energy, mining projects and infrastructure construction. He also met Vice Premier Zhang Dejiang (XHNA, 26 Mar.).
Middle East (Iran)
Following a failure by the six powers in New York on 16 January to reach agreement over their approach to Iran, Foreign Ministry spokesman Ma Zhaoxu called on them to show more flexibility, proceed in a more practical manner and continue their efforts to seek a proper settlement through negotiations (XHNA, 19 Jan.). On 21 January, he noted that China supported a dual-track strategy on dealing with the Iranian nuclear issue, and that there was still room for various relevant parties to make diplomatic efforts, and the pressing task now was to push forward progress in dialogue and negotiations (XHNA, 21 Jan.). Despite continued pressure, China stuck basically to its position throughout the period. On 9 February, the Foreign Ministry spokesman reacted to the announcement that Iran had informed the IAEA of its plan to start enrichment activities to the purity of 20 per cent. He said that China had noted these reports and expected and backed all sides to reach an early agreement on the IAEA draft proposal on the research reactor. He said that China hoped that all relevant parties would step up diplomatic efforts and make progress in dialogue and negotiations (XHNA, 9 Feb.). China again called for increased diplomatic efforts on 23 February: “China hopes the parties demonstrate more flexibility and create conditions conducive to a comprehensive and proper solution to the Iran nuclear issue through diplomatic means,” following reports that Iran had produced its first batch of enriched uranium. In late February, a senior Israeli delegation visited China to try to get it to agree to intensified sanctions (Voice of Israel Network B, 23 Mar.). The Chinese press noted merely that that the Israeli Deputy Prime Minister, Moshe Yaalon, had met State Councillor Dai Bingguo and discussed bilateral ties and issues of mutual concern (XHNA, 26 Feb.). In response to questions about new moves on sanctions, the Foreign Ministry spokesman said on 4 March that “China has always safeguarded the international nuclear non-proliferation system and maintained resolving the Iran nuclear issue through dialogue and negotiations so as to preserve peace and stability in the Middle East” (XHNA, 4 Mar.). On 30 March, the Foreign Ministry spokesman made similar points: “We will continue to work with all parties towards the solution of the Iranian nuclear issue through diplomatic and peaceful means. … China has not changed its stance on the Iranian nuclear issue. We insist on safeguarding international nuclear non-proliferation regime, and we also take into account regional peace and stability. … Under current circumstances, we hope relevant parties can show flexibility and make efforts for a solution of the Iranian nuclear issue through diplomacy” (XHNA, 30 Mar.).
South Asia (Bangladesh, India, Pakistan)
The Bangladesh Prime Minister, Shaykh Hasina, visited China from 17 to 21 March. She visited Beijing and Yunnan and had talks with Hu Jintao, Wu Bangguo and Wen Jiabao. In her talks with Wen Jiabao they agreed to set up closer ties of a comprehensive co-operative partnership. He suggested closer co-operation in agriculture, poverty reduction and disaster relief. He said that China supported its companies investing in Bangladesh transport, telecommunications and energy infrastructure. They witnessed the signing of four agreements on economic and technical co-operation, preferential loans, bridge building and natural gas co-operation (XHNA, 18 Mar.). President Hu said that China was ready to lift the comprehensive partnership of co-operation to a new level (XHNA, 19 Mar.).
The Indian Defence Minister, Pradeep Kumar, visited China for the third round of defence consultations between the two countries. He met Defence Minister, Liang Guanglie, and consultations were held with the Deputy Chief of the PLA General Staff, Ma Xiaotian. General Ma was quoted by the Chinese press as saying that the consultations served as a good platform for building up mutual trust between the two armed forces, and that the two sides had achieved consensus on advancing bilateral military ties during the consultation (XHNA, 7 Jan.). The Indian press reported that as a result of the meeting the two sides would be working towards holding a joint counter-terrorism war game in 2011 (two earlier exercises had been held in 2007 and 2008). The two sides also agreed to maintain stability along the Line of Control and use the existing Border Personnel meetings mechanism to defuse any incidents. They agreed to share information on anti-piracy efforts, military training exchanges, and to hold a military sports event (Press Trust of India News Agency, New Delhi, 11 Jan.).
The Pakistani Foreign Minister Shah Mahmood Qureshi visited China from 21 to 25 February. He met Premier Wen Jiabao on 23 February and exchanged views on the bilateral relationship and major international and regional issues. He gave a speech to the China Institute of International Studies, entitled “Pakistan's Challenges and Our Responses,” in which he said that the relationship with China was the cornerstone of Pakistan's foreign policy (XHNA, 23 Feb.).
Southeast Asia (Indonesia)
China and Indonesia held the second meeting of their dialogue at Vice Premier level on 21 January. State Councillor Dai Bingguo travelled to Indonesia for a meeting with Indonesian Co-ordinating Minister for Political, Law and Security Affairs Djoko Suyanto. The two sides agreed to improve strategic mutual understandings, improve economic and trading co-operation, expand personnel and cultural communication, strengthen co-operation in terms of security and law affairs, and co-ordinate more closely in multilateral affairs. After the meeting, Dai Bingguo and Suyanto witnessed the signing of the Plan of Action for the Implementation of the Joint Declaration on Strategic Partnership. The plan includes detailed measures for the dialogue, communication and co-operation between China and Indonesia in political and security fields.
Dai Bingguo also met the Indonesian Vice-President Boediono, President Yudhoyono, and ASEAN Secretary-General Surin Pitsuwan (XHNA, 21 Jan.).
Taiwan
Kao Koong-lian, a Vice chairman of the Straits Exchange Foundation, led a 13-member delegation to China for talks on an Economic Co-operation Framework Agreement (ECFA). Kao said that the first round would focus on groundwork discussions such as the accord's title and overall framework. It was basically a working meeting and it would not go into detail on concessions. He said that the ASEAN–China Free Trade Agreement had put Taiwanese businessmen at a disadvantage, and it was therefore necessary to agree an ECFA with China as soon as possible. His delegation included officials from the Bureau of Foreign Trade and the Mainland Affairs Council. Kao made it clear that opening Taiwan's market wider to Chinese agricultural products was not under consideration (CNA, 25 Jan.).
The first round of the talks was held on 26 January. It consisted of expert-level discussions to prepare the ground for a more round of negotiations at the subsequent round later in the year. The main subject was the evaluation of the results and proposals of joint research by academic institutions on both sides of the strait on the issue. The aim of the agreement was to make systematic arrangements to normalize mainland–Taiwan economic ties and bring the economies of both sides closer. The Chinese side of the talks was led by ARATS Executive Vice President Zhang Lizhong. According to a statement released after the meeting, they agreed that the basic content of the ECFA would include market access for commodity trade and service trade, rules of origin, an early harvest programme, trade remedies, dispute settlement mechanisms, investment and economic co-operation. The two sides also exchanged tax regulations and economic and trade regulations and statistics (XHNA, 26 Jan.). Taiwan officials were quick to reassure their side that the agreement would involve no further opening to Chinese agricultural products or admission of Chinese labour to Taiwan. President Ma Ying-jeou said it would be a significant aspect of cross-Strait exchanges. He said the executive would update the Legislative Yuan and the public every month on progress (CNA, 27 Jan.).
United States
The row over US arms sales to Taiwan flared up again in this quarter. On 6 January, US Defence Department announced the approval of a plan for Lockheed Martin Corporation to sell Patriot III missiles to Taiwan. In response the Chinese Foreign Ministry reiterated China's “clear and consistent” stand of firm opposition to US arms sales to Taiwan and warned of the severe consequences of such sales, urging the US to stand by the three communiqués (XHNA, 7 Jan.).
On 30 January the US administration notified Congress that it was proposing to sell US$6.7 billion worth of arms to Taiwan. The equipment included 114 Patriot missiles (US$2.81 billion), 60 Black Hawk helicopters (US$3.1 billion), Communication equipment (US$340 million), two Osprey mine-hunting ships (US$105 million), and 12 Harpoon missiles (US$37 million). Chinese reaction was instant and strong. The US Ambassador was summoned to the Foreign Ministry for a solemn protest. The Chinese complained that the US had ignored repeated representations, and had seriously violated the three communiqués in persisting with the sale. It was a gross interference in China's internal affairs, which seriously endangered its national security, and harmed the grand cause of peaceful reunification with Taiwan. Formal protests were made by the National People's Congress Standing Committee, the Ministry of Defence, the Taiwan Affairs Office and the Foreign Ministry. The Chinese Foreign Ministry announced that China had decided to partially halt the military exchange programmes with the US, and the Vice Ministerial consultations on strategic security, arms control and proliferation which were due to be held shortly. China would also impose sanctions on US companies involved in the arms sales to Taiwan. Foreign Minister Yang Jiechi, on a visit to Cyprus, said on 30 January that it constituted crude interference in China's internal affairs, and harmed China's national security and peaceful reunification efforts. He said that China firmly opposed such a move which ran counter to the US commitment to support the peaceful growth of the cross-Strait relations. He urged the US side to adopt a serious attitude towards the Chinese position, earnestly respect China's core interests and major concerns, revoke immediately the erroneous decision on the arms sales to Taiwan and stop selling weapons so as not to undermine the China–US relations (XHNA, 30 Jan.).
Relations were also stretched over President Obama's decision to meet the Dalai Lama. In advance of the visit, Chinese official spokesmen made very plain China's objections to the “US leader having contact with the Dalai Lama in any name or any form” (XHNA, 3 Feb.). Combining the two issues, the Foreign Ministry spokesman laid the responsibility on improving the relationship firmly with the United States: “[R]egarding the issues of the US military sales to Taiwan and the US leader's possible meeting with the Dalai Lama, the Chinese side had made repeated solemn representations with the US side, and had openly stated China's position.” He stressed that “healthy and stable development of Sino–US relations is in line with the two countries' common interests, and is conducive to world peace, stability and prosperity, which require the two sides' common efforts. Mutually respecting each other's core interests and major concerns is a key to ensuring the healthy and stable development of Sino-US relations.” The meeting took place on 18 February in the White House Map Room to predictable further protests from the Chinese. The Foreign Ministry spokesman described the event as a gross violation of international norms, and contrary to the commitments made by the US Government that the US recognizes Tibet as part of China and gives no support to Tibetan independence. He demanded that the US stop interfering in China's internal affairs and take concrete actions to maintain healthy and steady growth of Sino–US relations. The US Ambassador was again summoned to receive a formal protest (XHNA, 18 and 19 Feb.).
Another issue that rumbled on through the quarter was the question of the exchange rate between the yuan and the US dollar. Increasing political pressure developed in the US for the Chinese government to undertake a substantial revaluation of the yuan, while the Chinese rejected any attempt to force them into that position and defended the exchange rate as reasonable. On 4 February, the Foreign Ministry spokesman, responding to President Obama's remarks that the administration would get much tougher on the enforcement of trade rules and put constant pressure on China to appreciate the currency, said that “[w]e expect the United States to take a rational view of bilateral trade issues and to adhere to equality in negotiation. Accusations and pressure will not bring solutions.” He added that the Yuan had appreciated by more than 20 per cent since 2005 against the US dollar (XHNA, 4 Feb.). The Minister of Commerce, Chen Deming, said on 30 March that US controls on exports to China had exacerbated the trade imbalance problem and that appreciation of the yuan would not solve the problem. He claimed that the yuan was not undervalued and that pressure for appreciation was “irrational” and would bring no good to either side (XHNA, 30 Mar.).
As a small sign of possible warming in relations, the US aircraft carrier, USS Nimitz, was given permission for a port call in Hong Kong on 17 February (SCMP website 18 Feb.).
The US Deputy Secretary of State James Steinberg, together with Jeff Bader, Senior Director for Asian Affairs at the National Security Council, visited China from 2 to 4 March to “exchange opinions with the Chinese side over matters related to China–US relations,” as the Chinese spokesman put it. The Chinese Foreign Ministry spokesman said in advance of the visit that the responsibility for the setbacks in relations lay with the US administration and urged the US side to respect China's core interests and push relations back on a normal and healthy track. It was expected that in addition to bilateral relations, the talks would cover Iran and the nuclear issue (XHNA, 2 Mar.). They met State Councillor Dai Bingguo on 4 March. The Chinese official press described them as having candid and in-depth discussions on issues of common interest. They also had talks with Foreign Minister Yang Jiechi (XHNA, 4 Mar.).
Vice Minister of Commerce, Zhong Shan, visited the US and had talks in Washington on 24 and 25 March. He noted that China and the US had converging interests and had deepened mutual strategic trust. He suggested that they should stick to a strategic and long-term approach to the economic and trade ties and appropriately handle trade frictions through communication and consultation. Against a background of continuing pressure in the United States for appreciation of the yuan, he said: “It is in nobody's interest, China's, the US' or other countries', to see big ups in the RMB or big downs in the dollar” (XHNA, 25 Mar.).
d Climate Change
On 23 February, General Secretary Hu Jintao chaired a meeting of the Politburo which had been called to study the issue of fulfilling China's target for controlling greenhouse gas emissions by 2020. He reiterated that
we must uphold the principle of common but differentiated responsibilities, shoulder the responsibilities that are appropriate to our status as a developing nation, take an active part in international co-operation in the area of tackling climate change, help developing nations enhance their capability of tackling climate change, and continue to make positive contributions to tackling global climate change (XHNA, 23 Feb.).
On 14 March, at a press conference following the NPC, Premier Wen gave his account of events at Copenhagen. He said that he and the Chinese delegation had not received any invitation to a meeting of several countries on 17 December, despite checking as soon as he was told at a banquet earlier in the evening. The Chinese delegation was completely unsighted but he decided nonetheless to send Vice Minister He Yafei. He said he could not understand why some countries still saw this as an issue, and it was still a mystery to him. He said he had written to the UN Secretary General and the Danish Prime Minister after the conference making clear China's support for the Copenhagen Accord (XHNA, 14 Mar.).