





Background
Attention problems (AP) provide an informative model for examining continuity and change in psychopathology across development. Although attention problems often show substantial stability from childhood through adolescence, their behavioral expression changes as individuals transition into adulthood. In particular, inattention remains relatively stable over time, whereas the hyperactivity/impulsivity domain shows a decline in hyperactivity but relative persistence in impulsivity (Faraone et al., Reference Faraone, Banaschewski, Coghill, Zheng, Biederman, Bellgrove, Newcorn, Gignac, Al Saud, Manor, Rohde, Yang, Cortese, Almagor, Stein, Albatti, Aljoudi, Alqahtani, Asherson and Wang2021; Larsson et al., Reference Larsson, Dilshad, Lichtenstein and Barker2011; Sibley et al., Reference Sibley, Mitchell and Becker2016). These developmental shifts raise the question of whether adult attention problems primarily reflect continuity of the same underlying liabilities influencing attention problems earlier in development or instead/also reflect new etiological influences. Genetically informed studies spanning childhood to adolescence suggest genetically mediated continuity in attention problems across development (Gjone et al., Reference Gjone, Stevenson and Sundet1996; Kan et al., Reference Kan, Dolan, Nivard, Middeldorp, van Beijsterveldt, Willemsen and Boomsma2013; Rietveld et al., Reference Rietveld, Hudziak, Bartels, van Beijsterveldt and Boomsma2004), although the contributions of early genetic factors decline (Chang et al., Reference Chang, Lichtenstein, Asherson and Larsson2013) and unique environmental influences become increasingly important during adolescence (Kan et al., Reference Kan, Dolan, Nivard, Middeldorp, van Beijsterveldt, Willemsen and Boomsma2013). However, compared with childhood and adolescent attention problems, considerably less is known about the factors underlying attention problems in adulthood. The present study examines the continuity of genetic and environmental influences on attention problems from childhood to adulthood and investigates whether impulsivity explains unique variance in adult attention problems beyond earlier symptoms.
Attention problems in adulthood and relation to earlier attention problems
Attention problems are among the most common neurodevelopmental symptoms and are associated with a range of adverse outcomes across development, including externalizing and internalizing psychopathology, substance use, academic underachievement, and broader functional impairment (Barkley & Murphy, Reference Barkley and Murphy2011; Faraone et al., Reference Faraone, Banaschewski, Coghill, Zheng, Biederman, Bellgrove, Newcorn, Gignac, Al Saud, Manor, Rohde, Yang, Cortese, Almagor, Stein, Albatti, Aljoudi, Alqahtani, Asherson and Wang2021; Willcutt, Reference Willcutt2012). Although these symptoms typically emerge in childhood, their expression changes across development (Faraone et al., Reference Faraone, Banaschewski, Coghill, Zheng, Biederman, Bellgrove, Newcorn, Gignac, Al Saud, Manor, Rohde, Yang, Cortese, Almagor, Stein, Albatti, Aljoudi, Alqahtani, Asherson and Wang2021; Martel et al., Reference Martel, Levinson, Langer and Nigg2016; Murray et al., Reference Murray, Hall, Speyer, Carter, Mirman, Caye and Rohde2022), raising questions about the extent to which adult attention problems reflect continuity of earlier developmental liabilities versus developmental processes that contribute to change.
Genetically informative studies provide a unique framework for addressing this question by identifying the extent to which stability reflects enduring genetic and environmental liabilities versus developmental change arising from new influences over time. Distinguishing between developmental continuity and change is a central question in developmental psychopathology and has informed theoretical models across cognition, personality, and psychopathology. Across these domains, longitudinal genetically informed research has consistently demonstrated substantial genetic continuity across development, indicating that many of the same genetic factors contribute to individual differences over time. At the same time, developmental change is often associated with the emergence of new genetic influences and, particularly, nonshared environmental experiences that increasingly differentiate individuals across development (Allegrini et al., Reference Allegrini, Cheesman, Rimfeld, Selzam, Pingault, Eley and Plomin2020; Nivard et al., Reference Nivard, Lubke, Dolan, Evans, St Pourcain, Munafò and Middeldorp2017; Pingault et al., Reference Pingault, Viding, Galéra, Greven, Zheng, Plomin and Rijsdijk2015; Plomin et al., Reference Plomin, DeFries, Knopik and Neiderhiser2016).
Consistent with this broader literature, longitudinal research demonstrates substantial developmental genetic continuity in attention problems, with moderate-to-high stability from childhood through adolescence (h2 = ∼54%–82%) (Chang et al., Reference Chang, Lichtenstein, Asherson and Larsson2013; Faraone & Larsson, Reference Faraone and Larsson2019; Gjone et al., Reference Gjone, Stevenson and Sundet1996; Kan et al., Reference Kan, Dolan, Nivard, Middeldorp, van Beijsterveldt, Willemsen and Boomsma2013; Rietveld et al., Reference Rietveld, Hudziak, Bartels, van Beijsterveldt and Boomsma2004; van den Berg et al., Reference van den Berg, Willemsen, de Geus and Boomsma2006), suggesting that a substantial proportion of variance reflects stable individual differences. However, this continuity is only partial; the same evidence also points to developmental change in symptom expression and etiology across time (Chang et al., Reference Chang, Lichtenstein, Asherson and Larsson2013; Kan et al., Reference Kan, Dolan, Nivard, Middeldorp, van Beijsterveldt, Willemsen and Boomsma2013).
Despite evidence for continuity through adolescence, relatively few studies have examined the etiology of attention problems or Attention Deficit/Hyperactivity Disorder (ADHD) in adulthood, and findings are inconsistent. Some studies report lower heritability estimates in adulthood (∼30%–40%) (Boomsma et al., Reference Boomsma, Saviouk, Hottenga, Distel, de Moor, Vink, Geels, van Beek, Bartels, de Geus and Willemsen2010; Kan et al., Reference Kan, Dolan, Nivard, Middeldorp, van Beijsterveldt, Willemsen and Boomsma2013; Reiersen et al., Reference Reiersen, Constantino, Grimmer, Martin and Todd2008; van den Berg et al., Reference van den Berg, Willemsen, de Geus and Boomsma2006), potentially reflecting a decline in the influence of early genetic factors on later development and the increasing contribution of occasion-specific nonshared environmental factors (Chang et al., Reference Chang, Lichtenstein, Asherson and Larsson2013; Kan et al., Reference Kan, Dolan, Nivard, Middeldorp, van Beijsterveldt, Willemsen and Boomsma2013). In contrast, studies of adults with ADHD that do not account for childhood attention problems report substantially higher heritability (∼72%–88%) with minimal shared environmental influence (Larsson et al., Reference Larsson, Chang, D’Onofrio and Lichtenstein2014). Together, these findings suggest that estimates of genetic and environmental influence in adulthood may depend on whether analyses capture developmental continuity from earlier life stages or examine adult symptoms in isolation. However, because few studies span the full developmental period from childhood to adulthood, the relative contributions of stable genetic influences, novel genetic influences, and nonshared environmental factors to adult attention problems remain unclear.
The role of impulsivity in adult attention problems
One potential explanation for developmental change in attention problems is that the relative importance of specific symptom dimensions shifts across development. Although behavioral ratings of attention problems show moderate stability from childhood into adolescence (Linsell et al., Reference Linsell, Johnson, Wolke, Morris, Kurinczuk and Marlow2019; Rietveld et al., Reference Rietveld, Hudziak, Bartels, van Beijsterveldt and Boomsma2004; Robbers et al., Reference Robbers, van Oort, Polderman, Bartels, Boomsma, Verhulst, Lubke and Huizink2011; Thomson et al., Reference Thomson, Vijayakumar, Johnson, Malpas, Sciberras, Efron, Hazell and Silk2020), their behavioral expression changes as individuals move into adulthood (Biederman et al., Reference Biederman, Mick and Faraone2000; Martel et al., Reference Martel, von Eye and Nigg2012). In particular, impulsivity has been proposed as a salient feature into adulthood (Barkley et al., Reference Barkley, Murphy and Fischer2008; Faraone et al., Reference Faraone, Banaschewski, Coghill, Zheng, Biederman, Bellgrove, Newcorn, Gignac, Al Saud, Manor, Rohde, Yang, Cortese, Almagor, Stein, Albatti, Aljoudi, Alqahtani, Asherson and Wang2021; Martel et al., Reference Martel, von Eye and Nigg2012).
Impulsivity is characterized by tendencies toward acting without forethought, reduced inhibitory control, and difficulty delaying responses or gratification (Biederman et al., Reference Biederman, Mick and Faraone2000; Faraone et al., Reference Faraone, Banaschewski, Coghill, Zheng, Biederman, Bellgrove, Newcorn, Gignac, Al Saud, Manor, Rohde, Yang, Cortese, Almagor, Stein, Albatti, Aljoudi, Alqahtani, Asherson and Wang2021; Martel et al., Reference Martel, von Eye and Nigg2012). Although attention problems and ADHD, as captured in both DSM-5 diagnostic frameworks and broader rating scales such as the child behavior checklist (CBCL) (Achenbach et al., Reference Achenbach, Veriiulst, Baron and Althaus1987), reflect a multidimensional construct that includes separable domains of inattention and hyperactivity/impulsivity, these dimensions appear to follow somewhat distinct developmental trajectories. Specifically, inattention tends to persist into adulthood, whereas levels of the hyperactivity/impulsivity symptom dimension decline over time (Faraone et al., Reference Faraone, Banaschewski, Coghill, Zheng, Biederman, Bellgrove, Newcorn, Gignac, Al Saud, Manor, Rohde, Yang, Cortese, Almagor, Stein, Albatti, Aljoudi, Alqahtani, Asherson and Wang2021; Larsson et al., Reference Larsson, Dilshad, Lichtenstein and Barker2011; Sibley et al., Reference Sibley, Mitchell and Becker2016). Importantly, hyperactivity and impulsivity are often less clearly differentiated in childhood, but evidence suggests greater separation between these components in adulthood, with hyperactivity becoming less prominent and impulsivity emerging as a more distinct and relatively persistent feature (Barkley et al., Reference Barkley, Murphy and Fischer2008; Martel et al., Reference Martel, von Eye and Nigg2012). These developmental patterns suggest that impulsivity may contribute to differences between childhood and adult manifestations of attention problems and may therefore help explain both continuity and change across development.
Evidence from genetically informed studies further supports the possibility that impulsivity contributes unique information beyond attention problems broadly defined. Inattention and hyperactivity-impulsivity show moderate genetic overlap (rg = 0.55), alongside evidence for distinct genetic influences (Greven et al., Reference Greven, Rijsdijk and Plomin2011; Kuntsi et al., Reference Kuntsi, Pinto, Price, van der Meere, Frazier-Wood and Asherson2014). Investigations of impulsivity alone indicate modest heritability across adolescence (∼19% to 56%) (Niv et al., Reference Niv, Tuvblad, Raine, Wang and Baker2012). Together, these findings suggest that impulsivity shares common etiological influences with attention problems while also reflecting partially distinct genetic and environmental processes. Despite growing evidence that impulsivity is an important feature of adult attention problems, little is known about whether it contributes to the developmental continuity of attention problems or instead reflects processes that become increasingly important during adulthood. Examining impulsivity may therefore help clarify whether adult attention problems primarily reflect persistent childhood liabilities or developmental transformations in symptom expression across the transition to adulthood.
The present study
The present study examines mechanisms of continuity and change in attention problems from childhood through adulthood. Using a longitudinal twin sample spanning this developmental transition, we investigate whether adult attention problems primarily reflect persistence of earlier liabilities or developmental influences that emerge later in life. We additionally examine whether impulsivity explains unique variance in adult attention problems beyond earlier symptoms. By incorporating multiple raters and broader assessments, including both questionnaire-based measures and clinical diagnoses at age 17, we enhance our ability to capture continuity and change in attention problems as individuals transition into adulthood. We then use genetically informative models to examine the genetic and environmental factors underlying these developmental processes, providing insight into the mechanisms that contribute to both the persistence and transformation of attention-related difficulties across development.
Using phenotypic and multivariate twin models, we examine continuity and change in attention problems across the transition from childhood to adulthood. Specifically, we address the following questions: (1) To what extent do adult attention problems reflect continuity with earlier childhood and adolescent attention problems versus developmental influences that emerge in adulthood? (2) Does adult impulsivity exhibit an association with adult attention problems after controlling for earlier attention problems and impulsivity? (3) If so, does that association reflect shared genetic and/or environmental influences between adult attention problems and impulsivity?
Consistent with developmental models emphasizing both stability and change, we expected adult attention problems to reflect continuity with earlier attention problems alongside additional influences that emerge in adulthood. We further expected that impulsivity would account for unique variance in adult attention problems, consistent with the hypothesis that impulsivity becomes increasingly central to the adult expression of attention-related difficulties. Finally, we expected that the association between impulsivity and adult attention problems would be partially explained by shared genetic influences, reflecting common underlying liability across these constructs.
Methods
Participants
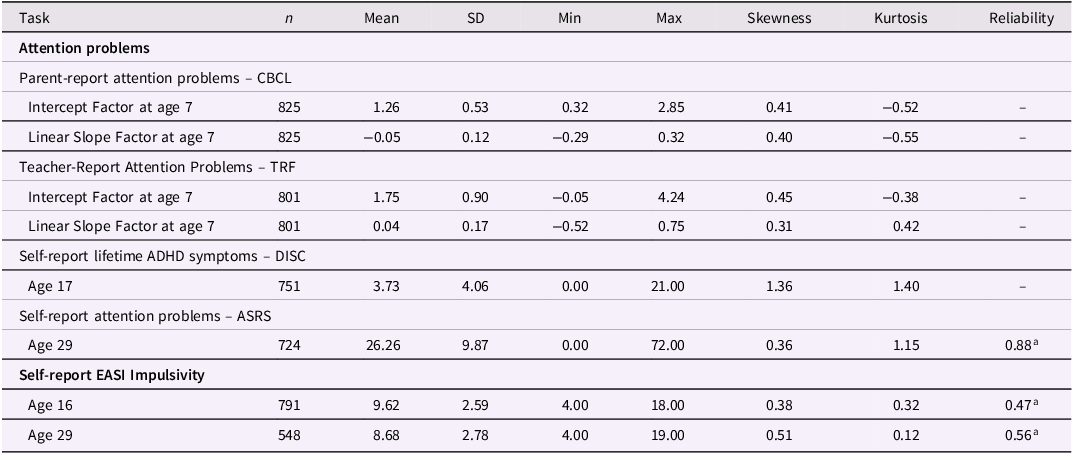
This study included 944 individual twins (474 biological females and 470 biological males) from the ongoing Colorado Longitudinal Twin Study (Corley et al., Reference Corley, Reynolds, Wadsworth, Rhea and Hewitt2019). The total sample in the current analyses included all individuals (out of 966 enrolled in the longitudinal study) with data on childhood/adolescent parent- and teacher-reported attention problems, self-report adolescent lifetime ADHD symptoms, adult self-report attention problems, and/or impulsivity measures. Sample sizes and measures are provided in Table 1. Additional information regarding the individual timepoints for parent- and teacher-reported attention problems is provided in Table S1, and descriptive characteristics for additional impulsivity measures are reported in Table S2.
Descriptive statistics of attention and impulsivity measures

Table 1. Long description
The table presents descriptive statistics of attention and impulsivity measures across different ages and report types. It includes 10 rows and 9 columns. The columns are labeled Task, n, Mean, SD, Min, Max, Skewness, Kurtosis, and Reliability. The rows are grouped under Attention problems and Impulsivity measures, with further subdivisions for Childhood/adolescence and Adulthood. For Attention problems, the table lists Parent-report attention problems – CBCL, Teacher-Report Attention Problems – TRF, and Self-report lifetime ADHD symptoms – DISC with specific measures at ages 7, 17, and 29. For Impulsivity measures, it lists Self-report impulsivity – EASI with measures at ages 16 and 29. Each row provides specific values for n, Mean, SD, Min, Max, Skewness, Kurtosis, and Reliability.
Note. aInternal reliability was calculated using Cronbach’s alpha. Reliability is not reported for the growth factor scores (e.g., intercept and linear slope) of parent- and teacher-reported attention problems, as these are derived from latent growth models. Similarly, reliability is not reported for self-reported adolescent lifetime ADHD symptoms measured by the DISC, since these are based on clinical diagnostic interviews. We report descriptive characteristics for the growth factors of parent- and teacher-report attention problems (measured by CBCL and TRF), and the raw scores for self-report adolescent attention problems (DISC), self-report adult attention problems (ASRS), and impulsivity measures (EASI).
CBCL = Child Behavior Checklist; TRF = Teacher Report Form; DISC = Diagnostic Interview Schedule for Children; ASRS = Adult Self-Report Scale; EASI = Emotionality, Activity, Sociability, and Impulsivity survey.
Participants were drawn from the same birth cohort, with most born within a narrow range of years (1984 to 1990), and the same individuals were followed longitudinally and assessed at later ages, with the cohort broadly representative of the Colorado population at the time of recruitment (Corley et al., Reference Corley, Reynolds, Wadsworth, Rhea and Hewitt2019). Participants identified as White (91.9%), Hawaiian, Pacific islander, American Indian, or Alaska Native (1.3%), Asian (0.3%), more than one race (5.5%), or unknown or unreported race (1.1%). Hispanic individuals comprised 8.9% of the sample. Educational attainment was assessed at the final time point at age 29 (M = 15.46 years, SD = 2.15 years). For more information on the sample characteristics, see Corley et al. (Reference Corley, Reynolds, Wadsworth, Rhea and Hewitt2019).
All research protocols were reviewed and approved by the Institutional Review Board of the University of Colorado, Boulder. Parental permission and informed consent or assent were obtained from each participant at each assessment, and the participants received monetary compensation for participation.
Materials, design, procedure
Attention problems
To assess attention problems throughout childhood and adolescence, we used multiple raters. Parent ratings were from the CBCL, teacher ratings were from the Teacher Report Form (TRF) (Achenbach et al., Reference Achenbach, Veriiulst, Baron and Althaus1987; Achenbach, Reference Achenbach1991), and self-reported adolescent lifetime ADHD symptoms were from the Diagnostic Interview Schedule for Children (DISC) (Shaffer et al., Reference Shaffer, Fisher, Lucas, Dulcan and Schwab-Stone2000).
The CBCL includes an 11-item Attention Problems scale tailored to assess children’s responses to the demands of the home environment. This scale contained 10 items that were included on the TRF, and one item that was only on the CBCL. This scale also emphasizes attention and organizational behaviors (e.g., “inattentive,” “easily distracted,” “can’t concentrate,” “daydreams”) while encompassing related constructs such as impulsivity (“impulsive”), overactivity (“can’t sit still,” “restless,” “hyperactive”), and learning difficulties (“poor schoolwork,” “difficulty learning”). Parents or caregivers provide ratings on the same 3-point Likert scale (0 = not true, 1 = somewhat or sometimes true, 2 = very true or often true), with the dependent measure being the sum of these ratings at each time point. Observations were gathered annually, covering ages 7 to 14, with the possibility of different parents or caregivers contributing ratings across time points.
The TRF includes a 20-item Attention Problems scale designed to capture children’s responses to the structured demands of the classroom environment. The scale predominantly evaluates core aspects of attention and organization, including behaviors such as inattention, distractibility, poor concentration, and daydreaming. Additionally, specific items address related constructs: (e.g., perseverance (e.g., “fails to carry out assigned tasks”), overactivity (e.g., “can’t sit still,” “restless,” “hyperactive”), and academic challenges (e.g., “poor schoolwork,” “difficulty learning”). Teachers rated each item on a 3-point Likert scale (0 = not true, 1 = somewhat or sometimes true, 2 = very true or often true), with the dependent measure being the sum of these ratings at each time point. Observations were collected annually from ages 7 to 14, with different teachers contributing ratings each year.
The DISC is a structured psychiatric diagnostic interview for children and adolescents aged 6 to 18. It provides information on a range of diagnoses, including DSM-III-R ADHD. For ADHD, individual items assessed symptoms in the inattention and hyperactivity/impulsivity domains, and participants reported whether each symptom was present during the past month, past year, or lifetime. Each item was answered with a yes or no response. The DISC requires that ADHD symptoms begin in early childhood and that diagnostic criteria be met within the past six months. In line with DSM-III-R diagnostic conventions, ADHD symptoms were measured as a single symptom set without a formal separation into inattention and hyperactivity/impulsivity domains. For our analyses, we therefore used the lifetime ADHD symptom count, with participants assessed at a mean age of 17.
To assess adult attention problems, participants completed the Adult Self-Report Scale v1.1 (ASRS) (Kessler et al., Reference Kessler, Adler, Ames, Demler, Faraone, Hiripi, Howes, Jin, Secnik, Spencer, Ustun and Walters2005). The ASRS assesses two key domains: inattention (e.g., difficulty sustaining attention and forgetfulness) and hyperactivity/impulsivity (e.g., restlessness and impulsive behavior), with items comprising the respective subscales defined according to Kessler et al. (Reference Kessler, Adler, Ames, Demler, Faraone, Hiripi, Howes, Jin, Secnik, Spencer, Ustun and Walters2005). The ASRS consists of 18 items, each rated on a 5-point Likert scale ranging from “Never” to “Very Often.” The first six questions are highly predictive of ADHD and serve as a screener, while the remaining 12 items provide a more comprehensive assessment. Higher scores suggest a greater likelihood of ADHD-related symptoms. Participants completed the ASRS online at a mean age of 29. The dependent measure was a sum score of the Likert ratings, where responses for those who completed at least 80% of the questions were averaged and then multiplied by the total number of items on the scale (this procedure imputes missing items with the mean for the remaining items).
Although the adolescent DISC and adult ASRS were developed under different diagnostic frameworks and use different response formats, both were used in the present study as continuous measures of ADHD-related symptoms rather than categorical diagnoses. The DISC provided a continuous count of lifetime ADHD symptoms under DSM-III-R criteria, whereas the ASRS provided a continuous sum score of current ADHD-related symptoms in adulthood. Although the DSM-III-R, DSM-IV, and DSM-5 criteria differ in their diagnostic requirements, including the age-of-onset criterion and symptom thresholds, the core symptoms assessing inattention and hyperactivity/impulsivity have remained broadly similar across these diagnostic frameworks. Thus, the adolescent and adult measures were not intended to represent equivalent diagnostic assessments, but rather to capture dimensional individual differences in ADHD-related symptomatology and subclinical variation in attention problems across development.
Impulsivity measures
To assess impulsivity in adolescence (age 16) and adulthood (age 29), we used a subscale from the 20-item Emotionality, Activity, Sociability, and Impulsivity Survey (EASI) (Buss & Plomin, Reference Buss and Plomin2008; Buss et al., Reference Buss, Plomin and Willerman1973), a self-report measure of four dimensions of temperament. Each item is rated on a 5-point Likert scale (1 = Totally Disagree to 5 = Totally Agree). For our analysis, we focused on the Impulsivity subscale, which includes four items. Individuals with higher impulsivity are typically characterized by stronger impulsive tendencies, while a lower score indicates greater cautiousness, deliberation, and self-control. Items were “I have trouble controlling my impulses,” “I tend to be impulsive,” “I always like to see things through to the end” (reverse-coded), and “I like to plan things way ahead of time” (reverse-coded).Footnote 1 We selected the EASI because it provides a developmentally stable measure of impulsivity that was assessed consistently across adolescence and adulthood, enabling the use of the same metric across time points. This consistency was critical for examining the longitudinal relationship between impulsivity and attention problems.
Although we focus on the EASI in the primary models because it was measured in both adolescence and adulthood, we considered other impulsivity measures we had to demonstrate replicability (see Supplementary Materials). These included the Barratt Impulsiveness Scale-11 (BIS-11) (Patton et al., Reference Patton, Stanford and Barratt1995), measured at age 29, and the UPPS-P Impulsive Behavior Scale (Whiteside & Lynam, Reference Whiteside and Lynam2001), measured at age 23, representing emerging adulthood. Correlations among the impulsivity measures are presented in Supplementary Table S3. Although these other impulsivity measures included more items and demonstrated higher reliability than the EASI, the EASI still showed strong associations, and the overall conclusions did not change.
Statistical procedures
Data preprocessing
For parent- and teacher-reported attention problems and self-report adolescent lifetime ADHD symptoms, we applied a square root transformation, following the approach of Friedman et al. (Reference Friedman, Haberstick, Willcutt, Miyake, Young, Corley and Hewitt2007). This transformation improved the normality of the distributions across all time points and reduced positive skewness, making the data more suitable for statistical analyses that assume a normal distribution. We note that the procedure we used to deal with the nonindependence of the twin data (clustering by family) uses a robust maximum likelihood estimator robust to both nonindependence and non-normality, reducing concerns that remaining skew in these measures will influence the test statistics. Childhood/adolescent attention problems at each age were residualized on sex at the corresponding time point, separately for parent- and teacher-report. Self-reported adolescent lifetime ADHD symptoms, adult attention problems, and impulsivity measures were also residualized on sex. Specifically, for each measure within each wave, we regressed out the observed score on the relevant covariates (e.g., age and/or sex) and subtracted the fitted values [e.g., β 1*sex and, where applicable, β 2*age] to obtain residualized scores, which were then used in the structural equation models.
To leverage the longitudinal nature of the data, we applied latent growth models of attention problems from ages 7–14 that were previously developed in this sample (Friedman et al., Reference Friedman, Haberstick, Willcutt, Miyake, Young, Corley and Hewitt2007), separately for parent- and teacher-report. Growth models summarize developmental trajectories using latent factors representing the intercept (baseline level of attention problems) and slope (rate of change across time). We compared linear, quadratic, and freed-curve (Bollen & Curran, Reference Bollen and Curran2006) specifications to determine the best-fitting model (Table S4). The freed-curve model, in which time loadings are estimated rather than fixed, provides a flexible representation of developmental change when trajectories may not follow a strictly linear or quadratic form (Bollen & Curran, Reference Bollen and Curran2006). Based on these comparisons,Footnote 2 a quadratic model with the slope centered at age 7 was selected; Figure S1 shows the schematic latent growth model specification.
Phenotypic models
To estimate the latent growth curve models, we used the lavaan package in RStudio (version 2024.12.0). Additionally, we conducted a series of regressions using the lme4 package in RStudio to examine the associations between childhood and adolescent attention problems and adult attention problems, as well as the relationship between impulsivity and adult attention problems. We further tested whether adult impulsivity uniquely predicts adult attention problems after controlling for earlier attention problems and impulsivity. For these phenotypic regressions, all continuous predictors were standardized (z-scored) to facilitate interpretation of the regression coefficients in standard deviation units.
Twin models
To investigate the genetic and environmental influences on attention problems and impulsivity, we conducted univariate and multivariate twin models using OpenMx in RStudio. Twins were randomly assigned to twin1 and twin2 for the genetic models, using the same random assignment used in prior studies (Friedman et al., Reference Friedman, Miyake, Altamirano, Corley, Young, Rhea and Hewitt2016). Continuous variables were residualized for sex before analysis; thus, sex influences were accounted for before modeling and were not included as covariates in the genetic models. These models decompose the variance of each phenotype and covariance between phenotypes into three components: additive genetic (A) influences, which represent the sum of additive influences of a large number of genetic variants; shared environmental (C) influences, which lead individuals raised together to be similar; and nonshared environmental (E) influences, which lead individuals raised together to be uncorrelated. The A factors correlate 1.0 in monozygotic (MZ) twins because they share 100% of their alleles, but 0.5 for dizygotic (DZ) twins because they share on average 50% of their alleles identical by descent. The C factors correlate 1.0 for both MZ and DZ twins because both types are reared together. The E factors do not correlate across twins by definition.
In some cases, genetic influences may also be nonadditive, known as dominance genetic (D) effects. D cannot be modeled alongside C in the classical twin design because there is not enough information to estimate both parameters. Decisions about which to include depend on the twin correlations, as they lead to different expected correlations across twin pairs. We tested an ACE or ADE model depending on whether the DZ correlation was more than half or approximately half [ACE], or less than half the MZ correlation [ADE]. Then we compared ACE/ADE to AE models to identify the most parsimonious model for each phenotype, which, for the multivariate analyses, ultimately resulted in AE models.
To estimate the univariate models, we used the “direct symmetric” approach, which allows variances to be negative to reduce bias in other estimates (Verhulst et al., Reference Verhulst, Prom-Wormley, Keller, Medland and Neale2019). We used a series of Cholesky decompositions to model the genetic and environmental associations between APs across development and measures of impulsivity. For each attention problem and impulsivity measure, variance was decomposed into additive genetic and nonshared environmental variances; variance explained was obtained by squaring the paths from these variables. AE components from attention problems that were nonzero or not near zero were allowed to predict variance in the impulsivity scales, while the residual variance in the impulsivity scales, that is, the variance not accounted for by earlier attention problem factors, was further decomposed into unique genetic and nonshared environmental contributions. To assess whether adulthood impulsivity explains unique variance in adulthood AP, we examined the paths from adulthood impulsivity to adulthood attention problems after accounting for shared variance with childhood and adolescent attention problems, as well as adolescent and emerging adulthood impulsivity. That is, the order of the variables in the decomposition was informed by the goal of isolating adult covariances.
Likelihood-based confidence intervals, which identify the upper and lower values for each parameter that lead to a significantly different model chi-square test (Neale & Miller, Reference Neale and Miller1997), were used to evaluate the significance of individual paths: Paths for which the interval did not include zero were considered significant. For parameters where confidence intervals could not be reliably estimated by OpenMx, we constrained the path to zero and performed chi-square difference tests to assess whether removing the path significantly worsened model fit.
For all analyses, participants with missing data for one or more measures were retained using full information maximum likelihood (ML) estimation. In phenotypic analyses, the nonindependence of twin pairs was accounted for by including a random intercept for family (1 | family), allowing observations from the same family to be correlated. For twin model comparisons, we used the Akaike Information Criterion (AIC) and Bayesian Information Criterion, with lower values indicating better models, and likelihood-ratio tests for nested models.
Results
Preliminary analyses: Growth models of parent- and teacher-reported attention problems
We tested linear, quadratic, and freely estimated growth models to characterize developmental trajectories of parent- and teacher-reported attention problems (Table S4). The quadratic model provided the best fit for both parent and teacher reports and was therefore selected for subsequent analyses. Individual differences in attention problems were primarily captured by the intercept factor, with relatively modest changes in attention problems across childhood and adolescence (Table S5). Because our primary interest was in the stable liability reflected by the intercept factor, we focused on this factor while also testing whether the linear slope factor captured any additional unique variation in phenotypic analyses. The linear slope factor represents the instantaneous rate of change at the centered age (age 7). Further details can be found in the Supplementary Materials.
Phenotypic relationship between early attention problems and adult attention problems
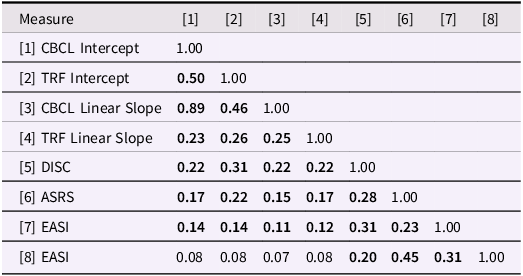
Phenotypic correlations (Table 2) demonstrate that early childhood attention problems (intercept factor scores) and developmental change over time (linear slope factor scores), as reported by parents and teachers, show modest to moderate continuity with adolescent lifetime ADHD symptoms and adult attention problems (rs = .15–.31). Adolescent lifetime ADHD symptoms were moderately correlated with adult attention problems (r = .28), suggesting persistence of attentional problems into adulthood. Moreover, childhood attention problems were minimally related to adult impulsivity (rs = .07–.08), while adult attention problems were strongly associated with concurrent adult impulsivity (r = .45). Adolescent impulsivity showed a modest correlation with adult attention problems (r = .23), suggesting that the relationship between impulsivity and adult attention problems may reflect persistent variance in impulsivity, though it appears to strengthen later in development.
Phenotypic correlations for attention problems and impulsivity across development
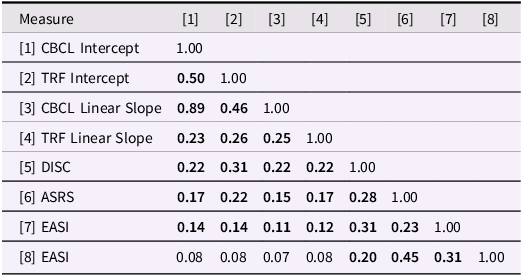
Table 2. Long description
A table with 8 rows and 8 columns showing phenotypic correlations for attention problems and impulsivity across development. The table includes correlation values between different factors. Row 1: Parent-report AP intercept factor, 1.00. Row 2: Teacher-report AP intercept factor, 0.50, 1.00. Row 3: Parent-report AP linear slope factor at age 7, 0.89, 0.46, 1.00. Row 4: Teacher-report AP linear slope factor at age 7, 0.23, 0.26, 0.25, 1.00. Row 5: Self-report adolescent lifetime ADHD symptoms, 0.22, 0.31, 0.22, 0.22, 1.00. Row 6: Self-report adulthood AP, 0.17, 0.22, 0.15, 0.17, 0.28, 1.00. Row 7: Self-report adolescent impulsivity, 0.14, 0.14, 0.11, 0.12, 0.31, 0.23, 1.00. Row 8: Self-report adulthood impulsivity, 0.08, 0.08, 0.07, 0.08, 0.20, 0.45, 0.31, 1.00.
Note. Bolded values represent significant Pearson correlations (p < .05).
AP = Attention Problems; ADHD = Attention Deficit/Hyperactivity Disorder; CBCL = Child Behavior Checklist; TRF = Teacher Report Form; DISC = Diagnostic Interview Schedule for Children; ASRS = Adult Self-Report Scale; EASI = Emotionality, Activity, Sociability, and Impulsivity survey.
[1] CBCL Intercept, [2] TRF Intercept, [3] CBCL Linear Slope, [4] TRF Linear Slope, [5] DISC, [6] ASRS, [7] EASI, and [8] EASI.
In a multiple linear regression, the parent-report intercept factor of attention problems (β = 0.22, p = .023), teacher-report linear slope factor of attention problems (β = 0.10, p = .024), and self-reported adolescent lifetime ADHD symptoms (β = 0.21, p < .001) significantly predicted adult attention problems. In contrast, the teacher-report intercept factor and parent-report linear slope factor were not significant.
Next, we tested whether adult impulsivity was associated with adult attention problems over and above earlier measures of attention problems and impulsivity. In a model including early attention problems along with adolescent and adult impulsivity, adult impulsivity accounted for variance overlapping with earlier attention problems. This reduced the effect of the parent-report intercept factor (β = 0.12, p = .224), while the teacher-reported linear slope factor of attention problems (β = 0.12, p = .008) and adolescent lifetime ADHD symptoms (β = 0.15, p = .001) remained significant. Adult impulsivity was a strong predictor (β = 0.43, p < .001), indicating that it captures variance in adult attention problems that is partially redundant with earlier attention problem measures.
Twin-based heritability and environmental influences
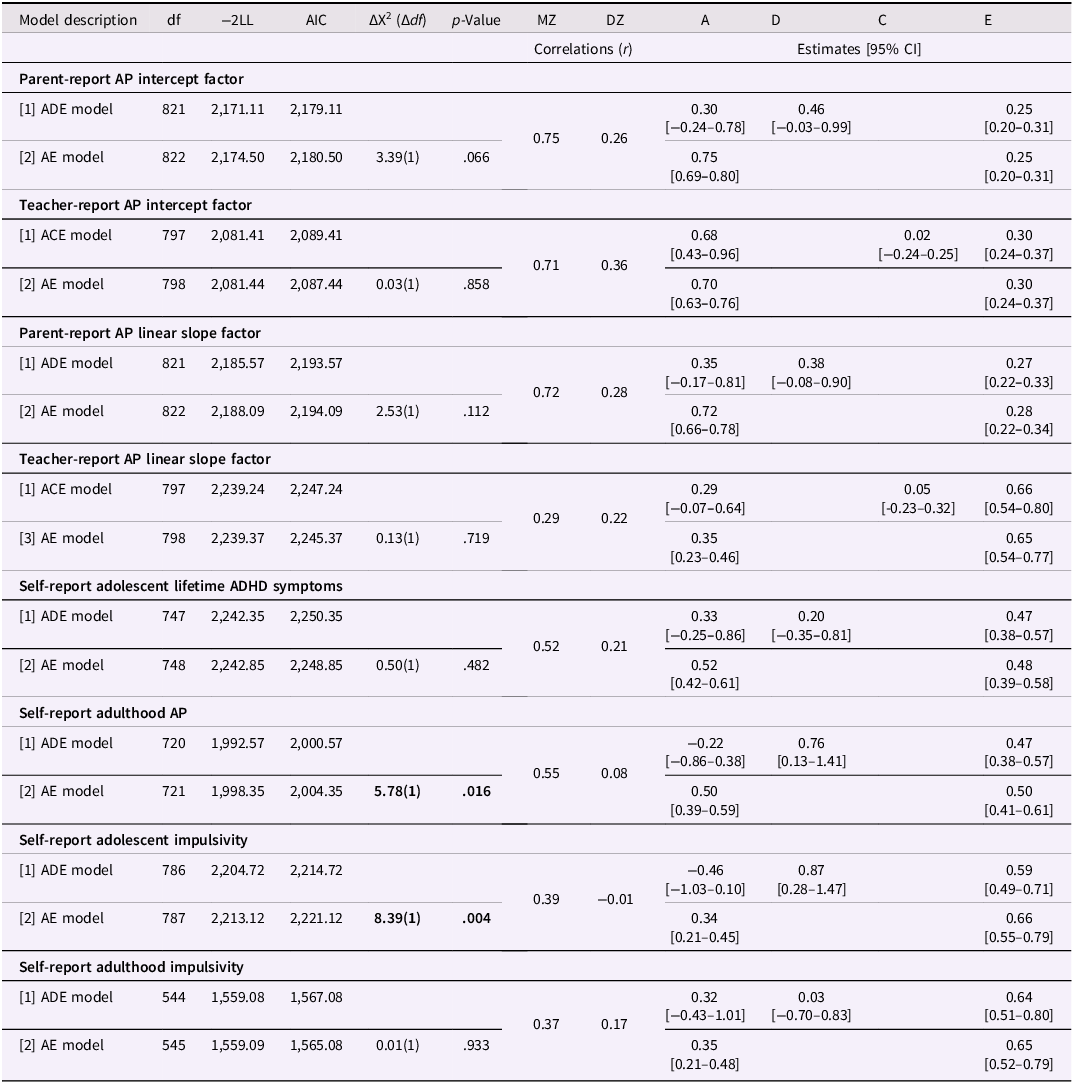
Twin correlations displayed moderate to high MZ correlations (r = .29–.75) and more variable DZ correlations (r = −.01–.36) (Table 3). Additional information regarding correlation patterns and model selection is provided in the Supplementary Materials. Consistent with these patterns, twin-based estimates (Table 3) indicated significant heritability of attention problems across development (A = 0.35–0.75), with little evidence for shared environmental influences (C = 0.02–0.05), and modest to moderate nonshared environmental influences (E = 0.25–0.65). Although heritability estimates varied across time points, differences should be interpreted cautiously, given changes in raters and measures. Impulsivity, as measured by the EASI and BIS, also showed moderate genetic influence (A = 0.34–0.42), with the remaining variance attributable to nonshared environmental influences (E = 0.58–0.66) (Table 3; Table S6).
Univariate twin model comparisons, twin correlations, and genetic and environmental estimates for attention problems and impulsivity
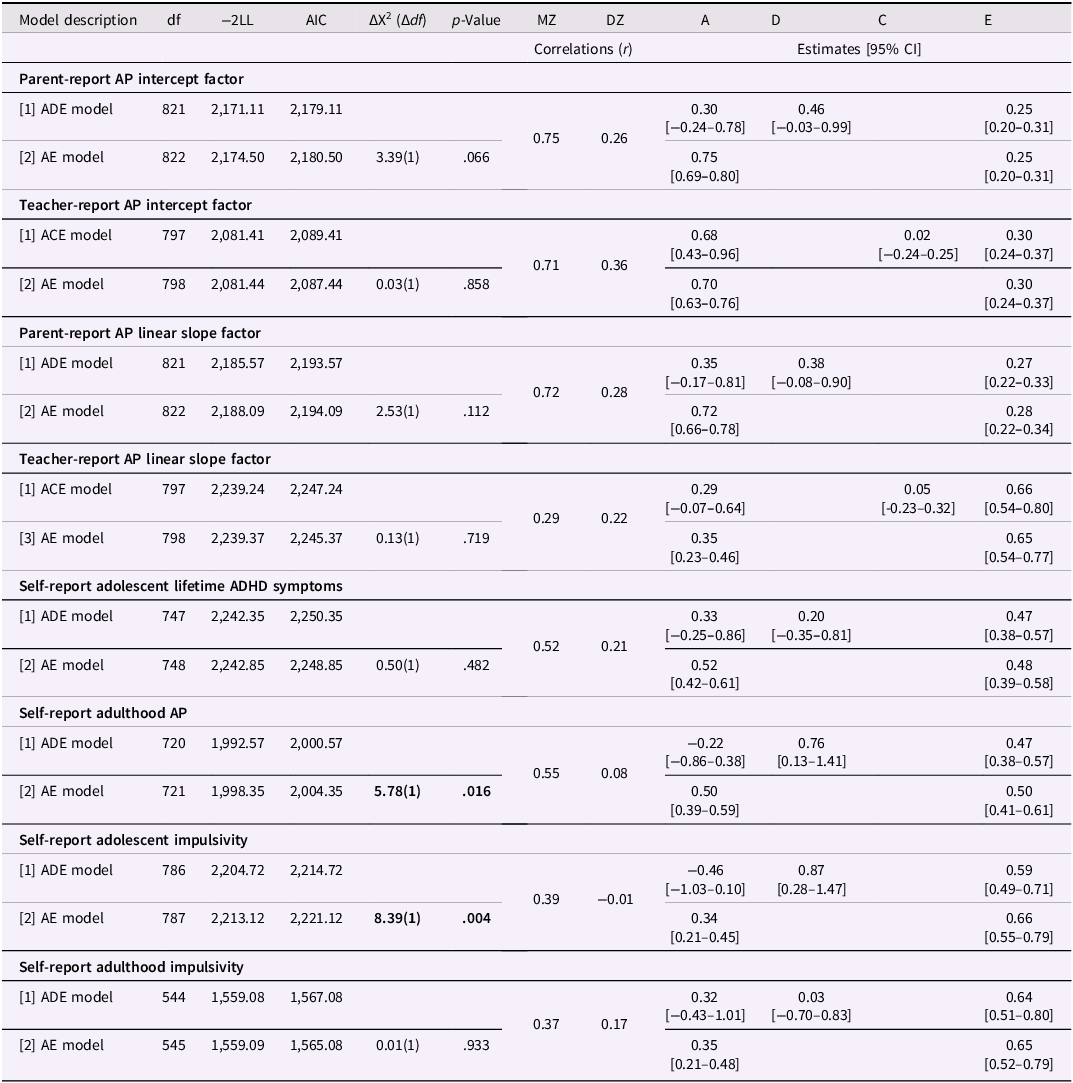
Table 3. Long description
The table presents data on twin correlations and genetic and environmental estimates for attention problems and impulsivity. It includes various models and their corresponding statistics such as degrees of freedom (df), -2LL, AIC, ΔX^2 (Δdf), p-Value, and correlations (r) for MZ, DZ, A, D, C, and E. The table is divided into sections for parent-report and teacher-report attention problems (AP) intercept and linear slope factors at age 7, self-report adolescent lifetime ADHD symptoms, self-report adulthood AP, self-report adolescent impulsivity, and self-report adulthood impulsivity. Each section lists different models with their respective values and estimates. Notable trends include moderate to high MZ correlations and more variable DZ correlations, significant heritability of attention problems, and varying influences of shared and nonshared environmental factors across different time points and measures.
Note. p-values are derived from the comparison of ACE/ADE and AE models to assess the significance of shared environmental influences versus additive and nonshared influences in explaining variance in AP. Boldface values represent significant p-values (p < .05). Correlations (r) are reported for MZ and DZ twins, while standardized estimates for A, D, C, and E influences are presented, followed by the 95% confidence intervals in brackets. Subsequent nested models were selected based on the pattern of twin correlations. When MZ correlations were more than twice the DZ correlations, suggesting potential D effects, ADE models were fit. When MZ correlations were less than twice the DZ correlations, suggesting potential C effects, ACE models were fit.
AP = Attention Problems; ADHD = Attention Deficit/Hyperactivity Disorder; MZ = Monozygotic Twins; DZ = Dizygotic Twins; A = Additive Genetic Influences; D = Dominant Genetic Influences; C = Shared Environmental Influences; E = Nonshared Environmental Influences; AIC = Akaike Information Criterion; LL = Log Likelihood.
Stability and emergence of genetic influences on attention problems across development
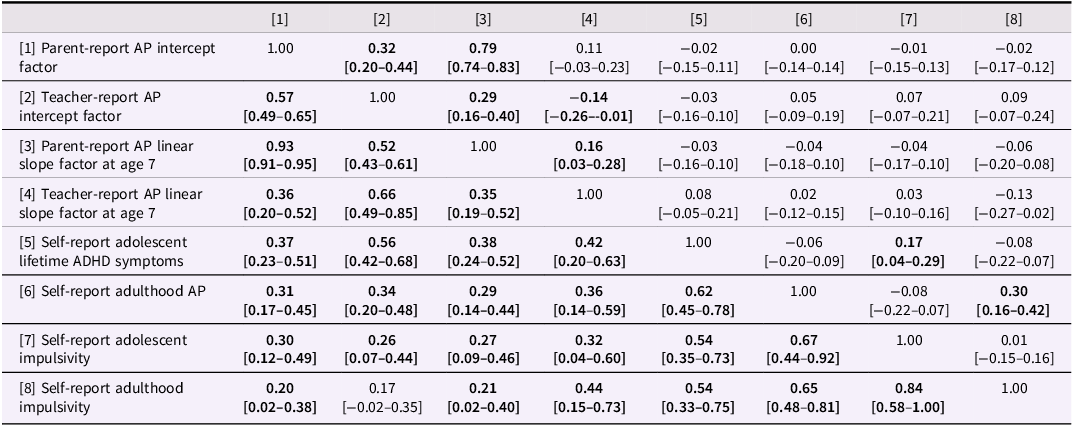
Genetic influences on attention problems in adulthood partly reflect those already present in childhood and adolescence, with novel influences emerging later, as indicated by the genetic correlations (Table 4). Specifically, the growth factors of parent- and teacher-reported attention problems (i.e., intercept and linear slope factors) showed moderate genetic overlap with adolescent lifetime ADHD symptoms and adult attention problems (r A = 0.29–0.56). Interestingly, adolescent lifetime ADHD symptoms showed moderate genetic overlap with adult attention problems (r A = 0.62), suggesting that adult attention problems reflect both stable and newly emerging genetic influences across development.
Genetic and nonshared environmental correlations for attention problems and impulsivity
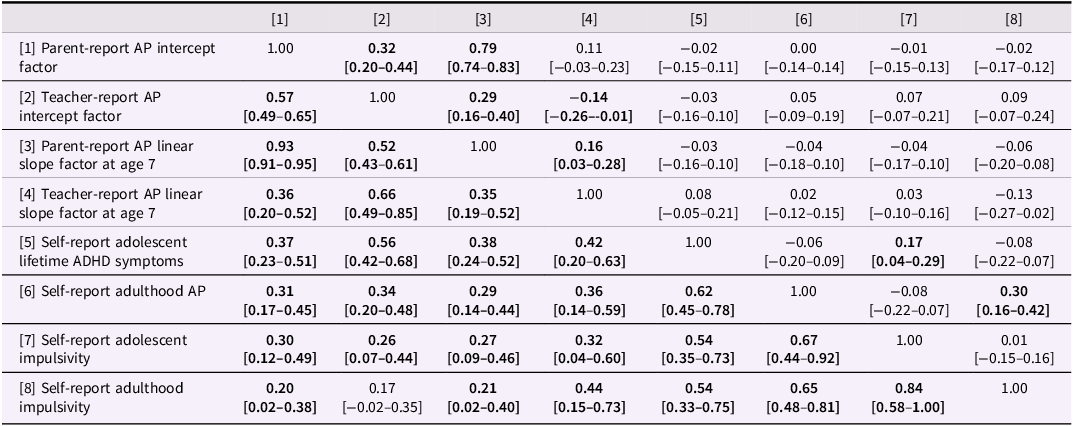
Table 4. Long description
A table with 8 rows and 8 columns showing genetic and nonshared environmental correlations for attention problems and impulsivity. The table includes correlations between parent-report and teacher-report attention problem intercept and linear slope factors at age 7, self-report adolescent lifetime ADHD symptoms, self-report adulthood attention problems, adolescent impulsivity, and adulthood impulsivity. Row 1: Parent-report AP intercept factor, 1.00, 0.32 [0.20-0.44], 0.79 [0.74-0.83], 0.11 [-0.03-0.23], -0.02 [-0.15-0.11], 0.00 [-0.14-0.14], -0.01 [-0.15-0.13], -0.02 [-0.17-0.12]. Row 2: Teacher-report AP intercept factor, 0.57 [0.49-0.65], 1.00, 0.29 [0.16-0.40], -0.14 [-0.26--0.01], -0.03 [-0.16-0.10], 0.05 [-0.09-0.19], 0.07 [-0.07-0.21], 0.09 [-0.07-0.24]. Row 3: Parent-report AP linear slope factor at age 7, 0.93 [0.91-0.95], 0.52 [0.43-0.61], 1.00, 0.16 [0.03-0.28], -0.03 [-0.16-0.10], -0.04 [-0.18-0.10], -0.04 [-0.17-0.10], -0.06 [-0.20-0.08]. Row 4: Teacher-report AP linear slope factor at age 7, 0.36 [0.20-0.52], 0.66 [0.49-0.85], 0.35 [0.19-0.52], 1.00, 0.08 [-0.05-0.21], 0.02 [-0.12-0.15], 0.03 [-0.10-0.16], -0.13 [-0.27-0.02]. Row 5: Self-report adolescent lifetime ADHD symptoms, 0.37 [0.23-0.51], 0.56 [0.42-0.68], 0.38 [0.24-0.52], 0.42 [0.20-0.63], 1.00, -0.06 [-0.20-0.09], 0.17 [0.04-0.29], -0.08 [-0.22-0.07]. Row 6: Self-report adulthood AP, 0.31 [0.17-0.45], 0.34 [0.20-0.48], 0.29 [0.14-0.44], 0.36 [0.14-0.59], 0.62 [0.45-0.78], 1.00, -0.08 [-0.22-0.07], 0.30 [0.16-0.42]. Row 7: Adolescent impulsivity, 0.30 [0.12-0.49], 0.26 [0.07-0.44], 0.27 [0.09-0.46], 0.32 [0.04-0.60], 0.54 [0.35-0.73], 0.67 [0.44-0.92], 1.00, 0.01 [-0.15-0.16]. Row 8: Adulthood impulsivity, 0.20 [0.02-0.38], 0.17 [-0.02-0.35], 0.21 [0.02-0.40], 0.44 [0.15-0.73], 0.54 [0.33-0.75], 0.65 [0.48-0.81], 0.84 [0.58-1.00], 1.00.
Note. Genetic and nonshared environmental correlations are presented with 95% confidence intervals in brackets. Genetic correlations appear in the lower diagonal, and nonshared environmental correlations in the upper diagonal. Bolded values indicate significant correlations with 95% confidence intervals that do not include zero.
AP = Attention Problems; ADHD = Attention Deficit/Hyperactivity Disorder.
[1] Parent-Report AP Intercept Factor, [2] Teacher-Report AP Intercept Factor, [3] Parent-Report AP Linear Slope Factor, [4] Teacher-Report AP Linear Slope Factor, [5] Self-Report Adolescent Lifetime ADHD Symptoms, [6] Self-Report Adult AP, [7] Adolescent Impulsivity, and [8] Adulthood Impulsivity.
Nonshared environmental correlations were generally low and nonsignificant, with parent- and teacher-reported growth factors of attention problems (r E = −0.04 to 0.08) and adolescent lifetime ADHD symptoms (r E = −0.06) showing minimal overlap with adult attention problems. These results suggest that adult attention problems are largely independent of earlier nonshared environmental influences.
Longitudinal genetic and environmental contributions to adult attention problems
To examine the relationships of genetic and environmental influences across development, we conducted Cholesky decompositions of relationships among childhood, adolescent, and adult attention problems (see red and green lines in Figure 1; Table S7). Results indicated that adult attention problems were influenced by both persistent and novel genetic factors. Childhood and adolescent attention problems contributed modestly to adult outcomes, where the genetic components for the parent- and teacher-report growth factors (e.g., intercept and linear slope factor at age 7) of attention problems accounted for 8.8% (β = 0.02–0.22) of the total variance in adult attention problems, respectively; self-reported adolescent lifetime ADHD symptoms explained 11.6% (β = 0.34) of the total variance. In contrast, adulthood-specific genetic influences accounted for 31.4% of the total variance (β = 0.56), highlighting the possible emergence of new genetic factors for the adult measure. Nonshared environmental influences from earlier developmental stages were minimal (βs = −0.05 to 0.04, ≤1.0% of total variance), whereas adulthood-specific nonshared environmental factors accounted for 49.0% of the total variance (β = 0.70).
Cholesky decomposition of attention problems. The Cholesky model illustrates the contributions of genetic factors (A1–A6) and nonshared environmental influences (E1–E6) on the measured variables. Circles represent the latent variables (A1–A6 and E1–E6), where solid lines denote significant relationships or paths between these variables, with the numbers indicating the strength of the correlations (i.e., correlation coefficients). Grey dotted lines represent non-significant relationships, defined by 95% confidence intervals that include zero (see Table S7). Numerical labels shown on selected paths represent standardized path estimates to aid interpretation of key associations in the model; these labels are displayed regardless of statistical significance. Red lines represent shared variance between the attention problems growth factors (intercept and linear slope factor at age 7), reported by parents and teachers, and adolescent lifetime ADHD symptoms, with adult attention problems. The green line indicates variance unique to adult attention problems. AP = Attention Problems; ADHD = Attention Deficit/Hyperactivity Disorder.

Figure 1. Long description
A Cholesky decomposition diagram of attention problems. The diagram includes circles representing latent variables labeled A1 through A6 and E1 through E6. Solid lines denote significant relationships or paths between these variables, with numbers indicating the strength of the correlations. Grey dotted lines represent non-significant relationships. Numerical labels on selected paths represent standardized path estimates. Red lines show shared variance between attention problems growth factors reported by parents and teachers, and adolescent lifetime ADHD symptoms with adult attention problems. The green line indicates variance unique to adult attention problems. The diagram includes labels for Parent-Report AP Intercept Factor, Teacher-Report AP Intercept Factor, Parent-Report AP Linear Slope Factor, Teacher-Report AP Linear Slope Factor, Self-Report Adolescent ADHD Symptoms, and Self-Report Adulthood AP.
Overall, the phenotypic association (r = .60) between earlier attention problems and adult attention problems was largely explained by overlapping genetic influences (93.4%), with minimal contributions from nonshared environmental factors (6.6%). Adult attention problems are shaped largely by persistent genetic factors, with significant novel genetic and environmental factors, rather than by individual-specific environmental continuity from earlier development.
Notably, within the parent- and teacher-reported measures of attention problems, the genetic correlations between the intercept and linear slope factors at age 7 were high (Table 4), indicating that slope-related influences largely reflect similar underlying liability captured by baseline levels (intercept factor at age 7) rather than representing distinct genetic influences. Consistent with this, Cholesky results demonstrated that genetic contributions to adolescent lifetime ADHD symptoms and adult attention problems were driven predominantly by intercept factors, with minimal unique contribution from slope-specific genetic influences (see red lines in Figure 1; Table S7). Moreover, cross-rater continuity was limited, indicating that baseline attention problems are largely rater-specific and do not strongly generalize across raters or to later self-reported outcomes.
Genetic and environmental overlap between adult impulsivity and attention problems
Impulsivity in adulthood appears to be largely genetically distinct from earlier attention problems, with modest genetic overlap with parent- and teacher-reported growth factors of attention problems (r A = 0.17–0.44) (Table 4). These results suggest that genetic influences on early attention problems contribute little to later impulsive behavior. Adolescent lifetime ADHD symptoms showed moderate genetic overlap with both adolescent and adult impulsivity (r A = 0.54). Adult attention problems also showed substantial genetic overlap with both adolescent and adult impulsivity (r A = 0.65–0.67), reflecting an increasing convergence between attention problems and impulsivity in later development (Table 4).
Nonshared environmental correlations were generally low, with few significant associations (Table 4). There were no significant associations between the growth factors of parent- and teacher-reported attention problems with adolescent or adult impulsivity (r Es = –0.13 to 0.09). Adolescent lifetime ADHD symptoms were significantly environmentally correlated with adolescent impulsivity (r E = 0.17), and adult impulsivity was significantly environmentally correlated with adult attention problems (r E = 0.30). These results indicate that environmental overlap between these traits emerges primarily in adulthood, although this pattern could also reflect the fact that impulsivity and attention problems were both self-rated at these ages. We ran a supplementary analysis using the BIS impulsivity subscale as an alternative measure of adult impulsivity and observed a similar pattern of results (see Table S8).
Unique contributions of impulsivity to adult attention problems
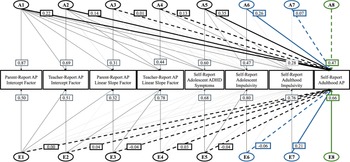
To examine the unique contribution of impulsivity to attention problems in adulthood, we used Cholesky decomposition to account for earlier attention problems and adolescent impulsivity to isolate associations specific to adulthood (see blue lines in Figure 2; Table S9). Adolescent impulsivity contributed moderately to the genetic variance in adult attention problems (β = 0.26, 6.8% of the total variance). Whereas the genetic contribution of adult impulsivity was minimal and nonsignificant (β = 0.07, <1% of the total genetic variance), indicating that most of the shared genetic influences are established by late adolescence. Nonshared environmental contributions from impulsivity were minimal for adolescent impulsivity (β = −0.06, <1.0% of total variance) and modest for adult impulsivity (β = 0.21, 4.4% of total variance).
Cholesky decomposition of attention problems and impulsivity. The figure illustrates the contributions of genetic factors (A1–A8) and nonshared environmental influences (E1–E8) on the measured variables. Circles represent the latent variables (A1–A8 and E1–E8), where solid lines denote significant relationships or paths between these variables, with the numbers indicating the strength of the correlations (i.e., correlation coefficients). Grey dotted lines represent non-significant relationships, defined by 95% confidence intervals that include zero (see Table S9). Numerical labels shown on selected paths represent standardized path estimates to aid interpretation of key associations in the model; these labels are displayed regardless of statistical significance. Thick black lines represent shared variance between the attention problems intercept factor (reported by parents and teachers) and adolescent lifetime ADHD symptoms, with adult attention problems. Blue lines represent shared variance between impulsivity measures and adult attention problems, and the green line indicates variance unique to adult attention problems. AP = Attention Problems; ADHD = Attention Deficit/Hyperactivity Disorder.
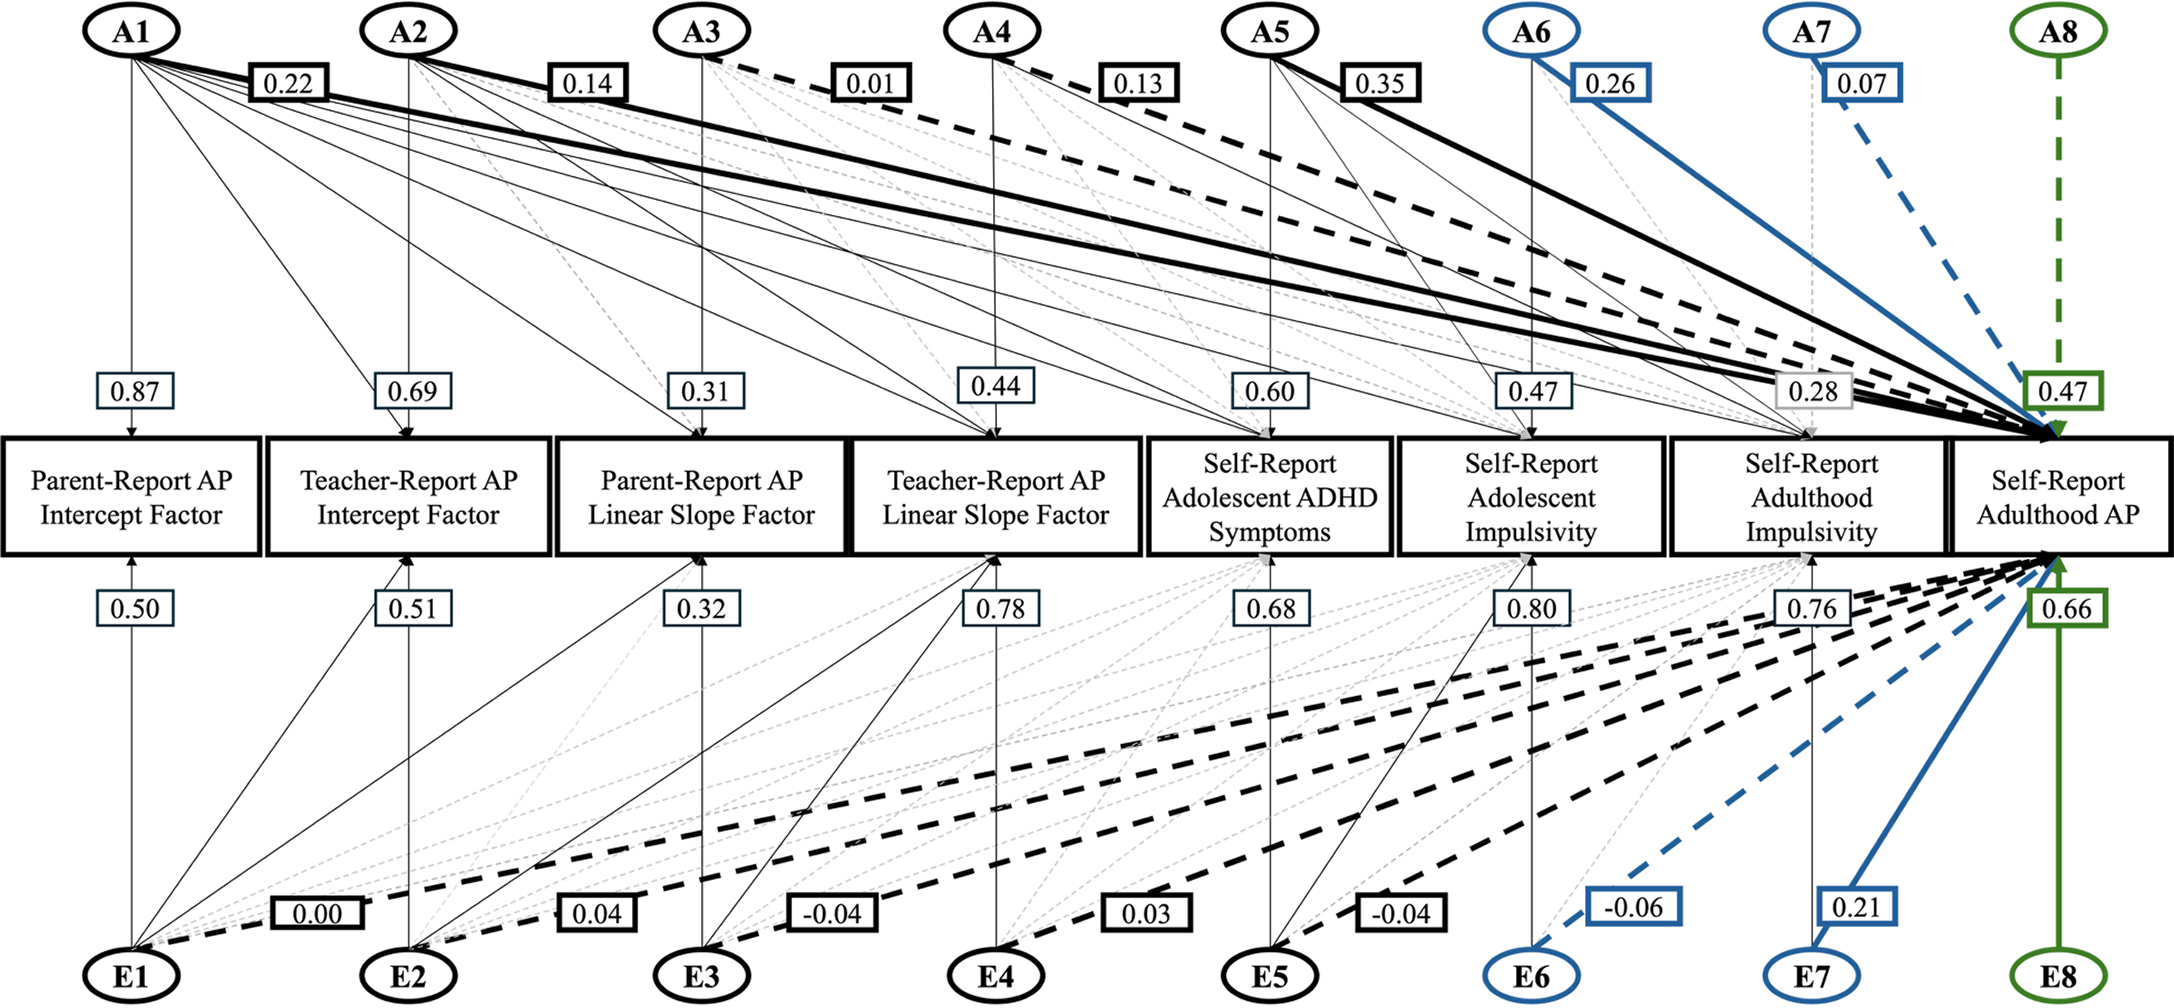
Figure 2. Long description
A Cholesky decomposition model diagram of attention problems and impulsivity. The diagram includes circles representing latent variables labeled A1 through A8 and E1 through E8. Solid lines denote significant relationships or paths between these variables, with numbers indicating the strength of the correlations. Grey dotted lines represent non-significant relationships. Thick black lines represent shared variance between the attention problems intercept factor and adolescent lifetime ADHD symptoms with adult attention problems. Blue lines represent shared variance between impulsivity measures and adult attention problems, and the green line indicates variance unique to adult attention problems. The diagram includes labels for parent-report and teacher-report attention problems intercept and linear slope factors, self-report adolescent ADHD symptoms, self-report adolescent impulsivity, self-report adulthood impulsivity, and self-report adulthood attention problems.
The unique association between adult impulsivity and adult attention problems, controlling for earlier attention problems and earlier impulsivity (partial r = .18), was largely explained by nonshared environmental influences (89.1%), with the remaining 10.9% of the association attributable to overlapping genetic influences. This pattern was consistent when using BIS-based impulsivity measures (Figure S2; Table S10).
Of note, the unique genetic variance in adolescent impulsivity (not shared with earlier attention problems) was significantly associated with adult attention problems (β = 0.26) and with adult impulsivity (β = 0.36, 13.0%). This relationship accounts for some of the overlap in adult impulsivity and adult attention problems, as noted earlier in the context of phenotypic regressions. In this genetic model, this overlap between adolescent impulsivity and adult attention problems is primarily genetic, with unique nonshared environmental influences on adolescent attention problems showing a non-significant relationship with adult attention problems (β = 0.01, <1.0%). Taken together with the results specific to adult impulsivity described in the prior paragraph, these results suggest the association between adult attention problems and impulsivity reflects both persistent genetic influences from adolescent impulsivity and novel nonshared environmental influences on adult impulsivity.
Sensitivity analyses focusing on adult inattention symptoms
To evaluate whether findings involving adult attention problems were influenced by overlap with hyperactivity/impulsivity content in the adult measure, we repeated the primary analyses using the ASRS inattention subscale, which excludes hyperactivity/impulsivity items. Results were unchanged for the specific associations observed across the phenotypic regression and Cholesky decomposition analyses (Tables S11 and S12; see Supplementary Materials for further details). These findings suggest that the observed associations between impulsivity and adult attention problems were not explained by overlapping hyperactivity/impulsivity content.
Discussion
Across development, attention problems, as measured across multiple raters, showed moderate continuity from childhood into adulthood, alongside meaningful developmental change, indicating that adult symptom profiles reflect both early-emerging liability and adult-specific influences. Etiologically, this pattern was primarily attributable to stable genetic influences, with minimal contribution from childhood nonshared environmental influences, indicating limited long-term persistence of early environmental factors. At the same time, attention problems in late adolescence and adulthood were also influenced by new genetic factors not shared with earlier developmental stages, suggesting the emergence of novel genetic liability over time. Adult impulsivity showed a distinct association with adult attention problems, even after accounting for earlier attention problems and earlier impulsivity, suggesting that impulsivity becomes more associated with attention problems later in development. This association was largely driven by nonshared environmental influences, indicating that individual-specific experiences in adulthood play an important role in shaping this relationship. However, differences in rater and measurement instruments across development should be considered when interpreting these developmental patterns.
Developmental continuity and change in attention problems
Across development, attention problems showed moderate continuity from childhood into adulthood, alongside meaningful developmental change, indicating that adult symptom levels reflect both early-emerging and later developmental influences. This pattern aligns with prior work demonstrating moderate stability alongside developmental change in attention problems across development (Faraone et al., Reference Faraone, Banaschewski, Coghill, Zheng, Biederman, Bellgrove, Newcorn, Gignac, Al Saud, Manor, Rohde, Yang, Cortese, Almagor, Stein, Albatti, Aljoudi, Alqahtani, Asherson and Wang2021; Larsson et al., Reference Larsson, Dilshad, Lichtenstein and Barker2011; Martel et al., Reference Martel, von Eye and Nigg2012; Rietveld et al., Reference Rietveld, Hudziak, Bartels, van Beijsterveldt and Boomsma2004; Willcutt, Reference Willcutt2012).
These results suggest that both stable and time-varying factors contribute to continuity and change in attention problems. From childhood to adulthood, attention problems showed moderate to high heritability (h 2 = 0.35–0.75) and modest to moderate nonshared environmental influences (e 2 = 0.25–0.65), with little evidence for shared environmental influences. These findings align with prior work demonstrating strong genetic contributions to attention problems (Chang et al., Reference Chang, Lichtenstein, Asherson and Larsson2013; Kan et al., Reference Kan, Dolan, Nivard, Middeldorp, van Beijsterveldt, Willemsen and Boomsma2013; Nikolas & Burt, Reference Nikolas and Burt2010; van den Berg et al., Reference van den Berg, Willemsen, de Geus and Boomsma2006). However, differences in estimates should be interpreted cautiously, as different raters and measurement instruments were used across time points.
Genetic and environmental correlations provide insight into whether continuity in attention problems reflects shared underlying influences across development or the emergence of new influences over time. The intercept factor of childhood attention problems showed modest genetic overlap with adult attention problems, as well as developmental change (i.e., slope), although these associations were largely accounted for by the intercept factor of attention problems. This finding suggests that stable liability, rather than developmental change over time, drives long-term genetic continuity. Adolescent lifetime ADHD symptoms demonstrated strong genetic continuity with adult attention problems, although some of this association may reflect methodological variance as both measures were self-reported and assessed later in development. Our findings demonstrate moderate genetic stability in attention problems across development, consistent with prior research demonstrating that genetic influences remain relatively stable from childhood into adulthood (Boomsma et al., Reference Boomsma, Saviouk, Hottenga, Distel, de Moor, Vink, Geels, van Beek, Bartels, de Geus and Willemsen2010; Kan et al., Reference Kan, Dolan, Nivard, Middeldorp, van Beijsterveldt, Willemsen and Boomsma2013; Larsson et al., Reference Larsson, Chang, D’Onofrio and Lichtenstein2014; Reiersen et al., Reference Reiersen, Constantino, Grimmer, Martin and Todd2008; van den Berg et al., Reference van den Berg, Willemsen, de Geus and Boomsma2006).
At the same time, the relatively weaker genetic correlations between childhood and adult attention problems indicate the emergence of novel genetic influences in adulthood not shared with earlier stages. Substantial adult-specific genetic variance (31% of the total variance in adult attention problems) was evident in the attention problem Cholesky decomposition, over and above genetic influences shared with self-reported lifetime adolescent ADHD symptoms, although the measurement instruments differed across time points. This finding is consistent with prior evidence of genetic innovation in adolescence and emerging adulthood (Chang et al., Reference Chang, Lichtenstein, Asherson and Larsson2013; Franke et al., Reference Franke, Faraone, Asherson, Buitelaar, Bau, Ramos-Quiroga, Mick, Grevet, Johansson, Haavik, Lesch, Cormand and Reif2012; Larsson et al., Reference Larsson, Larsson and Lichtenstein2004; Pingault et al., Reference Pingault, Viding, Galéra, Greven, Zheng, Plomin and Rijsdijk2015).
Nonshared environmental correlations across development were minimal, suggesting limited continuity of environmental influences from childhood into later stages of development and highlighting the age-specific nature of environmental influences for attention problems. Nonshared environmental influence includes measurement error, and the lack of reliability estimates for the growth factors of childhood attention problems and for adolescent lifetime ADHD symptoms limits the ability to fully separate error from true environmental effects. However, the estimates were substantially larger than the measurement error that might be expected given that we used factor scores across time (e.g., the Cronbach’s alpha for the CBCL and TRF measures were 0.74–0.94). Thus, these nonshared environmental estimates likely reflect a combination of measurement error and genuine nonshared environmental influences.
Importantly, adult attention problems exhibited unique genetic and nonshared environmental influences even after accounting for earlier attention problems and impulsivity. The emergence of adult-specific variance after accounting for earlier attention-related traits, including adolescent self-reported ADHD symptoms, suggests that the observed adult-specific effects are not solely attributable to the change in rater across development. Thus, the findings are consistent with both persistent genetic liability and additional genetic influences emerging later in development, while recognizing that rater differences may contribute to the magnitude of these effects.
Unique relationship between adulthood attention problems and impulsivity
Prior work suggests that the symptom profile of attention problems shifts across development, such that hyperactivity tends to decline, while impulsivity is a more salient symptom of adult attention problems and ADHD (Barkley et al., Reference Barkley, Murphy and Fischer2008; Martel et al., Reference Martel, von Eye and Nigg2012). Extending this work, we found that adult impulsivity was distinctly associated with adult attention problems in adulthood, even after accounting for earlier attention problems and adolescent impulsivity.
Consistent with this developmental perspective, impulsivity demonstrates moderate to strong genetic stability from adolescence and adulthood, indicating it as a persistent, heritable trait (Larsson et al., Reference Larsson, Chang, D’Onofrio and Lichtenstein2014). The unique associations of adult attention problems with adult impulsivity were primarily driven by individual-specific, nonshared environmental influences, with little evidence for additional genetic influences beyond earlier developmental traits. This finding suggests that experiences unique to individuals in adulthood play a substantial role in shaping the impulsivity component of the symptom profile of attention problems. In contrast, adolescent impulsivity captured a significant amount of genetic variance in adult attention problems, suggesting that, at the genetic level, late-adolescent impulsivity reflects a stable liability associated with continuity into adulthood, rather than a purely adult-emergent feature.
Together, these findings suggest that impulsivity represents a particularly salient feature of adult attention problems, at least as measured by the scale we used in this study, and should be considered when evaluating ADHD symptom profiles and planning treatment approaches. In clinical practice, adult ADHD treatment generally mirrors established approaches in childhood ADHD (De Crescenzo et al., Reference De Crescenzo, Cortese, Adamo and Janiri2017), with pharmacological interventions as first-line and non-pharmacological interventions (e.g., cognitive-behavior and other skill-based therapies) used in combination (Jensen et al., Reference Jensen, Amdisen, Jørgensen and Arnfred2016), although the efficacy of non-pharmacological interventions in adults is less well established (De Crescenzo et al., Reference De Crescenzo, Cortese, Adamo and Janiri2017). Accordingly, the present findings highlight that clinical approaches in adults may benefit from specific attention to impulsivity-related difficulties, which may not always be as directly targeted by treatment frameworks developed primarily within pediatric ADHD populations.
Multiple rater perspectives on the development of attention problems and impulsivity
The use of multiple raters allowed us to reduce potential bias from rater-specific measurement error, a benefit highlighted in prior work (Chang et al., Reference Chang, Lichtenstein, Asherson and Larsson2013). The growth factors (e.g., intercept and linear slope factor at age 7) of attention problems, as reported by both parents and teachers, were strongly phenotypically and genetically correlated with each other and similarly correlated with later outcomes, reflecting consistent behaviors across home and school contexts. The inclusion of both parent- and teacher-reports therefore provides evidence that the childhood attention problem construct was not dependent on a single rater. In addition, the inclusion of adolescent lifetime ADHD symptoms assessed by self-report provides an important intermediate point between childhood parent- and teacher-report and adult self-report.
Notably, the high genetic overlap observed for ADHD symptoms in adolescence and attention problems in adulthood (r A = 0.62) aligns with clinical family studies showing substantial familial loading on ADHD in adults (Biederman et al., Reference Biederman, Faraone, Milberger, Curtis, Chen, Marrs, Ouellette, Moore and Spencer1996; Chang et al., Reference Chang, Lichtenstein, Asherson and Larsson2013; Faraone et al., Reference Faraone, Biederman and Monuteaux2000). This strong genetic continuity is particularly informative because the adolescent lifetime ADHD measure was self-reported but captured symptoms occurring during the same developmental period assessed by parent and teacher reports, providing evidence of genetic continuity across development despite differences in the rater. Although rater differences have been questioned as a source of variation in heritability estimates, studies that combine parent and self-ratings or use clinical ADHD diagnoses in adulthood report substantially higher heritability estimates (Brikell et al., Reference Brikell, Kuja-Halkola and Larsson2015; Larsson et al., Reference Larsson, Chang, D’Onofrio and Lichtenstein2014), which may reflect the advantage of capturing variance that is consistent across multiple raters while minimizing rater-specific biases.
Rater differences remain an important consideration. Although parent- and teacher-reports in childhood were moderately correlated, correlations with adult self-reports were weaker, consistent with prior meta-analytic work showing low-to-moderate agreement across ADHD informants (Willcutt et al., Reference Willcutt, Nigg, Pennington, Solanto, Rohde, Tannock, Loo, Carlson, McBurnett and Lahey2012; Willcutt, Reference Willcutt2012). Such differences may partly reflect changes in symptom presentation across development, context-specific behaviors, or measurement variance rather than true shifts in heritability. Similarly, the use of self-report for adolescent ADHD symptoms, adult attention problems, and adult impulsivity provides consistency in reporting method but may also introduce shared method variance among these measures. Overall, including multiple raters helps to reduce potential bias from rater-specific measurement error (Chang et al., Reference Chang, Lichtenstein, Asherson and Larsson2013) and provides a more nuanced understanding of attention problems across development, while the longitudinal modeling approach further accounts for variance shared with earlier measures when estimating adult-specific genetic and environmental influences.
Limitations and future directions
Our study has several limitations that highlight directions for future research. First, attention problems were assessed using different methods across development. Specifically, childhood and adolescent attention problems were assessed using the CBCL and TRF, with adolescent lifetime ADHD symptoms additionally evaluated via a diagnostic interview, while adult symptoms were measured with the ASRS screener rather than a comprehensive diagnostic tool. Notably, impulsivity was assessed using the same questionnaire and reporter across development, which reduces variability due to differences in measurement items and ensures that the construct is assessed consistently over time.
Given that the measures of attention problems differed in childhood, adolescence, and adulthood, one concern is that the stronger association observed in adulthood may reflect greater inclusion of impulsivity items in the adult measures of attention problems compared to earlier measures. However, when we examined the number of impulsivity items, we found none in teacher reports of attention problems in childhood and adolescence, one in parent reports during the same period, and three very similar items in both adolescent lifetime ADHD symptom measures and self-reported adult attention problems. If item overlap were driving the pattern, we would expect elevated associations between impulsivity and these earlier measures as well, but this was not observed.
Another limitation is the relatively low reliability of the EASI, which is based on only four items. We used it in the primary analyses because it was the same measure used in adolescence, but this limited reliability may have attenuated associations with attention problems. However, we obtained very similar results when using the combined BIS subscales of self-control and motor impulsiveness (13 items; Cronbach’s alpha = 0.75) as measures of adult impulsivity (see supplemental materials). This pattern suggests that our findings are robust despite the measurement limitations of the impulsivity measure.
Another limitation is that, while we included adolescent and adulthood self-report measures of impulsivity, specific measures of impulsivity were not obtained during the assessments in childhood or early adolescence. The inclusion of measures of impulsivity at all time points would have helped to clarify the extent to which impulsivity is influenced by age-specific versus persistent influences. In future studies, such work could better determine impulsivity’s role in the onset and persistence of attention problems and whether impulsivity in early adolescence contributes differently to attention problems than impulsivity measured in adulthood.
Lastly, although our study focused on individuals with subthreshold attention problems, which allowed us to observe these genetic and environmental patterns across a broader spectrum of symptom severity, it will be important for future research to examine whether these findings are observed in samples of individuals diagnosed with ADHD. Such work could clarify whether similar or diverging patterns emerge for the subdomains of hyperactivity/impulsivity and inattention, shedding light not only on developmental trajectories but also on the underlying etiology of ADHD in adulthood. These insights could ultimately inform more effective, developmentally tailored interventions.
Conclusions
Overall, attention problems show a developmental pattern characterized by both moderate continuity and meaningful change from childhood into adulthood, indicating that adult symptom levels reflect both earlier-emerging characteristics and later developmental influences. However, earlier attention-related traits do not fully account for variation in adult attention problems, suggesting additional influences operating in adolescence and adulthood. Importantly, impulsivity emerged as a key feature of adult attention problems. Adult impulsivity was uniquely associated with adult attention problems, even after accounting for earlier attention problems and adolescent impulsivity. This association was largely driven by individual-specific experiences in adulthood. Together, these findings suggest that while attention problems remain relatively stable over development, their adult expression is not simply a direct extension of childhood symptoms. Instead, impulsivity represents a meaningful and increasingly relevant component of the adult symptom profile, reflecting both persistent genetic liability and new, individual-specific, nonshared environmental experiences. Recognizing the prominence of impulsivity may be important for evaluating ADHD in adults, requiring strategies tailored to adult-specific symptom patterns.
Supplementary material
The supplementary material for this article can be found at https://doi.org/10.1017/S0954579426101989.
Data availability statement
The data used in this study are derived from the Colorado Longitudinal Twin Study and CATSLife and include participant information subject to ethical and consent-related restrictions. Data and analysis code may be available upon request, subject to applicable institutional and participant consent requirements.
Acknowledgments
We thank the individuals who participated in this research. We would like to thank the Colorado Longitudinal Study efforts, which is an ongoing project within the University of Colorado Boulder, managed by the Institute of Behavioral Genetics.
Funding statement
This project was supported by grants from the National Institutes of Health: T32 MH016880, R01 DA063061, R01 AG046938, and R01 MH063207
Competing interests
The authors declare that they have no competing interests.
Preregistration statement
This study was not preregistered. The present analyses were conducted using existing data from the Colorado Longitudinal Twin Study and CATSLife. Because these longitudinal data were collected prior to the development of the current research questions and analytic plan, no preregistration was completed for the present study.



 Open access

