1. INTRODUCTION
Much empirical research in economics and finance inevitably involves data snooping. The problem arises when several hypothesis tests are carried out simultaneously and one has to decide which hypotheses to reject. One common scenario is the comparison of many strategies (such as investment strategies) to a common benchmark (such as a market index); here, a particular hypothesis test specifies whether a particular strategy outperforms the benchmark or not. Another common scenario is multiple regression models; here, a particular hypothesis test specifies whether a particular regression coefficient is equal to a prespecified value or not.
Economists have long been aware of the dangers resulting from data snooping; see, for example, White (2000), Hansen (2005), Romano and Wolf (2005b), and the references therein. The standard approach to account for data snooping is to control (asymptotically) the familywise error rate (FWE), which is the probability of making one or more false rejections; see, for example, Westfall and Young (1993).1
We use the compact terminology of false rejection to denote the rejection of a true null hypothesis. Similarly, the terminology true rejection denotes the rejection of a false null hypothesis. A false rejection is sometimes termed a false discovery.
When the number of hypotheses is very large and the ability to make true rejections is a main concern, it has been suggested that the researcher relax control of the FWE. In this paper, we discuss and review three proposals to this end. The first proposal is to control the probability of making k or more false rejections, for some integer k greater than or equal to one, which is called the k-FWE.2
The 1-FWE is simply the usual FWE.
This paper reviews various methods that have been suggested for control of the three criteria previously mentioned, including some very recent multiple testing procedures that account for the dependence structure of the individual test statistics. Part of our contribution is to present the methods in a unified context, allowing an applied researcher to grasp the concepts quickly, rather than having to read and digest the numerous underlying original papers. We also demonstrate, by means of some simulations and two empirical applications, how competing multiple testing procedures compare when applied to data. A previous review paper discussing multiple testing methods is Dudoit, Shaffer, and Boldrick (2003). However, our paper emphasizes more recent methodology and focuses on applications in econometrics and finance rather than microarray experiments.
The remainder of the paper is organized as follows. Section 2 describes the model and the formal inference problem. Section 3 reviews various methods to control the FWE. Section 4 presents various methods to control the k-FWE. Section 5 reviews the method of Benjamini and Hochberg (1995) for control of the FDR. Section 6 presents various methods to control P{FDP > γ}. Section 7 discusses applications of generalized error rates to the problem of model selection. Section 8 sheds some light on finite-sample performance of the discussed methods via a simulation study. Section 9 provides two empirical applications. Finally, Section 10 concludes. An Appendix contains some details concerning bootstrap implementation.
2. NOTATION AND PROBLEM FORMULATION
One observes a data matrix xt,l with 1 ≤ t ≤ T and 1 ≤ l ≤ L. The data are generated from some underlying probability mechanism P, which is unknown. The row index t corresponds to distinct observations, and there are T of them. In our asymptotic framework, T will tend to infinity. The number of columns L is fixed. For compactness, we introduce the following notation: XT denotes the complete T × L data matrix, Xt,·(T) is the L × 1 vector that corresponds to the tth row of XT, and X·,l(T) is the T × 1 vector that corresponds to the lth column of XT.
Interest focuses on a parameter vector θ = θ(P) of dimension S, that is, θ = (θ1,…,θS)′. The individual hypotheses concern the elements of θ and can be all one-sided of the form

or they can be all two-sided of the form

For each hypothesis Hs, 1 ≤ s ≤ S, one computes a test statistic wT,s from the data matrix XT. In some instances, we will also consider studentized test statistics

, where the standard error

estimates the standard deviation of wT,s and is also computed from XT. In what follows, we often call wT,s a “basic” test statistic to distinguish it from the studentized statistic zT,s. We now introduce some compact notation: the S × 1 vector WT collects the individual basic test statistics wT,s; the S × 1 vector ZT collects the individual studentized test statistics zT,s.
A multiple testing method yields a decision concerning each individual testing problem by either rejecting Hs or not. In an ideal world, one would like to reject all those hypotheses that are false. In a realistic world, and given a finite amount of data, this cannot be achieved with certainty. At this point, we vaguely define our goal as making as many true rejections as possible while not making “too many” false rejections. Different notions of accounting for data snooping entertain different views of what constitutes too many false rejections.
We next describe two broad examples where data snooping arises naturally by putting them into the preceding framework.
Example 2.1 (Comparing several strategies to a common benchmark)
Consider S strategies (such as investment strategies) that are compared to a common benchmark (such as a market index). The data matrix XT has L = S + 1 columns: the first S columns record the individual strategies, and the last column records the benchmark. The goal is to decide which strategies outperform the benchmark. Here the individual parameters are defined so that θs ≤ 0 if and only if the sth strategy does not outperform the benchmark. One then is in the one-sided setup (1) with θ0,s = 0 for s = 1,…,S.
Example 2.1(a) (Absolute performance of investment strategies)
Historical returns of investment strategy s, such as a particular mutual fund or a particular trading strategy, are recorded in X·,s(T). Historical returns of a benchmark, such as a stock index or a buy-and-hold strategy, are recorded in X·,S+1(T). Depending on preference, these can be “real” returns or log returns; also, returns may be recorded in excess of the risk-free rate if desired. Let μs denote the population mean of the return for strategy s. Based on an absolute criterion, strategy s beats the benchmark if μs > μS+1. Therefore, we define θs = μs − μS+1. Using the notation

a natural basic test statistic is

Often, a studentized statistic is preferable and is given by

where

is an estimator of the standard deviation of xT,s − xT,S+1.
Example 2.1(b) (Relative performance of investment strategies)
The basic setup is as in the previous example, but now consider a risk-adjusted comparison of the investment strategies, based on the respective Sharpe ratios. With μs again denoting the mean of the return of strategy s and with σs denoting its standard deviation, the corresponding Sharpe ratio is defined as SRs = μs/σs.3
The definition of a Sharpe ratio is often based on returns in excess of the risk-free rate. But for certain applications, such as long-short investment strategies, it can be more suitable to base it on the nominal returns.

Then, a natural basic test statistic is

Again, a preferred statistic might be obtained by dividing by an estimate of the standard deviation of this difference.
Example 2.1(c) (CAPM alpha)
Historical returns of investment strategy s, in excess of the risk-free rate, are recorded in X·,s(T). Historical returns of a market proxy, in excess of the risk-free rate, are recorded in X·,S+1(T). For each strategy s, a simple time series regression

is estimated by ordinary least squares (OLS). If the capital asset pricing model (CAPM) holds, all intercepts αs are equal to zero.4
We trust that there is no possible confusion between a CAPM alpha αs and the level α of multiple testing methods.

Again, it can be advantageous to studentize.
Example 2.2 (Multiple regression)
Consider the multiple regression model

The data matrix XT has L = H + 1 columns: the first H columns record the explanatory variables, whereas the last column records the response variable, letting xH+1,t = yt. Of interest are S ≤ H of the regression coefficients. Without loss of generality, assume that the explanatory variables are ordered in such a way that the coefficients of interest correspond to the first S coefficients, and so θ = (θ1,…,θS)′. One typically is in the two-sided setup (2) where the prespecified values θ0,s depend on the context, but at times the one-sided setup (1) can be more appropriate.
In much applied research, all the regression coefficients are of interest—except possibly an intercept if it is included in the regression—and one would like to decide which of them are different from zero. This corresponds to the two-sided setup (2) where S = H—or S = H − 1 in the case of an included intercept whose coefficient is not of interest—and θ0,s = 0 for s = 1,…,S.
Let

denote an estimator of θ computed from the data matrix XT, using OLS or feasible generalized least squares (FGLS), say. Then the “basic” test statistic for Hs is simply

. The proper choice of the standard error

for studentization depends on the context. In the simplest case, it can be the usual OLS standard error. More generally, a standard error that is robust against heteroskedasticity and/or autocorrelation might be required; for example, see White (2001).
For testing an individual hypothesis Hs based on a studentized test statistic zT,s, one can typically compute an approximate p-value by invoking asymptotic standard normality. For example, for testing a two-sided hypothesis Hs : θs = θ0,s, one might compute

, where Φ(·) is the standard normal cumulative distribution function (cdf). Of course, one may also appeal to other techniques that rely on approximating the null distribution of |zT,s|, such as bootstrapping, subsampling, permutation tests, empirical likelihood, or Edgeworth approximations. In any case,

is a marginal p-value in the sense that the test that rejects Hs if

has asymptotic rejection probability α if Hs is true. It follows that if all S null hypotheses are true, and we reject Hs whenever

, the expected number of false rejections is S × α (asymptotically). For example, if S = 1,000 and α = 0.05, the expected number of false rejections is 50 (asymptotically) when all null hypotheses are true. Such an approach is too liberal and does not account for the multitude of tests under study. In the remainder of the paper, we consider various measures of error control that attempt to control false rejections by accounting for the fact that S tests are being carried out simultaneously.
3. METHODS CONTROLLING THE FWE
The usual approach to dealing with data snooping is to try to avoid any false rejections. That is, one seeks to control the FWE. The FWE is defined as the probability of rejecting at least one of the true null hypotheses. More specifically, if P is the true probability mechanism, let I0 = I0(P) ⊂ {1,…,S} denote the indices of the set of true hypotheses, that is,

The FWE is the probability under P that any Hs with s ∈ I0 is rejected:5
To show its dependence on P, we may write FWE = FWEP.

If all the individual null hypotheses are false, the FWE is equal to zero by definition.
Control of the FWE requires that, for any P, the FWE be no bigger than α, at least asymptotically. Because this must hold for any P, it must hold not just when all null hypotheses are true (which is called weak control) but also when some are true and some are false (which is called strong control). As remarked by Dudoit et al. (2003), this distinction is often ignored. The remainder of the paper equates control of the FWE with strong control and similarly for the control of the k-FWE and FDP discussed in later sections. A multiple testing method is said to control the FWE at level α if FWEP ≤ α for any sample size T and any P. A multiple testing method is said to control the FWE asymptotically at level α if lim supT→∞ FWEP ≤ α for any P. Methods that control the FWE in finite samples typically can only be derived in special circumstances; see Hochberg and Tamhane (1987) in the context of parametric models and Romano and Wolf (2005a) in the context of semiparametric models and permutation setups.
3.1. The Bonferroni Method
The most familiar multiple testing method for controlling the FWE is the Bonferroni method. For each null hypothesis Hs, one computes an individual p-value

. The Bonferroni method at level α rejects Hs if

and therefore is very simple to apply. Because all p-values are compared to a single critical value, the Bonferroni method is an example of a single-step procedure. The disadvantage of the Bonferroni method is that it is in general conservative, resulting in a loss of power.
The Bonferroni method controls the FWE if the distribution of each p-value corresponding to a true null hypothesis is stochastically dominated by the uniform (0, 1) distribution, that is,

The Bonferroni method asymptotically controls the FWE if the distribution of each p-value corresponding to a true null hypothesis is stochastically dominated by the uniform (0, 1) distribution asymptotically, that is,

3.2. The Holm Method
An improvement over Bonferroni is due to Holm (1979), and it works in a stepwise fashion as follows. The individual p-values are ordered from smallest to largest:

with their corresponding null hypotheses labeled accordingly: H(1),H(2),…,H(S). Then, H(s) is rejected at level α if

for j = 1,…,s. In comparison with the Bonferroni method, the criterion for the smallest p-value is equally strict, α/S, but it becomes less and less strict for the larger p-values. Hence, the Holm method will typically reject more hypotheses and is more powerful than the Bonferroni method. On the other hand, the Holm method (asymptotically) controls the FWE under exactly the same condition as the Bonferroni method.
The Holm method starts with examining the most significant hypothesis, corresponding to the smallest p-value, and then moves “down” to the less significant hypotheses. Such stepwise methods are called stepdown methods. Different in nature are stepup methods, which start by examining the least significant hypothesis, corresponding to the largest p-value, and then move “up” to the more significant hypotheses. An example is the stepwise method of Benjamini and Hochberg (1995); see Section 5.
Although its improvement over Bonferroni can be substantial, the Holm method can also be very conservative. The reason for the conservativeness of the Bonferroni and the Holm methods is that they do not take into account the dependence structure of the individual p-values. Loosely speaking, they achieve control of the FWE by assuming a worst-case dependence structure. If the true dependence structure could (asymptotically) be accounted for, one should be able to (asymptotically) control the FWE but at the same time increase power.6
By “power” we mean loosely speaking the ability to detect false hypotheses. Of course, several specific notions exist, such as the probability of rejecting at least one false hypothesis or the probability of rejecting all false hypotheses. In the remainder of the paper, we will mean by “power” the expected number of false hypotheses rejected, which is equivalent to the concept of average power.
3.3. The Bootstrap Reality Check and the StepM Method
White (2000), in the context of Example 2.1, proposes the bootstrap reality check (BRC). The BRC estimates the sampling distribution of max1≤s≤S(wT, s − θs), implicitly taking into account the dependence structure of the individual test statistics. Let smax denote the index of the strategy with the largest statistic wT, s. The BRC decides whether or not to reject Hsmax at level α, asymptotically controlling the FWE. It therefore addresses the question of whether the strategy that appears “best” in the observed data really beats the benchmark.7
Equivalently, it addresses the question of whether there are any strategies at all that beat the benchmark.
Hansen (2005) offers some improvements over the BRC. First, his method reduces the influence of “irrelevant” strategies, meaning strategies that “significantly” underperform the benchmark. Second, he proposes the use of studentized test statistics zT,s instead of basic test statistics wT,s. However, the method of Hansen (2005) also only addresses the question of whether the strategy that appears best in the observed data really beats the benchmark.
Romano and Wolf (2005b), also in the context of Example 2.1, address the problem of detecting as many outperforming strategies as possible. Often, this will be the relevant problem. For example, if a bank wants to invest money in trading strategies that outperform a benchmark, it is preferable to build a portfolio of several strategies rather than fully invest in the best strategy only. Hence, the goal is to identify the universe of all outperforming strategies for maximum diversification. The stepwise multiple testing (StepM) method of Romano and Wolf (2005b) improves upon the single-step BRC of White (2000) very much in the way that the stepwise Holm method improves upon the single-step Bonferroni method: in terms of being able to detect more outperforming strategies, one is afforded a free lunch. Like the Holm method, the StepM method is of the stepdown nature; that is, it starts by examining the most significant hypothesis. Although Romano and Wolf (2005b) develop their StepM method in the context of Example 2.1, it is straightforward to adapt it to the generic multiple testing problems (1) and (2). For details, see Section 4.3.3.
3.4. Use of the Bootstrap
The StepM method and its extensions discussed subsequently are based on the inversion of multiple confidence regions. This can be considered an “indirect” testing method. In the special case of testing a single hypothesis, it corresponds to constructing a confidence interval for the parameter under test and rejecting the null hypothesis if the null value is not contained in the interval. A “direct” testing method, on the other hand, rejects the null hypothesis if a test statistic exceeds a suitable critical value.
Because the StepM method is based on the bootstrap, the indirect testing approach has several advantages. First, in the independent and identically distributed (i.i.d.) case, one can simply resample from the observed data rather than from a distribution that obeys null hypothesis constraints. More generally, one can resample from an estimated model that mimics the underlying probability mechanism, without imposing any null constraints. Second, one can dispense with the technical condition of subset pivotality that is assumed in Westfall and Young (1993) but that is quite restrictive.
Resampling the data was previously suggested by Pollard and van der Laan (2003a) and then generalized by Dudoit, van der Laan, and Pollard (2004a). By recomputing the test statistics from the resampled data and subtracting the values of the original test statistics, they arrive at what they term the null-value shifted distribution of the test statistics. It turns out that this is actually equivalent to inverting bootstrap multiple confidence regions. A quite general theory of stepdown methods based on the bootstrap is given in Romano and Wolf (2005a) and is powerful enough to supply both finite-sample and asymptotic results.
A modification to the null-value shifted distribution of Pollard and van der Laan (2003b) and Dudoit et al. (2004a) is proposed by van der Laan and Hubbard (2005). Here, the marginal null distribution of any test statistic can be transformed from the bootstrap distribution to a known marginal null distribution, such as N(0,1) in the context of testing univariate means, while maintaining the multivariate dependence structure.
4. METHODS CONTROLLING THE k-FWE
By relaxing the strict FWE criterion one will be able to reject more false hypotheses. This section presents the alternative criterion of controlling the k-FWE. The k-FWE is defined as the probability of rejecting at least k of the true null hypotheses. As before, if P is the true probability mechanism, let I0 = I0(P) ⊂ {1,…,S} denote the indices of the set of true hypotheses. The k-FWE is the probability under P that any k or more of the Hs with s ∈ I0 are rejected:

In the case where at least S − k + 1 of the individual null hypotheses are false, the k-FWE is equal to zero by definition.
A multiple testing method is said to control the k-FWE at level α if k-FWEP ≤ α for any sample size T and for any P. A multiple testing method is said to control the FWE asymptotically at level α if lim supT→∞ k-FWEP ≤ α for any P. Methods that control the k-FWE in finite samples typically can only be derived in special circumstances; see Romano and Wolf (2007).
We now describe how the various methods of Section 3 can be generalized to achieve (asymptotic) control of the k-FWE. Of course, because our goal is to reject as many false hypotheses as possible, attention will focus on the generalization of the StepM method.
4.1. Generalization of the Bonferroni Method
The generalized Bonferroni method is due to Hommel and Hoffman (1988) and Lehmann and Romano (2005) and is based on the individual p-values. The method rejects Hs if

. It is easy to see that potentially many more hypotheses will be rejected compared to the original Bonferroni method. Indeed, the cutoff value for the individual p-values is k times as large.
If condition (8) holds, then this method controls the k-FWE. If condition (9) holds, then this method asymptotically controls the k-FWE.
4.2. Generalization of the Holm Method
The individual p-values are ordered from smallest to largest,

, with their corresponding null hypotheses labeled accordingly, H(1),H(2),…,H(S). Then H(s) is rejected at level α if

for j = 1,…,s, where
8The αj depend also on S and k, but this dependence is suppressed in the notation.

This modification is also due to Hommel and Hoffman (1988) and Lehmann and Romano (2005). It is easy to see that this stepwise method is more powerful than the single-step generalized Bonferroni method. On the other hand, the sufficient conditions for control and asymptotic control, respectively, of the k-FWE are identical.
4.3. Generalization of the StepM Method
We now describe how to generalize the StepM method of Romano and Wolf (2005b) to achieve asymptotic control of the k-FWE. We begin by discussing the one-sided setup (1) and then describe the necessary modifications for the two-sided setup (2).
4.3.1. Basic Method.
We detail the method in the context of using basic test statistics wT,s and discuss the extension to the studentized case later on. Begin by relabeling the strategies according to the size of the individual test statistics, from largest to smallest. Label r1 corresponds to the largest test statistic and label rS to the smallest one, so that wT,r1 ≥ wT,r2 ≥ ··· ≥ wT,rS.
Some further notation is required. Suppose that {ys : s ∈ K} is a collection of real numbers indexed by a finite set K having |K| elements. Then, for k ≤ |K|, k-maxs∈K( ys) is used to denote the kth largest value of the ys with s ∈ K. So, if the elements ys, s ∈ K, are ordered as

then

Further, for any K ⊂ {1,…,S}, define

that is, cK(1 − α,k,P) is the smallest 1 − α quantile of the sampling distribution under P of k-maxs∈K(wT, rs − θrs).
In the first step of the procedure, we construct a rectangular joint region9
This region could also be called a generalized confidence region in that we do not seek to contain all the parameters with probability 1 − α, but instead seek to contain all, except at most k − 1 of them, with probability 1 − α.

Individual decision are then carried out in the following manner: reject Hrs if θ0,rs ∉ [wT,rs − c1,∞), for s = 1,…,S. Equivalently, reject Hrs if wT,rs − θ0,rs > c1, for s = 1,…,S.
How should the value c1 in the construction of the joint region (11) be chosen? Let

denote the index set that corresponds to the relabeled true hypotheses, that is,

Ideally, one would take

, because this choice yields control of the k-FWE. To see why, assume without loss of generality that at least k hypotheses are true; otherwise, there is nothing to show. Then, with

,

Unfortunately, the ideal choice

is not available for two reasons. First, the set

is unknown. Second, the probability mechanism P is unknown. The solution to the first problem is to replace

by {1,…,S}. Because

, it follows that

, and so the k-FWE is still controlled. The solution to the second problem is to replace P by an estimate

, that is, to apply the bootstrap. The choice of

depends on context; see Appendix B of Romano and Wolf (2005b) for details. The cost of replacing P by

is that control of the k-FWE is weakened to asymptotic control of the k-FWE. Combining the two solutions yields the choice

. And then any hypothesis Hrs for which

is rejected.
By continuing after the first step, more hypotheses can be rejected. Romano and Wolf (2007) show that this increase in power does not come at the expense of sacrificing asymptotic control of the k-FWE. Denote by R1 the number of rejections in the first step. If R1 < k, stop, because it is plausible that all rejected hypotheses are true. On the other hand, by controlling the k-FWE, if R1 ≥ k, we can be confident that some of the rejected hypotheses are false. This knowledge will now lead to smaller joint regions in subsequent steps and hence to potentially further rejections, without sacrificing control of the k-FWE. So if R1 ≥ k, continue with the second step and construct a rectangular joint region for the vector (θrR1+1,…,θrS)′ of the form

Individual decisions are carried out analogously to before: reject Hrs if θ0,rs ∉ [wT,rs − c2,∞), for s = R1 + 1,…,S.
How should the value c2 in the joint region construction (12) be chosen? Again, the ideal choice

is not available because

and P are unknown. Crucially, instead of replacing

by {1,…,S}, we can use information from the first step to arrive at a smaller value. Namely, if P were known, this value would be given by

which is the maximum of a set of

quantiles. The index set of any given quantile corresponds to all the hypotheses not rejected plus k − 1 out of the R1 hypotheses that were rejected in the first step, and then one takes the largest such quantile for c2. The intuition here is as follows. To ensure control of the k-FWE in the second step, c2 must satisfy

. Assuming that k-FWE control was achieved in the first step, it is conceivable that up to k − 1 true hypotheses have been rejected so far. But, of course, we cannot know which of the rejected hypotheses might be true. So, to play it safe, one must look at all possible combinations of k − 1 rejected hypotheses, always together with the not rejected hypotheses, and then take the largest of the resulting quantiles. Again, P is unknown, and so c2 is not available in practice. Replacing P by

yields the estimate

If no further hypotheses are rejected in the second step, stop. Otherwise, continue in this stepwise fashion until no more rejections occur. The following algorithm summarizes the procedure.
ALGORITHM 4.1 (Basic k-StepM method for one-sided setup).
1. Relabel the strategies in descending order of the test statistics wT,s: strategy r1 corresponds to the largest test statistic and strategy rS to the smallest.
2. For 1 ≤ s ≤ S, if

, reject the null hypothesis Hrs. Here

3. Denote by R1 the number of hypotheses rejected. If R1 < k, stop; otherwise let j = 2.
4. For Rj−1 + 1 ≤ s ≤ S, if

, reject the null hypothesis Hrs. Here

5.
(a) If no further hypotheses are rejected, stop.
(b) Otherwise, denote by Rj the number of all hypotheses rejected so far and, afterward, let j = j + 1. Then return to step 4.
The computation of the constants

via the bootstrap is detailed in Algorithm A.1 in the Appendix. Let JT(P) denote the sampling distribution under P of

and let

denote the sampling distribution under

of

. Here,

is an estimate of θ based on

.
10Usually, one can take

.
Assumption 4.1. Let P denote the true probability mechanism and let

denote an estimate of P based on the data XT. Assume that JT(P) converges in distribution to a limit distribution J(P), which is continuous. Further assume that

consistently estimates this limit distribution:

in probability for any metric ρ metrizing weak convergence.
We now describe how the basic StepM method is modified for the two-sided setup (2). The crux is that the multivariate rectangular joint regions are now the Cartesian products of two-sided intervals rather than one-sided intervals.
To this end, for any K ⊂ {1,…,S}, define

That is, cK,|·|(1 − α,k,P) is the smallest 1 − α quantile of the two-sided sampling distribution under P of k-maxs∈K|wT, rs − θrs|.
The following algorithm describes the stepwise method in the two-sided setup.
ALGORITHM 4.2 (Basic k-StepM method for two-sided setup).
1. Relabel the strategies in descending order of the absolute test statistics |wT,s|: strategy r1 corresponds to the largest absolute test statistic and strategy rS to the smallest.
2. For 1 ≤ s ≤ S, if

, reject the null hypothesis Hrs. Here

3. Denote by R1 the number of hypotheses rejected. If R1 < k, stop; otherwise let j = 2.
4. For Rj−1 + 1 ≤ s ≤ S, if

, reject the null hypothesis Hrs. Here

5.
(a) If no further hypotheses are rejected, stop.
(b) Otherwise, denote by Rj the number of all hypotheses rejected so far and, afterward, let j = j + 1. Then return to step 4.
The computation of the constants

via the bootstrap is detailed in Algorithm A.2 in the Appendix. A sufficient condition for the basic k-StepM method to asymptotically control the k-FWE in the two-sided setup is also given by Assumption 4.1.
4.3.2. Studentized Method.
We now describe how to modify the k-StepM method when studentized test statistics are used instead. Ample motivation for the desirability of studentization in the context of FWE control is provided by Hansen (2005) and Romano and Wolf (2005b). Their reasons carry over to k-FWE control.
Again, begin with the one-sided setup (1). Analogously to (10), define

Our stepwise method is then summarized by the following algorithm.
ALGORITHM 4.3 (Studentized k-StepM method for one-sided setup).
1. Relabel the strategies in descending order of the studentized test statistics zT,s: strategy r1 corresponds to the largest test statistic and strategy rS to the smallest.
2. For 1 ≤ s ≤ S, if

, reject the null hypothesis Hrs. Here

3. Denote by R1 the number of hypotheses rejected. If R1 < k, stop; otherwise let j = 2.
4. For Rj−1 + 1 ≤ s ≤ S, if

, reject the null hypothesis Hrs. Here

5.
(a) If no further hypotheses are rejected, stop.
(b) Otherwise, denote by Rj the number of all hypotheses rejected so far and, afterward, let j = j + 1. Then return to step 4.
The computation of the constants

via the bootstrap is detailed in Algorithm A.3 in the Appendix.
The modification to the two-sided setup (2) is now quite obvious. Analogously to (16), define

The algorithm can then be summarized as follows.
ALGORITHM 4.4. (Studentized k-StepM method for two-sided setup).
1. Relabel the strategies in descending order of the absolute studentized test statistics |zT,s|: strategy r1 corresponds to the largest absolute studentized test statistic and strategy rS to the smallest.
2. For 1 ≤ s ≤ S, if

, reject the null hypothesis Hrs. Here

3. Denote by R1 the number of hypotheses rejected. If R1 < k, stop; otherwise let j = 2.
4. For Rj−1 + 1 ≤ s ≤ S, if

, reject the null hypothesis Hrs. Here

5.
(a) If no further hypotheses are rejected, stop.
(b) Otherwise, denote by Rj the number of all hypotheses rejected so far and, afterward, let j = j + 1. Then return to step 4.
The computation of the constants

via the bootstrap is detailed in Algorithm A.4 in the Appendix.
A slightly stronger version of Assumption 4.1 is needed to prove the validity of the studentized method. Again, let XT* denote a data matrix generated from probability mechanism

. The basic test statistics computed from XT* are denoted by wT,s*. Their corresponding standard errors, also computed from XT*, are denoted by

. Romano and Wolf (2007) do not explicitly discuss the case of studentized statistics. However, it is straightforward to show that a sufficient condition for the studentized k-StepM method to control the k-FWE asymptotically, both in the one-sided and the two-sided setup, is the following.
Assumption 4.2. In addition to Assumption 4.1, assume the following condition. For each 1 ≤ s ≤ S, both

and

converge to a (common) positive constant σs = σs(P) in probability under P.
Remark 4.1 (Operative method). The computation of the constants

,

,

, and

in (13), (15), (17), and (19), respectively, may be very expensive if

is large. In such cases, we suggest the following shortcut. Pick a user-defined number Nmax, say, Nmax = 50, and let N* be the largest integer for which

. The constant

, say, is then computed as

and similarly for the constants

,

, and

. That is, we maximize over subsets I not necessarily of the entire index set of previously rejected hypotheses but only of the index set corresponding to the N* least significant hypotheses rejected so far. Note that this shortcut does not affect the asymptotic control of the k-FWE even if Nmax = 1 is chosen, resulting in N* = k − 1 and

Nevertheless, in the interest of better k-FWE control in finite samples, we suggest choosing Nmax as large as possible, subject to computational feasibility.
Remark 4.2. All methods presented in this section can be modified in the following sense while still preserving (asymptotic) control of the k-FWE: reject the k − 1 most significant hypotheses no matter what. This means sort the hypotheses in the order of either ascending p-values or descending test statistics to get Hr1,…,HrS; then reject Hr1,…,Hrk−1 irrespective of the data. Let R denote the number of rejections made by the multiple testing method (before modification). If R < k, then the modified method will reject k − 1 hypotheses, which is a potentially greater number. If R ≥ k, then the modified method will reject R hypotheses, that is, the same number. However, it is counterintuitive to reject hypotheses irrespective of the data, and certainly we would also impose the minimal requirement to not reject any hypothesis when the corresponding marginal p-value exceeds α.
Remark 4.3. The use of the k-max statistic was already suggested by Dudoit et al. (2004a) in the construction of a single-step procedure. Our methods here can be seen as stepdown improvements over such single-step procedures.
4.3.3. The StepM Method.
Naturally, the StepM method of Romano and Wolf (2005b) can be considered a special case of the k-StepM method by choosing k = 1. However, it should be pointed out that the computations are much simplified compared to the case k > 1. The reason is that if some hypotheses are rejected in the first step of the StepM method, then for the computation of the values

and

, j = 2,3,…, one may assume that all hypotheses rejected so far are false.
11If a true hypothesis has been rejected so far, then the FWE criterion has already been violated, and, therefore, the rejection of further true hypotheses will not do any additional harm.

estimated quantiles but rather only a single estimated quantile.
The following algorithm is the simplified version of Algorithm 4.1 for the special case k = 1. The simplified versions of Algorithms 4.2–4.4 are analogous.
ALGORITHM 4.5 (Basic StepM method for one-sided setup).
1. Relabel the strategies in descending order of the test statistics wT,s: strategy r1 corresponds to the largest test statistic and strategy rS to the smallest.
2. For 1 ≤ s ≤ S, if

, reject the null hypothesis Hrs. Here

3. Denote by R1 the number of hypotheses rejected. If R1 = 0, stop; otherwise let j = 2.
4. For Rj−1 + 1 ≤ s ≤ S, if

, reject the null hypothesis Hrs. Here

5.
(a) If no further hypotheses are rejected, stop.
(b) Otherwise, denote by Rj the number of all hypotheses rejected so far and, afterward, let j = j + 1. Then return to step 4.
4.4. Further Methods
An alternative approach to control the k-FWE is proposed by van der Laan, Dudoit, and Pollard (2004). It begins with an initial procedure that controls the 1-FWE (i.e., the usual FWE) and then rejects in addition the k − 1 most significant hypotheses not rejected so far. They term this an augmentation procedure, because the 1-FWE rejection set is augmented by the k − 1 next most significant hypotheses to arrive at the k-FWER rejection set. However, this procedure is generally less powerful than the k-StepM method we propose, because it does not take full advantage of the generalized error measure as it relies too heavily on FWE control; for some simulation evidence see Romano and Wolf (2007).
5. METHODS CONTROLLING THE FDR
In many applications, one might be willing to tolerate a larger number of false rejections if there are a larger number of total rejections. In other words, one might be willing to tolerate a certain (small) proportion of false rejections out of the total rejections. This suggests basing error control on the false discovery proportion (FDP). Let F be the number of false rejections made by a multiple testing method and let R be the total number of rejections. Then the FDP is defined as follows:

Benjamini and Hochberg (1995) propose controlling EP(FDP), the expected value under P of the FDP, which they termed the false discovery rate (FDR). A multiple testing method is said to control the FDR at level γ if FDRP = EP(FDP) ≤ γ for any sample size T and for any P. A multiple testing method is said to control the FDR asymptotically at level γ if lim supT→∞ FDRP ≤ γ for any P. Methods that control the FDR in finite samples typically can only be derived in special circumstances.
The stepwise method of Benjamini and Hochberg (1995) is based on individual p-values. The p-values are ordered from smallest to largest,

, with their corresponding null hypotheses labeled accordingly, H(1),H(2),…,H(S). Then define

and reject H(1),…,H(j*). If no such j exists, reject no hypotheses. This is an example of a stepup method. It starts with examining the least significant hypothesis, H(S), and then moves “up” to the more significant hypotheses if

.
Benjamini and Hochberg (1995) prove that their method controls the FDR if condition (8) holds and, in addition, the p-values are mutually independent. Benjamini and Yekutieli (2001) show that independence can be replaced by a more general “positive regression dependency”; see their paper for the exact definition. As a result, it can be proved that, under the dependence condition of Benjamini and Yekutieli (2001), the method of Benjamini and Hochberg (1995) asymptotically controls the FDR if condition (9) holds. On the other hand, (asymptotic) control of the Benjamini and Hochberg (1995) method under an arbitrary dependence structure of the p-values does not hold in general. Benjamini and Yekutieli (2001) show that this more general control can be achieved if the constants γj in (20) are replaced by

Note that CS ≈ log(S) + 0.5 and so this method can have much less power than the original Benjamini and Hochberg (1995) method. For example, when S = 1,000, then CS = 7.49.
Even when the sufficient condition of Benjamini and Yekutieli (2001) holds, which includes independence as a special case, the method of Benjamini and Hochberg (1995) is conservative in the following sense. Let S0 denote the number of true null hypotheses, that is, S0 = |I(P0)|. Then it can be shown that FDRP ≤ (S0/S)α. So unless S0 = S, power could be improved by replacing the critical constants γj in (20) by

Of course, S0 is unknown in practice. But there exist several approaches in the literature for estimating S0. For example, Storey (2002) suggests the following estimator:

where λ ∈ (0,1) is a user-specified parameter. The reasoning behind this estimator is as follows. As long as each test has reasonable power, then most of the large p-values should correspond to true null hypotheses. Therefore, one would expect about S0(1 − λ) of the p-values to lie in the interval (λ,1], assuming that the p-values corresponding to the true null hypotheses have approximately a uniform [0,1] distribution. Having estimated S0, one then applies the Benjamini and Hochberg (1995) procedure with the critical constants γj in (20) replaced by

Storey, Taylor, and Siegmund (2004) study the validity of this “power-improved” FDR procedure when the estimator of S0 is given by (21). They prove strong control under a weak dependence condition on the individual p-values. This condition includes independence, dependence within blocks, and mixing-type situations. It is, however, stronger than the dependence condition of Benjamini and Yekutieli (2001); for example, it does not allow for a constant correlation across all p-values. Related work is given in Genovese and Wasserman (2004). For another approach to estimating S0, see Benjamini and Hochberg (2000); however, they do not prove asymptotic strong control of the resulting power-improved FDR procedure.
Finally, there exists a feature with this particular generalized error rate that is often ignored. The FDR is the mean of the FDP, that is, a central tendency of the sampling distribution of the FDP. Therefore, even if the FDR is controlled at level γ, in a given application, the realized FDP could be quite far away from γ. How likely this is depends on the sampling variability of the FDP, which is unknown in practice.12
Obviously, some very crude bounds could be obtained using Markov's inequality or variants thereof.
Remark 5.1 (Positive false discovery rate). The false discovery rate can be rewritten as

In words, it can be expressed as the expectation of the ratio F/R conditional on the fact that there is at least one rejection times the probability of at least one rejection. As an alternative, Storey (2002, 2003) suggests replacement of the FDR by only the first factor in this product, which he terms the positive false discovery rate (pFDP):

The pFDR enjoys a number of attractive properties. For example, when the test statistics come from a random mixture of the null distribution and the alternative distribution, the pFDR can be expressed as a simple Bayesian posterior probability. Also, it has a natural connection to classification theory. However, it is not possible to control the pFDR strongly, that is, to achieve (even asymptotically) pFDRP ≤ α for all P. The reason is that pFDRP = 1 for all P such that all null hypotheses are true. An application of the pFDR criterion instead involves estimating pFDRP for the P at hand, say, with the end of improving multiple testing procedures; see Storey (2002). We will not focus further on this alternative error rate in the remainder of the paper.
6. METHODS CONTROLLING THE FDP
Often, one would like to be able to make a statement concerning the realized FDP in a given application. Concretely, one would like to control the FDP in the sense that P{FDP > γ} ≤ α where γ ∈ [0,1) is a user-defined number. Typical values are γ = 0.05 and γ = 0.1; the choice γ = 0 corresponds to control of the FWE.
A multiple testing method is said to control the FDP at level α if P{FDP > γ} ≤ α for any sample size T and for any P. A multiple testing method is said to control the FDP asymptotically at level α if lim supT→∞ P{FDP > γ} ≤ α for any P. Methods that control the FDP in finite samples typically can only be derived in special circumstances.
We now describe how some of the methods of Section 3 can be generalized to achieve (asymptotic) control of the FDP. Of course, because our goal is to reject as many false hypotheses as possible, in the end we shall recommend the generalization of the StepM method.
6.1. Generalization of the Holm Method
Lehmann and Romano (2005) develop a stepdown method based on individual p-values. The p-values are ordered from smallest to largest,

, with their corresponding null hypotheses labeled accordingly, H(1),H(2),…,H(S). Then H(s) is rejected at level α if

for j = 1,…,s, where

Here, for a real number x, [lfloor ]x[rfloor ] denotes the greatest integer that is smaller than or equal to x.
It can be proved that this method provides asymptotic control of the FDP if condition (9) holds. Moreover, this method provides finite-sample control of the FDP if condition (8) holds and the p-values are independent, or at least positively dependent in a certain sense; see Lehmann and Romano (2005). Lehmann and Romano (2005) also show that if one modifies this method by replacing αj by

then the resulting stepdown procedure controls the FDP under no dependence assumptions on the p-values. This method has since been improved by Romano and Shaikh (2006a) in that the constant C[lfloor ]γS[rfloor ]+1 has been replaced by a smaller one, while still maintaining finite-sample control under assumption (8) and asymptotic control under assumption (9). A similar stepup procedure is derived in Romano and Shaikh (2006b).
6.2. Generalization of the StepM Method
The crux of our procedure is to sequentially apply the k-StepM method, employing k = 1,2,3,…, until a stopping rule indicates termination. The appropriate variant of the k-StepM method is dictated by the nature of the multiple testing problem, one-sided versus two-sided, and the choice of test statistics, basic versus studentized. For example, the one-sided setup (1) in combination with studentized test statistics calls for Algorithm 4.3.
To develop the idea, consider controlling P{FDP > 0.1}. We start out by applying the 1-StepM method, that is, by controlling the FWE. Denote by N1 the number of hypotheses rejected. Because of the FWE control, one can be confident that no false rejection has occurred and that, in return, the FDP has been controlled. Consider now rejecting H(N1+1), the next most significant hypothesis. Of course, if H(N1+1) is false, there is nothing to worry about, and so suppose that H(N1+1) is true. Assuming FWE control in the first step, the FDP upon rejection of H(N1+1) then becomes 1/(N1 + 1), which is greater than 0.1 if and only if N1 < 9. So if N1 ≥ 9 we can reject one true hypothesis and still avoid FDP > 0.1. This suggests stopping if N1 < 9 and otherwise applying the 2-StepM method, which, by design, should not reject more than one true hypothesis. Denote the total number of hypotheses rejected by the 2-StepM method by N2. Reasoning similarly to before, if N2 < 19, we stop, and otherwise we apply the 3-StepM method. This procedure is continued until Nj < 10j − 1 at some point.
The following algorithm describes the method for arbitrary γ.
ALGORITHM 6.1 (FDP-StepM method).
1. Let j = 1 and let k1 = 1.
2. Apply the kj-StepM method and denote by Nj the number of hypotheses rejected.
3.
(a) If Nj < kj/γ − 1, stop.
(b) Otherwise, let j = j + 1 and, afterward, let kj = kj−1 + 1. Then return to step 2.
Romano and Wolf (2007) show that a sufficient condition for the FDP-StepM method to provide asymptotic control of the FDP is Assumption 4.1 in the case where the underlying k-StepM method uses basic test statistics. Similarly, it can be proved that a sufficient condition for the FDP-StepM method to provide asymptotic control of the FDP is Assumption 4.2 in the case where the underlying k-StepM method uses studentized test statistics.
6.3. Further Methods
An alternative approach to controlling the FDP is proposed by van der Laan et al. (2004) and Dudoit, van der Laan, and Pollard (2004b). It begins with an initial procedure that controls the 1-FWE (i.e., the usual FWE). Let R denote the number of rejections by the 1-FWE procedure. Then the proposal rejects in addition the D next most significant hypotheses where D is the largest integer that satisfies

This is also an augmentation procedure because the 1-FWE rejection set is suitably augmented by the next most significant hypotheses to arrive at the FDP rejection set. However, this procedure is generally less powerful than the FDP-StepM method we propose; for some simulation evidence see Romano and Wolf (2007). A further new method based on an empirical Bayes approach is given in van der Laan, Birkner, and Hubbard (2005).
6.4. Controlling the Median FDP
As an alternative to controlling the FDR, which is the expected value of the FDP, we propose controlling the median of the FDP. Obviously, if one achieves P{FDP > γ} ≤ 0.5, then the median FDP is bounded above by γ. So choosing α = 0.5 for the methods in this section asymptotically controls the median FDP under an arbitrary dependence structure of the p-values (or test statistics).
Although, in this sense, controlling the median FDP is more generally valid than controlling the FDR by the method of Benjamini and Hochberg (1995), it should be pointed out that it is a less stringent measure and, therefore, potentially less useful in applications.
First, if all hypotheses are true, controlling the FDR also controls the FWE in the sense that FWEP ≤ γ. On the other hand, assuming that γ > 0, controlling the median FDP only achieves FWEP ≤ 0.5.
Second, if the FDR is controlled at level γ = 0.1, say, then the sampling distribution of the FDP must necessarily be quite concentrated around 0.1, given the lower bound of zero for the FDP. In particular, there cannot be a lot of mass at values very much greater than 0.1. On the other hand, control of the median FDP is achieved as long as there is at least probability mass 0.5 below 0.1 for the sampling distribution of the FDP. In particular, this allows for a lot of mass at values very much greater than 0.1 (in principle, up to mass 0.5 at the point 1). As a result, the chance of the realized FDP greatly exceeding 0.1 can be much bigger when controlling the median FDP compared to controlling the FDR. We will examine this issue to some extent in Section 8.
7. APPLICATIONS TO MODEL SELECTION
This section briefly discusses how control of generalized error rates can apply to the problem of model selection. In fact, the term model selection is rather vague and can mean different things depending on context. Therefore, we consider various notions.
White (2000) studies the problem of comparing a large number of (forecast) models to a common (forecast) benchmark. In this context, model selection is the challenge of deciding which models are superior to the benchmark. Therefore, in this context, model selection becomes a special case of Example 2.1 by interpreting (forecast) models as strategies. White (2000) proposes control of the FWE, but when the number of strategies is very large this criterion can be too strict and a generalized error rate may be more appropriate. Some empirical applications based on the FWE when the number of strategies is very large are as follows. Sullivan, Timmermann, and White (1999), White (2000), and Sullivan, White, and Golomb (2001) all fail to find any outperforming strategies when comparing a large number, S, of trading strategies against the benchmark of “buy and hold.” The numbers of trading strategies considered are S = 7,846, S = 3,654, and S = 9,452, respectively. Hansen (2005) fails to find any outperforming strategies when comparing S = 3,304 strategies to forecast inflation against the benchmark of “last period's inflation.” On the other hand, when he restricts attention to a smaller universe of S = 352 strategies, some outperformers are detected. It appears that when the number of strategies is in the thousands, controlling the FWE becomes too stringent.
The task of constructing an optimal forecast provides another notion. Imagine that several forecasting strategies are available to forecast a quantity of interest. As described in Timmermann (2006, Sect. 6): (i) choosing the lone strategy with the best track record is often a bad idea; (ii) simple forecasting schemes, such as equal-weighting various strategies, are hard to beat; and (iii) trimming off the worst strategies is often required. In this context, model selection is the challenge of identifying the worst strategies. A sensible approach is as follows. First, one labels those strategies as the worst strategies that underperform a suitable benchmark.13
For example, when forecasting inflation, a suitable, simple-minded benchmark might be last period's inflation.
In many empirical applications, a large-dimensional regression model is estimated, and the question becomes which explanatory variables are the important ones. In this context, model selection is the challenge of identifying the nonzero regression coefficients; see Example 2.2. An unfortunate common practice is identification based on individual p-values, ignoring the multiple testing problem altogether.14
For example, it is common to provide tables where the important explanatory variables are identified via asterisks; one asterisk if significant at level 10%, two asterisks if significant at level 5%, and three asterisks if significant at level 1%, where the levels are for individual tests always.
Related to the model selection notion of the previous paragraph, though more complex, is the problem of determining which explanatory variables to keep in a final model, say, for prediction purposes. This problem is commonly known as “subset selection,” and many popular techniques exist, such as pretesting methods, stepwise selection (forward or backward), the application of information criteria such as the Akaike information criterion (AIC) or the Bayesian information criterion (BIC), and principal components regression. See Draper and Smith (1998) and Hastie, Tibshirani, and Friedman (2001) for details. An explicit use of tests of multivariate parameters as a means of consistent variable selection can be found in Pötscher (1983) and Bauer, Pötscher, and Hackl (1988). Another popular technique for subset selection is general-to-specific modeling; see Campos, Ericsson, and Hendry (2005) for an introduction. As a part of the procedure, individual variables are kept in the model based on so-called simplification tests where individual p-values are compared to a (common) significance level α. The choice of this level appears as much of an art as a science. For example, Krolzig and Hendry (2001) discuss how it is advantageous to choose a small level α when there are many irrelevant explanatory variables. However, they do not address the question of how one is to know whether this is the case in practice. The optimal level α for the individual tests depends not only on the number of explanatory variables, which is known, but also on the number of them that are irrelevant and the dependence structure of the regression coefficient estimates, both of which are unknown. Therefore, a viable alternative may be to consider the simplification tests as a multiple testing problem in conjunction with a generalized error rate such as controlling the (median) FDP. Such an approach can implicitly account both for the number of irrelevant variables and the dependence structure of the regression coefficient estimates.
Jensen and Cohen (2000) discuss multiple comparisons in induction algorithms. In this context, model selection is the challenge of deciding which variables to include in an artificial intelligence (AI) model for prediction and classification purposes. They describe how a procedure ignoring the multiple testing problem leads to undesirable effects such as overfitting, that is, the inclusion of too many variables in the model. Control of a generalized error rate may therefore be desirable. Moreover, Jensen and Cohen (2000) show in some simulations that multiple testing procedures that do not account for the dependence structure of the test statistics, such as Bonferroni, can work well when the dependence structure is absent or weak but work poorly when the dependence structure is noticeable. Hence, it is desirable to employ a procedure that accounts for the dependence structure.
Abramovich and Benjamini (1996) and Abramovich, Benjamini, Donoho, and Johnstone (2005) study the problem of recovering an S-dimensional vector observed in white noise, where S is large and the vector is known to be sparse. Abramovich et al. (2005) discuss various definitions of sparseness, the most intuitive being the proportion of the nonzero entries of the vector. In this context, model selection is the challenge of deciding which entries are nonzero to optimally estimate the vector.15
Here optimality is defined in an asymptotic minimax sense; see Abramovich et al. (2005) for details.
For instance, they assume that the sparsity tends to zero, and so the limiting model for the vector is that of a “black object” (where all entries are equal to zero).
Recently, Buena, Wegkamp, and Auguste (2006) show how testing using FDR control can be used to produce consistent variable selection even in high-dimensional models. Of course, other measures of error control can similarly be exploited.
We also mention a notion of model selection that does not fit into our framework. Again, imagine that several forecasting strategies are available to forecast a quantity of interest. Now, the question is which of those strategies is the “best.” In this context, model selection is the challenge of identifying the best model out of a universe of candidate models. Needless to say, given a finite amount of data, the best model cannot determined with certainty. Therefore, the suggested solution consists of constructing a model confidence set, that is, a data-dependent collection of models that will contain the best model with a prespecified probability, at least asymptotically. For related work see Shimodaira (1998), Hansen, Lunde, and Nason (2003), Hansen, Lunde, and Nason (2005), and the references therein.
Although the preceding discussion reveals that multiple hypothesis testing methods may be useful in the model building process, the problem of inference for parameters of a data-based model is crucial and challenging. For recent entries to the literature on inference after model selection, see Shen, Huang, and Ye (2004) and Kabaila and Leeb (2006) and the references in these works.
8. SIMULATION STUDY
This section presents a small simulation study in the context of testing population means. We generate independent random vectors X1,…,XT from an S-dimensional multivariate normal distribution with mean vector θ = (θ1,…,θS)′, where T = 100 and S = 500. The null hypotheses are Hs : θs ≤ 0 and the alternative hypotheses are Hs : θs > 0, and so we are in the one-sided setup (1). The studentized test statistics are

, where

The individual means θs are equal to either 0 or 0.25. The number of means equal to 0.25 is 0, 100, 200, or 400. The covariance matrix is of the common correlation structure: σs,s = 1 and σs,j = ρ for s ≠ j. We consider the values ρ = 0 and ρ = 0.5. Other specifications of the covariance matrix do not lead to results that are qualitatively different; see Romano and Wolf (2007).
We include the following multiple testing procedures in the study. The value of k is k = 10. The nominal level is α = 0.05, unless indicated otherwise.
- (StepM) The studentized StepM construction of Romano and Wolf (2005b).
- (k-gH) The k-FWE generalized Holm procedure described in Section 4.2, where the individual p-values are derived from zT,s ∼ tT−1 under θs = 0.
- (k-StepM) The studentized k-StepM construction described in Section 4.3. This procedure is based on the operative method with Nmax = 50; see Remark 4.1.
- (FDP-LR0.1) The FDP procedure of Lehmann and Romano (2005) with γ = 0.1 described in Section 6.1.
- (FDP-StepM0.1) The studentized FDP-StepM construction described in Section 6.2 with γ = 0.1.
- (FDP-StepM0.1Med) The studentized FDP-StepM construction described in Section 6.2 with γ = 0.1 but nominal level α = 0.5. Therefore, this procedure asymptotically controls the median FDP to be bounded above by γ = 0.1.
- (FDR-BH0.1) The FDR construction of Benjamini and Hochberg (1995) described in Section 5 with γ = 0.1.
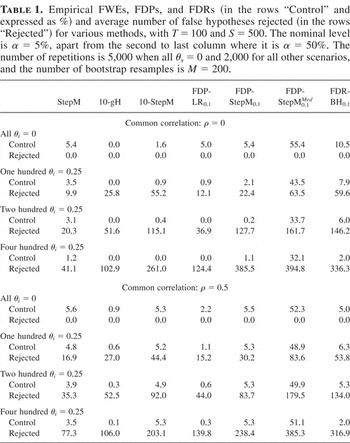
The performance criteria are (i) the empirical k-FWEs and FDPs, compared to the nominal level α = 0.05 (or α = 0.5 for the method controlling the median FDP), and the empirical FDRs and (ii) the average number of false hypotheses rejected. The results are presented in Table 1. They can be summarized as follows.
- All methods provide satisfactory finite-sample control of their respective k-FWE, FDP, or FDR criteria.
- By controlling a generalized error rate, the power is often much improved compared to FWE control.
- The methods that implicitly account for the dependence structure of the test statistics are more powerful than the worst case methods based on individual p-values: 10-StepM is more powerful than 10-gH and FDP-StepM0.1 is more powerful than FDP-LR0.1.
- The methods controlling a central tendency of the FDP are more powerful than the methods controlling P{FDP > 0.1}: FDP-StepM0.1Med and FDR-BH0.1 are more powerful than FDP-LR0.1 and FDP-StepM0.1.
Empirical FWEs, FDPs, and FDRs (in the rows “Control” and expressed as %) and average number of false hypotheses rejected (in the rows “Rejected”) for various methods, with T = 100 and S = 500. The nominal level is α = 5%, apart from the second to last column where it is α = 50%. The number of repetitions is 5,000 when all θs = 0 and 2,000 for all other scenarios, and the number of bootstrap resamples is M = 200.

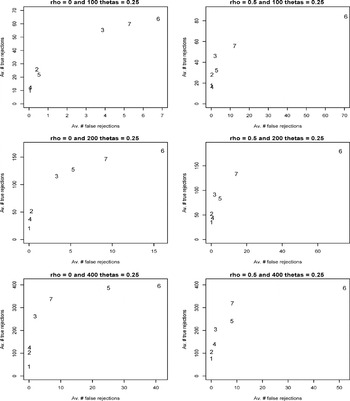
By design, the increase in power that one is afforded by controlling a generalized error rate comes at the expense of relaxing the strict FWE criterion. As a result, the expected number of false rejections typically also increases. This relationship is depicted in Figure 1, where for various scenarios the average number of true rejections is plotted against the average number of false rejections. In these scatter plots, each method is represented by number, where the numbers correspond to the order of the methods in Table 1. Not surprisingly, the relationship is generally increasing and concave with StepM being in the lower left corner and FDP-StepM0.1Med being in the upper right corner.

Scatter plots of average number of true rejections against average number of false rejections for various scenarios. The numbers correspond to the order of the methods in Table 1. That is, 1 corresponds to StepM, 2 corresponds to 10-gH,…, and 7 corresponds to FDR-BH0.1.
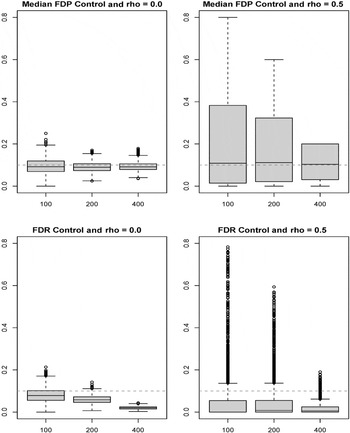
Recall the discussion of Section 6.4 where some virtues of controlling the FDR versus controlling the median FDP were mentioned. To examine this issue, we look at the sampling distribution of the FDP when the median FDP and the FDR are controlled. Figure 2 summarizes the distribution of the realized FDPs for various scenarios via box plots. It can be seen that, although median FDP control and FDR control are achieved, the variation of the sampling distributions is considerable, especially for the case of common correlation ρ = 0.5. As a result, the realized FDP may well be quite above γ = 0.1. This feature is more pronounced for control of the median FDP, especially when ρ = 0.5.

Box plots of realized FDPs for various scenarios. The upper part is for control of the median FDP, and the lower part is for control of the FDR. The labels on the x-axis—100, 200, and 400—denote the number of false hypotheses. The horizontal dashed line indicates γ = 0.1.
9. EMPIRICAL APPLICATIONS
9.1. Hedge Fund Evaluation
The data set we consider is similar to one in Romano and Wolf (2005b). The difference is that we focus on a shorter time horizon, thereby increasing the number of funds under study. Our universe consists of all hedge funds in the Center for International Securities and Derivatives Markets (CISDM) database that have a complete return history from 01/1994 until 12/2003.
All returns are net of management and incentive fees, and so they are the returns obtained by the investors. As in Romano and Wolf (2005b), we benchmark the funds against the risk-free rate,
17The risk-free rate is a simple and widely accepted benchmark. But, of course, our methods also apply to alternative benchmarks such as hedge fund indices or multifactor hedge fund benchmarks; for example, see Kosowski, Naik, and Teo (2005).

used in this algorithm is a VAR(1) model in conjunction with bootstrapping the residuals.
18To account for leftover dependence not captured by the VAR(1) model, we use the stationary bootstrap with average block size b = 5 for bootstrapping the residuals.
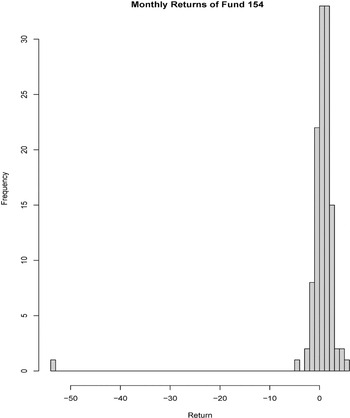
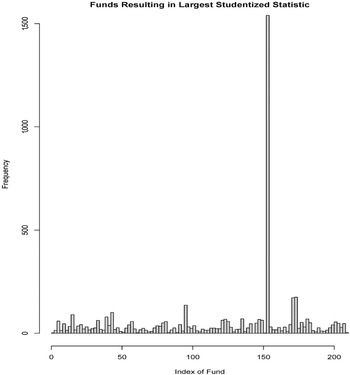
There are 210 funds in the CISDM database with a complete return history from 01/1994 until 12/2003, and the number of monthly observations is T = 120. However, one fund is deleted from the universe because of a highly unusual return distribution, and so the number of funds included in the study is S = 209 in the end. (Fund 154, Paradigm Master Fund, reported one unusually large negative return; see Figure 3. As a result, it unduly dominates the bootstrap sampling distribution of the largest studentized test statistics z120,r1*; see Figure 4.) Table 2 lists the 10 largest basic and studentized test statistics, together with the corresponding hedge funds. Similar to the analysis of Romano and Wolf (2005b), the two lists are almost completely disjoint; only the fund JMG Capital Partners appears in both lists.

Histogram of the monthly log returns of fund 154. In 08/1995 the fund, Paradigm Master Fund, reported a return of −53.77%, resulting in a tremendous outlier to the left.

Histogram of the fund index that corresponds to the largest studentized statistic z120,r1* in M = 5,000 bootstrap repetitions. Fund 154, Paradigm Master Fund, corresponds to the largest studentized statistic disproportionally often.
The 10 largest basic and studentized test statistics, together with the corresponding hedge funds, in our empirical application. The return unit is 1%.

We now use the various multiple testing methods to identify hedge funds that outperform the risk-free rate, starting with the the Holm procedure and its generalizations and also the FDR procedure of Benjamini and Hochberg (1995), all of which are based on individual p-values only. The p-values are obtained by the studentized circular block bootstrap, which corresponds to applying the StepM method to each single strategy, that is, the special case S = 1. The block sizes for the circular block bootstrap are chosen, individually for each fund, via Algorithm A.5 in the Appendix for the special case S = 1. The semiparametric model

used in this algorithm is an AR(1) model in conjunction with bootstrapping the residuals.
19To account for leftover dependence not captured by the AR(1) model, we use the stationary bootstrap with average block size b = 5 for bootstrapping the residuals.
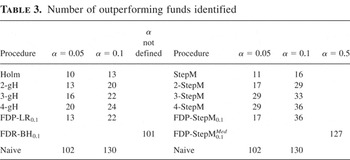
Number of outperforming funds identified

Next, we turn to the studentized StepM method and its generalizations.
20Similar to the analysis of Romano and Wolf (2005b), the basic StepM method does not detect a single outperforming fund, so it is not pursued further.

used in this algorithm is a VAR(1) model in conjunction with bootstrapping the residuals.
21To account for leftover dependence not captured by the VAR(1) model, we use the stationary bootstrap with average block size b = 5 for bootstrapping the residuals.
Not surprisingly, the results are comparable to those of the simulation study. First, when a generalized error rate is controlled, the number of rejected hypotheses can greatly increase. For example, for the nominal level of α = 0.1, whereas the (1-)StepM method rejects 16 hypotheses, the 2-StepM method rejects 29 hypotheses. Second, the methods that implicitly account for the dependence structure of the test statistics reject more hypotheses than the methods based on individual p-values. For example, for the nominal level of α = 0.1, whereas the FDP-LR0.1 method rejects 22 hypotheses, the FDP-StepM0.1 method rejects 36 hypotheses. Third, the methods controlling a central tendency of the FDP are the ones that reject the most hypotheses.
Remark 9.1. The number of respective rejections of the augmentation methods of van der Laan et al. (2004) easily can be computed from the algorithms described in Sections 4.3 and 6.2. For example, if the StepM method is used as the initial procedure to control the 1-FWE, then their method to control the 3-FWE at level α = 0.1 results in 19 rejections (as opposed to our 33 rejections). And their method to control the FDP with γ = 0.1 at level α = 0.1 results in 17 rejections (as opposed to our 36 rejections).
9.2. Multiple Regression
In empirical work, it is quite common to estimate large-dimensional regression models and to then ask which are the “important” variables. The habitual practice is to assess importance via the individual t-statistics or, equivalently, via the individual p-values without taking into account the multitude of tests. Consequently, as discussed earlier, typically too many variables will be identified as important.
As an example, we consider a Mincer regression where log wages are regressed on a large number of explanatory variables. The data consist of a random sample of T = 4,975 people from the Austrian Social Security database on 08/10/2001. The explanatory variables include a dummy for gender, a dummy for blue collar (vs. white collar), age, age squared, work experience, work experience squared, time at current company, time at current company squared, state dummies, industry dummies, and state-industry interaction dummies, in addition to an intercept. The total number of explanatory variables is S = 291.
We now use the various multiple testing methods to identify the important variables, starting with the Holm procedure and its generalizations and also the FDR procedure of Benjamini and Hochberg (1995), all of which are based on individual p-values only. The p-values are obtained by the wild bootstrap to account for possible heteroskedasticity. To generate the resampled errors, we use the two-point distribution; see (6.21) in Davison and Hinkley (1997). Standard errors both in the real world and in the bootstrap world are computed via the well-known White estimator. The White estimator uses the modified residuals rather than the raw residuals because the former have equal variance; see page 271 in Davison and Hinkley (1997). The results are displayed in the left half of Table 4.
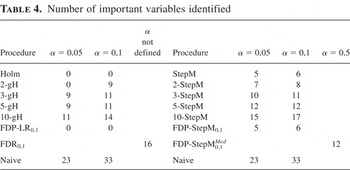
Number of important variables identified

Next, we turn to the studentized StepM method and its generalizations. The k-StepM procedures are based on the operative method using Nmax = 100; see Remark 4.1. The results are displayed in the right half of Table 4. The findings, in terms of comparing the various error rates, are similar to those of Sect. 9.1.
10. CONCLUSIONS
The problem of testing multiple hypotheses is ubiquitous in econometric applications. Unfortunately, this problem very often simply is ignored. As a result, too many true null hypotheses will be rejected. The classical approach to account for the multitude of hypotheses under test is to control the familywise error rate (FWE), defined as the probability of falsely rejecting even one true hypothesis. But when the number of hypotheses is very large, this criterion can become too stringent. As a result, potentially very few false hypotheses will be rejected.
This paper has reviewed various generalized error rates. They are more liberal than the FWE yet still account for the multitude of tests by allowing for a small number or a small (expected) proportion of true hypotheses among all rejected hypotheses. Some simulations and two empirical applications have demonstrated that in this way many more false hypotheses can be rejected compared to control of the FWE.
As a special emphasis, we have presented some very recent multiple testing procedures that implicitly account for the dependence structure of the individual test statistics via an application of the bootstrap. The advantage over traditional multiple testing procedures based on individual p-values alone is that the number of false hypotheses rejected often increases, whereas the control of the generalized error rates is not sacrificed. This advantage has also been highlighted via simulations and two empirical applications. The disadvantage is the increased computational cost, but because of the availability of fast computers this is less and less of a concern.
We have discussed further how the control of generalized error rates can apply to various notions of model selection.
APPENDIX A: Use of the Bootstrap
This Appendix details how to compute the constants

,

,

, and

in Algorithms 4.1, 4.2, 4.3, and 4.4, respectively, via the bootstrap. At first, a proper choice of the estimator

of the underlying probability mechanism P must be made. (One can implicitly define

by describing how a bootstrap data matrix XT* is generated from

.) This choice depends on the context. If the data X1,·(T),…,XT,·(T) are i.i.d., one should choose the Efron (1979) bootstrap; if they constitute a time series, one should choose the moving blocks bootstrap, the circular blocks bootstrap, or the stationary bootstrap. These various bootstrap methods are detailed in Appendix B of Romano and Wolf (2005b). In any case, we use the notation

for a suitable parameter vector corresponding to the bootstrap law.
ALGORITHM A.1 (Computation of the

via the bootstrap).
1. The labels r1,…,rS and the numerical values of R1,R2,… are given in Algorithm 4.1.
2. Generate M bootstrap data matrices XT*,1,…,XT*,M . (One should use M ≥ 1,000 in practice.)
3. From each bootstrap data matrix XT*,m , 1 ≤ m ≤ M, compute the individual test statistics wT,1*,m ,…,wT,S*,m .
4.
(a) For 1 ≤ m ≤ M, and any needed K, compute

.
(b) Compute

as the 1 − α empirical quantile of the M values kmaxT, K*,1,…, kmaxT, K*, M.
5. If j = 1,

.
If j > 1,

, I ⊂ {1,…,Rj−1},|I| = k − 1}.
ALGORITHM A.2 (Computation of the

via the bootstrap).
1. The labels r1,…,rS and the numerical values of R1,R2,… are given in Algorithm 4.2.
2. Generate M bootstrap data matrices XT*,1,…,XT*,M . (One should use M ≥ 1,000 in practice.)
3. From each bootstrap data matrix XT*,m , 1 ≤ m ≤ M, compute the individual test statistics wT,1*,m ,…,wT,S*,m .
4.
(a) For 1 ≤ m ≤ M, and any needed K, compute

.
(b) Compute

as the 1 − α empirical quantile of the M values kmaxT, K,|·|*,1,…, kmaxT, K,|·|*, M.
5. If j = 1,

.
If j > 1,

, I ⊂ {1,…,Rj−1},|I| = k − 1}.
ALGORITHM A.3 (Computation of the

via the bootstrap).
1. The labels r1,…,rS and the numerical values of R1,R2,… are given in Algorithm 4.3.
2. Generate M bootstrap data matrices XT*,1,…,XT*,M . (One should use M ≥ 1,000 in practice.)
3. From each bootstrap data matrix XT*,m , 1 ≤ m ≤ M, compute the individual test statistics wT,1*,m ,…,wT,S*,m . Also, compute the corresponding standard errors

.
4.
(a) For 1 ≤ m ≤ M, and any needed K, compute

.
(b) Compute

as the 1 − α empirical quantile of the M values kmaxT, K*,1,…, kmaxT, K*, M.
5. If j = 1,

.
If j > 1,

, I ⊂ {1,…,Rj−1},|I| = k − 1}.
ALGORITHM A.4. (Computation of the

via the bootstrap).
1. The labels r1,…,rS and the numerical values of R1,R2,… are given in Algorithm 4.4.
2. Generate M bootstrap data matrices XT*,1,…,XT*,M . (One should use M ≥ 1,000 in practice.)
3. From each bootstrap data matrix XT*,m , 1 ≤ m ≤ M, compute the individual test statistics wT,1*,m ,…,wT,S*,m . Also, compute the corresponding standard errors

.
4.
(a) For 1 ≤ m ≤ M, and any needed K, compute

.
(b) Compute

as the 1 − α empirical quantile of the M values kmaxT, K,|·|*,1,…, kmaxT, K,|·|*, M.
5. If j = 1,

.
If j > 1,

, I ⊂ {1,…,Rj−1},|I| = k − 1}.
Remark A.1. For convenience, one can typically use wT,rk in place of

in step 4(a) of Algorithms A.1–A.4. Indeed, the two quantities are the same under the following conditions: (1) wT,k is a linear statistic; (2) θk = E(wT,k); and (3)

is based on Efron's bootstrap, the circular blocks bootstrap, or the stationary bootstrap. Even if conditions (1) and (2) are met, wT,rk and

are not the same if

is based on the moving blocks bootstrap because of “edge” effects; see Appendix B of Romano and Wolf (2005b). On the other hand, the substitution of wT,rk for

does not affect in general the consistency of the bootstrap approximation. Lahiri (1992) discusses this subtle point for the special case of time series data and wT,rk being the sample mean. He shows that centering by

provides second-order refinements but is not necessary for first-order consistency.
When a time series bootstrap is used, then the choice of the (average) block size becomes an important practical problem. The method we propose here to choose a block size for an application of the k-StepM procedure is a generalization of Algorithm 7.1 of Romano and Wolf (2005b), who only deal with the StepM procedure.
Consider the first step of the k-StepM procedure. The goal is to construct a generalized joint confidence region for the parameter vector θ with nominal coverage probability of 1 − α. Here, importantly, “coverage probability” stands for the probability of containing at least S − k + 1 elements of θ.
ALGORITHM A.5 (Choice of block size).
1. Fit a semiparametric model

to the observed data XT.
2. Fix a selection of reasonable block sizes b.
3. Generate M data sets

according to

.
4. For each data set

, m = 1,…,M, and for each block size b, compute a generalized joint confidence region GJCRm,b for θ.
5. Compute

.
6. Find the value of

that minimizes

and use this value

.
Algorithm A.5 is based on the first step of the k-StepM method. Because the general k-StepM method, for k > 1, does not discard any hypotheses in subsequent steps—in contrast to the StepM method—we recommend continuing to use the chosen value

throughout. If, on the other hand, the operative method of Remark 4.1 is used, then at a given subsequent step some hypotheses may already have been discarded. In that case, one can apply Algorithm A.5 to the subset of θ that corresponds to the nondiscarded hypotheses.