




No CrossRef data available.
NONPARAMETRIC FRONTIER ESTIMATION: A CONDITIONAL QUANTILE-BASED APPROACH
Published online by Cambridge University Press: 31 March 2005
Abstract
In frontier analysis, most of the nonparametric approaches (free disposal hull [FDH], data envelopment analysis [DEA]) are based on envelopment ideas, and their statistical theory is now mostly available. However, by construction, they are very sensitive to outliers. Recently, a robust nonparametric estimator has been suggested by Cazals, Florens, and Simar (2002, Journal of Econometrics 1, 1–25). In place of estimating the full frontier, they propose rather to estimate an expected frontier of order m. Similarly, we construct a new nonparametric estimator of the efficient frontier. It is based on conditional quantiles of an appropriate distribution associated with the production process. We show how these quantiles are interesting in efficiency analysis. We provide the statistical theory of the obtained estimators. We illustrate with some simulated examples and a frontier analysis of French post offices, showing the advantage of our estimators compared with the estimators of the expected maximal output frontiers of order m.We thank J.P. Florens for helpful discussions and C. Cazals for providing the post office data set. We also are very grateful to the referees for useful suggestions.
Information
- Type
- Research Article
- Information
- Copyright
- © 2005 Cambridge University Press
1. INTRODUCTION
An important problem in productivity and efficiency analysis is to characterize and to estimate the production frontier, i.e., the set of the most efficient production process. The idea is to analyze how firms combine their inputs to produce in an efficient way the output. We are then interested in the production frontier because it represents a reasonable benchmark value or reference frontier. Let us introduce the basic concepts and notation.
According to economic theory (Koopmans, 1951; Debreu, 1951; Shephard, 1970), the production set, where the activity is described through a set of p inputs

used to produce an univariate output

, is defined as the set of physically attainable points (x,y):

This set can be described mathematically by its sections

where, for any level of inputs x, the requirement set Y(x) represents the set of all outputs that a firm can produce using x as inputs. Assuming that Ψ is compact, the maximal achievable level of output for a given level of inputs x defines the output-efficient function ∂Y(x) = max Y(x). From an economic point of view, this function is supposed monotone nondecreasing, and it is then called the production function and its graph, which represents the efficient boundary of Ψ, is called the production frontier. Other different assumptions can be assumed on Ψ, such as free disposability, i.e., if (x,y) ∈ Ψ then (x′,y′) ∈ Ψ for any x′ ≥ x and y′ ≤ y; or convexity, i.e., every convex combination of feasible production plans is also feasible; or no free lunch, i.e., for all y > 0 we have y ∉ Y(0) (see, e.g., Shephard, 1970).
The production process, which generates observations χn = {(Xi,Yi)| i = 1,…,n} is defined, e.g., through the joint distribution of a random vector (X,Y) on

, where X represents the inputs and Y is the output. In the case where Ψ is equal to the support of the distribution of (X,Y), another way to define the production frontier is given as follows. The production function, which we denote from now on by φ, is characterized for a given level of inputs x by the upper boundary of the support of the conditional distribution of Y given X ≤ x, i.e.,

where F(·/x) = F(x,·)/FX(x) is the conditional distribution function of Y given X ≤ x, with F being the joint distribution function of (X,Y) and FX the marginal distribution function of X. It is supposed here that FX(x) > 0 or that x is an interior point of the support of the distribution of X. The inequality X ≤ x has to be understood componentwise. As a matter of fact, the function φ is the smallest monotone nondecreasing function that is larger than or equal to the output-efficient function ∂Y(.). Its graph defines the production frontier. If the efficient boundary of Ψ is monotone nondecreasing (a quite reasonable assumption in practice), it coincides with the production frontier. So, we have, in some sense, just reparametrized the definition of the efficient frontier of Ψ. This new formulation of the production frontier is due to Cazals, Florens, and Simar (2002).
A large amount of literature is devoted to the estimation of the production frontier from a random sample of production units χn. Two different approaches have been mainly developed: the deterministic frontier models, which suppose that with probability one, all the observations in χn belong to Ψ, and the stochastic frontier models, where random noise allows some observations to be outside of Ψ.
In deterministic frontier models, there are mainly two nonparametric methods based on envelopment techniques: the free disposal hull (FDH) and the data envelopment analysis (DEA). The FDH estimator was introduced by Deprins, Simar, and Tulkens (1984) and relies only on the free disposability assumption on Ψ. The DEA estimator, which was initiated by Farrell (1957) and popularized as a linear programming estimator by Charnes, Cooper, and Rhodes (1978), requires stronger assumptions: it relies on the free disposability assumption and the convexity of Ψ. Note that the convexity assumption is widely used in economics but it is not always valid. The production set might admit increasing returns to scale, i.e., the output increases faster than the inputs, or there might be lumpy goods, i.e., fractional values of inputs or outputs do not exist. Hence, the FDH is a more general estimator than the DEA. The asymptotic distribution of the FDH estimator was derived by Park, Simar, and Weiner (2000) in the case of multivariate input and output, and the asymptotic distribution of the DEA estimator was derived by Gijbels, Mammen, Park, and Simar (1999) in the univariate case. The statistical theory of these estimators is now mostly available. See Simar and Wilson (2000) for a recent survey of the available results.
In stochastic frontier models, where noise is allowed, only parametric restrictions on the shape of the frontier and on the data generating process allow identification of the noise from the efficiency frontier and estimation of this frontier. Aigner, Lovell, and Schmidt (1977), Meeusen and van den Broek (1977), Olsen, Schmidt, and Waldman (1980), Stevenson (1980), and Battese and Coelli (1988) specified a model for the production function and a specific distributional form for the error and then used maximum likelihood methods to estimate the parameters of the production function. These methods may lack robustness if the assumed distributional form does not hold. In particular, outliers in the data may unduly affect the estimate of the frontier function, or, it may be biased if the error structure is not correctly specified. Furthermore, as illustrated by Caudill, Ford, and Groper (1995), heteroskedasticity in the error term, if not properly accounted for, can lead to significant biases when estimating the production frontier.
Nonparametric deterministic frontier models are very appealing because they rely on very few assumptions, but, by construction, they are very sensitive to extreme values and to outliers. Recently, a robust nonparametric envelopment estimator of the production frontier has been suggested by Cazals et al. (2002). They introduce the concept of expected maximal output frontier of order

, where

denotes the set of all integers m ≥ 1. It is defined as the expected maximum achievable level of output among m firms drawn in the population of firms using less than a given level of inputs. Formally, for a fixed integer

and a given level of inputs x, the frontier function of order m is defined as

where (Y1,…,Ym) are m independent identically distributed random variables generated by the distribution of Y given X ≤ x. Its nonparametric estimator is defined by

where

is the empirical version of F(y/x), with

As pointed out in Cazals et al. (2002), the FDH estimator of the production function can be viewed as a plug-in estimator of φ(x), where the unknown F(y/x) in the formulas (1) has been replaced by its empirical analogue

. It is given by

Because of the trimming nature of the order-m frontier, the estimator

does not envelop all the data points, and so it is more robust to extreme values than the FDH estimator

. By choosing m appropriately as a function of the sample size

estimates the production function φ(x) itself while keeping the asymptotic properties of the FDH estimator.
Hendricks and Koenker (1992, p. 58) stated, “In the econometric literature on the estimation of production technologies, there has been considerable interest in estimating so called frontier production models that correspond closely to models for extreme quantiles of a stochastic production surface.” The present paper can be viewed as the first work to actually implement the idea of Hendricks and Koenker: we construct a new nonparametric estimator of the production frontier that is more robust to extreme values than the standard DEA/FDH estimators and than the nonparametric estimator of Cazals et al. It is based on extreme quantiles of the conditional distribution of Y given X ≤ x. These nonstandard conditional quantiles define a natural concept of a partial production frontier in place of the m-trimmed frontier. The idea is nice and attractive, because here the “trimming” is continuous in terms of the order-α quantile where α ∈ [0,1]. Quantile methods are known for their robustness. More precisely, conditional quantiles are not very sensitive to large observations in the output direction. We show that our new partial frontier and its resulting estimator share most of the properties of the order-m frontier and its estimator.
The paper follows the structure of Cazals et al. (2002) initially very closely, adapting their technique to the output oriented case and extending their basic ideas, thus sharing similar comments. It is organized as follows. Section 2 motivates our concept of quantile-frontier of order α and investigates its properties and its relation to the order-m frontier and to the true production frontier. In Section 3, we define a nonparametric estimator of our order-α frontier, which is very easy to derive, very fast to compute, and does not envelop all the observed data points. In Section 4, we show that this estimator converges at the rate

and is asymptotically normally distributed. We also derive a nonparametric estimator of the efficient production frontier and analyze its asymptotic distribution. In Section 5, a numerical illustration is proposed with some simulated examples and a data set on labor (as input) and mail volumes (as output) about 10,000 French post offices. We show how resistant to outliers our estimators are compared with the estimators of the expected maximal output frontiers of order m. Section 6 concludes the paper. The proofs appear in the Appendix.
2. A NEW CONCEPT OF PRODUCTION FRONTIER
Let

be the probability space on which the vector of inputs X and the output variable Y are defined. In this approach, we define the attainable set Ψ to be the support of the joint distribution of (X,Y), and we will concentrate on the set Ψ* = {(x,y) ∈ Ψ|FX(x) > 0}, which contains the interior of Ψ.
From its definition, φ(x), the value of the production function coincides with the order one quantile of the law of Y given X ≤ x,

This suggests introducing a concept of production function of continuous order α ∈ [0,1], as the quantile function of order α of the law of Y given that X does not exceed a given level of inputs. This function takes, for a given level of inputs x, the value

This conditional quantile is the production threshold exceeded by 100(1 − α)% of firms that use less than the level x as inputs. The function F−1(./x) is the so-called generalized inverse of F(·/x). If the distribution function F(·/x) is strictly increasing, its inverse coincides with the generalized inverse F−1(./x). Using this property, we easily obtain the following result.
PROPOSITION 2.1. Assume that for every x such that FX(x) > 0, the conditional distribution function F(·/x) is strictly increasing on the support [0,φ(x)]. Then,

From property (2), we see that any production unit (x,y) in Ψ* belongs to some α-order quantile curve. Then unit (x,y) produces more than 100α% of all production units using inputs smaller than or equal to x and produces less than the 100(1 − α)% remaining units. Thus the quantile function qα(x) quantifies the production efficiency of unit (x,y) by comparing it with all units that use the same level of inputs x and also with those that use strictly less than x. This motivates our interest in the distribution of Y given X ≤ x.
But the most attractive property of this quantile function is that it can be easily nonparametrically estimated without the drawbacks of the methods trying to estimate the frontier function itself: it will be less sensitive to noise, extreme values, or outliers. This is developed in the next section.
As it is shown by property (2), the quantile curves {(x,qα(x))|FX(x) > 0} cover the whole production set Ψ*. As can be seen in the next proposition, this does not hold for expected order-m frontiers of Cazals et al. (2002) {(x,φm(x))|FX(x) > 0}.
PROPOSITION 2.2. Under the assumption of Proposition 2.1 and if we assume furthermore the free disposability of outputs, i.e.,

then the functions φm do not satisfy the following property:

Let us compare how the expected maximal production function and the quantile function can be useful in terms of practical efficiency analysis. Suppose a production unit uses a quantity of inputs x0 and produces an output y0; φm(x0) gives the expected maximum production among a fixed number of m firms using less than x0 as inputs. This value indicates how efficient the unit (x0,y0) is, compared with these m units. This is achieved by comparing its level y0 with the value of φm(x0). For this particular unit, we know that it belongs to a quantile frontier. The order of this frontier, which is known, gives the proportion of units that produce less than y0 among all firms using less than x0. Hence the quantile function gives a clearer indication on the production performance, and it can be viewed as a reasonable benchmark value.
We can, however, establish an asymptotic relationship between the two families of production functions φm and qα. Namely, we can state the following proposition.
PROPOSITION 2.3. For every x such that the conditional distribution function F(·/x) is twice differentiable with first derivative f (·/x) strictly positive on the support [0,φ(x)], we have as m → ∞ and α → 1,

where ψx′(α) = −F′′(qα(x)/x)/f3(qα(x)/x).
From its definition, it is clear that for any fixed x such that FX(x) > 0, qα(x) is a monotone nondecreasing function of α. The limiting case when α → 1 is of particular interest. It converges to the efficient frontier: by letting m tend to infinity in (3) and using limm→∞ φm(x) = φ(x), we obtain φ(x) − qα(x) = o(α) when α → 1. We can prove this property directly by using the monotonicity of quantiles qα(x) with respect to α as indicated by the next proposition. Even more strongly it is shown, under some regularity conditions, that the order-α production function qα converges uniformly to the true production function φ.
PROPOSITION 2.4.
(i) For any fixed value of x such that FX(x) > 0, we have limα→1 [searr] qα(x) = φ(x).
(ii) Assume that for every α ∈ [0,1], the quantile function qα(.) is continuous on the interior of the support of X. Then for any compact K interior to the support of X,

The function qα converges to a monotone nondecreasing function φ as α → 1, but it is not monotone nondecreasing itself unless we add the following assumption:

This assumption is not needed for all the results of this paper except for the next proposition, but it appears to be quite reasonable: it says that the chance of producing less than a value y decreases if a firm uses more inputs. This assumption is necessary and also sufficient.
PROPOSITION 2.5. The quantile function x [map ] qα(x) is monotone nondecreasing on the set

for every order α ∈ [0,1] if and only if the function x [map ] F(y/x) is monotone nonincreasing on the set

for any output

.
Note that the results established in Proposition 2.4 are very similar to those obtained for the order-m frontier. Indeed φm(x) converges simply and uniformly to φ(x) as m → ∞. However for Proposition 2.5, Cazals et al. (2002, Theorem A.3) only prove that if assumption (4) holds then φm(x) is monotone nondecreasing in x.
3. NONPARAMETRIC ESTIMATION
To estimate the conditional quantile qα(x), it is natural to use the conditional empirical quantile obtained by inverting the conditional empirical distribution function

,

This estimator may be computed explicitly as follows. Let Nx be the number of observations Xi smaller than or equal to x, i.e.,

, and, for j = 1,…,Nx, denote by Y(ij) the jth order statistic of the observations Yi such that Xi ≤ x: Y(i1) ≤ Y(i2) ≤ ··· ≤ Y(iNx). We have, for x such that Nx ≠ 0,

Hence,

Therefore, we obtain for every α > 0,

where [αNx] denotes the integral part of αNx: the largest integer less than or equal to αNx. The conditional empirical quantile

is thus computed very easily as being the simple empirical quantile of observations yi such that xi ≤ x.
For comparison, note that an exact formula is available to compute

. It is as simple as the formula (5) but is restricted to the case of no ties among the inputs. The nonparametric estimator

can also be approximated in practice by using a Monte-Carlo algorithm, even in the full multivariate case (several inputs and several outputs), which we do not treat in our paper. For instance, in the univariate output case, the Monte-Carlo method can be described as follows. For a given x, draw a random sample of size m with replacement among these yi such that xi ≤ x and denote this sample by (yb1,…,ybm). Then compute

. Redo this for b = 1,…,B where B is large. Finally, we have

where the quality of the approximation can be tuned by the choice of B.
Note also that the relation between the order-m frontier and the true frontier remains valid with their estimators

, i.e.,

. Similarly it is easily seen, for any fixed value of inputs x for which the estimator

is well defined for every order α ∈ [0,1], that

is a monotone nondecreasing function of α, and thus

Note that even for large values of α < 1, the estimator

is less sensitive to extreme values than the FDH estimator

, which by construction envelops all the observations. The asymptotic theory is discussed in Section 4. Note also that

is not necessarily monotone nondecreasing with respect to x. Indeed, even if assumption (4) is assumed for the true conditional distribution function, it could happen that its empirical counterpart does not satisfy it. Of course we know that for large sample size n, it will mostly be the case.
Another property that

shares with

lies in the fact that both the nonparametric partial frontiers underestimate the full frontier φ(x), for every order. In our case, for any value of inputs x for which

are well defined for any order α ∈ [0,1], we have

Indeed, because the production function φ(·) is monotone nondecreasing and greater than or equal to the efficient-output function ∂Y(.), for each i such that Xi ≤ x we have almost surely Yi ≤ ∂Y(Xi) ≤ φ(Xi) ≤ φ(x). Therefore

. On the other hand we have

for every α ∈ [0,1].
4. ASYMPTOTIC PROPERTIES
For the unconditional case where ξα denotes the order-α quantile of a distribution function FZ of a random variable Z, and

denotes the empirical quantile of a sample (Z1,…,Zn) of Z, if FZ is differentiable in ξα and such that FZ′(ξα) > 0, the Bahadur representation theorem gives

The direct application of this result to the distribution function FZ(·) = F(·/x) does not serve our purpose because our data do not yield a sample from this distribution. However, as for unconditional quantiles ξα, we focus here on pairs (x,α) that satisfy the following property:

As a consequence of this property, F(·/x) is a bijective transformation from a neighborhood of qα(x) onto a neighborhood of α. In particular the generalized inverse F−1(·/x) is equal to the inverse of F(·/x) in the neighborhood of α. This property will be used in the proof of the following theorem, which summarizes the asymptotic properties of our estimator

.
THEOREM 4.1. Let α ∈ (0,1) be a fixed order and let x be a fixed value such that FX(x) > 0. Assume that the conditional distribution function F(·/x) is differentiable at qα(x) with derivative f (qα(x)/x) > 0. Then,

where

It is important to note that here, also, the equivalent properties hold with the nonparametric estimator of the order-m frontier. Indeed it is easy to see that

converges at the rate

and is asymptotically unbiased and normally distributed:

, where σ2(x,m) = E [Γm2(x,X,Y)], with

Moreover for a vector

, the asymptotic r-variate normal distribution is obtained with asymptotic covariances given by Σm(xk,xl) = E [Γm(xk,X,Y)Γm(xl,X,Y)]. Similarly we have the following more general result for the estimator of the conditional quantile frontier function.
THEOREM 4.2. Let x1,…,xr be r levels of the input X that satisfy the assumption of Theorem 4.1 for a given order α ∈ (0,1). Then,

where

with

In applied work, the variance factors σ2(x,α) and Σα(xk,xl) must be estimated. For instance, consistent estimators for these factors can be obtained by plugging in nonparametric estimators for the conditional density f (·/x) and the marginal distribution function FX(x) and taking the empirical mean for the expectation. Note that, as for unconditional quantiles, quantiles in the tail of the conditional distribution where the conditional density is low are inherently more difficult to estimate.
Note also that Cazals et al. (2002) obtained an asymptotic representation for their nonparametric estimator

where the error term is uniform in x, whereas the error term involved in our approach depends on x (see the proof of Theorem 4.1). This can be explained as follows. Both

are representable as functionals of the empirical distribution function

. The corresponding functional for

is differentiable in the Frechet sense w.r.t. the sup-norm, whereas that corresponding to

is only differentiable in the Gâteaux sense. The uniformity of the error term allowed Cazals et al. (2002, Appendix B) to improve the convergence results of

by a functional limit theorem, which is not the case in our approach.
It is also interesting to compare

with the estimator of the standard conditional quantile of the distribution of Y given X = x. First note that this latter estimate requires a smoothing procedure, which is not the case when the distribution of Y is conditioned by X ≤ x. To compare their asymptotic variance, let us recall that the smooth estimators of the quantiles ξα(x) of the distribution function Fx of Y given X = x, are obtained by inverting a kernel estimator of Fx and satisfy the following result:

where μ2(x,α) = α(1 − α)R(K)/fx2(ξα(x)), with fx(y) = (∂/∂y)Fx(y), R(K) = ∫K2(u) du, and K and hn are, respectively, a kernel and a bandwidth satisfying some specific constraints (see, e.g., Berlinet, Cadre, and Gannoun, 2001; Ducharme, Gannoun, Guertin, and Jequier, 1995).
Let us now turn to the convergence to the full frontier function φ(x). We know that the estimator

converges to the FDH estimator

as α → 1. We also know from Park et al. (2000) that under regularity conditions, as n → ∞, the FDH estimator

converges to the true unknown frontier φ(x). The idea is then to define α as a function of n such that

as n → ∞. We thus derive an estimator of the true production frontier φ(x) and show in the next theorem that it converges to the same asymptotic distribution as the FDH estimator and as the nonparametric envelopment estimator of Cazals et al. (2002). The rate of convergence of the order α(n) to 1 is provided.
THEOREM 4.3. Assume that the joint probability measure of (X,Y) on the compact support Ψ provides a strictly positive density on the frontier {(x,φ(x))|FX(x) > 0} and that the function φ is continuously differentiable. Then for any x interior to the support of X we have, as n → ∞,

where μx is a constant and the order α(n) is such that

The constant μx appearing in the limiting Weibull depends on the slope of the frontier and the value of the density near the frontier point (x,φ(x)). A consistent nonparametric estimator of this unknown constant has been proposed in Park et al. (2000).
Like the approach of Cazals et al. (2002), here also we lose the

-consistency because we use

to estimate the full frontier φ(x) and not the partial frontier qα(x).
5. NUMERICAL ILLUSTRATIONS
In this section, we illustrate our procedure through some numerical examples with simulated and real data. In the simulation study, the observations are simulated according to the same data generating process used in Simar (2003).
5.1. Example 1
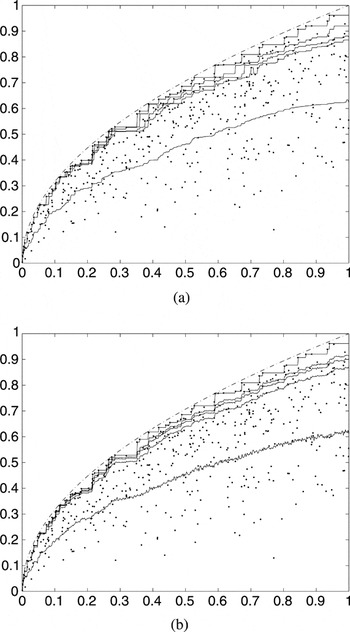
We first consider a situation where the attainable set is convex. We simulate a sample of n = 500 data points (xi,yi) according to the Cobb–Douglas log-linear frontier model given by Y = X0.5 × exp(−U), where X is uniform on (0,1) and U is exponential with mean 1/3. The true frontier function is φ(x) = x0.5.
Figure 1 illustrates the simulated data and the quantile curves

and the expected maximal frontiers

(B = 1,000) for several different values of α and m. In the solid lines, the estimates

(Figure 1a) with α = 0.7, 0.97, 0.98, 0.99, 1 are compared with the estimates

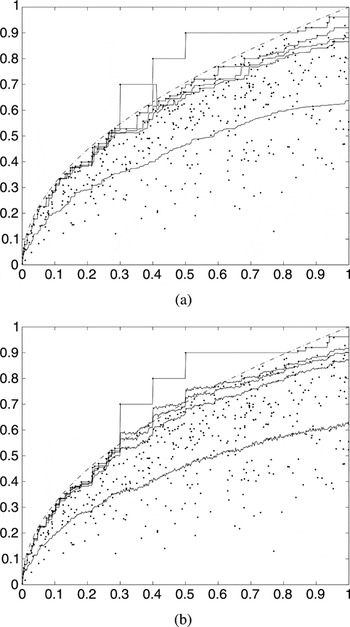
(Figure 1b) with m = 2, 25, 50, 75, ∞. The true frontier φ is in dash-dotted lines. The frontiers are monotone nondecreasing with respect to the order. For Figure 2, we add in the data set three outliers, and we plot the same frontiers

.

n = 500. Comparison between (a) and (b), output vs. input.

n = 503. Comparison between (a) and (b) with three outliers included, output vs. input.
From Figures 1 and 2, it is clear that the frontiers

are more resistant to the three outliers than the FDH frontier, but they are less resistant to the outliers than the quantile frontiers of orders α < 1. Indeed, the quantile frontier

is influenced by only one outlier, and it comes back down immediately, whereas the frontiers

with m = 25, 50, 75 are attracted by all the outliers and moreover continue to grow after each jump. So in this particular example the frontier

is more robust to the outliers than the three frontiers

, whereas it envelops all these frontiers in absence of the three outliers.
5.2. Example 2
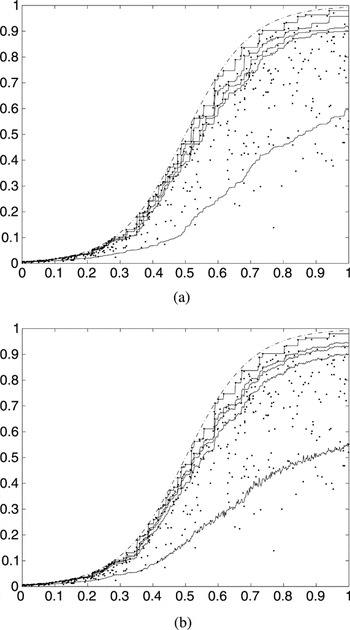
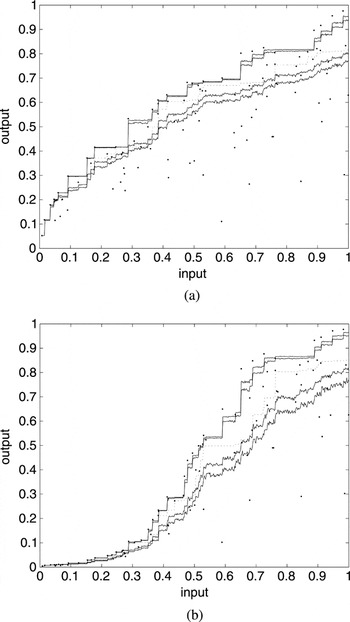
We now simulate a sample of n = 500 data points (xi,yi) with a nonconvex production set. We choose here the model Y = exp(−5 + 10X)/(1 + exp(−5 + 10X))exp(−U), where X is uniform on (0,1) and U is exponential with mean 1/3.
Figure 3 plots the simulated data and, in the solid lines, the frontiers

(B = 1,000) with the same orders as in the preceding example and, in the dash-dotted lines, the true frontier φ. Note that, here also, the frontier

is above all the frontiers

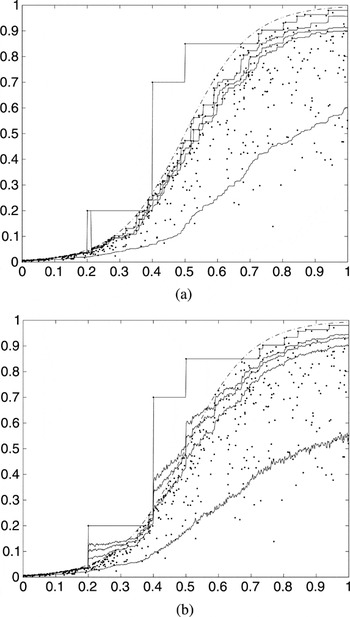
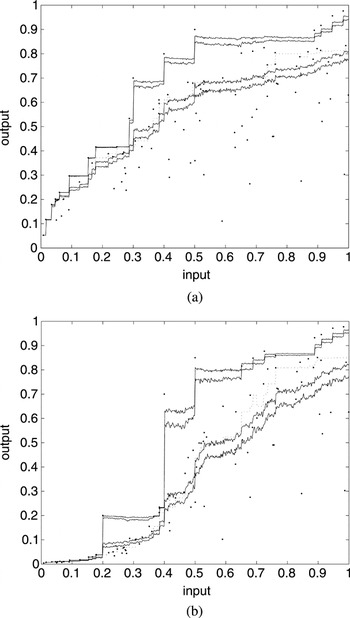
. We again add in the data set three outliers, as shown in Figure 4, and we plot the frontiers

for the same orders. It is clear that the quantile curves of orders α < 1 are more resistant to the three outliers than the expected maximal output frontiers

and the FDH frontier

.

n = 500. Comparison between (a) and (b), output vs. input.

n = 503. Comparison between (a) and (b) with three outliers included, output vs. input.
5.3. Example 3
We now test the robustness of both estimators

for a small sample size n = 100. In Figures 5a and 5b we plot, in the dotted lines, the quantile frontier of order α = 0.93 and, in the solid lines, the frontiers

(B = 1,000) of orders m = 5, 7, 50, 75. In Figure 5a, the data points are simulated according to the same model used in Example 1, and in Figure 5b, they are simulated according to the same model used in Example 2. Observe that the quantile frontier

is below the frontiers

of orders m = 50, 75 and is above those of orders m = 5, 7.

n = 100. In the solid lines, the order-m frontiers and in the dotted lines, the quantile frontier .
In Figure 6 we add to the preceding two data sets the same three outliers used in Examples 1 and 2, and we plot the same frontiers. We remark that the frontiers

of orders m = 50, 75 are highly influenced; even those of very low orders m = 5, 7 are attracted by the three outliers, whereas the quantile frontier is slightly perturbed.

n = 103. In the solid lines, the order-m frontiers and in the dotted lines, the quantile frontier with three outliers included.
We repeated the same exercise with many other simulated data sets, leading to the same kind of results.
5.4. Frontier Analysis of French Post Offices
We examine here a real data set in a univariate situation: this data set about the cost of the delivery activity of the postal services in France is analyzed by Cazals et al. (2002). There are n = 9,521 post offices observed in 1994. For each post office i, the input xi is the labor cost measured by the quantity of labor, which represents more than 80% of the total cost of the delivery activity. The output yi is defined as the volume of delivered mail (in number of objects).
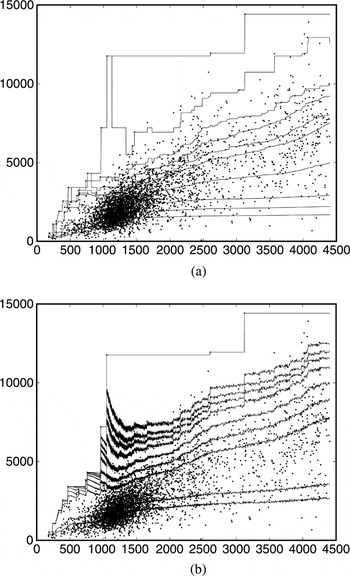
The 4,000 observed post offices with the smallest input levels are plotted in Figure 7, along with the estimates of quantile frontiers (Figure 7a) and of expected maximal output frontiers (Figure 7b), for several different orders α and m. Here we obtain the frontiers

with B = 2,000 bootstrap loops.

The 4,000 observations with the smallest input levels. (a) The frontiers of orders α = 0.3, 0.5, 0.7, 0.9, 0.97, 0.98, 0.99, 0.995, 0.999 and the FDH frontier (α = 1). (b) The frontiers of orders m = 1, 2, 25, 50, 100, 200, 300, 400, 600 and the FDH frontier (m = ∞). Output vs. input.
By using (5), it is very easy to check that every post office i belongs to the quantile curve of order

. On the other hand, the frontiers

do not cover the observations below the first frontier

(12% of the observed data) and the observations between the frontiers of successive orders

. This disadvantage of frontiers

with respect to frontiers

is due to the fact that the order m is discrete.
Note that the order αi of the quantile frontier that passes through the post office (xi,yi) is equal to the percentage of post offices that produce less than yi among all the post offices using inputs smaller than or equal to xi. In other words, this order indicates that the ith post office produces more than 100α% of all post offices using inputs smaller or equal to xi and produces less than the 100(1 − α)% remaining post offices. This is why one sees in Figure 7a that, if αi is close to one, then the post office (xi,yi) can be seen to be performing relatively efficiently, and likewise, if αi is close to zero, then the post office would be performing relatively inefficiently. Thus the order of the empirical quantile frontier

defines a reasonable benchmark value. Note also that the nonparametric estimation of the expected frontier

can be viewed as a mark of good practice for post offices when studying their performance. However, this benchmark is less clear than the empirical quantile frontier because it is less easy to interpret and does not cover the whole data set.
We also remark that the frontiers

(Figure 7b) are perturbed by the extreme observations from the order m = 25, whereas the frontiers

are not influenced except for those having orders almost equal to one (α ≥ 0.999).
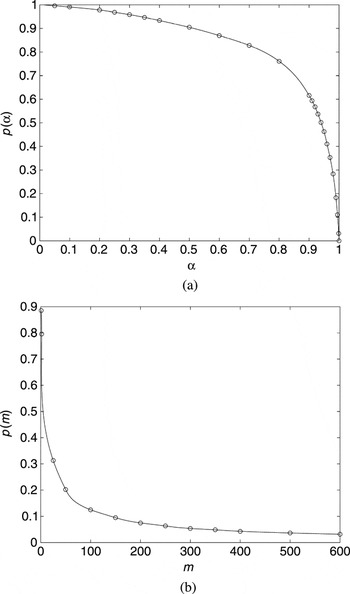
Figure 8a (resp. Figure 8b) indicates how the percentage p(α) (resp. p(m)) of observations above the quantile estimates

(resp. the expected maximum cost estimates

) decreases with α (resp. m). We remark that the percentage p(α) decreases very slowly until the order α = 0.8 of approximately 24% of observations. It means that the quantile frontiers of orders 0 ≤ α ≤ 0.8 are very tight. The 24% observations below the frontier

have an intermediate production performance and can be relatively inefficient. However, the percentage p(α) falls dramatically from the order α = 0.8, which means that the quantile frontiers of extreme orders 0.8 ≤ α ≤ 1 are very spaced and are spread out over 76% of the observations. In particular, 10% of the observations are above the frontier

and 3% of the observations are above the frontier

. It is what explains notably the fact that only quantile frontiers of orders very close to one are influenced by superefficient units.

Evolution of the percentage of observations above the frontiers (a) and (b) .
In Figure 8b, we observe an opposite phenomenon: first the percentage p(m) falls severely until the order m = 50 of approximately 80% of observations, and then it continues to decrease but very slowly. Consequently the frontiers

of orders m ≥ 50 are very tight. In particular we just have 9% of observations between the two frontiers

, and only 3% of observations are above the frontier

. The 20% observations above the frontier

are extreme and could be outliers or noisy observations. In summary the frontiers

are very tight from the order m = 50 and are spread out over extreme observations; it is then natural that these frontiers would be more sensitive to extreme values than the quantile frontiers.
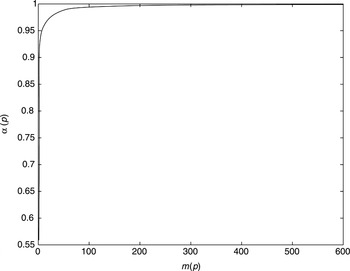
We can illustrate this result more clearly by considering the following inverse problem: for a given percentage p0, denote by α(p0) (resp. m(p0)) the order of the frontier

(resp.

) above which the percentage of observations is equal to p0; we have p(α(p0)) = p(m(p0)) = p0. Inverting the relationship between α and p(α) and between m and p(m) in Figure 8, we get the evolution of α and m as functions of p. When the percentage p varies between 0 and 10%, we remark that the order α(p) is almost constant (α(p) ≈ 1), whereas the order m(p) falls rapidly from m = 600 to m ≈ 100. This means that the 10% extreme observations influence all the frontiers

with orders 100 ≤ m ≤ ∞, whereas only the frontiers

with orders almost equal to 1 are influenced by these extreme observations. This can be understood because the FDH frontier

envelops all the observed data.
This result is also illustrated in Figure 9, where the curve of evolution of α(p) with respect to m(p) is nearly flat from the point (100, 0.995) which corresponds to the percentage p ≈ 10%. This plot establishes an empirical relationship between the two families of frontiers

. Given a frontier

, we can determine the frontier

above which we have the same percentage of observations and vice versa.

An empirical relationship between .
6. CONCLUSIONS
In this paper, we propose a new statistical concept of a production frontier that allows a more subtle tuning than the expected maximal output frontier of order

(Cazals et al., 2002). We define a frontier of continuous order α ∈ [0,1] of the production set Ψ, for a given level of inputs x, by the conditional α-quantile of the distribution of Y given X ≤ x.
Our quantile frontiers satisfy at least the same statistical properties as the expected maximal output frontiers of order m. Moreover they have the advantage, from an economic point of view, of covering the interior of the attainable set entirely, thus giving a clearer indication of the production efficiency. This benefit is due to the continuity of the index α of our conditional quantiles.
A nonparametric estimator of the quantile function of order α < 1 is very easy to derive by inverting the empirical version of the conditional distribution function. It does not envelop all the observed data points, and so it is more robust to extreme values than the standard DEA/FDH nonparametric envelopment estimators. Also it is easier to interpret than the nonparametric estimator of the expected function of order m. Moreover our estimator achieves the

-consistency and is asymptotically unbiased and normally distributed, which is reasonable because the conditioning set X ≤ x has a positive probability measure. By choosing α as an appropriate function of n, it estimates the true frontier function and satisfies the asymptotic properties of the FDH estimator.
The method is illustrated using simulated and real data. It shows that the nonparametric quantile frontiers are more resistant to large observations in the output direction than the nonparametric estimates of expected maximal output frontiers and that the continuous order α represents a good benchmark value. The robustness revealed by the numerical illustrations needs to be confirmed by some theoretical properties. This question is currently being investigated.
It should be clear that, unlike the approach of Cazals et al. (2002), the conditional quantile approach is not extended here to multivariate Y. Serfling (2002) stated, “Despite the absence of a natural ordering of Euclidean space for dimension greater than one, effort to define vector-valued quantile functions for multivariate distributions has generated several approaches.” The methods based on depth functions recommended by Serfling might be adapted to generalize in a reasonable way our univariate conditional quantiles. This problem is worth investigating.
APPENDIX: PROOFS
Proof of Proposition 2.1. Let (x,y) ∈ Ψ* and set α = F(y/x). It is an immediate consequence of the strict monotonicity of F(·/x) that qα(x) = F−1(α/x) = y. █
Proof of Proposition 2.2. Let us assume the contrary. Then we obtain

where Supp(X) is the support of the distribution of

denotes its interior. Let

be fixed such that ∂Y(x) > 0. Because the production function φ is greater than or equal to the output-efficient function ∂Y(.), we have φ(x) = ∂Y(x) or φ(x) > ∂Y(x).
If φ(x) = ∂Y(x), we know from Cazals et al. (2002, Appendix A) that φ(x) = lim [searr]m→∞ φm(x), so there exists an integer

such that φmx(x) < φmx+1(x) ≤ ∂Y(x) (else, we would have φm(x) = φm+1(x) for every

, so that φ(x) = φ1(x); consequently we would obtain

, which is impossible because the function F(·/x) is strictly increasing on [0,φ(x)]). Let y be a real number such that φmx(x) < y < φmx+1(x). Using the free disposability assumption of outputs, it is easily seen that Y(x) ≡ [0,∂Y(x)], so that y ∈ Y(x). Then by (A.1), there exists an integer

such that y = φmx,y(x). It follows that φmx(x) < φmx,y(x) < φmx+1(x), and thus mx < mx,y < mx + 1 because φm(x) is a monotone nondecreasing function of m. This contradicts the fact that mx,y is an integer.
Now if φ(x) > ∂Y(x), first note that ∂Y(x) ∈ Y(x) yields by (A.1) that ∂Y(x) = φmx,∂Y(x)(x) where

. Because of lim [searr]m→∞ φm(x) = φ(x), there exists an order mx > mx,∂Y(x) such that φ(x) ≥ φm(x) > ∂Y(x) when m ≥ mx, and φm(x) ≤ ∂Y(x) when m < mx. For any y ∈ Y(x) we have y ≤ ∂Y(x) so that y < φmx(x). We also have by (A.1) y = φmx,y(x) where

. Hence φmx,y(x) < φmx(x). Therefore, again using the monotonicity of φm(x) with respect to m, we get mx,y < mx. In summary,

Because φm(x) ∈ [0,∂Y(x)] = Y(x) for every m < mx, the map m [map ] φm(x) is well defined and is onto from {1,…,mx − 1} to Y(x). As a consequence, the finite set {φ1(x),…,φmx−1(x)} coincides with the interval [0,∂Y(x)], which implies the contradiction. █
Proof of Proposition 2.3. Let x be an input that satisfies the condition of Proposition 2.3. We have by definition φm(x) = E [max(Y1,…,Ym)], where Y1,…,Ym are m independent identically distributed random variables generated by the distribution function F(·/x). Let

be the empirical distribution function of (Y1,…,Ym). The empirical quantile of order α ∈ (0,1] of this sample is then defined by

We know that qαm(x) is equal to Y(αm) if αm is an integer and to Y([αm]+1) otherwise. Then q1m(x) = Y(m). Because the family (qαm(x))0<α<1 increases to q1m(x) when α → 1, the dominated convergence theorem yields φm(x) = limα→1 E [qαm(x)], and thus we can write φm(x) = E [qαm(x)] + ε1(α), where ε1(α) = o(α) when α → 1. On the other hand, according to the representation theorem of Bahadur (see, e.g., Serfling, 1980, Theorem 2.5.1, p. 91), we have for every α ∈ (0,1),

where, with probability 1, Rm,x(α) = O(m−3/4(log m)3/4) as m → ∞. By using Kiefer's theorem (see, e.g., Serfling, 1980, Theorem D, p. 101), it can easily be seen that a more precise expression of the remainder is given by

where, almost surely and uniformly in α, we have

It follows that

Now consider the function ψx(p) = 1/f (qp(x)/x), p ∈ [0,1]. We have as m → ∞,

Because F(·/x) has a positive continuous density f (./x) in the neighborhood (0,φ(x)) of qα(x), for any α ∈ (0,1), we obtain according to Shorack and Wellner (1986, Proposition 6, p. 9) that the partial derivative (∂/∂α)qα(x) exists and equals 1/f (qα(x)/x). Then, for every α ∈ (0,1), the derivative of ψx(α) with respect to α is given by

Using the fact that ψx(1) − ψx(α) = (1 − α)ψx′(α) + (1 − α)ε2(α), where ε2(α) = o(α) when α → 1, we obtain as m → ∞ and α → 1,

which proves (3). █
Proof Proposition 2.4.
1. Because the family {qα(x)}0≤α≤1 is monotone nondecreasing and bounded by q1(x), qα(x) converges pointwise to q1(x) when α → 1.
2. Let K be a compact subset of

. The term {qα(.)}0<α<1 is a nondecreasing sequence of real valued functions that are continuous on K. Moreover it converges pointwise to the continuous function q1(.) as α tends to one. Then by Dini's theorem (Schwartz, 1991, p. 325) the convergence is uniform on K. █
Proof of Proposition 2.5. Suppose that for every y ≥ 0, the function x [map ] F(y/x) is monotone nonincreasing on

. Let α ∈ [0,1] and x1 ≤ x2 such that FX(x1) > 0. Then F(qα(x2)/x1) ≥ F(qα(x2)/x2) ≥ α. It follows that qα(x2) ≥ inf{y| F(y/x1) ≥ α} = qα(x1).
Conversely, suppose that the quantile function is monotone nondecreasing for every order on

. Let

such that FX(x1) > 0. Set α = F(y/x2). We have qα(x2) = inf{u|F(u/x2) ≥ α}, so that y ≥ qα(x2). Because qα(x1) ≤ qα(x2), y ≥ qα(x1), and thus F(y/x1) ≥ F(qα(x1)/x1) ≥ α = F(y/x2). █
The following lemma will be useful in the proof of Theorem 4.1.
LEMMA 6.1. Let {Vn}, {Wn} be two sequences of random variables satisfying the following conditions.
(i) For all δ > 0, there exists a λ (depending on δ) s.t. P(|Wn| > λ) < δ.
(ii) For all k and all ε > 0

Then

.
The proof of this lemma can be found in Ghosh (1971, Lemma 1, p. 1958). Now let us demonstrate Theorem 4.1.
Proof of Theorem 4.1. Consider the statistical functional Tα,x that associates to a distribution function G on

the real value

The conditional quantile qα(x) and its estimator

are then given by

. Let

where

is the first Gâteaux differential of Tα,x at F in the direction of 1(Xi ≤ .,Yi ≤ .). Using property (6), we obtain by a straightforward computation

Hence,

Therefore,

where

We have

so that, by the central limit theorem,

and by the law of large numbers,

Let

. Then we obtain via (A.2)

Using Lemma 6.1, we will show that

converges in probability to zero. We have for every real number t,

where

Because F(·/x) is differentiable at qα(x) with derivative

, which implies

. We know from the law of large numbers that

, and thus,

On the other hand we have

By a simple computation we find that

Using the continuity of F(·/x) in qα(x), we get E [(Zt,n − Wnα,x)2] → 0 as n → ∞, and thus,

Now, using the results (A.3) and (A.6)–(A.8), we will show that Vnα,x and Wnα,x satisfy the two conditions of Lemma 6.1. As E [(Wnα,x)2] = σ2(x,α), the first condition follows from a trivial application of the Markov inequality. For any k and any ε > 0, setting t = k, we have by (A.6),

Hence,

Therefore, combined with (A.7) and (A.8), limn→∞ P(Vnα,x ≤ k,Wnα,x ≥ k + ε) = 0. Now applying (A.6) to t = k + ε, we get

Then (A.7) and (A.8) yield limn→∞ P(Vnα,x ≥ k + ε,Wnα,x ≤ k) = 0. Hence, the second condition of Lemma 6.1 is also satisfied. Therefore

, as n → ∞, i.e.,

In particular Rnα,x converges in probability to zero as n → ∞. Thus,


The consistency follows from results (A.5) and (A.9), and the asymptotic normality is obtained by (A.4) and (A.10). █
Proof of Theorem 4.2. It follows from (A.10), as n → ∞,

Hence, the multivariate central limit theorem yields

where

This ends the proof. █
Proof of Theorem 4.3. From Park et al. (2000) and Cazals et al. (2002) we know that

So by using the following decomposition:

we want to find a function α of n such that

From (5) we have for any α > 0,

Set for every k ∈ {1,…,Nx − 1}

and let Cx(n) = max{Cx,k(n) | 1 ≤ k ≤ Nx − 1}. Then we have

because

. Now, using that

, we get

It follows from (A.11)–(A.13) that

so that

Because the support Ψ of (X,Y) is compact, the support of Y is bounded. Let M > 0 be its upper bound. Then for any k = 1,…,Nx − 1,

Hence,

Therefore,

We deduce from (A.14)

We know from the strong law of large numbers that

. So to achieve our goal, it is sufficient to choose α(n) such that

Indeed we find,

This completes the proof. █
References
REFERENCES
Aigner, D.J.,
C.A.K. Lovell, &
P. Schmidt
(1977)
Formulation and estimation of stochastic frontier production
function models.
Journal of Econometrics
6,
21–37.Google Scholar
Battese, G.E. &
T.J. Coelli
(1988)
Prediction of firm-level technical efficiencies with a generalized
frontier production function and panel data.
Journal of Econometrics
3,
387–399.Google Scholar
Berlinet, A.,
B. Cadre, &
A. Gannoun
(2001)
On the conditional L1-median and its estimation.
Journal of Nonparametric Statistics
13,
631–645.Google Scholar
Caudill, S.B.,
J.M. Ford, &
D.M. Groper
(1995)
Frontier estimation and firm-specific inefficiency measures in the
presence of heteroscedasticity.
Journal of Business & Economic Statistics
13,
105–111.Google Scholar
Cazals, C.,
J.P. Florens, &
L. Simar
(2002)
Nonparametric frontier estimation: A robust approach.
Journal of Econometrics
1,
1–25.Google Scholar
Charnes, A.,
W.W. Cooper, &
E. Rhodes
(1978)
Measuring the efficiency of decision making units.
European Journal of Operations Research
2,
429–444.Google Scholar
Deprins, D.,
L. Simar, &
H. Tulkens
(1984)
Measuring labor efficiency in post offices. In
M. Marchand,
P. Pestieau, &
H. Tulkens (eds.),
The Performance of Public Enterprises: Concepts and
Measurements, pp.
243–267.
North-Holland.
Ducharme, G.R.,
A. Gannoun,
M.C. Guertin, &
J.C. Jequier
(1995)
Reference values obtained by kernel-based estimation of quantile
regression.
Biometrics
51,
1105–1116.Google Scholar
Farrell, M.J.
(1957)
The measurement of productive efficiency.
Journal of the Royal Statistical Society, Series A
120,
253–281.Google Scholar
Ghosh, J.K.
(1971)
A new proof of the Bahadur representation of quantiles and an
application.
Annals of Mathematical Statistics
42,
1957–1961.Google Scholar
Gijbels, I.,
E. Mammen,
B.U. Park, &
L. Simar
(1999)
On estimation of monotone and concave frontier functions.
Journal of the American Statistical Association
94,
220–228.Google Scholar
Hendricks, W. &
R. Koenker
(1992)
Hierarchical spline models for conditional quantiles and the demand
for electricity.
Journal of the American Statistical Association
87,
58–68.Google Scholar
Koopmans, T.C.
(1951)
An analysis of production as an efficient combination of
activities. In
T.C. Koopmans (ed.),
Activity Analysis of Production and Allocation,
Cowles Commission for Research in Economics,
Monograph 13.
Wiley.
Meeusen, W. &
J. van den Broek
(1977)
Efficiency estimation from Cobb-Douglas production function with
composed error.
International Economic Review
8,
435–444.Google Scholar
Olsen, J.A.,
P. Schmidt, &
D.M. Waldman
(1980)
A Monte Carlo study of estimators of stochastic frontier production
functions.
Journal of Econometrics
13,
67–82.Google Scholar
Park, B.U.,
L. Simar, &
C. Weiner
(2000)
The FDH estimator for productivity efficiency scores.
Econometric Theory
16,
855–877.Google Scholar
Schwartz, L.
(1991)
Analyse.
I. Hermann, éditeurs des sciences
et des arts.
Serfling, R.J.
(1980)
Approximation Theorems of Mathematical Statistics.
Wiley Series in Probability and Mathematical Statistics.
Wiley.
Serfling, R.J.
(2002)
Quantile functions for multivariate analysis: Approaches and
applications.
Statistica Neerlandica
56,
214–232.Google Scholar
Shephard, R.W.
(1970)
Theory of Cost and Production Function.
Princeton University Press.
Shorack, G.R. &
J.A. Wellner
(1986)
Empirical Processes with Applications to Statistics.
Wiley.
Simar, L.
(2003)
Detecting Outliers in Frontier Models: A Simple Approach.
Discussion paper 0146, UCL
(http://www.stat.ucl.ac.be).
Forthcoming in
Journal of Productivity Analysis.Google Scholar
Simar, L. &
P. Wilson
(2000)
Statistical inference in nonparametric frontier models: The state of
the art.
Journal of Productivity Analysis
13,
49–78.Google Scholar
Stevenson, R.E.
(1980)
Likelihood functions for generalised stochastic frontier
estimation.
Journal of Econometrics
13,
57–66.Google Scholar
n = 500. Comparison between (a) and (b), output vs. input.
n = 503. Comparison between (a) and (b) with three outliers included, output vs. input.
n = 500. Comparison between (a) and (b), output vs. input.
n = 503. Comparison between (a) and (b) with three outliers included, output vs. input.
n = 100. In the solid lines, the order-m frontiers and in the dotted lines, the quantile frontier .
n = 103. In the solid lines, the order-m frontiers and in the dotted lines, the quantile frontier with three outliers included.
The 4,000 observations with the smallest input levels. (a) The frontiers of orders α = 0.3, 0.5, 0.7, 0.9, 0.97, 0.98, 0.99, 0.995, 0.999 and the FDH frontier (α = 1). (b) The frontiers of orders m = 1, 2, 25, 50, 100, 200, 300, 400, 600 and the FDH frontier (m = ∞). Output vs. input.
Evolution of the percentage of observations above the frontiers (a) and (b) .
An empirical relationship between .
 You have
Access
- 211
- Cited by