

1. Introduction
If water – one of the most important inputs in agricultural production – should become scarce, what would the impact be on a food-insecure country like Guatemala?
In recent years, shifts in precipitation and in water availability, along with increasing demographic pressures, have made the answer to this question particularly significant. Between 1950 and 2006, annual precipitation in Guatemala declined by 2.7 per cent, an effect which – combined with high deforestation – could worsen in the future (UNESCO, 2012).Footnote 1 At the same time, Guatemala's population grew at an annual rate of 2.0 per cent, one of the highest rates among countries in Latin America and the Caribbean (World Bank, 2016). That, in turn, places greater demands on food supply.
Guatemala is already facing food-insecurity challenges. Nationally, 46.5 per cent of children under five years of age live with chronic malnutrition, and the figure reaches 53 per cent in rural areas (MSPAS et al., 2016). As of 2015, 15.6 per cent of Guatemala's population lived below minimum dietary levels, an increase from 14.9 per cent in 1991 (UN, 2016), evidence that the situation is not improving.
Food insecurity is linked to low yields in the production of grains, low investment in technology, and high transaction costs for local markets, as well as low wages and a high percentage of low-skilled workers in rural areas. In fact, yields for grains average 2.1 tons per hectare in Guatemala, below the Latin American average of 2.9 and the world average of 3.3 (FAO, 2017). A third of Guatemala's labor force is employed in agriculture, though only 6.8 per cent of these workers have formal jobs; the agricultural sector, meanwhile, makes extensive use of unskilled labor (INE, 2011). Furthermore, a high percentage of Guatemala's grain supply is imported, making Guatemala vulnerable to increases in world prices. In 2010, for instance, Guatemala imported 99.7 per cent of its wheat, 69.5 per cent of its rice, and 21.3 per cent of its corn. Rosegrant et al. (Reference Rosegrant, Koo, Cenacchi, Ringler, Robertson, Fisher and Sabbagh2014) showed that prices for these commodities will increase by 88, 79 and 104 per cent respectively by 2050. The implications of these projections for grain supply and food availability in Guatemala are worrisome. Even with elevated percentages of grain imports, a large portion of the population in rural areas grow maize for own consumption or buy locally-produced corn because they are disconnected from larger distribution networks that carry imports. According to the Living Standards Measurement Study (INE, 2011), smallholder farmers produced an average of 1,950 kg of white corn each during the last harvest, of which they set aside an average of 663 kg, or 34 per cent, for their own families’ consumption. A total of 33 per cent of households in the country have some sort of agricultural production. Imports of this staple crop consist mainly of yellow sweet corn, which caters to a different target market of mainly urban consumers.
The main sources of water demand are agriculture, energy production, industries and human consumption. As the demand for water increases around the world, it is very likely that the availability of fresh water in many regions will decrease due to climate change. Global climate change is expected to exacerbate current and future stresses on water resources from population growth and land use and increase the frequency and severity of droughts and floods. It is anticipated that climate change will affect the availability of water resources through changes in rainfall distribution, soil moisture, glacier and ice/snow melt, and river and groundwater flows (UNESCO, 2013).
Scientists have largely explored the impact that climate change has on agriculture because ‘water-related hazards account for 90 per cent of every natural hazard and their frequency and intensity is generally rising’ (UNESCO, 2013). This means that spatial and temporal patterns of precipitation and water availability have been changing, and it implies more dry spells, droughts or floods across the world. These events could have socioeconomic effects as the increasingly erratic rainfall and high temperatures, among other factors, can significantly reduce food availability in low-latitude countries (IPCC, 2014).
In this paper, we focus on water availability for the agricultural sector because agricultural production is essential to ensure domestic food production. Climate variability may further restrict the supply of water to agriculture in light of Guatemala's insufficient investment in reservoirs and related infrastructure projects as well as its failure to protect natural areas that are important to fresh-water production. Between 1995 and 2014, Guatemala suffered more than most other countries from extreme weather events (Kreft et al., Reference Kreft, Eckstein, Dorsch and Fischer2015), which had and will continue to have an impact on agricultural yields. By 2030, corn yields are projected to vary between −6.7 and −3.8 per cent, bean yields from −6.9 to 1.5 per cent, and rice yields from −10.4 to −7.5 per cent (CEPAL, 2013).
Water-use regulation is lax in Guatemala, and public utilities and irrigation districts participate minimally in water supply, leaving various agents to procure water by private means, a process that means greater cost, greater uncertainty, and less efficient distribution. Vargas (Reference Vargas2009) shows that while 78 per cent of urban and 43 per cent of rural households in Guatemala are connected to a water distribution network, they faced 4 to 5 days of water scarcity per month in the national average (in some rural areas up to 8 or 9 days) and 5 per cent of connected households have to buy water from a water tanker truck. According to the Ministry of Agriculture (MAGA, 2013), 236,243 hectares of arable land have a high need for irrigation and 895,257 hectares of agricultural land have a medium need for irrigation.
Low precipitation in some seasons means that, during sustained dry periods, water must be drilled for, pumped, diverted, and transported, all of which are expensive. Industries such as agriculture that use water more intensively face an important economic decision: whether to continue production or reallocate labor and capital to other industries despite the resulting impact on food production. Water availability is, therefore, crucial to Guatemala's economic development. To evaluate the impact of water scarcity on the Guatemalan economy, we implemented a computable general equilibrium (CGE) model that incorporated details of Guatemalan agriculture to provide a multidimensional answer to the potential effects of water scarcity. The model's general-equilibrium specification reflects Guatemala's economic structure and captures interactions among producers and consumers in a market-based economy. We assess the potential effects of a drop in agricultural productivity as a result of climate change (first scenario) or a severe drought (second scenario).
In this paper, we contribute to the literature with evidence regarding the impacts of climate change-related shocks on food availability in a developing and food-insecure country such as Guatemala.
2. Literature review
According to a comprehensive study conducted in Guatemala (IARNA et al., 2015), food-security issues are a multidimensional problem, with various elements affecting food availability, access, and benefits.
Local researchers have not used CGE models to analyze the food-security situation, though non-CGE studies have been undertaken in the past (e.g. Palmieri and Delgado, Reference Palmieri and Delgado2011). CGE models can simultaneously evaluate various aspects of food-security problems, including food prices, income and expenditures, and the economy-wide implications of food policies (e.g. Rutten et al., Reference Rutten, Shuttes and Meijerink2013). In general, applications of CGE models to the Guatemalan situation have been few. Vásquez (Reference Vásquez, Vos, Ganuza, Lofgren, Sánchez and Díaz-Bonilla2008) applied an integrated macro-micro model to analyze Millennium Development Goals (MDG), and Cabrera and Delgado (Reference Cabrera and Delgado2010) implemented the Model of Exogenous Shocks and Economic and Social Protection (MACEPES) to analyze the impact of external shocks on poverty and inequality.
An increasing wealth of literature applies macro-models to assessments of climate change and food insecurity. Wiebelt et al. (Reference Wiebelt, Breisinger, Ecker, Al-Riffai, Robertson and Thiele2013), for example, examined local and global climate-change effects in Yemen, focusing on agricultural production, household income, and food security. They found that those hit hardest by losses were net buyers of food (even among food producers) and that, at the macro level, the positive effects of climate-change-mitigation efforts on yields and GDP were cancelled out by their cost. Montaud et al. (Reference Montaud, Pecastaing and Tankari2017) applied macro-modeling to the effects of climate variability on agriculture in Niger and found that, although GDP and other economic indicators would all be affected negatively, investments in rural road infrastructure and modern crop varieties could offset those effects in part. Sudarshan et al. (Reference Sudarshan, Naranpanawa, Bandara and Sarker2017) quantified the effects of climate change on the Nepalese economy, finding that the population's high dependence on subsistence farming increased poverty and further strained the social-welfare system. Finally, Sassi and Cardaci (Reference Sassi and Cardaci2013) assessed the impact of changes in rainfall patterns on food availability in Sudan, finding a reduction in cereal supply, marked cereal-inflation pressure, and income contraction, with greater negative effects on the poorest households and a country-wide deterioration of economic performance.
Traditionally, CGE models of water-resource issues have analyzed the effects of restricting water use in agriculture and transferring water to the environment or other industries. Water is normally included as a fixed share of the value of land (e.g. Seung et al., Reference Seung, Harris and MacDiarmid1997), or as a factor of production that is calculated together with land in a fixed ratio in assessing agricultural crops (e.g. Berck et al., Reference Berck, Robinson and Goldman1990).
Other studies have considered water a commodity provided by an industry, which transforms ‘raw’ water into treated form (Tirado et al., Reference Tirado, Clarke, Jaykus, McQuatters-Gollop and Frank2010; Juana et al., Reference Juana, Strzepek and Kirsten2011; Watson and Davies, Reference Watson and Davies2011); in these cases, the water industry is viewed as a productive activity that provides treated water to other industries. These approaches, however, require that most of a country's water use be accounted for in water titles registered and monitored by regulators or as transactions between the water-producing industry and other users. In the case of Guatemala, some titles exist, but they do not represent most of the country's water use, which is for the most part unregulated. We therefore turned to Banerjee et al. (Reference Banerjee, Cicowiez, Horridge and Vargas2016) and used an approach that links water used as an input to production with estimated changes in water stocks in a ‘satellite account’. This paper contributes to the application of these developments to the case of a vulnerable, food-insecure country like Guatemala.
3. Model and data
3.1 Model
We applied a version of the PEP 1-1 Model developed by Decaluwé et al. (Reference Decaluwé, Lemelin, Robichaud and Maisonnave2013) with extensions for the inclusion of water based on Banerjee et al. (Reference Banerjee, Cicowiez, Horridge and Vargas2016).Footnote 2
Certainly, modelling water in an economy-wide framework poses its own set of challenges, particularly in the case of non-registered water, which is water that is not distributed by a water utility company and is used primarily by the agricultural sector. In our extension PEP-1-1, it is assumed that water not supplied by the water utility company and not subject to an economic transaction has, initially, a price of zero. Then, depending on supply and demand conditions, the price of water can become greater than zero. Mathematically, equations (1)–(7) show the treatment for water used in agriculture in the extended PEP-1-1 model.
 $$\hbox{WATD}_j = i\hbox{wat}_j \cdot \hbox{XST}_j$$
 $$\hbox{PP}_j \cdot \hbox{XST}_j =\hbox{PVA}_j \cdot \hbox{VA}_j +\hbox{PCI}_j \cdot \hbox{CI}_j +\hbox{PWAT}\cdot \hbox{WATD}_j$$
 $$\sum_j \hbox{WATD}_j \le \hbox{wats}$$
 $$\hbox{PWAT} \ge 0$$
 $$\left(\sum_j \hbox{WATD}_j - \hbox{wats}\right) \hbox{PWAT} =0$$
 $$\hbox{YWAT} = \sum_j \hbox{PWAT}\cdot \hbox{WATD}_j$$
 $$\hbox{YIWAT}_{ag} = \hbox{shrywat}_{ag} \cdot \hbox{YWAT}$$
where
j: activities or industries with information on the use of unregistered water
CIj: total intermediate consumption of industry j
PCIj: intermediate consumption price index of industry j
PPj: industry j unit cost
PVAj: price of industry j value added
PWAT: water price
VAj: value added of industry j
WATDj: water demand
XSTj: total aggregate output of industry j
YIWATag: institutional income from water
YWAT: total income from water
iwatj: water consumed per unit of output in industry j
shrywatag: share of water income received by agent ag
wats: (exogenous) water supply
Equation (1) states that (unregistered) water use in agricultural – including crops and livestock – and non-agricultural sectors such as forestry and fishing is proportional to the corresponding output from agricultural sectors. Equation (2) shows the zero profit condition for the productive sectors, which includes payments for water used (see last term). Equations (3)–(5) represent the market equilibrium conditions in the unregistered water market. As shown, one of the following two situations can be observed: (i) water supply is larger than water demand and the price of water is zero, or (ii) water demand is equal to water supply and the price of water is positive.
In the case of Guatemala, given the available information in the Guatemalan System of Environmental–Economic Accounting (SEEA),Footnote 3 it is assumed that water supply is initially larger than water demand and the price of water is zero. Then, as water supply decreases in a drought scenario, restriction (3) becomes binding and the price of water becomes positive. In turn, a positive price of water generates a cost for producers and income for water owners, as shown in equations (6) and (7). In practice, this additional cost may represent a cost of extracting underground water.
In model calibration, we assumed that water-derived income is allocated across institutions in proportion to their ownership of land, which is determined by the exogenous shrywatag parameter in equation (7). Needless to say, income from water is added to other sources of institutional income. Besides, another effect resulting from reduction in water availability is a fall in total factor productivity (TFP).
At the macro level, our CGE model – like others – requires the specification of the equilibrating mechanisms (‘closures’) for three macroeconomic variables: government, savings-investment, and the balance of payments. In all simulations, the following macroeconomic closure rules are applied: (1) government consumption is adjusted to maintain a constant level of government savingsFootnote 4 and to reflect difficulties which, in the Guatemalan context, would entail passing tax reforms; (2) foreign savings (the negative of the current account deficit) are fixed in foreign currency, an outcome that is achieved through changes in the real exchange rate; and (3) real gross fixed capital formation is fixed, and household savings are adjusted accordingly. In addition, we assume that both labor and capital are perfectly mobile across sectors.
3.2 Data
The Social Accounting Matrix (SAM) used in this study was constructed using four sources of information: an existing SAM for 2011 (Escobar, Reference Escobar2015), Supply and Use Tables (SUT) from the Central Bank of Guatemala (BANGUAT) for 2011 (BANGUAT, 2011); the relative structure of remunerations of capital and land found on the GTAP database; and the 2011 Living Standards Measurement Study (LSMS), the Encuesta Nacional de Condiciones de Vida or ENCOVI (INE, 2011). The disaggregation of our Guatemalan SAM coincides with that of the rest of the model database and, as shown in table 1, consists of eight activities and 32 commodities. The factors are split into unskilled and skilled labor, (private) capital, and natural resources (two types: agricultural land and other natural resources used in forestry, fishing, and extractive industries).
Commodity and economic activity and transaction aggregation for the micro SAM

Source: Authors, with information from BANGUAT 2011.
Using the 2011 LSMS (ENCOVI), households were classified into four types: rural poor, rural non-poor, urban poor, and urban non-poor. Poverty was determined using the official 2011 poverty line (INE, 2011). Information from the household survey allowed us to estimate labor income, consumption, and most transfers from other agents, according to each household type.
Along with the SAM, we estimated: (a) base-year employment by sector, (b) base-year water use, and (c) a set of elasticities (for production, consumption, and trade). In order to estimate employment by sector, we used the LSMS (ENCOVI) 2011 to disaggregate by activity and labor category (skilled and unskilled).Footnote 5 Thus, given the use of physical labor quantities for model calibration, our model assumes that factor remuneration can differ across activities. In other words, each activity pays an activity-specific wage.Footnote 6 For water use, we extracted estimates from the Guatemalan SEEA. In the Guatemalan SEEA, water flow accounts quantify the abstraction of water from the environment to the economy, the water flow within the economy in terms of supply and use by industries and households, and water flow back to the environment.
In turn, income elasticities of demand were estimated using microdata from LSMS (INE 2011). For value-added elasticities, we used those provided by GTAP (Narayanan et al., Reference Narayanan, Badri and McDougall2012). Finally, for production and for Armington and CET elasticities, we used Annabi et al.'s (Reference Annabi, Cockburn and Decaluwé2006) estimates for economies similar to that of Guatemala in terms of GDP per capita.
3.3 Guatemala's economic structure
From the SAM,Footnote 7 we extracted key features of the Guatemalan economy that help clarify the results of our simulations. The services sector contributes to more than 65 per cent of GDP, followed by industry and agriculture (table 2). Crop production uses more than 21 billion cubic meters of water, followed by forestry and fishing with 930.9 million cubic meters. Livestock and other primary activities use less, with 111.8 and 5.4 million cubic meters of water, respectively.
Structure by sector (%)

Notes: VAshr, value-added share (%); PRDshr, production share (%); EMPshr, share in total employment (%); EXPshr, sector share in total exports (%); EXP-OUTshr, exports as share in sector output (%); IMPshr, sector share in total imports (%); IMP-DEMshr, imports as share of domestic demand (%).
Source: Authors#rsquo; calculations.
Food products (36.1 per cent) and other industries (15.4 per cent) make up the majority of exports. Coffee and bananas represent 9.2 per cent and 3.7 per cent of exports of agricultural products, respectively. A total of 68 per cent of coffee is exported (see table 2). The ‘other manufacturing’ category accounts for 80.2 per cent of total imports. Interestingly, the import-penetration rate is very high for cereals (more than 80 per cent). As a result of the importance of corn in the Guatemalan diet, it is important to emphasize that 29.4 per cent of the national consumption is covered by imports.
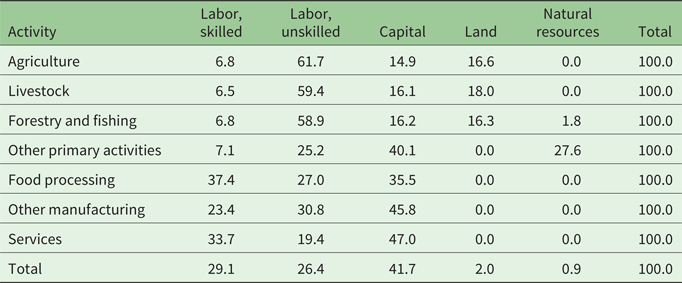
Table 3 shows the factor shares in total value-added by sector. For example, agriculture uses unskilled labor relatively intensively – 61.7 per cent of value-added represents payments to unskilled labor. In addition, agricultural sectors are obviously land users. On the other hand, manufacturing and services industries employ skilled labor relatively more intensively. In section 4, this information will be useful to analyze the results from the CGE simulations.
Factor intensity by sector (%)
Source: Authors' calculations.
Generally speaking, households draw their income from labor, capital, land, other natural resources, and transfers. Poor urban households mainly receive income from unskilled labor (47.9 per cent), with skilled labor and capital income making up the remainder. Almost two-thirds of poor rural household income comes from unskilled labor; the remainder comes from remittances and transfers from the government. For non-poor rural households, labor income accounts for 61 per cent of total income: 41 per cent for unskilled and 20 per cent for skilled labor. For this group of households, transfers from the rest of the world represent just under a quarter of their income. For urban non-poor households, capital income represents almost half their income, followed by skilled labor (30.3 per cent) and unskilled labor. Non-poor rural households are the main receivers of land income (40.4 per cent of total).Footnote 8 Remaining land income is distributed almost evenly across the other three household categories in the SAM.
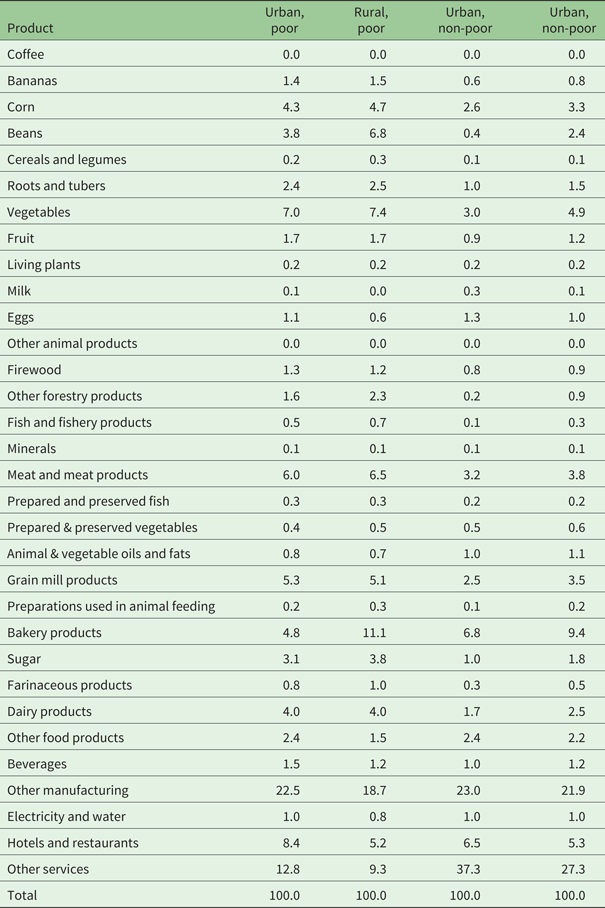
Urban non-poor households account for 59.5 per cent of national consumption, and rural non-poor households account for just under one-fifth (18.1 per cent). National consumption by poor households accounts for 22.4 per cent of domestic consumption: 7.8 per cent for households in urban areas and 14.6 per cent in rural areas. Rural poor households spend 62.1 per cent of their income on consumption. The distribution of spending is different across households as shown in table 4. Indeed, for non-poor households, the proportion of food consumption is lower, specifically for urban non-poor households, where it represents less than a third (31.1 per cent) of total consumption.
Consumption composition of each household group (%)
Source: Authors' calculations.
4. Scenarios and results
4.1 Scenarios
In the first scenario (named tfpagr), we analyzed results from a simulation of reduced agricultural production of crops and livestock as a result of climate change. ‘Climate change’ is intended here to include changes in mean temperature, variability of climate, extreme events, water availability, mean sea-level rise, pests, and diseases (Gornall et al., Reference Gornall, Betts, Burke, Clark, Camp, Willet and Wiltshire2010). Specifically, and according to CEPAL (2013) estimates, we assumed a negative scenario of climate change in which the production of grains was reduced in corn, in beans, and in wheat.Footnote 9 Technically, and due to the lack of better data, we estimated a scenario in which the TFP of total agriculture production dropped by around 8 per cent.Footnote 10 Specifically, this fall in TFP was estimated using the coefficients obtained in Letta and Tol (Reference Letta and Tol2016) for annual TFP growth rates and temperature changes in poor countries (table 7, page 34) combined with the variations reported in CEPAL (2013: 25–26).
In the second scenario (named drought), we simulated the effects of a drought that would reduce unregistered water availability for agricultural and non-agricultural activities by 25 per cent. In fact, according to estimates on the total renewable availability of water for Central America conducted by CEPAL (2011), in a scenario where the current trend of increasing emissions is maintained,Footnote 11 the temperature could increase between 3.6 and 4.7°C, with a regional average of 4.2°C. For Guatemala, this would mean a 25 per cent reduction in water availability by the year 2050. Unfortunately, information on total water is unknown for Guatemala. Thus, we assumed that total demand was close to 90 per cent of total supply in the base year. We also had no specific basis for estimating a change in water price because Guatemala does not currently have a market for this resource. The results indicate the likely effects of drought on economic activity, however.Footnote 12 Because of dependence on rainfall for irrigation and lack of investment in irrigation systems, both scenarios are highly relevant for Guatemala.
4.2 Results
In the first scenario, we assumed that climate change would have negative effects on agricultural productivity. As expected, under the climate-change scenario, we found negative results in production and exports of crops and livestock and in wages, as well as a drop of 1.2 per cent in real GDP (see tables 5 and 6). Moreover, a drop in production and consumption of agricultural goods and industrial foods increased food insecurity as measured by the value of food production and consumption (see figure 1 and table 7). Interestingly, in order to compensate for the decrease in TFP, employment in agriculture increased. As a result, given that agricultural production tends to use unskilled labor, we found that the decrease in wages was relatively larger for skilled than for unskilled workers. Lower productivity would translate into less competitiveness in international markets: goods such as corn, beans, and root and tuberous vegetables showed a lower decrease in output compared to exported products such as coffee, bananas, and fruit. Overall, exports would fall in real terms by 2 per cent, even though a depreciation of the real exchange rate would reduce negative effects.
Value-added by sector (percentage change from base)

Real macro-indicators (percentage change from base)

Notes: aIn this column, the unit is one million quetzales except for the real exchange rate, which is indexed to 1.
Source: Authors' calculations.
Exports and imports by product (percentage change from base)

Notes: *In this column, the unit is one million quetzales.
Source: Authors' calculations.
Food consumption by household category (percentage change from base)
Source: Authors' calculations.
In all cases, given the reduction of domestic output, demand for agricultural products would be partly covered by an increase in imports. In terms of food security (see figure 2), the tfpagr scenario showed an increase in the cereal imports dependency ratio.Footnote 13 In fact, at base-year prices, the share of imports in the overall consumption of cereals increased by 1.9 percentage points. Moreover, another food security indicator such as the value of food (excluding fish) imports over total merchandise exportsFootnote 14 also shows a negative behavior. Specifically, it increased from 16.7 in the base year to 17.0 in the tfpagr scenario.
Food security indicators (%)

As a result of the decrease in output, the simulation also showed a reduction in fiscal space. As a consequence, and given the clearing mechanism selected for the government budget, government expenditures would have to be reduced in view of lower tax revenues which, in turn, would make less income available to households and decrease consumption.
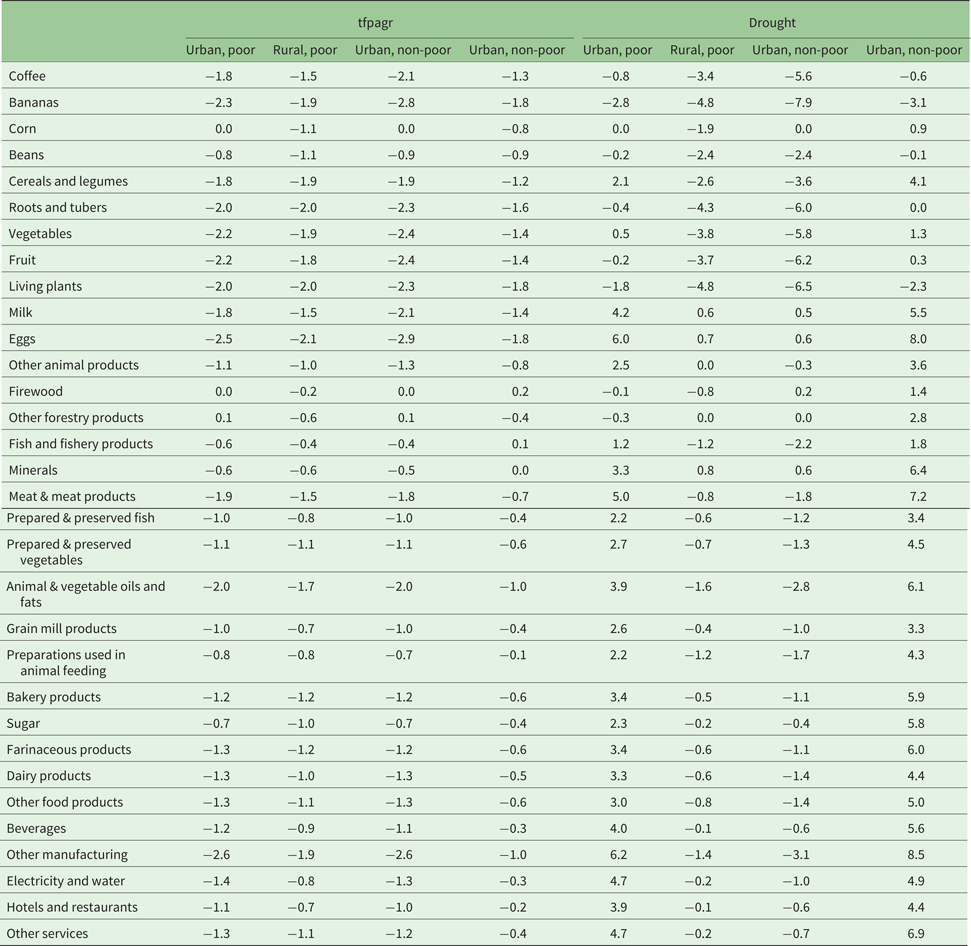
As a result of higher prices and lower household income, moreover, lower agricultural productivity translated into a decrease in consumption of agricultural goods for each household type (see table 7). Interestingly, corn consumption would only fall in rural areas; in urban areas, the demand for this product is inelastic. The results of this scenario could affect food security for Guatemala's most vulnerable citizens, however. The consumption of beans, which are also important to the Guatemalan diet, decreased for all types of households. Again, this behavior resulted from higher prices combined with a decrease in income for all household categories. In terms of income inequality, and given the change in factor incomes described above, urban households showed the largest drop in income (note, too, that urban households have a larger endowment of skilled labor).
In the second scenario, we assessed the effects of a water shortage or drought on agricultural and non-agricultural industries such as forestry and fishing. In our base-year data, water use was concentrated in forestry and fishing and in agriculture (59 per cent of total water use). Thus most negative effects of this shock would be concentrated in these labor-intensive activities. At the macro level, we noted positive effects on output and private consumption.
In this scenario, the decrease in agricultural output promoted the movement of labor out of agriculture (crops) and into activities with higher wages. Specifically, employment in overall agriculture decreased by 16.6 per cent while employment in manufacturing and services increased by 11.2 and 6 per cent, respectively. In addition, once water became scarce, its price became a positive number, also increasing the income of households endowed with land – particularly rural non-poor households. In addition, given the decrease in agricultural output as a result of the decrease in water availability, land rents decreased. Not surprisingly, we also observed a rise in the cost of agricultural production.
Compared to the TFP scenario, the negative effects of drought on forestry and fishing and on agriculture were greater (see figure 1). Additionally, livestock production rose because the use of water in this sector is lower than it is in agriculture. In base-year data, livestock production did not make significant use of waterFootnote 15; intuitively, then, as water became scarcer, there would be a shift toward industries with relatively lower water demands and a respective increase in value-added in those industries. In fact, land would also shift from crop production to livestock. As mentioned, this shock would be favorable to other industries and services that do not rely on water consumption.
In this scenario, we also observed a sharp increase in the prices of agricultural and food products, especially bananas, roots and tubers, and beans, because a small share of these products is imported and a low degree of substitution exists between local and imported goods. Given the decrease in domestic output of agricultural products, moreover, we also observed an important increase in imports of food products. Therefore, in terms of food security this scenario shows a significant increase in the share of agri-food consumption covered with imports. In fact, both food security indicators reported in figure 2 showed large increases. For instance, the cereal import dependency ratio increased from 40.9 in the base year to 51.2 in the drought scenario. In turn, the value of food imports over total merchandise exports increased by 1.1 percentage points.
Not surprisingly, agricultural exports also decreased. Thus, given their relevance as a source of foreign exchange (see table 2), we saw a depreciation of the real exchange rate required to maintain the current account balance fixed in foreign currency. In fact, given the substitution of imported food products for local ones, depreciation of the real exchange rate helped to contain increased demand for imports and improved the performance of exports for non-agricultural products (see table 7).
Overall, this scenario imposes considerable risk to food security of households that live in rural areas – i.e., to the population with the highest levels of poverty and malnutrition – who depend on their own production of food products. Indeed, our results show a decrease in food output combined with an increase in the relative price of food products.
5. Conclusions
There is consensus that climate change poses an imminent risk to development in countries around the world, but there are few analyses of its potential impact. This study provides some insights into the effects of climate risks for Guatemala. Specifically, we evaluated the impact that droughts would have on growth, household income, and food security, and we found that the most negative effects would be concentrated in agriculture because of its use of water. In fact, our results show a sharp increase in prices of agricultural and food products. Given the decrease in domestic output of food products, in addition, imports of food products would increase. Consequently, a drought scenario would impose considerable risks to food security.
In addition, we simulated a reduction in agricultural productivity related to climate change. In this case, we found negative results in production and exports of agriculture and a drop of 1.2 per cent in real GDP. Interestingly, employment in agriculture increased in order to compensate for the decrease in productivity. In turn, as a result of higher food prices and lower household income, indicators of food security deteriorated.
Our results also show the relevance of creating a legal framework to govern water resources. Guatemala could consequently draw from the experience of Australia which, because of its history of megadroughts, has reformed its water-distribution system. First, federal and state governments reached an agreement (the Intergovernmental Agreement on a National Water Initiative) to create a national water market. The idea behind this distribution system was that ‘water entitlements are expressed as a share of the available resource rather than as a specified quantity of water’ (Peel and Choy, Reference Peel and Choy2014).
In short, despite Guatemala's National Irrigation Policy, the framework is incomplete because no water-distribution system exists that prioritizes strategic economic activities as a guarantee of food security. Our results suggest the importance of correctly managing natural resources such as agricultural land and water. In fact, given Guatemala's large rural population, natural resources can support development and have a positive impact on the life of the country's citizens. Without proper policies, frameworks, and oversight, however, negative shocks arising from climate change have the potential to produce significant negative effects.
Acknowledgements
This work was carried out with financial and scientific support from the Partnership for Economic Policy (PEP), with funding from the Department for International Development (DFID) of the United Kingdom (or UK Aid), and the Government of Canada through the International Development Research Center (IDRC). We are grateful to Hélène Maisonnave for her comments and suggestions. The usual disclaimer applies.



