The journal Environment and Development Economics began operating in 1995; in a few months, it will complete 20 years of operation. It seemed appropriate to mark this occasion with a special issue of the journalFootnote 1 that would provide some perspective on the field, looking both backward at what has been achieved and forward to what lies ahead.
The literature on development and environment, both theoretical and empirical, that has been developed over the last 20 years is immense. There are a vast number of indices and stylized facts related to environment and development, ranging from traditional indicators such as GDP per capita, population and life expectancy statistics, to newer indicators such as human development indices, inclusive wealth and genuine savings, the environmental performance index, biodiversity metrics and temperature anomaly, to name just a few. Linking development and environment concepts and metrics, trying to develop meaningful relationships and to uncover the mechanisms underlying the processes characterizing the evolution of the coupled economy and environment, and designing policy to attain desirable targets have been the main objectives of the field for the last 20 years – and will likely continue to be – as the Forum and the papers in this special issue reveal.
Given the magnitude of the field, an in-depth discussion about development and environment within a 20-year span would be beyond the scope of this introduction to the special issue. It might, however, be desirable to put forward some observations that could help to put the discussion in this special issue into some context.
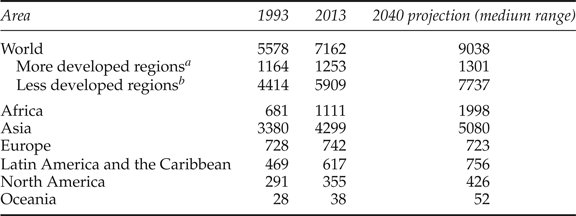
Let's start with population. Over the past 20 years, the global population has increased from 5.578 billion in 1993 to 7.162 billion in 2013 (table 1). The majority of this increase has been in the less developed regions of the world. Furthermore, United Nations (UN, 2013) population projections for 2040 indicate that the population of the less developed regions will continue to grow at a faster rate than that of the more developed regions. Table 1 shows the UN's medium-range projection for 2040; the low range scenario puts total population at 8.255 billion in 2040, while the high range projection sets it at 9.847 billion. Regardless, however, of whether the low, medium or high range projection is used, the proportion of the population located in today's less developed countries will continue to rise.
World population, 1993–2040 (in millions)

Notes: aMore developed regions comprise all regions of Europe plus North America, Australia/New Zealand and Japan.
bLess developed regions comprise all regions of Africa, Asia (excluding Japan) and Latin America and the Caribbean as well as Melanesia, Micronesia and Polynesia.
Source: Data from UN (2013).
It is also worth noting that the increase in population varies widely from continent to continent. Between 2013 and 2040, according to the medium range population projection, by far the largest percentage increase will take place in Africa, which will see its population increase by 80 per cent. The population will increase by over 22 per cent in Latin America and the Caribbean, by 20 per cent in North America and by 18 per cent in Asia. While there will be a large percentage increase in Oceania (37 per cent), the increase in absolute numbers is small. The population in Europe is projected to shrink by 2.5 per cent.
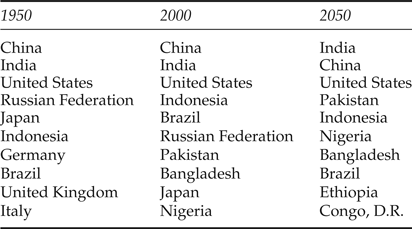
According to UN (2013) data, the developing world accounted for 79 per cent of the total population in 1993, 82.5 percent in 2013, and is expected to comprise 85.5 per cent of the world population in 2040. Table 2 reflects this same trend: in 1950, five of the 10 countries with the largest population belonged to today's developed countries group; by 2000, only two of the 10 were developed countries. By 2050, it is projected that nine of the 10 most populous countries will be from today's developing countries. Clearly this growth in population will put an additional strain on the resources of these countries.
Moving on to GDP per capita, perhaps the most widely used measure of economic growth, it can be seen in figure 1 that per capita income has increased significantly in both the lower income countries (LIC) and the lower middle income countries (LMC) over the past 20 years.Footnote 2 In the LIC, the group of poorest countries, per capita income measured in 2005 US$ rose from 271 in 1992 to 422 in 2012, an increase of 56 per cent. Over the same period, per capita income in the LMC rose even more, from 639 to 1220 (2005 US$), or more than 90 per cent.
GDP per capita (in constant 2005 US$) for low income countries (LIC) and lower middle income countries (LMC), 1992–2012
Using a somewhat different measure, the percentage of the population living on less than US$2 per day indicates that the percentage of the population below this ‘moderate’ poverty line dropped by 11 per cent in the LIC and 18 per cent in the LMC (figure 2) between 1990 and 2010. It should be noted that both the GDP per capita measure used in figure 1 and the US$2 per day measure used in figure 2 reflect more rapid improvement in the LMC countries than in the LIC countries.
Percentage of the population living on less than US$2 a day (PPP) (at 2005 international prices) in the low income countries (LIC) and lower middle income countries (LMC), 1990 and 2010
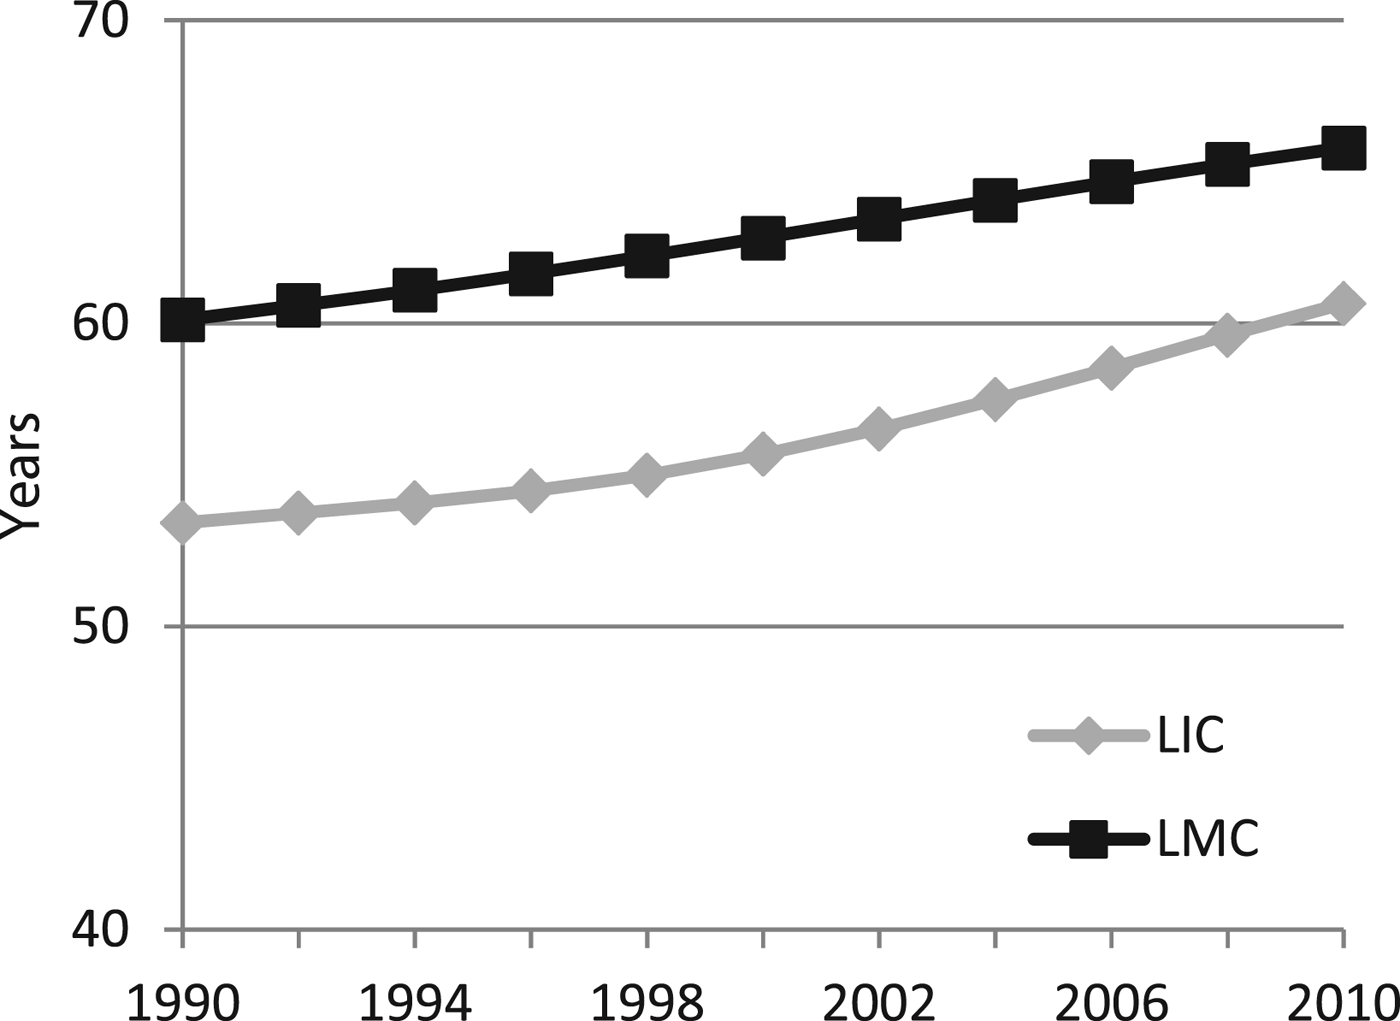
A similar trend, suggesting increased wellbeing in the LIC and LMC over the last 20 years, emerges if we look at some basic health and education statistics. According to the World Development Indicators compiled by the World Bank, from 1992 to 2012 the mortality rate of children under 5 years of age dropped by 46 per cent in the LIC and 49 per cent in the LMC (figure 3). Over basically the same period, life expectancy at birth rose by 7.2 years in the LIC and by 5.6 years in the LMC (figure 4), reinforcing the picture of improving health conditions.
Mortality rate, under 5 years of age (per 1,000 live births) for low income countries (LIC) and lower middle income countries (LMC), 1992–2012
Life expectancy at birth (years) in low income countries (LIC) and lower middle income countries (LMC), 1990–2010
It is interesting to note that, in terms of these two health-related measures, the LIC showed proportionately greater improvement than the LMC. At the same time as the mortality rate for children under 5 dropped considerably in both groups of countries, the gap between the two groups of countries (in terms of deaths per 1,000 live births) decreased from 47.5 in 1992 to 20 in 2012 (figure 3). Likewise, not only did the life expectancy in both groups of countries increase over the 20-year period, but the gap between the two groups of countries narrowed, from 6.7 years in 1990 to 5.1 years in 2010 (figure 4).
The picture of an improving health situation is supported by data on health expenditures over the past 16 years. From 1995 to 2011, per capita spending on health increased by more than 2.6 times in the LIC and by more than 2.7 times in the LMC (table 3). These health expenditures include the sum of public and private expenditures on the provision of health services (preventive and curative), family planning activities, nutrition activities and emergency aid designated for health, but not on the provision of water and sanitation.
Health expenditure per capita (in constant 2005 international $) in low income countries (LIC) and lower middle income countries (LMC), 1995–2011

Notes: Data are in international dollars converted using 2005 purchasing power parity (PPP) rates.
Source: Data from World Development Indicators, World Bank.
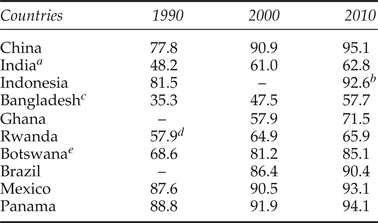
In terms of data regarding education, one measure is adult literacy, for which, however, uniform information is difficult to obtain. Nevertheless, data available from the UNESCO Institute for Statistics for some of the developing countries show that the literacy rates have increased considerably over the past 20 years (table 4). In India and Bangladesh, where the literacy rates were the lowest of the countries shown, literacy among the population aged 15 and older increased by nearly 15 per cent in India and over 22 per cent in Bangladesh from 1990 to 2010. In China the literacy rate rose by over 17 per cent. The countries where the literacy rate was already more than 80 per cent in 1990 (Indonesia, Mexico, Panama) had a literacy rate above 90 per cent by 2010. Literacy increased by 17.5 per cent in Botswana and by 8 per cent in Rwanda, while in Ghana the increase was more than 13 per cent in just the 10 years from 2000 to 2010.
Literacy rate (%) among the adult (15+) population in selected developing countries, 1990–2010
Notes: aThe three columns of data for India are from 1991, 2001 and 2006, respectively.
bData are for 2009.
cThe three columns of data for Bangladesh are from 1991, 2001 and 2011, respectively.
dData are for 1991.
eThe three columns of data for Botswana are from 1991, 2003 and 2011, respectively.
Source: Data from UNESCO Institute for Statistics, see http://data.uis.unesco.org/.
According to UNESCO (2013), adult literacy rates in 2011 were below 50 per cent in just 11 countries in the world: Benin, Burkina Faso, Chad, Ethiopia, Guinea, Haiti, Liberia, Mali, Niger, Senegal and Sierra Leone. Furthermore, in Central Asia, East Asia and the Pacific, and Latin America and the Caribbean, the average adult literacy rates were greater than 90 per cent.
Another measure of educational attainment, the percentage of students who complete primary school,Footnote 3 is presented in figure 5. The percentage of students in the LIC who completed primary school rose from 46 per cent in 1991 to 67 per cent in 2011. In the LMC the percentage increased from 71 to 91 per cent over the same period.
Percentage of students completing the last year of primary school in the low income countries (LIC) and lower middle income countries (LMC), 1991–2011
Comprehensive data about the percentage of students completing the secondary and tertiary educational levels are not available for the LIC and LMC, but enrolment data is. Figure 6 presents the gross enrolment ratioFootnote 4 at the secondary and tertiary, as well as primary levels. It can be seen that, although there was a considerable increase at all three levels of education for both groups of countries, the percentage of students enrolling in secondary school – let alone completing it – is only 42 per cent in the LIC and 61 per cent in the LMC.
School enrolment (% gross) for low income countries (LIC) and lower middle income countries (LMC), at the primary, secondary and tertiary levels, 1990–2010
The indicators presented above, although far from being conclusive or exhaustive, seem to reflect an improving picture in the LIC and the LMC in terms of GDP per capita, poverty level, and certain health and education measures. We know, however, that statistics based on GDP per capita do not reflect the use and the depletion of environmental resources. Furthermore, the expected population growth over the next 20–30 years (shown in table 1) can be expected to increase pressures on the environment. Thus a crucial question which emerges relates to the status of the environment over the last 20 years and its relationship to the evolution of the economy.
This brings us to the heart of the matter and the objective of this special issue. What have we learned over the last 20 years about the coupled economy and environment? What has been effective and what has not? What are the success stories and the new challenges? What are the areas that require our attention?
Statistics and stylized facts regarding the environment are again immense in volume and diversity and in many cases can be difficult to interpret. For the purposes of this introduction, we will look at some global environmental trends and issues just as we looked at some broad economic and social indicators above. These issues are among the main areas where the economy and the environment interact and co-evolve. Thus, one can think of a co-evolutionary process between the economy and the environment through which global environmental issues are transformed into impacts on regional and local economies and environmental systems. Economic and environmental policies at the corresponding geographical scale affect this process and shape its impacts on the developing world.
Among the environmental issues that can be regarded as important factors in a co-evolving economic/environmental system, one can include climate change, and the state of ecosystems and the services they provide, which can be broken down into specific resource availability and resource management issues, biodiversity and species extinction.
Regarding global warming and climate change, data on the temperature anomaly from 1991 to 2013 are presented in figure 7. The temperature anomaly indicates how much warmer or colder it is than normal for a particular place and time. The NASA Goddard Institute for Space Studies (GISS) data presented in figure 7 defines normal as the average over the 30-year period 1951–1980. A recent report from NASA (2014) finds that the average global temperature in 2013 was 14.6°C, which is 0.6°C warmer than the mid-20th century baseline. Furthermore, according to Climate Change 2013: The Physical Science Basis. Contribution of Working Group I to the Fifth Assessment Report of the Intergovernmental Panel on Climate Change for the period 2016–2035, ‘the projected change in global mean surface air temperature will likely be in the range 0.3 to 0.7°C (medium confidence)’ (Kirtman et al., Reference Kirtman, Power, Adedoyin, Stocker, Qin and Plattner2013: 955).
Combined land-surface air and sea-surface water temperature anomaly (in °C) (Global Land-Ocean Temperature Index, base period 1951–1980), monthly mean 1991–2013
Carbon dioxide, a greenhouse gas that traps heat, plays a major role in changes to the Earth's climate. As we can see from figures 8 and 9, over the last 20 years the LIC have contributed minimally to total carbon dioxide emissions in the world, whether these emissions are measured in terms of per capita emissions or total emissions. Nevertheless, the LIC are expected to suffer substantial damages from climate change while having a relatively small capacity for adaptation.
Emissions of carbon dioxide (in metric tons per capita), 1990–2010
Emissions of carbon dioxide (in kt), 1990–2010
An important issue regarding the state of the environment is its spatiotemporal evolution. Climate change, resource depletion and the interaction between the economic and environmental systems induce tipping points, which are points where changes in the functioning of ecosystems will produce important impacts on the provision of ecosystem services and biodiversity at a local, regional or a global scale. The distribution of these tipping points across the globe, which is shown in figure 10, provides an indication of the extent of their possible impact throughout the world. It should be noted that these tipping points are in general induced by economic policies related mainly to harvesting, land use, resource exploitation and energy use, which influence ecosystems at the various geographic scales.
Map of the tipping points of global importance
According to a technical report for Global Biodiversity Outlook 3, ‘Global biodiversity models project that terrestrial species extinctions, loss of natural habitat, and changes in the distribution and abundance of species, species groups and biomes will continue throughout this century, with land use change being the main threat in the short term, and climate change becoming progressively much more important over the next several decades’ (Leadley et al., Reference Leadley, Pereira, Alkemade, Fernandez-Manjarres, Proenca, Scharlemann and Walpole2010: 11).
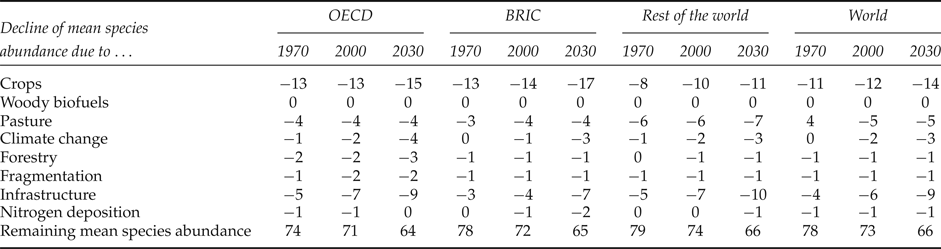
With respect to biodiversity, according to the Background Report to the OECD Environmental Outlook to 2030, the loss of biodiversity (expressed in terms of mean species abundance, MSA) in natural biomes started many centuries ago, with the strongest declines occurring in the temperate tropical grasslands and forests. The remaining biodiversity is found more and more in biomes that are less suitable for human development, such as desert, tundra and polar biomes (Netherlands Environmental Assessment Agency and OECD, 2008). The report projects further biodiversity loss, with the remaining MSA at the world level dropping from 73 per cent in 2000 to 66 per cent in 2030 and to 62 per cent in 2050, in relation to the OECD baseline (Netherlands Environmental Assessment Agency and OECD, 2008: 66).
Agricultural land use (crops and pastures) remains the largest of all pressure factors on biodiversity (table 5). Other major contributors to biodiversity loss between 2000 and 2030 are expanding infrastructure and climate change. As shown in table 5, biodiversity loss for the OECD, BRIC and Rest of World groups is similar to that of the World average. However, there are strong differences in biodiversity levels between regions within the groups, both in the rate of decline and in the breakdown over the various stress factors (Netherlands Environmental Assessment Agency and OECD, 2008).
Remaining biodiversity levels and contribution of various pressures, baseline
Source: Netherlands Environmental Assessment Agency and OECD (2008), OECD Environmental Outlook modelling suite, final output from IMAGE cluster.
The changes mentioned above are predominantly global changes which, however, are expected to have important effects on the developing world, along with the more localized impacts on environmental resources at the regional or the country level.
In this special issue, we begin with a Forum in which 20 economists who have made significant contributions to the field were asked to answer one of the following questions:
• In your opinion, what is the single biggest accomplishment of the field of environment and development economics over the past 20 years?
• What do you consider to be the biggest obstacles faced by the field of environment and development economics over the past 20 years?
• There is ongoing concern about the extent to which research in environment and development economics makes an impact on real world decisions. What do you see as some ways of maximizing the impact of environment and development economics research on policy decisions?
• What advice would you give today to a graduate student considering a career in the field of environment and development economics? How does this advice differ from advice you would have given 20 years ago?
• What do you believe to be the area of environment and development economics which holds the most promise for future research?
• What are the factors that led you to go into environment and development economics? If you were starting your career today, would you do anything differently?
• What do you consider to be some important research questions in environment and development economics that haven't received adequate attention?
Their short essay answers not only reflect the diverse range of issues which the field encompasses, but also identify issues that will undoubtedly be important areas for future research.
Next follows an article by Charles Perrings, one of the founders and the first Editor of EDE. Perrings considers how research on the relation between environmental change and economic development has evolved over the last two decades by focusing on a central question addressed by the field: that is, the impact of non-marketed environmental resource use on income and growth, and the institutional response to the threat which this poses. He organizes his discussion around four broad areas: poverty, population and common pool resources; the valuation of non-marketed environmental assets and the development of inclusive wealth accounts; market failure and the internalization of environmental externalities; and the provision of environmental public goods.
The issue concludes with an article that is co-authored by 11 people, all of whom are involved with the Environment for Development (EfD) initiative. In this article, they review the history and objectives of EfD and the network of research centers that was created as a response to capacity, knowledge, communication and institutional gaps in the developing world. More specifically, the centers were created to enhance the efforts of environmental and resource economists from the developing world – who studied environmental economics at the Environmental Economics Unit of the University of Gothenburg, supported by Sida's capacity building program, and then returned home – to successfully apply their acquired knowledge and expertise to carry out policy-relevant research, to teach the next generation of academics and civil servants, and to provide advice to their governments. Case studies are presented from the seven EfD centers that exemplify their mission and activities and make clear the important message that emerges from EfD's experience: that it is possible to promote development and poverty alleviation in ways that do not destroy but instead help to sustain the ecosystems on which we depend.
Environment and development economics faces the difficult but extremely important task of studying the links and interactions between the economy and the environment, in the hopes of designing policies that will keep the coupled system on a desirable sustainable path. We hope that this special issue constitutes a contribution to this objective.