


Background
Global patterns in mental health: Prior to the COVID-19 pandemic, there were many global indications that mental health trends were changing over time, though these changes seemed to differ by age and sex. For example, in the United Kingdom, the incidence of mood and anxiety disorder diagnoses increased from 2000 to 2020, though the greatest increases were observed amongst the youngest age group (Dykxhoorn et al., Reference Dykxhoorn, Osborn, Walters, Kirkbride, Gnani and Lazzarino2024). This age pattern was similarly identified by an administrative data analysis in Denmark (Plana‐Ripoll et al., Reference Plana‐Ripoll, Momen, McGrath, Wimberley, Brikell, Schendel, Thygesen, Weye, Pedersen, Mors, Mortensen and Dalsgaard2022). In a US study of adolescents, the prevalence of depression and anxiety disorders increased in both sexes from 2009 to 2019, though this increase was greatest in females (Daly, Reference Daly2022). Similarly, meta-analytic evidence from young people in Norway showed worsening scores on mental disorder symptom rating scales from 1992 to 2019, but primarily in young females (Potrebny et al., Reference Potrebny, Nilsen, Bakken, von Soest, Kvaløy, Samdal, Sivertsen, Aase and Bang2025). Taken together, this global evidence suggests similarities of age- and sex-specific trends in mental health across many developed nations prior to COVID-19.
Trends in Canadian mental health prior to COVID-19: In a Canadian context, previous epidemiological analyses had found mental disorder prevalence to be relatively stable until 2012 (Patten et al., Reference Patten, Williams, Lavorato, Fiest, Bulloch and Wang2015). However, an Ontario administrative data analysis identified increases in the prevalence of diagnosed mood and anxiety disorders in youth from 2012 to 2017 (Phillips and Yu, Reference Phillips and Yu2021). These findings were reaffirmed by a study assessing Canadian survey data that found increases in negative self-perceived mental health and diagnosed mood and anxiety disorders in 12- to 24-year-olds from 2011 to 2018 (Wiens et al., Reference Wiens, Bhattarai, Pedram, Dores, Williams, Bulloch and Patten2020). Recently, a Statistics Canada analysis found substantial increases in the prevalence of generalized anxiety disorder, major depressive episode and bipolar disorder from 2012 to 2022 in those aged 15–24 years, primarily in young women (Stephenson, Reference Stephenson2023). Thus, young Canadians may have experienced a worsening of mental health after 2010, especially in young females, though the subsequent onset of the COVID-19 pandemic may have further complicated trends.
Mental health evidence during COVID-19: Early-pandemic estimates of mental health showed increases in both anxiety and depression symptoms compared to pre-pandemic estimates (Gouin et al., Reference Gouin, MacNeil, de la Torre-Luque, Chartrand, Chadi, Rouquette, Boivin, Côté and Geoffroy2023). Young people and young women may have disproportionately experienced worsening mental health during the pandemic, as established by several Canadian studies (Bulloch et al., Reference Bulloch, Zulyniak, Williams, Bajgai, Bhattarai, Dores, Lukmanji, Pham, Wiens and Patten2021; Rao et al., Reference Rao, Dimitropoulos, Williams, Sharifi, Fahim, Munir, Bulloch and Patten2024). Internationally, adolescent hospitalizations for mental disorder increased during COVID-19, with one Spanish study identifying a trend of decreasing mean age for mental health hospitalization from 2000 to 2021 (Soriano et al., Reference Soriano, Ramos, López-Ibor, Chiclana-Actis, Faraco, González-Cabrera, González-Fraile, Mestre-Bach, Pinargote, Corpas, Gallego, Corral and Blasco-Fontecilla2025). It has been hypothesized that the age-of-onset of most mental disorders, coupled with societal disruptions associated with the pandemic, may have exacerbated negative mental health symptoms in young people (Généreux et al., Reference Généreux, Schluter, Landaverde, Hung, Wong, Mok, Blouin-Genest, O’Sullivan, David, Carignan, Champagne-Poirier, Pignard-Cheynel, Salerno, Lits, D’Haenens, Coninck, Matthys, Champagne, Burlone, Qadar, Herbosa, Ribeiro-Alves, Law, Murray, Chan and Roy2021). Despite early evidence, a recent meta-analysis on longitudinal Canadian mental health findings in those under age 25 during COVID-19 reported substantial heterogeneity (Geoffroy et al., Reference Geoffroy, Chadi, Bouchard, Fuoco, Chartrand, Loose, Sciola, Boruff, Iyer, Sun, Gouin, Côté and Thombs2024). In fact, multiple meta-analyses have highlighted heterogeneity and bias in much of the mental health literature emerging from the pandemic (Nieto et al., Reference Nieto, Navas and Vázquez2020; Salanti et al., Reference Salanti, Peter, Tonia, Holloway, Darwish, Kessler, White, Vigod, Egger, Haas, Fazel, Herrman, Kieling, Patel, Li, Cuijpers, Cipriani, Furukawa and Leucht2024), raising questions about the true longitudinal impacts of COVID-19 on mental health.
Little evidence exists that assesses mental health beyond the acute phases of COVID-19. Of the few analyses using more recent data, a Finnish study of youth saw some increases in depression and anxiety symptoms in boys from 2019 to 2021, but larger incremental increases in girls from 2019, 2021 and 2023 (Kiviruusu et al., Reference Kiviruusu, Ranta, Lindgren, Haravuori, Silén, Therman, Lehtonen, Sares-Jäske, Aalto-Setälä, Marttunen and Suvisaari2024). Further, an interrupted time series analysis of young people under 25 years of age from France identified increases in female mental health consultations, hospitalizations and some psychiatric prescriptions after COVID-19 when compared to prior trends (Fond et al., Reference Fond, Pauly, Brousse, Llorca, Cortese, Rahmati, Correll, Gosling, Fornaro, Solmi, Smith, Veronese, Yon, Auquier, Duclos and Boyer2025). Contradictory trends were identified in Iceland, finding a reduction in depression symptoms among adolescents in 2023 when compared to estimates during the pandemic, especially among girls (Haskell et al., Reference Haskell, Sigmarsdottir, Thorisdottir, Valborgarson, Aparicio, Kiviruusu, Suvisaari, Chang, Ystrom, Butwicka, Asgeirsdottir, Valdimarsdottir, Sigfusdottir, Allegrante and Halldorsdottir2025). This continued heterogeneity could be a result of diverse measures of mental health (i.e. self-reported diagnoses, diagnostic codes, etc.), limiting the comparability of findings across studies, but also suggests that mental health trends beyond COVID-19 are not well understood. Moreover, no evidence has assessed recent trends in middle- or older-aged adults.
Considering the heterogeneity of existing literature and gaps in recent evidence, this analysis aimed to provide a long-term assessment of Canadian mental health, using age- and sex-specific prevalence estimates and comparing several diverse mental health outcomes (i.e. diagnosed disorders, symptom-related indicators and perceived mental health) from 2002 to 2024. The primary hypothesis was that there may be increased reporting of poor mental health through 2020 and 2021, though these increases were expected to stabilize after 2022. Additionally, it was hypothesized that differences would be observed between the trend patterns of individual outcomes in their representation of distinct mental health concepts, such as factors related to diagnosis, compared to symptoms of mental disorder and personal perceptions.
Methods
Data description
Target population: The Canadian Community Health Survey (CCHS) is an annual cross-sectional survey conducted by Statistics Canada that aims to collect health information on individuals over age 12 residing in private dwellings in Canada (Statistics Canada, 2007). Additional details regarding CCHS sampling, collection methods, survey redesigns and weighting are provided in Appendix A. Mental health-specific surveys conducted by Statistics Canada in 2002, 2012 and 2022 were also utilized by this analysis.
Mental health outcomes
Diagnosed mood and anxiety disorder: Diagnosed mood and anxiety disorder questions were asked of all survey respondents. Below is an example of the mood and anxiety disorder questions from the CCHS, to which respondents answered either ‘yes’ or ‘no’.
‘… We are interested in ‘long-term conditions’ which are expected to last or have already lasted 6 months or more and that have been diagnosed by a health professional.’
‘Do you have a mood disorder such as depression, bipolar disorder, mania or dysthymia?’
‘Do you have an anxiety disorder such as a phobia, obsessive-compulsive disorder or a panic disorder’
Depression symptom rating scales: From 2003 to 2014, the CCHS utilized the World Health Organization’s Composite International Diagnostic Interview Short Form for Major Depression (CIDI-SFMD), though surveys from 2015 and onwards offered the 9-item brief Patient Health Questionnaire (PHQ-9), instead. Both depression symptom rating scales provided estimates of past major depressive episode (MDE), and resultant scores were dichotomized for use in this analysis.
The 2002, 2012 and 2022 mental health-specific surveys also included a Canadian adaptation of the fully structured World Mental Health CIDI, providing estimates of past 12-month major depressive disorder (MDD). Additional details about these measures, including validation of cut-off scores, are provided in Appendix B.
Self-perceived mental health: The perceived mental health question asks, ‘In general, would you say your mental health is …?’ and respondents are given categories ‘excellent’, ‘very good’, ‘good’, ‘fair’ and ‘poor’ to answer. An indicator variable for self-perceived mental health was created, dichotomizing responses to ‘excellent/very good/good’ and ‘fair/poor’.
Demographics
Sex: Respondent sex as assigned at birth was collected as ‘male’ or ‘female’ for all CCHS surveys. Sex differences in mental disorder prevalence, particularly with depression (Kuehner, Reference Kuehner2003) and anxiety (Pigott, Reference Pigott1999), have long been documented and justify the stratification by sex used throughout this analysis.
Age: Respondent age, in years, was collected and categorized as follows: adolescent and young adult (12–29 years), middle-aged adult (30–64 years) and older adult (65+ years). These age categories were selected to be as broad as possible in optimizing statistical power, while still capturing differences between distinct life stages previously shown to impact mental disorder diagnosis and reporting (Ran et al., Reference Ran, Yang, Gou, Jiang, Zhou, Liu, Li and Kuang2025).
Statistical analysis
Mental health prevalence estimates, meta-analysis and meta-regression: All statistical analyses were completed in STATA 18 (StataCorp LLC 2023). Bootstrap-weighted prevalence estimates and associated 95% confidence intervals (CIs) for diagnosed mood disorder, diagnosed anxiety disorder, CIDI-SFMD/PHQ-9-indicated MDE and self-rated mental health were calculated in each available iteration of the CCHS from 2002 to 2024. Further, each outcome’s prevalence was estimated in age- and sex-stratified CCHS samples to generate age-by-sex-specific estimates over time. Resultant stratified prevalence estimates were assessed for heterogeneity across yearly surveys using random-effects meta-analysis models, generating forest plots and calculating τ2 and I 2 indicators. In the instance of substantial heterogeneity, meta-regression methods were applied to each outcome’s age-sex stratified grouping to identify whether this heterogeneity could be better explained by estimating changes over time. Meta-regression models with quadratic indicator terms for survey year were employed to assess the potential non-linearity of identified trends. In the absence of statistical significance at an alpha of 0.05, quadratic terms were removed to estimate simple linear trendlines. The most appropriate meta-regression models were then used to generate predicted trendlines for each respective age-by-sex group. For depression symptom rating scales, CIDI-SFMD and PHQ-9 indicators were analysed separately during meta-regression modelling because of their conceptual heterogeneity, but results were presented together for ease of comparison.
Results
Characteristics of utilized CCHS iterations are displayed in Appendix C. Notably, Table C1 shows decreasing CCHS response rates from 2003 to 2024, with the lowest response rates observed during the COVID-19 pandemic.
There was substantial heterogeneity observed in all random-effects meta-analysis models, across all outcomes and age-/sex-stratifications. I 2 values from these models ranged from a minimum of 83% to a maximum of over 99%. Observed increasing trends of diagnosed mood and anxiety disorder, CIDI-SFMD/PHQ-9-indicated MDE, and fair/poor self-perceived mental health prompted the use of meta-regression to explore this resultant heterogeneity. Weighted age-by-sex-specific prevalence estimates, and accompanying predicted trendlines are presented in figures. Meta-regression coefficients, associated p-values and other modelling specifications can be found in Appendix D.
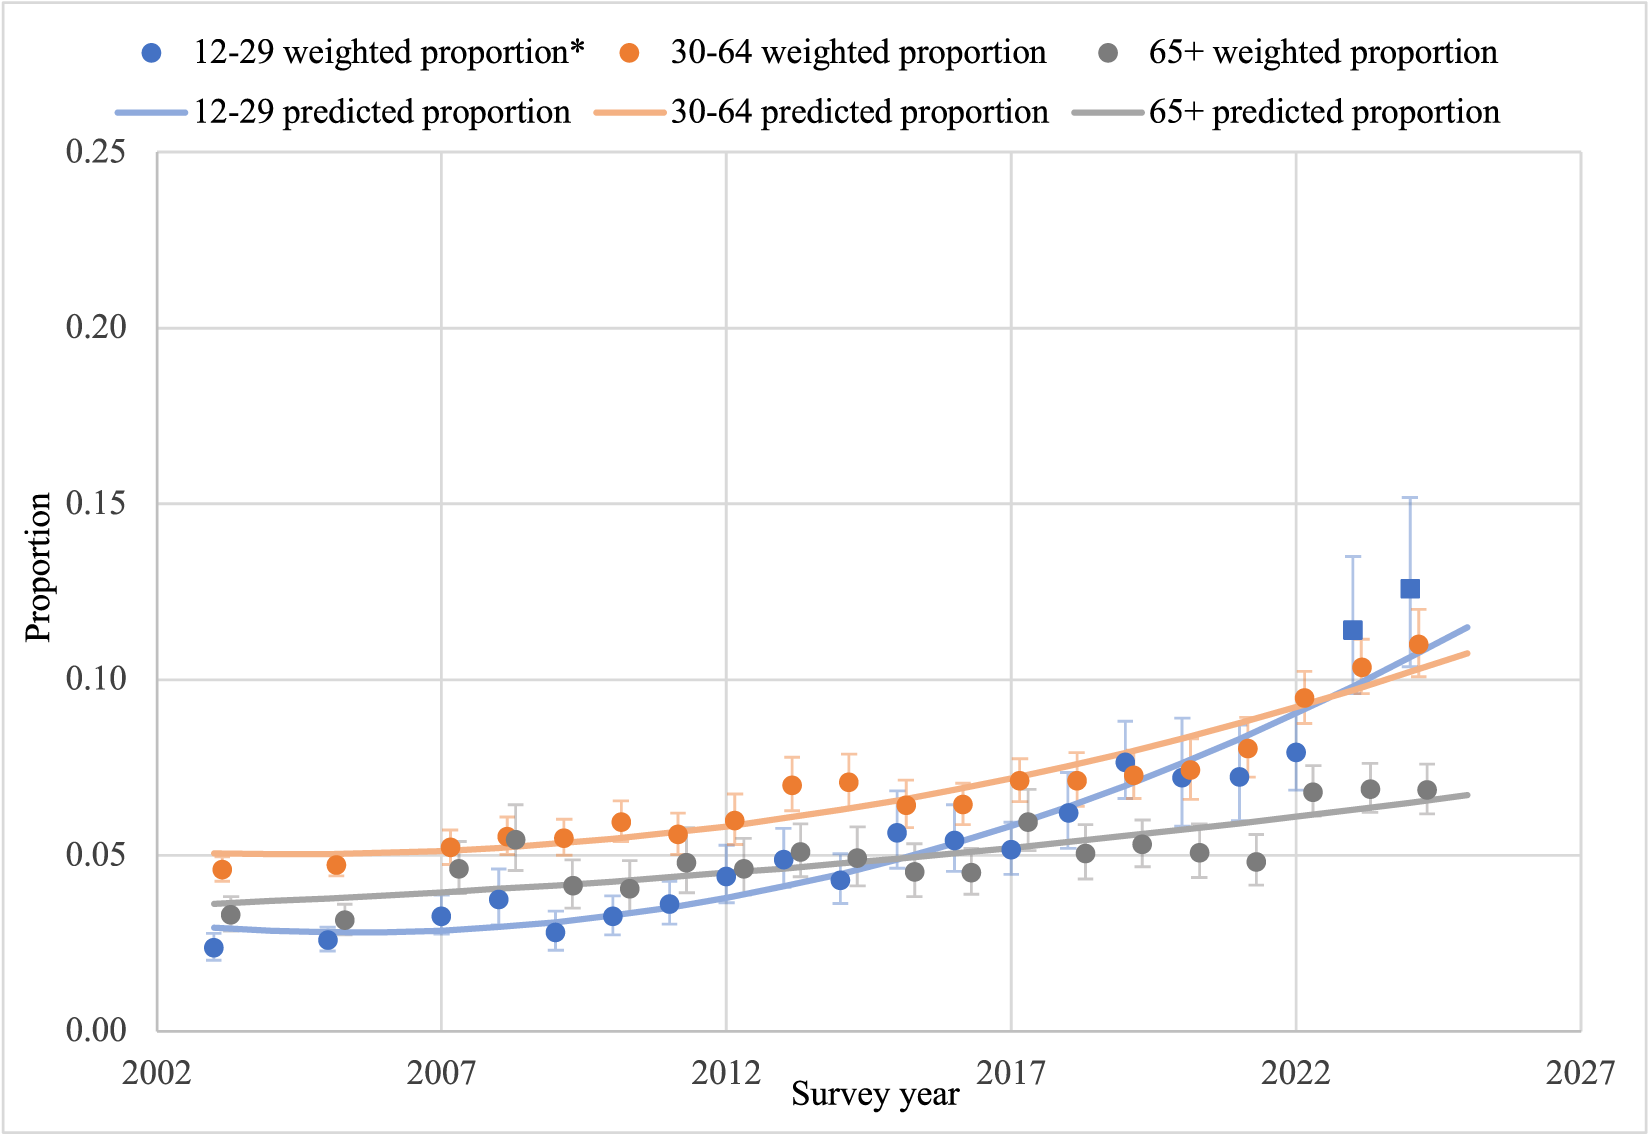
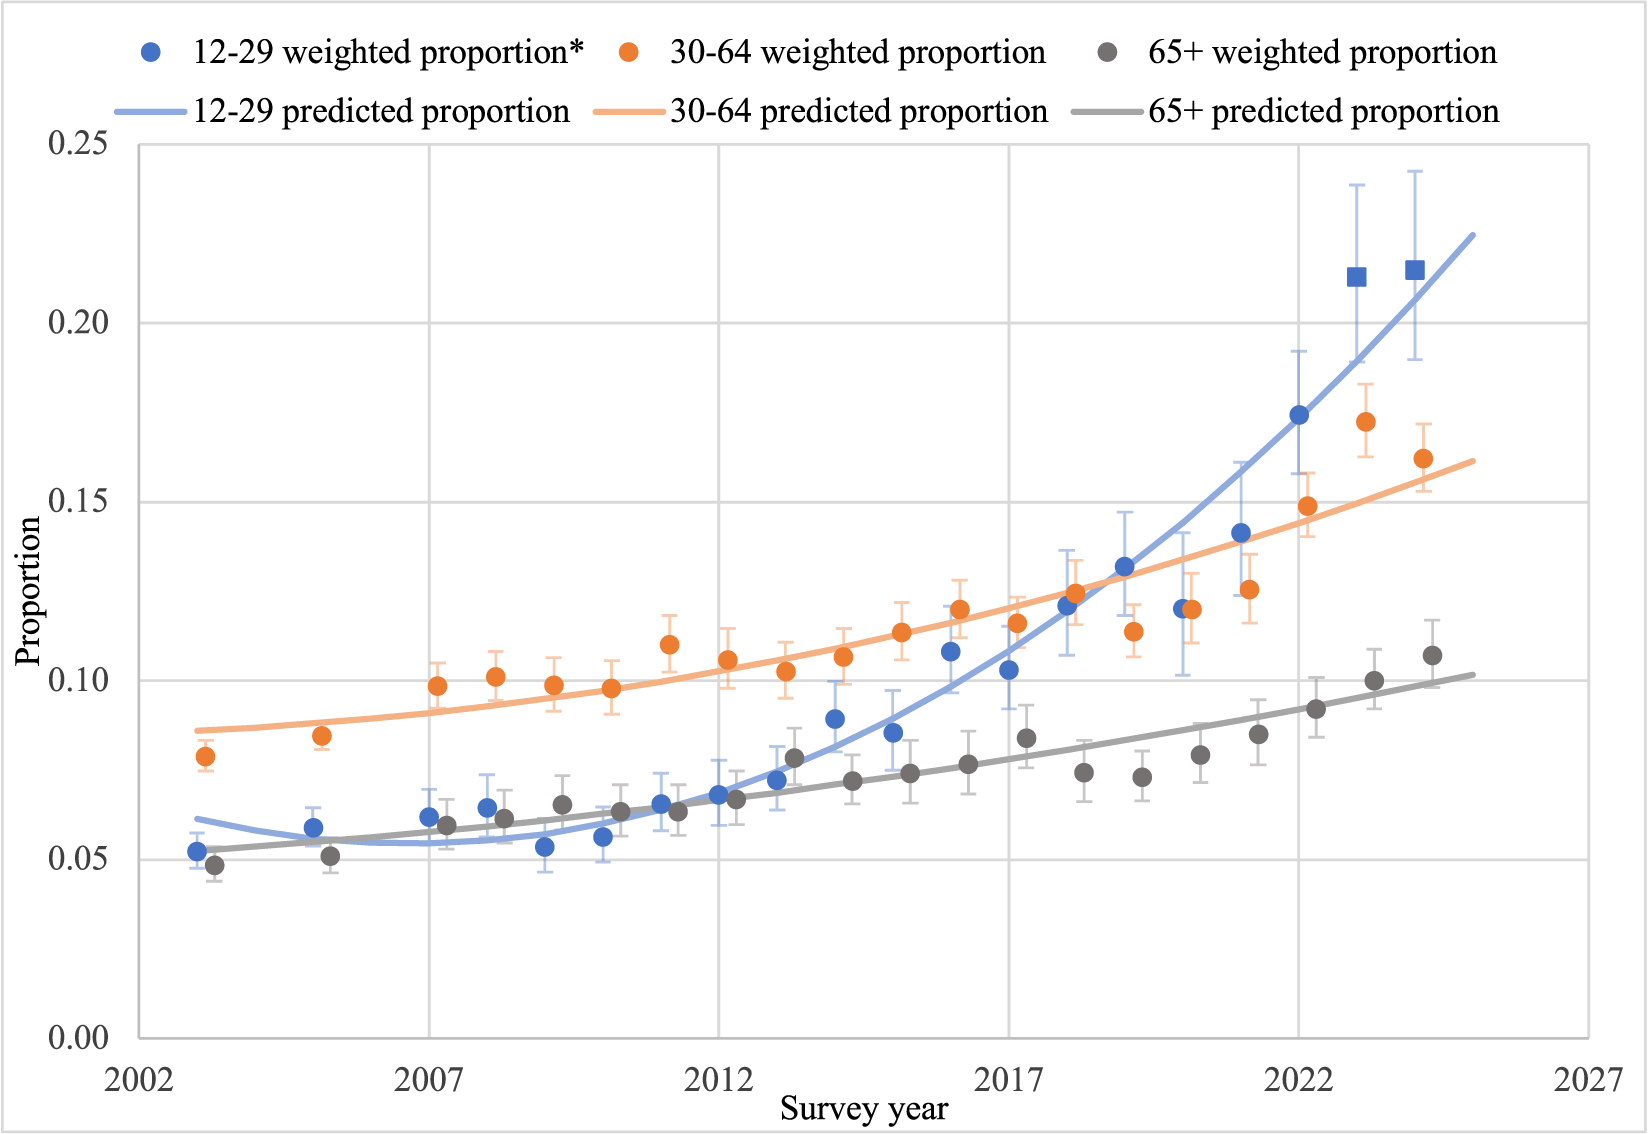
The prevalence of self-reported diagnosed mood disorder in young males increased from 2.37% (95% CI: 2.03, 2.78) in 2003 to 12.58% (95% CI: 10.37, 15.19) in 2024, as seen in Fig. 1. Similarly, Fig. 2 shows the youngest aged females as having substantial increases in their prevalence of diagnosed mood disorder, from 5.23% (95% CI: 4.76, 5.74) in 2003 to 21.49% (95% CI: 18.97, 24.24) in 2024. Though absolute differences in mood disorder prevalence from 2003 to 2024 are greater for young females when compared to males (16.26 percentage points versus 10.21 percentage points, respectively), the relative increase in prevalence is greater for males (5.29 times) when compared to females (4.11 times). Middle-aged and older adults of both sexes saw less dramatic increases in their prevalence of diagnosed mood disorder from 2003 to 2024, as evidenced by Figs. 1 and 2. The quadratic survey year terms for meta-regression models in both young males and females had p-values <0.001, as seen in Table D1, indicating curvilinear trendlines. Further, both meta-regression models yielded R 2 values of over 98%, accounting for much of the heterogeneity present in initial random-effects models. Similar curvilinear trends were identified in middle-aged adults, though older adults of both sexes had non-significant quadratic survey year terms at an alpha of 0.05, signalling that trends were better explained by linear predictors. Thus, older adult males had an increase of 0.14% (95% CI: 0.10, 0.18; p < 0.001) in the predicted prevalence of diagnosed mood disorder per year, while females of this age group had a 0.22% (95% CI: 0.19, 0.26; p < 0.001) yearly predicted increase.
Bootstrap weighted proportion estimates and predicted proportion trendlines of diagnosed mood disorder in males of the CCHS, by age category.

Figure 1 Long description
Legend: 12 dash 29 weighted proportion asterisk, 30 dash 64 weighted proportion, 65 plus weighted proportion, 12 dash 29 predicted proportion, 30 dash 64 predicted proportion, 65 plus predicted proportion. Horizontal axis label: Survey year. Range: 2002 to 2027. Vertical axis label: Proportion. Range: 0.00 to 0.25. 12 dash 29 weighted proportion asterisk coordinate pairs: (2003, 0.02), (2004, 0.02), (2007, 0.03), (2008, 0.04), (2009, 0.03), (2010, 0.03), (2011, 0.04), (2012, 0.04), (2013, 0.05), (2014, 0.04), (2015, 0.06), (2016, 0.05), (2017, 0.05), (2018, 0.06), (2019, 0.08), (2020, 0.07), (2021, 0.07), (2022, 0.08), (2023, 0.11), (2024, 0.12). 30 dash 64 weighted proportion coordinate pairs: (2003, 0.05), (2005, 0.05), (2007, 0.05), (2008, 0.06), (2009, 0.06), (2010, 0.06), (2011, 0.06), (2012, 0.06), (2013, 0.07), (2014, 0.07), (2015, 0.06), (2016, 0.06), (2017, 0.07), (2018, 0.07), (2019, 0.07), (2020, 0.07), (2021, 0.08), (2022, 0.09), (2023, 0.10), (2024, 0.11). 65 plus weighted proportion coordinate pairs: (2003, 0.03), (2005, 0.03), (2007, 0.04), (2008, 0.05), (2009, 0.04), (2010, 0.04), (2011, 0.04), (2012, 0.04), (2013, 0.05), (2014, 0.05), (2015, 0.04), (2016, 0.04), (2017, 0.05), (2018, 0.05), (2019, 0.05), (2020, 0.05), (2021, 0.05), (2022, 0.07), (2023, 0.07), (2024, 0.07). 12 dash 29 predicted proportion: a smooth curve rising from about 0.03 near 2003 to about 0.11 near 2024. 30 dash 64 predicted proportion: a smooth curve rising from about 0.05 near 2003 to about 0.11 near 2024. 65 plus predicted proportion: a smooth curve rising from about 0.03 near 2003 to about 0.07 near 2024.
Bootstrap weighted proportion estimates and predicted proportion trendlines of diagnosed mood disorder in females of the CCHS, by age category.

Figure 2 Long description
The vertical axis label is, Proportion. The vertical axis range is 0.00 to 0.25. The horizontal axis label is, Survey year. The horizontal axis range is 2002 to 2027. Legend text: 12 dash 29 weighted proportion asterisk, 30 dash 64 weighted proportion, 65 plus weighted proportion, 12 dash 29 predicted proportion, 30 dash 64 predicted proportion, 65 plus predicted proportion. The weighted proportion series are shown with circular markers and vertical error bars. The predicted proportion series are shown as continuous lines. 12 dash 29 weighted proportion asterisk series, plotted points as coordinate pairs: (2003, 0.05), (2004, 0.06), (2007, 0.06), (2008, 0.06), (2009, 0.05), (2010, 0.06), (2011, 0.06), (2012, 0.06), (2013, 0.07), (2014, 0.09), (2015, 0.08), (2016, 0.11), (2017, 0.10), (2018, 0.12), (2019, 0.13), (2020, 0.11), (2021, 0.14), (2022, 0.17), (2023, 0.21), (2024, 0.21). Lowest listed value is 0.05 at 2003 and 2009. Highest listed value is 0.21 at 2023 and 2024. 30 dash 64 weighted proportion series, plotted points as coordinate pairs: (2003, 0.08), (2005, 0.08), (2007, 0.10), (2008, 0.10), (2009, 0.10), (2010, 0.10), (2011, 0.11), (2012, 0.11), (2013, 0.10), (2014, 0.11), (2015, 0.11), (2016, 0.12), (2017, 0.11), (2018, 0.12), (2019, 0.11), (2020, 0.12), (2021, 0.12), (2022, 0.15), (2023, 0.17), (2024, 0.16). Lowest listed value is 0.08 at 2003 and 2005. Highest listed value is 0.17 at 2023. 65 plus weighted proportion series, plotted points as coordinate pairs: (2003, 0.05), (2005, 0.05), (2007, 0.06), (2008, 0.06), (2009, 0.06), (2010, 0.06), (2011, 0.06), (2012, 0.06), (2013, 0.08), (2014, 0.07), (2015, 0.07), (2016, 0.07), (2017, 0.08), (2018, 0.07), (2019, 0.07), (2020, 0.08), (2021, 0.08), (2022, 0.09), (2023, 0.10), (2024, 0.11). Lowest listed value is 0.05 at 2003 and 2005. Highest listed value is 0.11 at 2024. 12 dash 29 predicted proportion line: a continuous line that rises from near 0.05 in the early years to above 0.20 by the last plotted years. 30 dash 64 predicted proportion line: a continuous line that rises from near 0.09 in the early years to around 0.16 by the last plotted years. 65 plus predicted proportion line: a continuous line that rises from near 0.05 in the early years to around 0.10 by the last plotted years. Across the weighted proportion markers, the 12 dash 29 series increases to the highest values by 2023 and 2024, the 30 dash 64 series increases to a mid range peak at 2023 and the 65 plus series increases to the lowest peak at 2024.
Figures for self-reported diagnosed anxiety disorders are displayed in Appendix E. Diagnosed anxiety disorders increased in young males from 2.38% (2.97, 2.74) in 2003 to 13.92% (12.02, 16.07) in 2024 (Figure E1), while young females saw an increase of 4.68% (4.25, 5.14) in 2003 to 32.95% (29.91, 36.14) in 2024 (Figure E2). From 2003 to 2024, young females saw a 28.27 percentage point increase in their prevalence of diagnosed anxiety disorder; the greatest among all age and sex groups for this outcome. However, young males had the greatest relative difference, with the prevalence of anxiety disorder in this group increasing by a multiplicative factor of 7.04 from 2003 to 2024. Quadratic survey year predictors were statistically significant (alpha = 0.05) in all anxiety meta-regression models, regardless of age and sex category (Table D1).
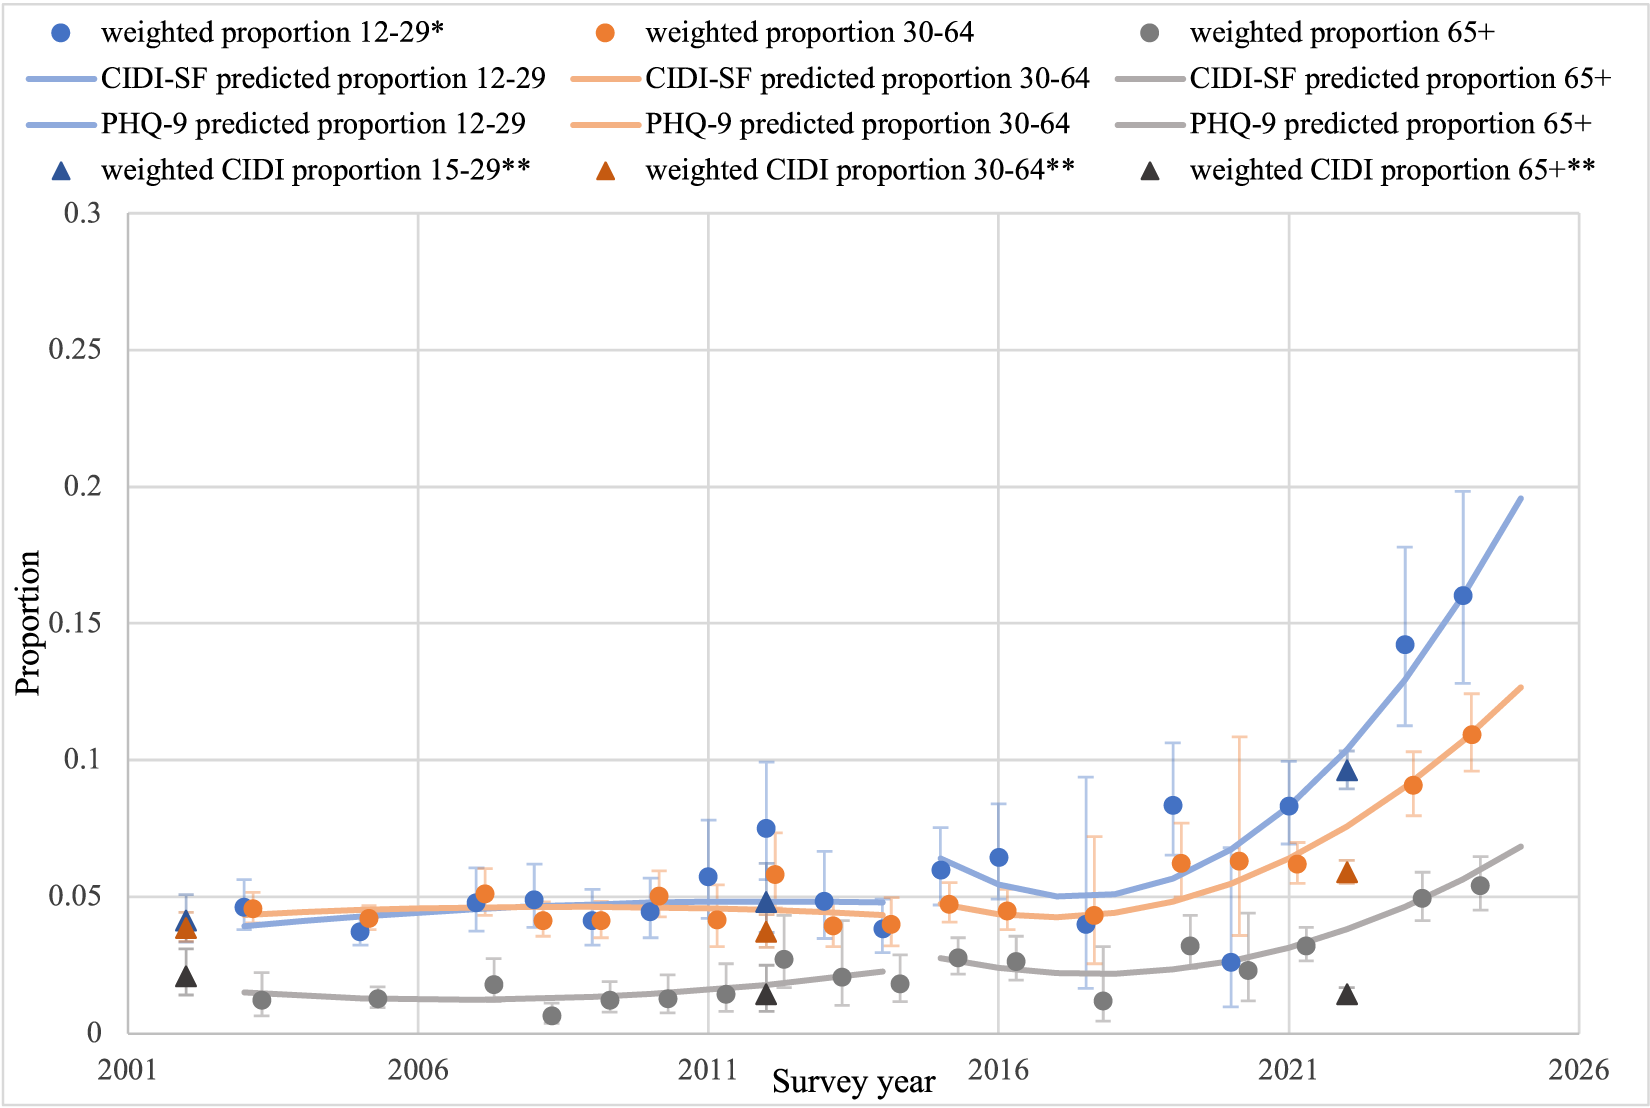
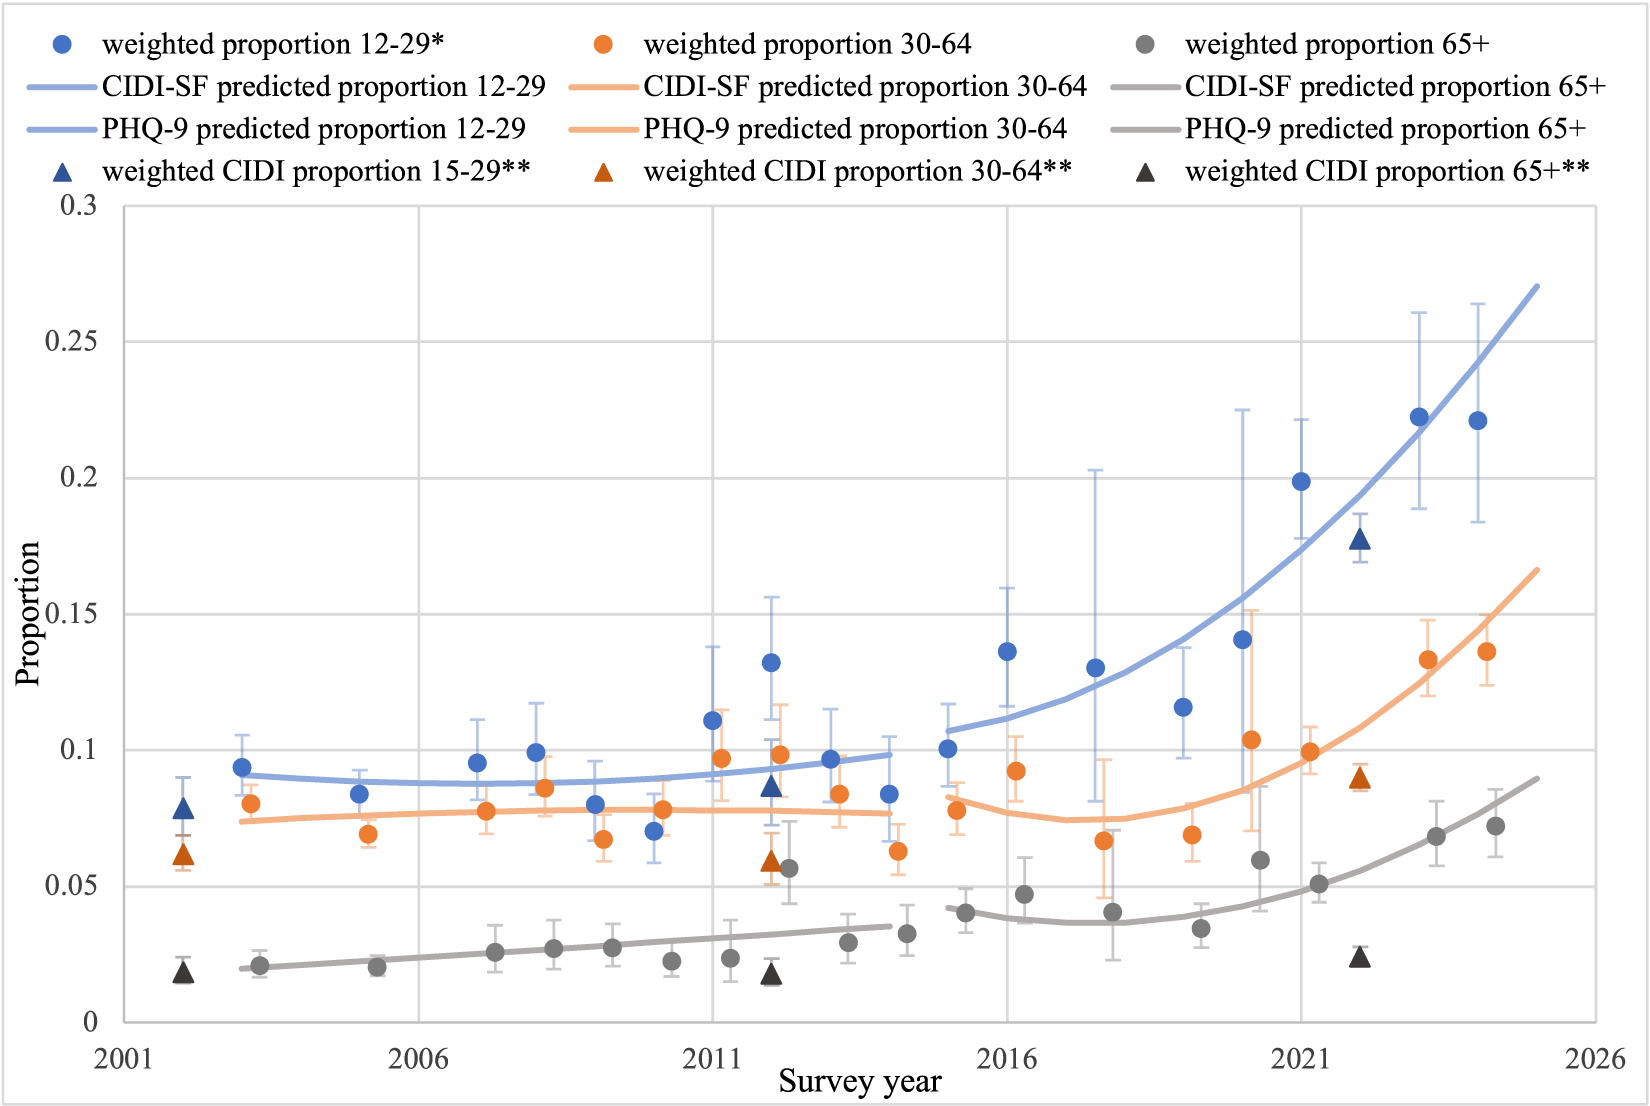
CIDI-SFMD estimates showed variation from 2003 to 2014, as seen in Figs. 3 and 4, and trends were not adequately explained by regressing on quadratic and/or linear survey year terms, as evidenced by large p-values (Table D1). However, indicators for moderate/severe depression via the PHQ-9 saw increasing trends in all age and sex groups. For example, the prevalence of PHQ-9 indicated moderate/severe depression in young males increased from 5.97% (4.71, 7.54) in 2015 to 16.01% (12.81, 19.83) in 2024 (Fig. 3). In young females, PHQ-9 indicated moderate/severe depressive symptom prevalence increased from 10.08% (8.67, 11.69) in 2015 to 22.13% (18.39, 26.40) in 2024 (Fig. 4). Importantly, full CIDI past-12-month MDD estimates in 2002, 2012 and 2022 show lower prevalence compared to the CIDI-SFMD and PHQ-9 counterparts of similar years, but they still appear to follow the patterns of predicted trendlines in each age and sex grouping.
Bootstrap weighted proportion estimates and predicted proportion trendlines of male CCHS respondents with 5+ CIDI-SFMD scores, 10+ PHQ-9 scores and CIDI-indicated past 12-month MDD (2002, 2012 and 2022), by age category.

Figure 3 Long description
A line graph with markers and vertical error bars. Legend entries: weighted proportion 12 to 29 asterisk, weighted proportion 30 to 64, weighted proportion 65 plus, CIDI-SF predicted proportion 12 to 29, CIDI-SF predicted proportion 30 to 64, CIDI-SF predicted proportion 65 plus, PHQ-9 predicted proportion 12 to 29, PHQ-9 predicted proportion 30 to 64, PHQ-9 predicted proportion 65 plus, weighted CIDI proportion 15 to 29 double asterisk, weighted CIDI proportion 30 to 64 double asterisk, weighted CIDI proportion 65 plus double asterisk. Horizontal axis label: Survey year. Horizontal axis range: 2001 to 2026. Visible tick labels: 2001, 2006, 2011, 2016, 2021, 2026. Vertical axis label: Proportion. Vertical axis range: 0 to 0.3. Visible tick labels: 0, 0.05, 0.1, 0.15, 0.2, 0.25, 0.3. Plotted elements use circular markers with error bars for weighted proportion series, triangular markers for weighted CIDI proportion series and smooth lines for predicted proportion series. Weighted proportion 12 to 29 asterisk, circular markers with error bars, coordinate pairs: (2003, 0.045), (2005, 0.038), (2007, 0.050), (2008, 0.048), (2009, 0.040), (2010, 0.045), (2011, 0.058), (2012, 0.075), (2013, 0.048), (2014, 0.040), (2015, 0.060), (2016, 0.065), (2017, 0.040), (2019, 0.082), (2020, 0.025), (2021, 0.082), (2023, 0.140), (2024, 0.160). Lowest listed value: (2020, 0.025). Highest listed value: (2024, 0.160). Weighted proportion 30 to 64, circular markers with error bars, coordinate pairs: (2003, 0.045), (2005, 0.043), (2007, 0.050), (2008, 0.040), (2009, 0.042), (2010, 0.048), (2011, 0.042), (2012, 0.055), (2013, 0.040), (2014, 0.038), (2015, 0.060), (2016, 0.065), (2017, 0.040), (2019, 0.060), (2020, 0.062), (2021, 0.060), (2023, 0.090), (2024, 0.110). Lowest listed value: (2014, 0.038). Highest listed value: (2024, 0.110). Weighted proportion 65 plus, circular markers with error bars, coordinate pairs: (2003, 0.012), (2005, 0.012), (2007, 0.018), (2008, 0.008), (2009, 0.012), (2010, 0.013), (2011, 0.015), (2012, 0.018), (2013, 0.020), (2014, 0.018), (2015, 0.028), (2016, 0.025), (2017, 0.010), (2019, 0.030), (2020, 0.022), (2021, 0.032), (2023, 0.048), (2024, 0.052). Lowest listed value: (2008, 0.008). Highest listed value: (2024, 0.052). Weighted CIDI proportion 15 to 29 double asterisk, triangular markers, coordinate pairs: (2002, 0.040), (2012, 0.050), (2022, 0.095). Lowest listed value: (2002, 0.040). Highest listed value: (2022, 0.095). Weighted CIDI proportion 30 to 64 double asterisk, triangular markers, coordinate pairs: (2002, 0.035), (2012, 0.040), (2022, 0.060). Lowest listed value: (2002, 0.035). Highest listed value: (2022, 0.060). Weighted CIDI proportion 65 plus double asterisk, triangular markers, coordinate pairs: (2002, 0.020), (2012, 0.015), (2022, 0.012). Highest listed value: (2002, 0.020). Lowest listed value: (2022, 0.012). Across the listed weighted proportion points, values for 12 to 29 rise from 0.082 at 2021 to 0.160 at 2024, values for 30 to 64 rise from 0.060 at 2021 to 0.110 at 2024 and values for 65 plus rise from 0.032 at 2021 to 0.052 at 2024. The predicted proportion series are shown as smooth lines for each age group and measure type, aligned to the same axes.
Bootstrap weighted proportion estimates and predicted proportion trendlines of female CCHS respondents with 5+ CIDI-SFMD scores, 10+ PHQ-9 scores and CIDI-indicated past 12-month MDD (2002, 2012 and 2022), by age category.

Figure 4 Long description
The legend lists nine series: weighted proportion 12 to 29 asterisk, weighted proportion 30 to 64, weighted proportion 65 plus; CIDI SF predicted proportion 12 to 29, CIDI SF predicted proportion 30 to 64, CIDI SF predicted proportion 65 plus; PHQ 9 predicted proportion 12 to 29, PHQ 9 predicted proportion 30 to 64, PHQ 9 predicted proportion 65 plus; weighted CIDI proportion 15 to 29 double asterisk, weighted CIDI proportion 30 to 64 double asterisk, weighted CIDI proportion 65 plus double asterisk. The x-axis label is, Survey year, with tick labels 2001, 2006, 2011, 2016, 2021 and 2026. The y-axis label is, Proportion, with tick labels 0, 0.05, 0.1, 0.15, 0.2, 0.25 and 0.3. For ages 12 to 29, circular points with vertical error bars appear from the early 2000s through the mid 2020s. Values are near 0.09 to 0.10 in the early years, around 0.07 to 0.13 between about 2009 and 2014, then increase after about 2015. Later points include about 0.14 around 2020, about 0.20 around 2021 and about 0.22 around 2023 and 2024. A smooth predicted line for ages 12 to 29 rises from about 0.10 around 2015 to about 0.27 by the mid 2020s. For ages 30 to 64, circular points with vertical error bars appear across the same period. Values are around 0.07 to 0.09 in the early 2000s, around 0.06 to 0.10 through the mid 2010s, then increase in the early 2020s. Later points include about 0.10 around 2021, about 0.13 around 2023 and about 0.14 around 2024. A smooth predicted line for ages 30 to 64 is near 0.08 around 2015, then rises to about 0.16 by the mid 2020s. For ages 65 plus, circular points with vertical error bars appear from the early 2000s through the mid 2020s. Values are around 0.02 to 0.03 in the early 2000s, around 0.02 to 0.05 through the mid to late 2010s, then rise in the early 2020s. Later points include about 0.05 around 2021, about 0.07 around 2023 and about 0.07 around 2024. A smooth predicted line for ages 65 plus rises from about 0.04 around 2015 to about 0.09 by the mid 2020s. Triangular markers labeled as weighted CIDI proportion appear at a few survey years for each age group. For ages 15 to 29, triangles appear near about 0.08 around 2002, about 0.09 around 2012 and about 0.18 around 2022. For ages 30 to 64, triangles appear near about 0.06 around 2002, about 0.06 around 2012 and about 0.09 around 2022. For ages 65 plus, triangles appear near about 0.02 around 2002, about 0.02 around 2012 and about 0.03 around 2022.
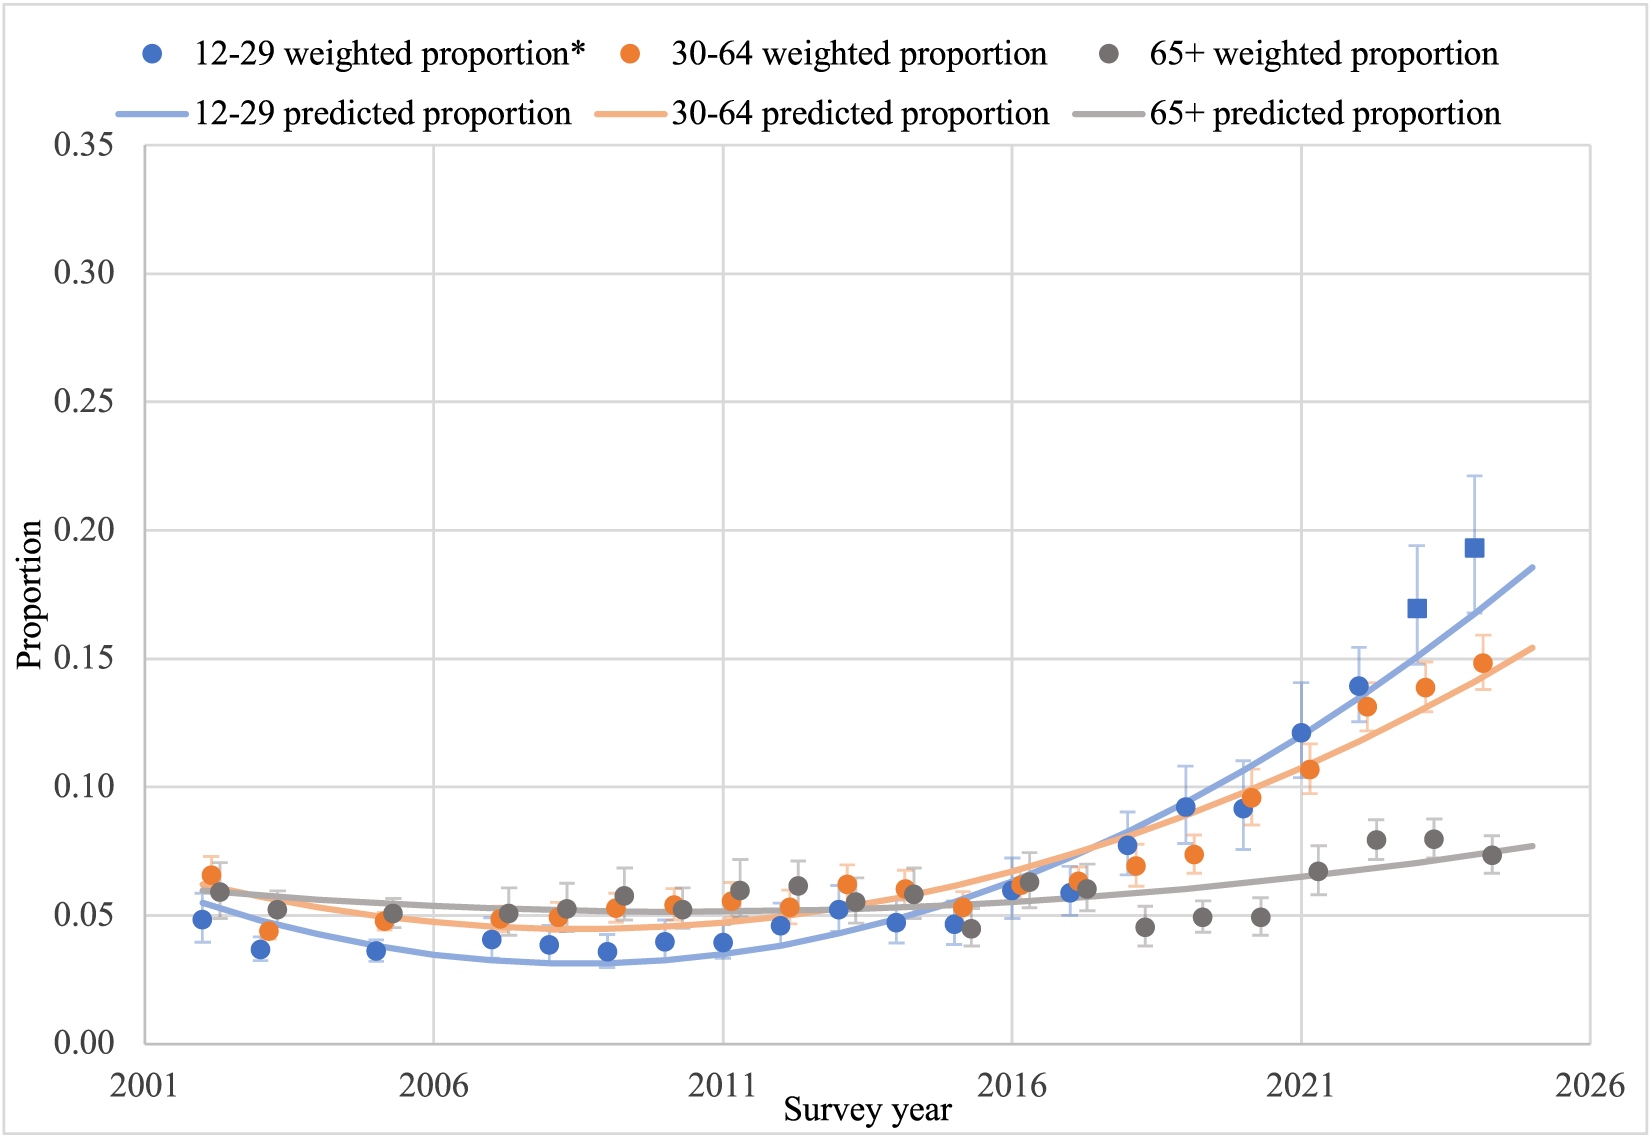
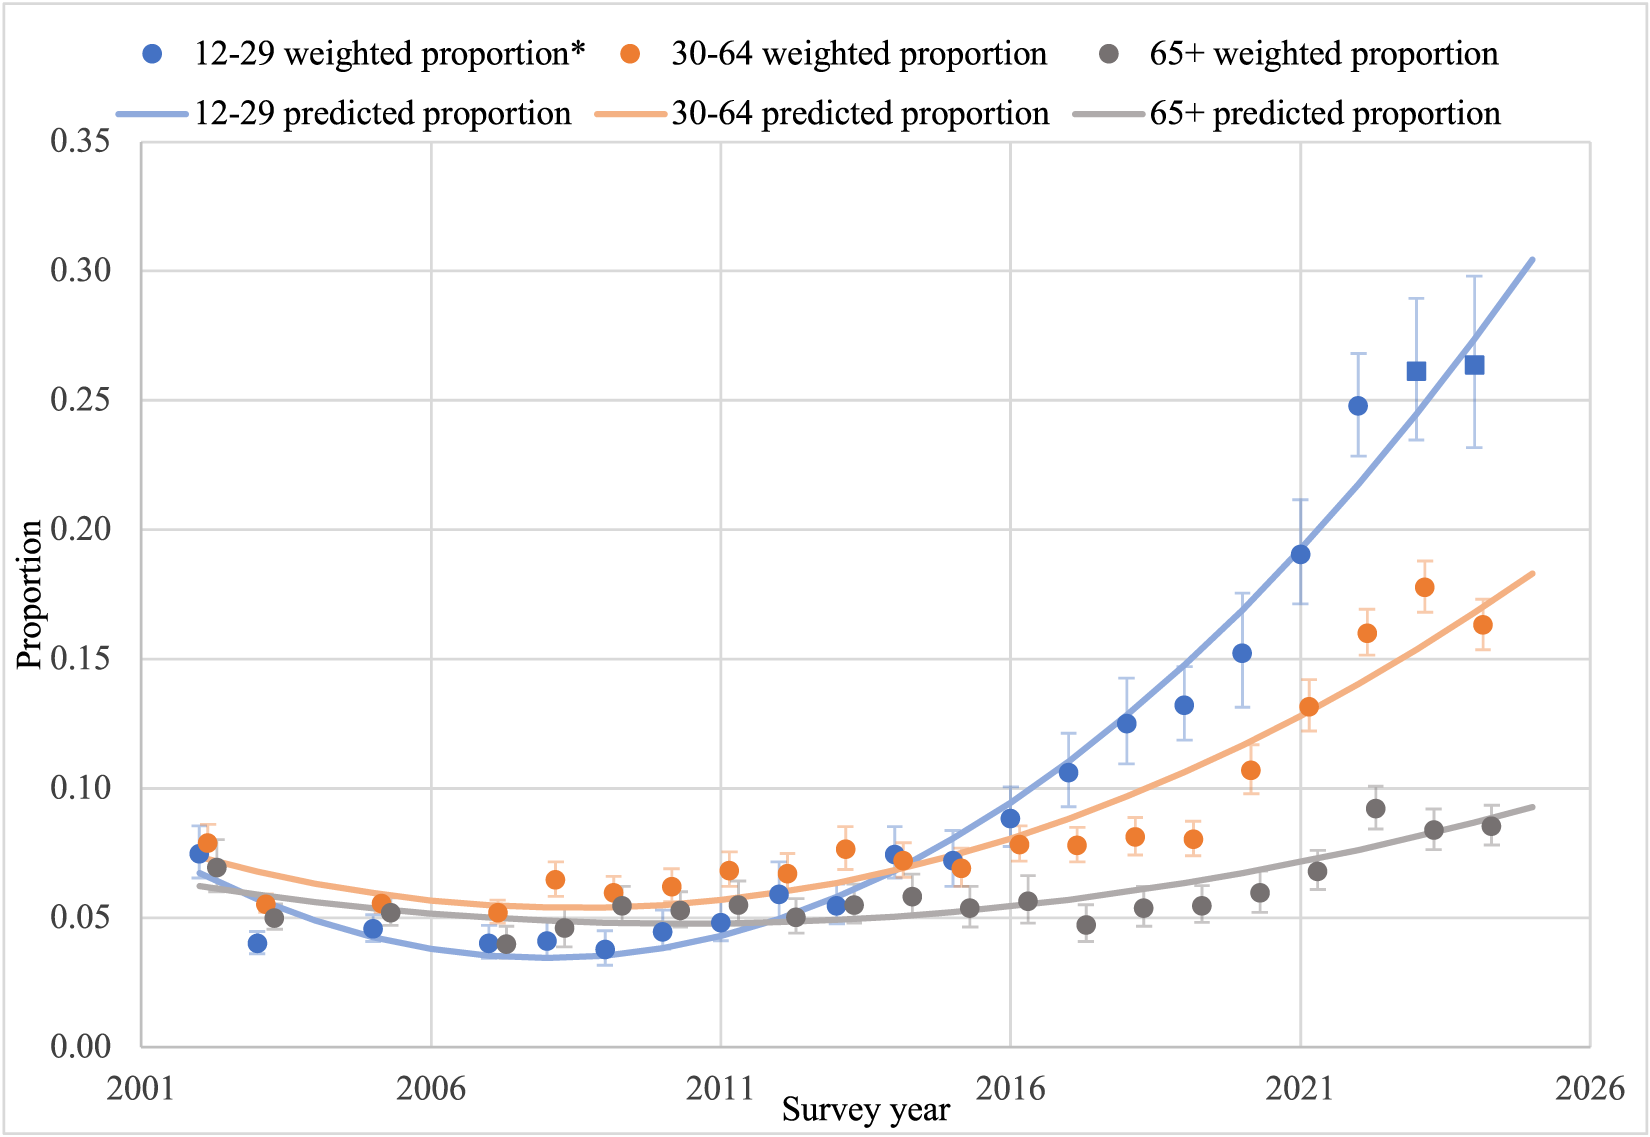
In young males, the prevalence of fair/poor self-perceived mental health increased from 4.84% (3.97, 5.88) in 2002 to 19.31% (16.79, 22.12) in 2024 (Fig. 5), yielding an absolute increase of 14.48 percentage points and a relative increase of 3.99 times from 2002 to 2024. Similarly, in young females, this fair/poor perceived prevalence increased by a multiplicative factor of 3.52 from 7.49% (6.54, 8.57) in 2002 to 26.36% (23.19, 29.81) in 2024 (Fig. 6), increasing 18.87 percentage points over this time. All age/sex group’s quadratic term p-values were <0.001, except for males over 65 years of age (p = 0.015), whose model also had a relatively low R 2 value at 44.28%, indicating some unexplained heterogeneity (Table D1). Other R 2 values for models of this outcome were above 75% in additional age and sex categories.
Bootstrap weighted proportion estimates and predicted proportion trendlines of fair/poor self-perceived mental health in males of the CCHS, by age category.

Figure 5 Long description
The multi-line graph compares weighted and predicted proportions across three age groups over survey years from 2001 to 2026. The horizontal axis is labeled, Survey year, with values from 2001 to 2026. The vertical axis is labeled, Proportion, ranging from 0.00 to 0.35. The legend identifies six series: 12 to 29 weighted proportion, 30 to 64 weighted proportion, 65 plus weighted proportion, 12 to 29 predicted proportion, 30 to 64 predicted proportion and 65 plus predicted proportion. The 12 to 29 weighted proportion series, marked with circles, shows a gradual increase, peaking around 2024. The 30 to 64 weighted proportion series, marked with circles, follows a similar upward trend but at a slower rate. The 65 plus weighted proportion series, marked with circles, remains relatively flat with slight increases. Predicted proportions for each group are represented by solid lines: the 12 to 29 predicted proportion line rises sharply after 2016, the 30 to 64 predicted proportion line shows moderate growth and the 65 plus predicted proportion line is nearly flat. The graph highlights that the 12 to 29 age group experiences the fastest increase in proportion, especially after 2016, while the 65 plus group shows minimal change. Key turning points include a noticeable rise for the 12 to 29 group starting in 2016 and continuing to 2024.
Bootstrap weighted proportion estimates and predicted proportion trendlines of fair/poor self-perceived mental health in females of the CCHS, by age category.

Figure 6 Long description
Legend: 12 to 29 weighted proportion asterisk. 30 to 64 weighted proportion. 65 plus weighted proportion. 12 to 29 predicted proportion. 30 to 64 predicted proportion. 65 plus predicted proportion. Visual encoding: Weighted proportion values are shown as plotted markers with vertical error bars. Predicted proportion values are shown as smooth lines. Horizontal axis label: Survey year. Range: 2001 to 2026. Tick labels: 2001, 2006, 2011, 2016, 2021, 2026. Vertical axis label: Proportion. Range: 0.00 to 0.35. Tick labels: 0.00, 0.05, 0.10, 0.15, 0.20, 0.25, 0.30, 0.35. Data points as coordinate pairs. 12 to 29 weighted proportion asterisk: (2002, 0.07), (2003, 0.04), (2005, 0.045), (2007, 0.04), (2008, 0.04), (2009, 0.04), (2010, 0.045), (2011, 0.05), (2012, 0.06), (2013, 0.05), (2014, 0.055), (2015, 0.07), (2016, 0.09), (2017, 0.105), (2018, 0.125), (2019, 0.13), (2020, 0.15), (2021, 0.19), (2022, 0.245), (2023, 0.26), (2024, 0.265). 30 to 64 weighted proportion: (2002, 0.075), (2003, 0.05), (2005, 0.05), (2007, 0.05), (2008, 0.065), (2009, 0.055), (2010, 0.06), (2011, 0.065), (2012, 0.065), (2013, 0.075), (2014, 0.07), (2015, 0.07), (2016, 0.08), (2017, 0.075), (2018, 0.08), (2019, 0.08), (2020, 0.105), (2021, 0.13), (2022, 0.16), (2023, 0.175), (2024, 0.16). 65 plus weighted proportion: (2002, 0.065), (2003, 0.05), (2005, 0.05), (2007, 0.04), (2009, 0.055), (2012, 0.05), (2015, 0.05), (2016, 0.055), (2017, 0.045), (2018, 0.05), (2019, 0.055), (2020, 0.06), (2021, 0.07), (2022, 0.09), (2023, 0.085), (2024, 0.085). Key low and high values from the listed weighted proportion points. 12 to 29 weighted proportion asterisk minimum: 0.04 at 2003, 2007, 2008 and 2009. 12 to 29 weighted proportion asterisk maximum: 0.265 at 2024. 30 to 64 weighted proportion minimum: 0.05 at 2003, 2005 and 2007. 30 to 64 weighted proportion maximum: 0.175 at 2023. 65 plus weighted proportion minimum: 0.04 at 2007. 65 plus weighted proportion maximum: 0.09 at 2022. Predicted proportion series are shown as smooth curves for each age group. The 12 to 29 predicted proportion curve rises to above 0.30 near the right side of the axis. The 30 to 64 predicted proportion curve rises to below 0.20 near the right side of the axis. The 65 plus predicted proportion curve rises to below 0.10 near the right side of the axis. Overall comparison using the listed weighted proportion points: values for all three age groups are higher in the years 2021 to 2024 than in the years 2002 to 2010. The 12 to 29 series has the highest listed values in 2022 to 2024 and the 65 plus series has the lowest listed values across the same period.
Discussion
Contrary to the hypothesis that previously reported increases in poor mental health would stabilize after COVID-19, the prevalence of diagnosed mood and anxiety disorder, symptom-based measures of past-MDE, and fair/poor self-perceived mental health all increased from 2002/2003 to 2024. Increases in these mental health measures over time are consistently most prominent in those 12–29 years of age, particularly females of this age group, though young males often had the greatest relative increases in prevalence over the period examined. In addition to these worsening trends in young people, middle-aged and older adults of both sexes have also seen notable increases in poor mental health from 2002/2003 to 2024. Females demonstrated a greater differentiation between trends of distinct age categories when compared to males, such that age-specific trends in males were more similar. The substantial increases seen in 12- to 29-year-old females align with previous literature (Wiens et al., Reference Wiens, Bhattarai, Pedram, Dores, Williams, Bulloch and Patten2020; Stephenson, Reference Stephenson2023), extending these findings by analysing data through 2024. However, the notable relative increases observed in young males, and general prevalence increases across all age and sex categories, have not been previously emphasized.
There was no acute heightening of poor mental health during COVID-19, as was hypothesized, rather some instances of decreased prevalence in 2020 and 2021. These reduced prevalence estimates (compared to surrounding estimates and predicted trendlines) were most notable in diagnosed disorders, pointing to a potential reduction in access to healthcare resources during the pandemic. However, there were also decreases in symptom-based measures and self-reported fair/poor mental health from 2020/2021, pointing to additional factors, or rather, a combination of factors potentially influencing these decreases. It is possible that the circumstances of COVID-19 provided some with routine changes that may have improved their mental health (i.e. work-from-home, unemployment security, etc.), though longer-term trends have not demonstrated sustained improvements. Methods better suited to assess pandemic-related factors have found no evidence to attribute the negative changes in mental health directly to COVID-19 and its associated societal disruptions (Gohari et al., Reference Gohari, Patte, Ferro, Haddad, Wade, Bélanger, Romano and Leatherdale2024), suggesting that the acute circumstances of COVID-19 may have had a more limited impact on mental health than previously hypothesized. However, explaining the worsening of mental health beyond COVID-19 may be more complex and involve considering the potentially changing landscape of social determinants implicated in prior mental health analyses, such as socioeconomic disadvantage, early life/childhood adversity, migration, discrimination and loneliness (Kirkbride et al., Reference Kirkbride, Anglin, Colman, Dykxhoorn, Jones, Patalay, Pitman, Soneson, Steare, Wright and Griffiths2024). The longer-term social and economic impacts of the pandemic may have increased the prevalence of these determinants, in turn contributing to the worsening of mental health seen in these results, though it will be difficult to pinpoint any specific mechanism.
Other hypotheses have been proposed attempting to understand why the prevalence of mental disorder may be increasing, such as those related to the increased mental health awareness efforts in the population. In 2015, a Canadian analysis identified a narrowing gap between administrative and survey-reported mental health prevalence over time, most evidently in younger age groups, attributing these changes to decreasing stigma and an increase in mental health literacy amongst the population (O’Donnell et al., Reference O’Donnell, Vanderloo, McRae, Onysko, Patten and Pelletier2015). Previous literature has found correlations between positive mental health perceptions, reduced stigma and increased help-seeking behaviours (Evans et al., Reference Evans, Chang, Dehon, Streb, Bruce, Clark and Handal2023), strengthening such arguments. This phenomenon has since been termed the prevalence inflation hypothesis, attributing the increasing prevalence of mental disorder to widespread mental health awareness efforts and reduced stigma, leading to the over-pathologization of normal psychological distress and subsequent diagnosis-seeking behaviour (Foulkes and Andrews, Reference Foulkes and Andrews2023). However, in concordance with this suggestion, one may have expected differential trends of more ‘objective’ symptom-based measures of mental health (i.e. full CIDI, CIDI-SFMD and PHQ-9 indicators) when compared to self-reported diagnoses or perception-based measures, though notable differences were not observed. Indeed, the prevalence inflation hypothesis has suggested that self-perceptions of distress and interpretations of mental health measures may be changing; a comment on the continued utility of these survey symptom rating scales in more objectively assessing mental disorder. These discussions about defining ‘true’ disease have not been uncommon in psychiatry, however, as even gold standard diagnostic criteria have faced previous criticism (Pickersgill, Reference Pickersgill2014). Ultimately, the consideration of prevalence inflation in explaining these worsening trends must be done with caution to prevent the dehumanization of poor mental health, potentially driving more severe consequences (i.e. self-harm, suicide, etc.) (Al-Halabí and Fonseca-Pedrero, Reference Al-Halabí and Fonseca-Pedrero2024), and broader discussions of diagnostic inflation that may undermine the public validity of psychiatric diagnosis (Kudlow, Reference Kudlow2013). Further, modern suggestions of dimensional, or clinical staging approaches to the diagnosis of psychiatric disorder are important considerations for future research, particularly when assessing the utility of mental health survey tools (Eaton et al., Reference Eaton, Bringmann, Elmer, Fried, Forbes, Greene, Krueger, Kotov, McGorry, Mei and Waszczuk2023). Regardless of these features of measurement and diagnosis, this analysis was not intended to approximate population prevalence, nor assess the validity of these measures, but is rather interested in the relative comparisons between the trends of each mental health measurement, and what these comparisons may suggest. The commonalities in trends observed across differential outcomes may indicate that multiple facets of mental health are changing similarly over time, though future research is necessary to clarify what factors may be driving such broad changes.
Limitations: The self-report nature of the CCHS’s mental health measures is prone to social desirability, extreme reporting or recall biases (Paulhaus and Vazire, Reference Paulhaus, Vazire, Robins, Fraley and Krueger2007; Patten et al., Reference Patten, Lin, Martens, Stiff, Smetanin and Adair2012) and may not represent true population prevalence. It may also be important to consider the episodic nature of both mood and anxiety disorders in the self-reporting of previously diagnosed disease, and past symptoms (Imlah, Reference Imlah1978; Moerk and Klein, Reference Moerk and Klein2000), making the temporality of such survey questions related to mental disorder further vulnerable to potential measurement bias. Additionally, the cross-sectional nature of the CCHS precludes causal associations from being drawn when assessing the changing prevalence of mental health outcomes over time. Though these results provide strong evidence for the existence of temporal trends in mental health, the heterogeneity of designs across surveys employed by this analysis could also explain some of the changes observed. In this analysis, the impact of survey changes was assumed to be random and was modelled as heterogeneity in random effects models, but if the changes produced systematic effects, bias could have been introduced. Pooled analyses of CCHS data remain controversial in view of methodological changes over time, especially considering the large-scale redesigns in 2007, 2015 and 2022. For example, the 2022 redesign that introduced electronic questionnaires may have reduced response rates, as has been shown by previous evidence (Daikeler et al., Reference Daikeler, Bošnjak and Lozar Manfreda2020), though this non-response must differ by mental health classifications specified by this analysis in order to introduce bias, which is ultimately difficult to determine. Meta-analysis methods attempted to assess for potential heterogeneity due to differing CCHS design and collection methods over time, but longitudinal designs would be better equipped to detail these temporal changes and assess factors that may be influencing these trends.
Further, decreasing CCHS response rates may have impacted the validity and comparability of results over time. Lower response rates could have contributed to the reduced precision of recent estimates, notably for certain CIDI-SFMD/PHQ-9 MDE estimates and some indicators during COVID-19 in 2020 and 2021, though this did not appear to substantially impact predicted trends. Especially low response rates in 2020 and 2021 may have resulted in some non-response bias, though as discussed above, this bias would be difficult to quantify relative to specific mental health indicators. Additionally, the 2023 and 2024 CCHS only sampled respondents aged 18 years and older, differing from all other years of the CCHS, which had a minimum age of 12 years. These changes to the youngest age group are important to consider when comparing 2023/2024 estimates to previous years, as information from adolescents (ages 12–17 years) is lost for these most recent surveys, though the impact of such age restriction is difficult to quantify. It is also possible that the broad age categories specified by this analysis may not have adequately captured specific mental disorder trends across the life course, particularly in the youngest group, who experience the greatest developmental changes across these ages (Jaworska and MacQueen, Reference Jaworska and MacQueen2015). Additionally, the earliest years of the CCHS lacked information on respondent gender, preventing this analysis from considering gender relative to these long-term prevalence trends.
Future directions: Broadening the focus of mental health research beyond that of young females is necessary to determine why such increases in poor mental health are being observed across all age and sex groups in Canada. The critical assessment of evidence from a variety of different collection methods, including administrative data and longitudinal study designs, is essential to contextualizing these results. Further, the continued emphasis on survey designs that include multiple, diverse measures of mental health may improve the comprehension of any observed changes over time. It may be impossible to parse out the potential causes of the observed trends, though perhaps focussing on further understanding the construct validity and comparative value of these diverse survey measures will allow for improved comprehension, and should be a focus of future research (Committee on Psychological Testing, 2015). Qualitative study designs investigating attitudes and perceptions towards mental health survey measures may be an important future supplement to these data.
Conclusions
The prevalence of diagnosed mood and anxiety disorder, symptom-indicated MDE and fair/poor perceived mental health has increased in CCHS respondents from 2002/2003 to 2024. Although all age and sex categorizations saw increases in the prevalence of these mental health outcomes over time, 12- to 29-year-old females saw the most substantial increases, while young and middle-aged adult males saw comparable trends. Similar trends were observed across all mental health outcomes, indicating that symptom-based measures of mental health may be increasing in alignment with diagnoses and worsening self-perceptions of mental health, further suggesting diverse factors may be contributing to these trends. Longitudinal study designs may provide insight into potential determinants responsible for these changes, though validation studies and qualitative research may enhance the understanding of survey measures in mental health.
Supplementary material
The supplementary material for this article can be found at https://doi.org/10.1017/S2045796026101000.
Availability of data and materials
This research was completed using confidential, individual-level microdata from the Canadian Community Health Survey (CCHS) collected by Statistics Canada. CCHS microdata are secured and only accessible to accredited researchers through the Canadian Research Data Centre Network (CRDCN). Data analysis for this project was completed at the Prairie Regional Data Centre located at the University of Calgary.
Financial support
This research received no specific grant from any funding agency, commercial or non-for-profit sectors.
Competing interests
None.
Ethical standards
The authors assert that all procedures contributing to this work comply with the ethical standards of the relevant national and institutional policies.


 Open access

