


Introduction
South Korea (Republic of Korea) has one of the highest suicide rates among Organisation for Economic Co-operation and Development (OECD) countries, with a suicide rate of 25 per 100,000, more than twice the OECD average (OECD, 2023). Existing research has linked lower happiness to suicidal ideation and suicide attempts in Korean populations (Kye and Park, Reference Kye and Park2014; Lee and Kawachi, Reference Lee and Kawachi2019; Choi et al., Reference Choi, Sempungu, Kim, Han and Lee2024). In this context, clarifying how happiness is embedded within broader psychological, social and economic experiences may help identify candidate domains for future well-being and suicide-prevention research.
Happiness is commonly treated as one component of subjective well-being (SWB), a broader construct that includes cognitive evaluations of life and affective experience (Diener, Reference Diener1984; OECD, 2013). In this study, we focus on self-rated happiness as a pragmatic indicator of the evaluative dimension of SWB and examine it alongside affective states and domain-specific well-being evaluations. Although this approach does not capture the full eudaimonic or flourishing dimensions of well-being, it is suitable for investigating how concrete emotional and evaluative experiences cluster around happiness in a large population survey.
The social context of happiness in South Korea is shaped by rapid social and economic change. Generational tension, gender inequality, political and economic polarization, and growing material insecurity may all influence how individuals evaluate their lives and emotions (Burns, Reference Burns2015; Lee et al., Reference Lee, Chung and Kim2021; Kim, Reference Kim2022). These pressures may be especially salient for the MZ generation, a commonly used Korean grouping that combines Millennials and Generation Z, whose members often face academic pressure (Kim et al., Reference Kim, Jang and Kim2022), unstable employment (Nam et al., Reference Nam, Eum, Huh, Jung and Choi2021) and rising living costs (Baek and Yoon, Reference Baek and Yoon2025). Older generations may place greater emphasis on health, family and stability, reflecting different life circumstances and value structures (Park and Kang, Reference Park and Kang2023). These overlapping pressures make South Korea a useful setting in which to examine how specific affective, evaluative and personality-related experiences are conditionally linked to happiness.
Prior Korean studies have identified important correlates of happiness, including depression, suicidal ideation, life-cycle factors, subjective economic position, social capital and housing conditions (Kye and Park, Reference Kye and Park2014; Rudolf and Kang, Reference Rudolf and Kang2015; Choi et al., Reference Choi, Shin, Hong, Kim, Kang, Jeong, Park and Lee2019, Reference Choi, Sempungu, Kim, Han and Lee2024; Lee and Kawachi, Reference Lee and Kawachi2019; Kim et al., Reference Kim, Choi, Lee, Lee, Kim, Bae, Lee, Maeng, Son and Kim2021, Reference Kim, Kang and Park2024; Lee and Bae, Reference Lee and Bae2022; Seol and Chun, Reference Seol and Chun2023). However, this literature has generally treated happiness as a summary outcome or index and has examined predictors one domain at a time, often using regression models or composite scores. Likewise, research on depression or related psychosocial constructs has frequently relied on total scores rather than item-level structure. Outside Korea, recent work has shown that network analysis can represent the structure of subjective and psychological well-being at the item level, but comparable nation-level evidence remains limited in Korean populations (Blasco-Belled et al., Reference Blasco-Belled, González-Carrasco and Casas2024).
A network approach is useful in this setting because it does not require specifying happiness as the sole dependent variable in advance. Instead, it estimates how observed items are conditionally linked within a single system. This is particularly relevant when affective states, domain-specific evaluations, personality-related tendencies and broader structural attitudes may reinforce one another. In the present study, we included four domains that are theoretically relevant to happiness: affective states such as enjoyment, calm, vitality, stress and loneliness; well-being evaluations such as standard of living, health satisfaction, future security and local environment; personality items from the Big Five Inventory-10 (BFI-10); and political orientation as a broad indicator of ideological self-placement. In the Korean context, these domains may capture both daily emotional experiences and socially salient appraisals related to belonging, material stability and role expectations.
Accordingly, this study had two main aims. First, we estimated a nation-level item network of self-rated happiness, affect, well-being evaluations, personality items and political orientation using pooled 2020–2023 Korean Happiness Survey (KHS) data. Second, we tested whether the network differed by sex, income and generation using formal Network Comparison Tests (NCTs). Based on prior Korean and East Asian literature, we expected happiness to be most closely linked to affective states and selected evaluative items, particularly standard of living and future security. We also expected tighter coupling between happiness and material-evaluative items in lower-income respondents, and broader heterogeneity by sex and generation. By embedding affect, well-being evaluations, personality items and political orientation within a single national item network and formally comparing subgroup structures, this study extends prior Korean happiness research beyond composite-score approaches and offers a more fine-grained account of how happiness-related experiences are organized in South Korea.
Methods
Data source and study population
Data for this study were taken from the 2020–2023 KHS, a comprehensive dataset collected annually through a stratified cluster sampling method. The survey includes approximately 13,000–17,000 individuals each year, drawn from all administrative districts and stratified by various characteristics. A total of 650 census tracts were selected from 34 strata, determined based on administrative divisions and stratification criteria. Professional surveyors visited selected households, and individuals aged 15 and older were given tablet PCs to complete a structured questionnaire. The public-use files did not include sampling weights, and they also did not provide the stratum identifiers, cluster identifiers or replicate weights needed for a full design-based variance analysis. Accordingly, all analyses were conducted unweighted. Additional survey details can be found in the official report (National Assembly Futures Institute, 2020).
Across the pooled 2020–2023 KHS waves, 64,531 respondents were available in the public-use files. For the final network analyses, we used a complete-case analytic sample of 61,675 respondents with non-missing data on sex, income subgroup, generation subgroup and all network-analysis nodes. Respondents with missing data on political orientation, which was included in the final network models, were excluded from the analytic sample (n = 2,856; 4.43% of the pooled sample).
Sampling weights were not provided in the public files. Unless the design is strictly self-weighting, unweighted estimates are not population-representative. Accordingly, all analyses were unweighted, and we interpret networks as sample-level findings rather than design-based population estimates.
This study was reviewed by the Mass General Brigham Institutional Review Board and was determined not to involve human subjects, as it does not include identifiable information. Therefore, the project did not require IRB approval.
Measures
Happiness was elicited with a single survey item, ‘Overall, how happy do you think you are?’, which is a widely accepted measure of SWB (Diener, Reference Diener1984). This question asks respondents to reflect on their overall sense of happiness, a common approach used in international surveys such as the OECD Guidelines on Measuring Subjective Well-being (OECD, 2013). Respondents typically provide their answer on a scale from 0 to 10, capturing a subjective assessment of their overall happiness. This approach is common in large population surveys and is consistent with OECD-oriented monitoring of SWB, but a single item cannot capture all dimensions of well-being, such as distinctions between global life evaluation, momentary affect and broader eudaimonic functioning. We therefore interpret this item as a pragmatic observed indicator of self-rated happiness rather than as a complete measure of SWB.
In addition to this cognitive measure of happiness, the survey includes 10 affect-related items designed to assess the emotional dimension of SWB. These items are also based on the OECD guidelines and capture both positive (e.g., enjoyment, calmness) and negative (e.g., stress, loneliness) affective experiences from the previous day. Respondents rate each emotion on a 0–10 scale, indicating the extent to which they experienced each feeling, thus reflecting both the intensity and frequency of affective states.
The KHS includes a single survey item on political orientation, which asks respondents to rate their political stance on a scale from 1 to 10, where 1 represents a liberal (progressive) orientation, and 10 represents a conservative orientation. This item provides a broad ideological summary, but it does not distinguish among economic, social and cultural dimensions of political orientation. Accordingly, we interpret this variable as a coarse observed indicator of ideological self-placement rather than a multidimensional measure of political beliefs.
Personality traits were captured with the BFI-10, with each statement rated on a scale from 1 (strongly disagree) to 5 (strongly agree), with several items requiring reverse coding to ensure consistency in trait measurement. The BFI-10 is a validated tool used in large-scale surveys for efficiently measuring extraversion, agreeableness, conscientiousness, neuroticism and openness to experience (Rammstedt, Reference Rammstedt2007). In this study, we used the Korean version of the BFI-10, which has been translated and validated in Korean populations (Kim et al., Reference Kim, Kim, Yoo, Bae, Kim, Yang, Shin and Yoon2010). Because this instrument includes only two items per trait, we evaluated its psychometric performance directly in the present dataset and treated the personality variables as item-level observed indicators in the network, rather than as precise latent trait scores. The node abbreviations, short labels, full survey item wording, response scales and coding notes used in the network analyses and figures are provided in Supplementary Table 1.
The socio-demographic characteristics used in this dataset include sex, age, income, welfare status, marital status, education level, occupation, multicultural family background, health status, chronic disease, disability and religion. Income level was self-reported and categorized into five brackets, ranging from no income to more than 8 million Korean won per month (KRW; approximately $6,800–7,000 USD at the time the survey was conducted). Occupation categories include high-level professionals, skilled workers, manual labourers, military personnel, housewives and students, the unemployed, and others. Health status is captured on a 5-point Likert scale ranging from very good to very bad. Chronic disease categories include individuals with no chronic condition, diagnosed but not treated, treated for less than 3 months, treated for 3–6 months, treated for over 6 months, cured and missing. Finally, we created a ‘generation group’ variable, based on birth year, to classify respondents into common generational definitions used in South Korean society and internationally (Dimock, Reference Dimock2019): Generation Z (1997–2010), Millennial (1980–1996), Generation X (1964–1979), Baby Boomer (1955–1963) and Silent Generation (1925–1954). While generational definitions can vary slightly across different countries, this breakdown is widely used and typically applied in South Korea.
Statistical analysis
Before estimating the network models, we evaluated the multi-item affect and personality blocks. For the affect items, we fit a two-factor confirmatory factor analysis (CFA), with positive affect defined by enjoyment, calm, and vitality and negative affect defined by worry, sadness, depression, anger, stress, tiredness, and loneliness. We estimated this model using maximum likelihood with robust standard errors (MLR) and weighted least squares mean- and variance-adjusted (WLSMV) estimation and calculated internal consistency coefficients. For the BFI-10, we examined pairwise item correlations, Spearman–Brown reliability coefficients and an equal-loading CFA as a diagnostic assessment of the expected five-factor structure. Because happiness and political orientation were measured with single items, they were treated as observed indicators and were not subjected to CFA or internal consistency analysis. Measurement-check results for the BFI-10 are summarized in Supplementary Tables 2 and 3.
We used a Gaussian graphical model to estimate the conditional association structure among the observed survey items on happiness, affect, well-being evaluations, political orientation and personality traits (Lauritzen, Reference Lauritzen1996). We chose a network approach because our aim was not only to identify variables associated with happiness on average, but also to examine how individual items were conditionally linked within a single system. In this sense, the network approach complements regression and structural equation modelling by addressing a different question at the level of observed items (Epskamp et al., Reference Epskamp, Borsboom and Fried2018).
Networks were estimated from unweighted Spearman rank correlations because the node set combined ordered responses with mixed scale ranges, including 0–10 for affect and well-being evaluation items, 1–10 for political orientation and 1–5 for the BFI-10 items. We used Spearman correlations as a single rank-based measure that could be applied uniformly across all nodes. Polychoric correlations were treated as supplementary diagnostics for the shortest ordinal block rather than as the primary network input. Variables were not z-standardized before network estimation because the model was estimated from a correlation matrix. Standardization was used only for selected auxiliary displays, including the standardized centrality plot, and for the predictability analysis.
The overall network was estimated using the extended Bayesian information criterion graphical least absolute shrinkage and selection operator (EBICglasso) procedure with a tuning parameter of 0.5 (Hevey, Reference Hevey2018). We did not manually specify a single Least Absolute Shrinkage and Selection Operator penalty. Instead, the EBICglasso algorithm selected the optimal network along a regularization path by minimizing the extended Bayesian information criterion. Networks were estimated and visualized using the R packages qgraph and bootnet. To assess edge-weight accuracy, we conducted 1,000 non-parametric bootstrap resamples without survey reweighting and summarized precision using non-parametric 95% confidence intervals (Supplementary Table 5).
To characterize node importance, we computed four centrality indices, namely strength, closeness, betweenness and expected influence (Robinaugh et al., Reference Robinaugh, Millner and McNally2016). For Figure 3, centrality values were standardized within each metric across nodes, such that 0 indicates the mean value for that metric and positive or negative values indicate above-average or below-average centrality, respectively. Expected influence was defined as the signed sum of all edge weights connected to a node and was examined alongside strength because the estimated network contained both positive and negative edges. Following current recommendations for psychometric networks, substantive interpretation focused on strength and expected influence. We evaluated the robustness of centrality estimates using the correlation stability coefficient, defined as the maximum proportion of cases that can be dropped while retaining a correlation of at least 0.70 between the original and subset-based centrality estimates (Epskamp et al., Reference Epskamp, Borsboom and Fried2018).
We compared network structures across sex, income and generation subgroups. Income was dichotomized as low income (≤4 million KRW/month) and high income (>4 million KRW/month). This cutpoint was chosen because income was recorded in ordered categories rather than as a continuous measure, because 4 million KRW represented the clearest boundary between lower and higher brackets in the released data, and because a two-group split was required for pairwise NCT analyses. For generation, Millennials and Generation Z were combined into the MZ generation, a widely used Korean grouping (Nam, Reference Nam2021; Shin and Song, Reference Shin and Song2022; Moon and Kim, Reference Moon and Kim2023). We conducted three planned generational comparisons: MZ versus Generation X, MZ versus Baby Boomers and Generation X versus Baby Boomers. We used the permutation-based NCT to test global strength invariance, network structure invariance and edge-specific invariance across independent groups (Van Borkulo et al., Reference Van Borkulo, Van Bork, Boschloo, Kossakowski, Tio, Schoevers, Borsboom and Waldorp2023). Each comparison used 1,000 permutations and the weighted form of the NCT for continuous edge weights. Because each comparison generated many edge-wise tests, we controlled the false discovery rate (FDR) within each comparison using the Benjamini-Hochberg procedure. Supplementary subgroup tables report both raw and FDR-adjusted p-values, and the main text prioritizes FDR-significant findings while describing unadjusted p < 0.05 results that did not survive correction as nominal (Supplementary Tables 6–10).
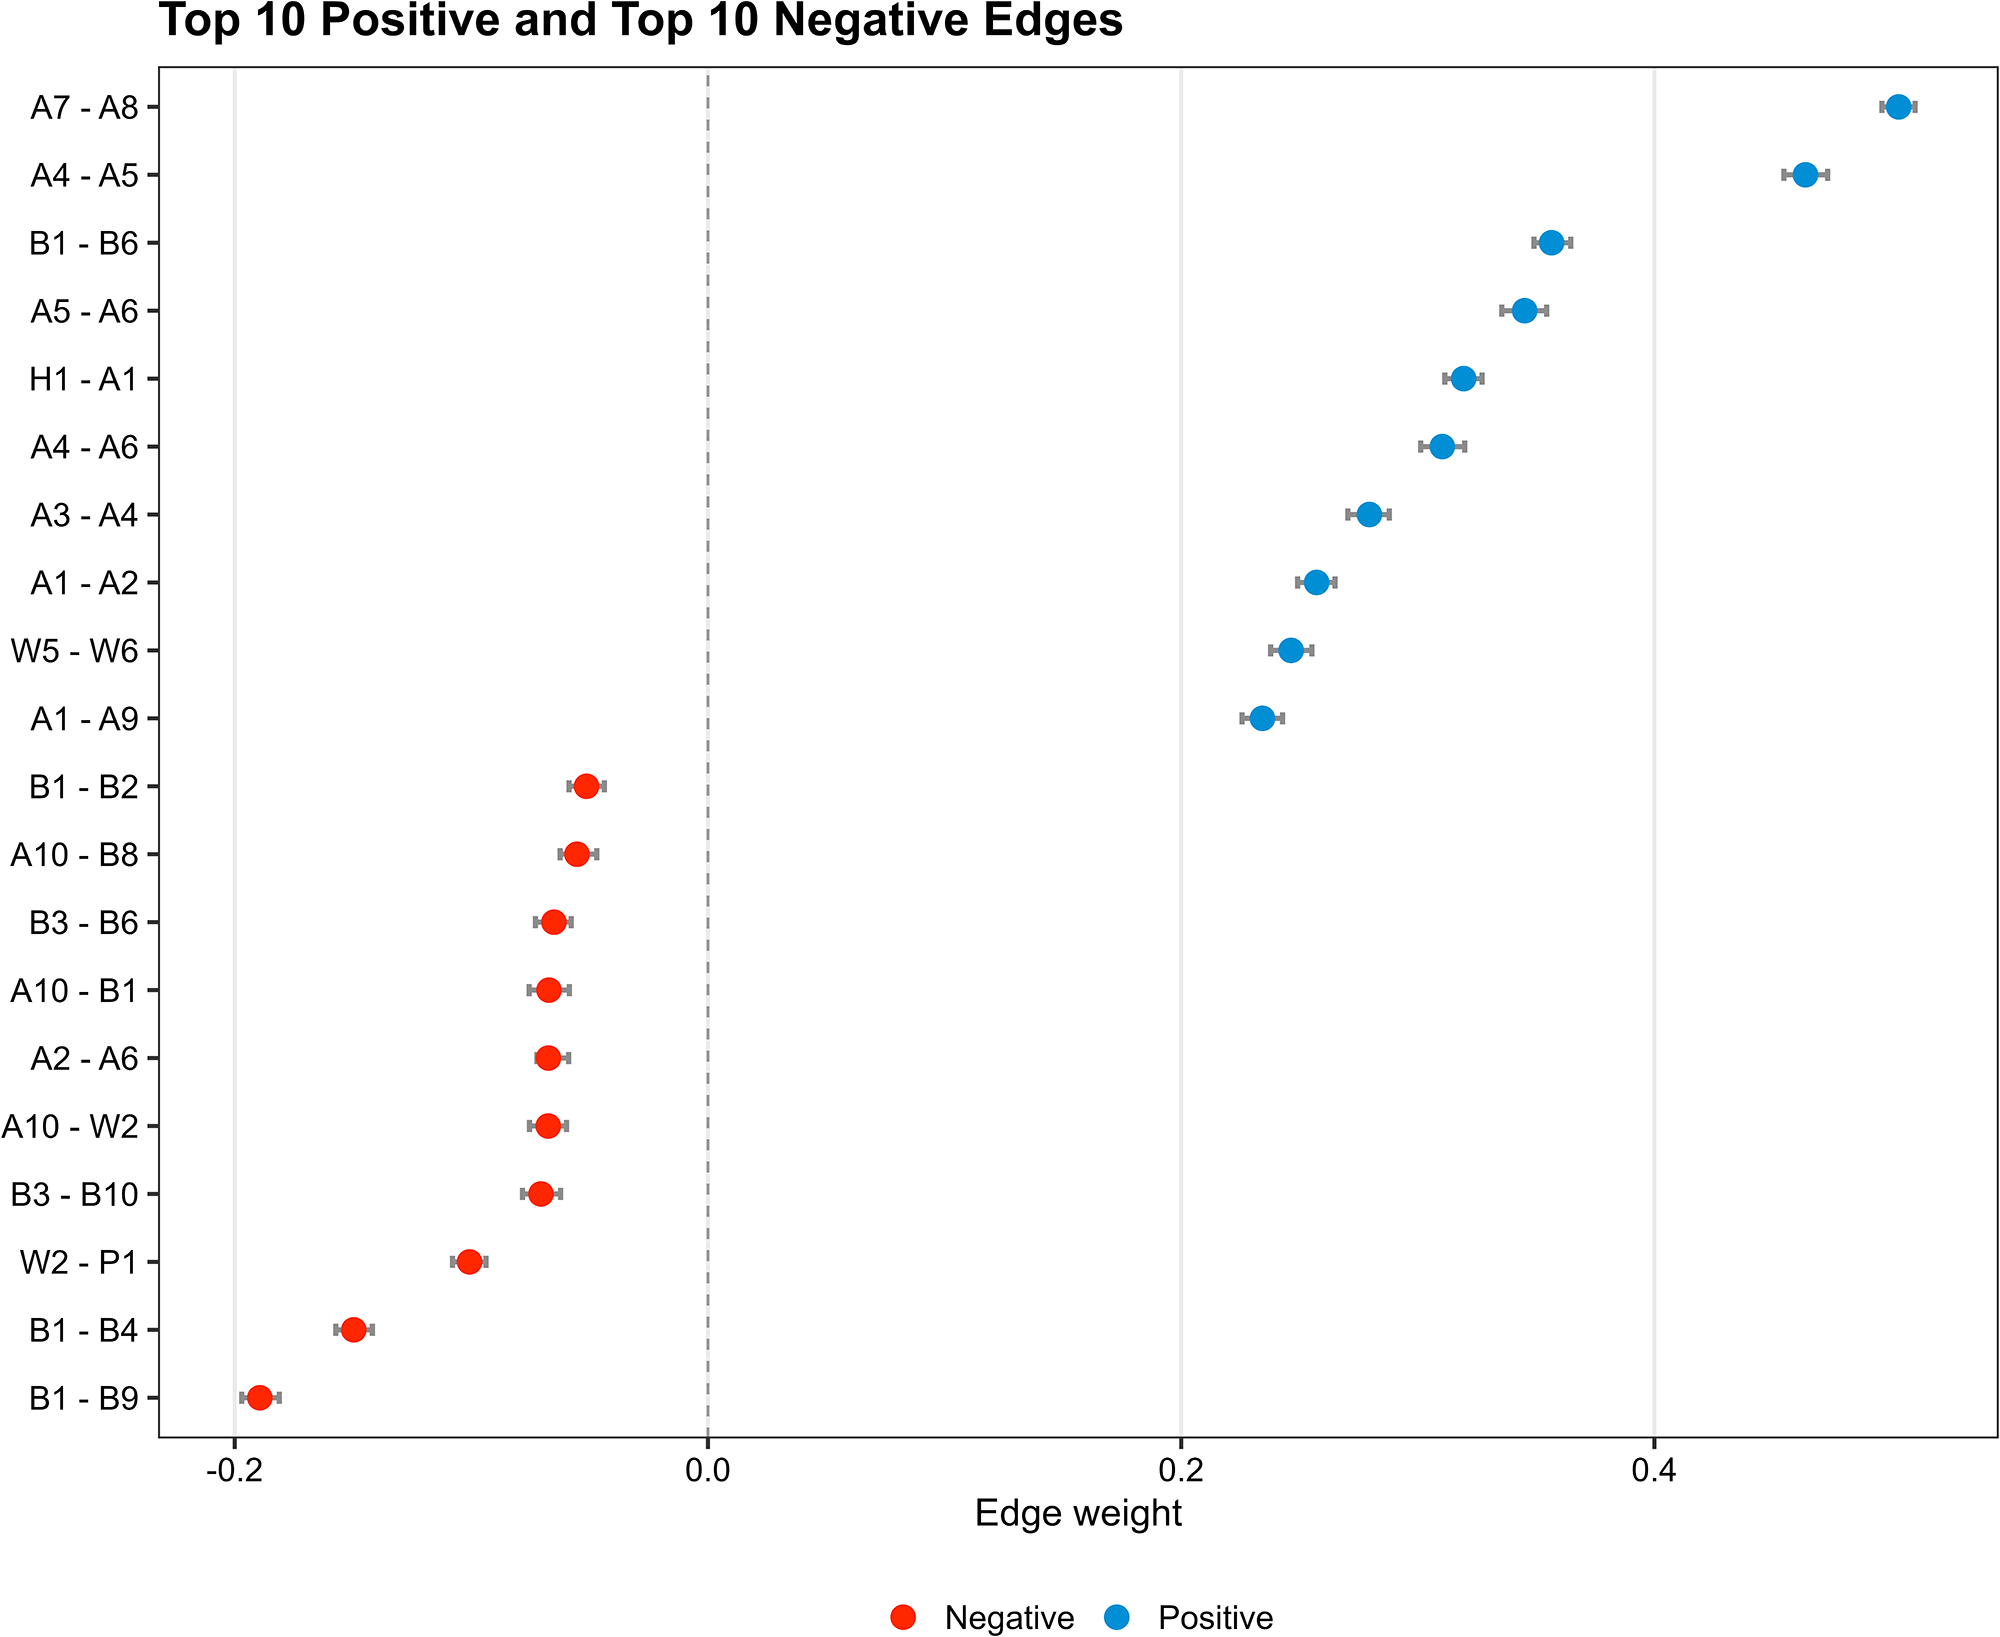
Given the large sample size and number of possible edges, we used a tiered interpretation strategy. For the overall network, we emphasized edge magnitude and visualized the 10 strongest positive and 10 strongest negative edges, with the full edge list and bootstrapped confidence intervals provided in Supplementary Table 5. Substantive interpretation focused on happiness-connected edges and theoretically meaningful affective or well-being evaluation edges. For centrality, we reported all indices but focused on strength and expected influence. For subgroup comparisons, we prioritized global strength and network structure tests, followed by happiness-connected edge differences that remained significant after FDR correction, with the full edge-specific results reported in Supplementary Tables 6–10; unadjusted findings were described as nominal.
As sensitivity analyses, we re-estimated the network separately for each survey year from 2020 to 2023 and compared 2020 and 2023 using the NCT (Supplementary Table 11). We also examined node predictability, bridge centrality and sensitivity to the EBIC tuning parameter (Supplementary Figure 3). Node predictability was defined as neighbour-based R 2, calculated from linear models fitted to z-standardized node scores using each node’s estimated neighbours as predictors. We additionally estimated bridge centrality across the predefined node communities of happiness, affect, satisfaction, politics and personality, focusing on bridge strength and bridge expected influence (Supplementary Table 12). Finally, we evaluated the stability of representative key edges, including happiness-centred and non-happiness affective edges, across EBIC gamma values of 0, 0.25 and 0.5 (Supplementary Table 13).
All analyses were conducted in R version 4.4.1 (2024-06-14) using the packages dplyr (1.1.4), tidyr (1.3.1), lavaan (0.6.21), psych (2.6.1), qgraph (1.9.8), bootnet (1.6), NetworkComparisonTest (2.2.2), networktools (1.5.2), ggplot2 (3.5.1), openxlsx (4.2.8) and RColorBrewer (1.1.3). Full analysis scripts used for data curation, measurement checks and network estimation are publicly available in the project GitHub repository.
Results
Sample characteristics are shown in Supplementary Table 4, and the distributions of the psychosocial variables included in the network are presented in Table 1.
Summary statistics of emotional, satisfaction, political orientation and personality variables

Table 1 Long description
Overall results are reported for 64,531 participants as means with standard deviations for happiness, affect, a modified Personal Wellbeing Index, political orientation, and Big Five Inventory-10 items. Affect scores on a 0 to 10 scale were: enjoyment 7.35 plus or minus 1.63, calm 6.95 plus or minus 1.91, worry 4.35 plus or minus 2.34, sadness 3.45 plus or minus 2.28, depression 3.39 plus or minus 2.28, anger 3.29 plus or minus 2.23, stress 4.69 plus or minus 2.27, tiredness 5.38 plus or minus 2.22, vitality 6.37 plus or minus 1.86, and loneliness 4.14 plus or minus 2.41. Modified Personal Wellbeing Index items on a 0 to 10 scale were: standard of living 6.17 plus or minus 1.48, health satisfaction 6.51 plus or minus 1.78, relationship satisfaction 6.48 plus or minus 1.56, safety 6.30 plus or minus 1.57, community belonging 6.08 plus or minus 1.70, future security 6.08 plus or minus 1.67, time for hobbies 6.16 plus or minus 1.65, and local environment 6.24 plus or minus 1.49. Political orientation on a 1 to 10 scale was 5.83 plus or minus 1.88, with missing reported as 2,856 or 4.4 percent. Big Five Inventory-10 items on a 1 to 5 scale were: extraversion part 1, 2.89 plus or minus 0.969; extraversion part 2, 3.12 plus or minus 0.954; agreeableness part 1, 3.13 plus or minus 0.862; agreeableness part 2, 2.70 plus or minus 0.938; conscientiousness part 1, 2.71 plus or minus 0.923; conscientiousness part 2, 3.43 plus or minus 0.808; neuroticism part 1, 3.31 plus or minus 0.843; neuroticism part 2, 3.02 plus or minus 0.848; openness to experience part 1, 2.91 plus or minus 0.857; and openness to experience part 2, 3.11 plus or minus 0.807.
Overall network and measurement checks
As shown in Figure 1, the overall network was moderately interconnected. Of 435 possible edges, 199 (45.7%) were estimated to be present. The strongest positive and negative edges were 0.504 and −0.189, respectively. The full list of estimated edge weights and their non-parametric 95% confidence intervals is provided in Supplementary Table 5 and Supplementary Figure 1.
Overall network of happiness, affect, well-being evaluations, political orientation and Big Five personality items.

Figure 1 Long description
The network diagram maps relationships among nodes grouped into five categories: happiness (H1), affect items (A1 to A10), well-being evaluations (W1 to W8), Big Five personality traits (B1 to B10) and political orientation (P1). Each node is labeled with a code and a full name listed in the accompanying key. The key reads as follows. H1 equals Happiness. A1 equals Enjoyment. A2 equals Calm. A3 equals Worry. A4 equals Sadness. A5 equals Depression. A6 equals Anger. A7 equals Stress. A8 equals Tiredness. A9 equals Vitality. A10 equals Loneliness. W1 equals Standard of living. W2 equals Health satisfaction. W3 equals Relationship satisfaction. W4 equals Safety. W5 equals Community belonging. W6 equals Future security. W7 equals Time for hobbies. W8 equals Local environment. P1 equals Political orientation. B1 equals Extraversion 1, reserved asterisk. B2 equals Extraversion 2, outgoing and sociable. B3 equals Agreeableness 1, generally trusting. B4 equals Agreeableness 2, finds fault with others asterisk. B5 equals Conscientiousness 1, tends to be lazy asterisk. B6 equals Conscientiousness 2, does a thorough job. B7 equals Neuroticism 1, relaxed and handles stress well asterisk. B8 equals Neuroticism 2, gets nervous easily. B9 equals Openness 1, has few artistic interests asterisk. B10 equals Openness 2, has an active imagination. Nodes within the same category are positioned close together. The affect nodes and well-being nodes form densely connected clusters near H1. The personality trait nodes form a separate cluster. P1 appears as a single node with fewer visible connections compared to the affect and well-being clusters. Edge thickness varies to indicate connection strength and edge appearance varies to indicate positive versus negative relationships. The thickest edges are concentrated between H1, A1, A2 and the well-being nodes, indicating the strongest links in the network. P1 connects to a limited number of nodes, appearing more peripheral relative to the affect and well-being clusters.
The affect block showed stronger psychometric support than the BFI-10. Internal consistency was adequate for positive affect and high for negative affect, and the two-factor affect model showed substantially better support than the BFI-10 in both MLR and WLSMV estimation. By contrast, the BFI-10 showed only modest pairwise coherence and poor equal-loading CFA fit. We therefore retained the BFI items as observed nodes in the network but interpreted personality-related edges cautiously. Detailed BFI-10 diagnostic fit indices and trait-level pair diagnostics are reported in Supplementary Tables 2 and 3.
Strongest overall edges
To highlight the strongest associations, Figure 2 displays the 10 strongest positive edges and the 10 strongest negative edges. Among the positive edges, the strongest connections were stress-tiredness (A7-A8; bootstrapped mean edge strength [BMES] = 0.504), sadness-depression (A4-A5; BMES = 0.464), B1-B6 (BMES = 0.357), depression-anger (A5-A6; BMES = 0.345) and happiness-enjoyment (H1-A1; BMES = 0.319). Among the negative edges, the strongest were B1-B9 (BMES = − 0.189), B1-B4 (BMES = −0.150), W2-P1 (BMES = −0.101), B3-B10 (BMES = −0.071) and A10-W2 (BMES = −0.068). Happiness (H1) and political orientation (P1) also showed a small positive edge (sample edge = 0.042; BMES = 0.042; 95% confidence interval = 0.034–0.050), indicating that political orientation was not entirely disconnected from happiness, although this association was substantially weaker than the dominant affective and evaluative edges.
Non-parametric bootstrapped 95% confidence intervals for the 10 strongest positive edges and 10 strongest negative edges in the overall network estimated from the total analytic sample.

Centrality and stability
We first evaluated the stability of the centrality estimates using a case-dropping bootstrap. The correlation stability coefficients were 0.75 for strength, closeness, betweenness and expected influence. These values indicate high stability under substantial case dropping. The corresponding bootstrap results are shown in Supplementary Figure 2.
Figure 3 presents the standardized centrality values for the overall network estimated in the full analytic sample. Because shortest-path indices are difficult to interpret substantively in psychometric networks, the interpretation focuses on strength and expected influence. In the strength panel, enjoyment (A1), depression (A5), sadness (A4), relationships satisfaction (W3) and stress (A7) showed the highest relative values. In the expected influence panel, sadness (A4), future security (W6), safety (W4), enjoyment (A1) and relationship satisfaction (W3) showed the highest values, whereas political orientation (P1) and several personality items, including B3, B4 and B7, appeared on the negative side of the expected influence axis. Happiness (H1) was approximately average in strength and modestly positive in expected influence.
Standardized centrality measures for the overall network in the total analytic sample.

Figure 3 Long description
Four panels show z-standardized strength, closeness, betweenness and expected influence (EI) for the 30 network nodes; a dashed vertical line at zero marks the mean of each metric. Enjoyment (A1), depression (A5), sadness (A4), relationship satisfaction (W3) and stress (A7) have the highest strength. Sadness (A4), future security (W6), safety (W4), enjoyment (A1) and relationship satisfaction (W3) have the highest EI. Political orientation (P1) and personality items B3, B4 and B7 are on the negative side of the EI axis. Happiness (H1) is near average in strength and modestly positive in EI. Overall, the graphs show different patterns of centrality across the variables, with some variables consistently high or low across multiple measures, indicating their varying importance in the network.
Subgroup comparisons
Using the NCT, we examined differences in network structure, global strength and edge-specific connections across subgroups defined by sex, income level and generation (Figure 4, Supplementary Tables 6–10).
Subgroup-specific networks by sex, income and generation.

Figure 4 Long description
.Seven subgroup networks use the same node layout. Nodes represent happiness (H1), affect (A1–A10), well-being evaluations (W1–W8), political orientation (P1), and Big Five personality items (B1–B10). Blue and red edges indicate positive and negative conditional associations, respectively, and edge thickness indicates absolute strength. Key H1-connected differences after false discovery rate correction are H1–B3 and H1–W7 by income and H1–A7 for MZ versus Baby Boomers. No H1-connected edge differs after correction by sex or between MZ and Generation X
For the sex comparison, overall connectivity did not differ significantly between men and women (global strength difference = 0.090, p = 0.514), but the network structure differed significantly (p = 0.001; Supplementary Table 6). However, no edge directly connected to happiness (H1) showed a statistically significant difference between the male and female networks. We therefore do not infer sex-specific differences in the immediate neighbourhood of happiness from the subgroup plots alone.
For the income comparison, overall connectivity again did not differ significantly between the low-income and high-income groups (global strength difference = 0.107, p = 0.927), whereas the network structure differed significantly (p = 0.002; Supplementary Table 7). Among the H1-connected edges, H1-B3 was negative in the low-income network and absent in the high-income network, and H1-W7 was stronger in the high-income network. Both differences remained significant after FDR correction. Additional nominal differences were observed for H1-P1 and H1-W6, which were stronger in the low-income network, and for H1-B6, which was present in the low-income network but absent in the high-income network.
In the comparison between the MZ generation and Generation X, overall connectivity did not differ significantly (global strength difference = 0.014, p = 0.938), but the network structure differed significantly (p = 0.003; Supplementary Table 8). No H1-connected edge survived FDR correction. At the nominal level, the H1-W2 edge was stronger in the Generation X network, whereas the H1-B6 edge was present in the MZ network but absent in the Generation X network.
In the comparison between the MZ generation and Baby Boomers, overall connectivity also did not differ significantly (global strength difference = 0.473, p = 0.805), but the network structure differed significantly (p = 0.001; Supplementary Table 9). In this comparison, the H1-A7 edge differed after FDR correction: it was absent in the MZ network but negative in the Baby Boomer network. A further nominal difference was observed for H1-A5, which was more negative in the MZ network than in the Baby Boomer network.
The comparison between Generation X and Baby Boomers showed no significant differences in either global strength (difference = 0.487, p = 0.588) or network structure (p = 0.091; Supplementary Table 10). Consistent with these results, No H1-connected edge survived false discovery rate correction.
Sensitivity analyses and supplementary diagnostics
As a sensitivity analysis, we re-estimated year-specific networks for 2020, 2021, 2022 and 2023. Several core edges recurred across all four waves, including stress-tiredness, sadness-depression and depression-anger. The happiness-enjoyment edge was present in each year, and the happiness-standard-of-living edge was also consistently positive. However, a formal comparison between 2020 and 2023 indicated differences in both global strength (difference = 0.930, p = 0.001) and network structure (p = 0.001; Supplementary Table 11). These findings suggest that the pooled network captures a recurring backbone of associations across waves but should be interpreted as an average conditional association structure across 2020–2023 rather than as a fully invariant yearly network.
Additional supplementary diagnostics further characterized the estimated network (Supplementary Figure 3). Node predictability varied substantially across nodes. The highest predictability values were observed for depression (A5, R 2 = 0.837), sadness (A4, R 2 = 0.831), anger (A6, R 2 = 0.788), future security (W6, R 2 = 0.638) and stress (A7, R 2 = 0.638). Happiness (H1) showed moderate predictability (R 2 = 0.472), whereas political orientation (P1, R 2 = 0.033) and several personality items showed comparatively low predictability. Bridge centrality analyses suggested that happiness (H1) and enjoyment (A1) were the strongest cross-community connectors in the overall network (Supplementary Table 12). A brief gamma sensitivity analysis of representative key edges, including happiness-centred and non-happiness affective edges, showed stable patterns across EBIC gamma values. The retained key edges H1-A1, H1-W1, H1-W2, A7-A8, A4-A5 and A5-A6 had nearly identical weights across gamma values, whereas H1-A4 remained absent across all gamma values (Supplementary Table 13).
Discussion
Using population-based survey data from South Korea, we modelled self-rated happiness within a network of affect, well-being evaluations, personality items and political orientation. Several patterns emerged. First, the network was affect-centred. Happiness showed its strongest direct connection with enjoyment, whereas negative affect items, especially stress-tiredness, sadness-depression and depression-anger, formed a tightly connected cluster. Supplementary diagnostics also showed that happiness and enjoyment had relatively high bridge centrality, suggesting that they linked affective and evaluative domains in the overall network. Political orientation showed only a small direct positive connection with happiness, much weaker than the ties linking happiness with enjoyment and selected well-being evaluation variables.
This pattern is broadly consistent with research that treats affective experience and evaluative judgments as core components of SWB (Diener et al., Reference Diener, Emmons, Larsen and Griffin1985). It also suggests that, in the Korean context, proximal emotional states may be more closely linked to self-rated happiness than broader ideological position. At the same time, evaluations of life circumstances were not peripheral. Standard of living, health satisfaction and future security remained connected to the broader happiness network, indicating that happiness in South Korea is embedded within both affective and material-evaluative domains rather than being reducible to either one alone.
Income-related subgroup differences were selective rather than global. After FDR correction, the H1-B3 edge was more negative in the low-income network, whereas the H1-W7 edge was stronger in the high-income network. Additional nominal differences were observed for H1-P1 and H1-W6, which were stronger in the low-income network, and for H1-B6, which was present only in the low-income network. No H1-connected affective edge differed significantly by income. Taken together, these findings suggest that income stratification may alter how happiness is linked to selected evaluative and personality-related items, but they do not support a broad claim that the high-income network is characterized by weaker affective ties. This interpretation is consistent with prior evidence that income is more strongly related to life evaluation than to positive affect and that discretionary time, leisure and perceived economic security are important correlates of SWB (Kahneman and Deaton, Reference Kahneman and Deaton2010; Hudson et al., Reference Hudson, Lucas, Donnellan and Kushlev2016; Masuda et al., Reference Masuda, Williams and Tallis2021).
Generational heterogeneity was also selective. No H1-connected edge survived FDR correction for the comparison between the MZ generation and Generation X, whereas the MZ versus Baby Boomer comparison showed an FDR-robust difference for H1-A7. The comparison between Generation X and Baby Boomers did not show significant differences in either global strength or network structure. Similarly, although the sex comparison showed significant structural differences at the network level, no H1-connected edge remained significant after FDR correction. These results suggest that subgroup variation was not characterized by a broad reorganization of all happiness-related ties, but rather by a limited number of specific edges.
Methodologically, this study contributes a nation-level item network of happiness in South Korea and extends prior Korean work that has typically modelled happiness as a composite score or summary outcome (Rudolf and Kang, Reference Rudolf and Kang2015; Lee and Bae, Reference Lee and Bae2022; Seol and Chun, Reference Seol and Chun2023). By embedding affect, well-being evaluations, personality items and political orientation within a single structure and formally comparing subgroup networks, the study identifies which observed associations were most proximal to self-rated happiness and which differed across key demographic groups. Year-stratified sensitivity analyses further suggested that the pooled network captured a recurring backbone of associations across 2020–2023, although the formal comparison between 2020 and 2023 indicated that the pooled network should be interpreted as an average conditional association structure rather than as a fully invariant yearly network.
Several limitations should be noted. First, because the network was estimated from cross-sectional data, the edges should be interpreted as undirected conditional associations rather than as causal or temporal relations. Second, regularization improves interpretability but may shrink weaker edges toward zero. Third, happiness was measured with a single item and personality with a brief inventory, so some edges may have been attenuated by measurement limitations. Fourth, political orientation had more missing data than most other variables, which may have reduced power to detect links in that domain. Fifth, subgroup definitions necessarily simplified the underlying constructs, including dichotomization of a categorical income variable and pooling of Millennials and Generation Z into a single MZ category. Sixth, although we controlled the FDR within each subgroup comparison and prioritized adjusted findings in the main text, nominal differences should still be interpreted cautiously. Finally, because the public-use survey files did not provide sampling weights, all analyses were unweighted, and the resulting estimates should be interpreted as reflecting the analytic sample rather than design-based population parameters.
Overall, the findings indicate that self-rated happiness in South Korea was most closely embedded in positive affect and tightly connected negative-affect clusters, while selected evaluative links varied across income and generation groups. These results do not identify causal intervention targets, but they do suggest concrete domains that may warrant closer attention in future longitudinal, intervention and psychiatric epidemiology research, including positive daily affect, tightly coupled negative affect, discretionary time and perceived future security. Because lower happiness has been linked to suicidal ideation and suicide attempts in Korean populations, clarifying these proximal associations may help prioritize candidate domains for future research on well-being and suicide prevention in South Korea (Choi et al., Reference Choi, Sempungu, Kim, Han and Lee2024).
Conclusion
This study provides a nation-level item network of self-rated happiness in South Korea and shows how happiness was embedded within affective, evaluative and personality-related associations. Its main contribution is to move beyond composite-score approaches by identifying which item-level links were most proximal to happiness and how selected associations differed across sex, income and generation. The results suggest that happiness in South Korea is closely tied to enjoyment and to a tightly connected cluster of negative affect, while subgroup differences are selective rather than global. Although these findings should be interpreted as cross-sectional conditional associations, they offer a more focused basis for future longitudinal, intervention and psychiatric epidemiology research on well-being, suicide prevention and mental health in South Korea.
Supplementary material
The supplementary material for this article can be found at https://doi.org/10.1017/S2045796026100973.
Availability of data and materials
The analysis code used for data curation, measurement checks and network estimation is publicly available at: https://github.com/doong-93/Korean-Happiness---Network-Analysis. The repository contains the R scripts used in this study. The data that support the findings of this study are available from the Korea Social Science Data Archive (KOSSDA) at https://kossda.snu.ac.kr/.
Acknowledgements
The authors used OpenAI ChatGPT (GPT-5 series; OpenAI, accessed via https://chatgpt.com between March and August 2026) to assist with English-language editing and the review and debugging of R code. All AI-assisted output was critically reviewed and verified by the authors. The authors independently executed the statistical analyses, checked all numerical results and references against the original outputs and source materials, and take full responsibility for the scientific content and conclusions of the article. No generative AI tool was used to generate the study data or figures.
Author contributions
Conceptualization – D.W.L., A.C.T., Y.X. Methodology – D.W.L., A.C.T. Formal analysis – D.W.L. Investigation – D.W.L. Resources – D.W.L. Data curation – D.W.L. Writing – original draft – D.W.L. Writing – review & editing – A.C.T., Y.X., S.J.J., S.S.O. Visualization – D.W.L. Supervision – A.C.T. Project administration – D.W.L. Funding acquisition – D.W.L., S.J.J.
Financial support
D.W.L. was supported by the Korea Health Technology R&D Project through the Korea Health Industry Development Institute (KHIDI), funded by the Ministry of Health & Welfare, Republic of Korea (No. RS-2023-00274416), and by the Massachusetts General Hospital Executive Committee on Research Fund for Medical Discovery Population Healthcare Sciences Research Fellowship Award. S.J.J. was supported by the National Research Foundation of Korea (NRF) grant funded by the Ministry of Science and ICT, Republic of Korea (No. RS-2025-00553462).
Competing interests
A.C.T. reports receiving a financial honorarium from Elsevier for his work as Co-Editor-in-Chief of the Elsevier-owned journal SSM – Mental Health and a financial honorarium from BMJ Publishing Group Ltd for his work as Clinical Editorial Advisor for the BMJ-owned journal The BMJ. The other authors report no competing interests.
Ethical standards
This study was reviewed by the Mass General Brigham Institutional Review Board and was determined not to involve human subjects, as it used de-identified data and did not include identifiable information. Therefore, formal IRB approval was not required. The authors assert that all procedures contributing to this work comply with the ethical standards of the relevant national and institutional committees on human experimentation and with the Declaration of Helsinki of 1975, as revised in 2008.




 Open access

