





While leftist parties remain more gender egalitarian, parties on the right – and particularly the far right – have increasingly sought to elevate women politicians and appeal to women voters (Chueri and Damerow Reference Chueri and Damerow2023; Meguid et al. Reference Meguid, Coffé, Weeks and Caul Kittilson2026). An expanding literature argues that these are sometimes strategic actions designed to reshape parties’ images, including making them appear more moderate, without entailing substantive ideological change (Ben-Shitrit, Elad-Strenger and Hirsch-Hoefler Reference Ben-Shitrit, Elad-Strenger and Hirsch-Hoefler2022; Porzycki, Oshri and Shenhav Reference Porzycki, Oshri and Shenhav2025; Weeks, Meguid, Kittilson et al. Reference Weeks, Meguid, Kittilson and Coffé2023). This argument rests on a claim that is frequently assumed but rarely tested directly: that citizens treat women’s inclusion as information about where parties stand ideologically.
Do citizens use gender inclusivity as a signal of party ideology? Prior research shows that gender shapes evaluations of individual politicians. Women candidates are often perceived as more left-leaning than comparable men (Devroe and Wauters Reference Devroe and Wauters2018), and women leaders are sometimes seen as more moderate (O’Brien Reference O’Brien2019). But citizens typically choose among parties, not individual politicians. Parties, moreover, signal women’s inclusion through multiple visible features at once, including who leads, who holds seats, who supports the party, and whether the party adopts organizational rules promoting women’s inclusion (i.e., voluntary gender quotas). Citizens thus may not only use gender to make inferences about individual politicians but also draw on multiple cues about parties’ gender inclusivity to infer party ideology.
We provide the first systematic test of whether gender inclusivity functions as a heuristic for placing parties on the left–right spectrum. We begin with observational evidence from 94 national election surveys across 21 Western democracies between 1996 and 2020. Controlling for the ideological content of party manifestos, we find that citizens perceive parties as more left-leaning when they appear more gender inclusive. We measure inclusivity through multiple cues: the gender composition of parties’ legislative delegations, party leadership, rank-and-file supporters, and the use of voluntary gender quotas. The combined effect of these signals on ideological placements is sizeable. Because unobserved party characteristics may jointly shape both inclusivity and ideological reputations, we then identify causal effects using conjoint experiments in Britain, Canada, Denmark, and Germany that randomly vary parties’ gender-inclusivity profiles. Across countries, respondents perceive parties described as more gender inclusive as being significantly more left-wing, all else equal.
The findings make three contributions. First, we test a widely invoked but largely untested assumption in both scholarship and popular discourse: that gender inclusivity shapes how citizens locate parties on the left–right spectrum. Our findings have implications for party competition and for how parties on both the right and the left manage their ideological reputations. Second, the results extend research on how citizens infer parties’ ideological positions. Existing work emphasizes cues such as leadership changes, coalition arrangements, and the cooperative or conflictual tone of party interactions (Adams, Weschle, and Wlezian Reference Adams, Weschle and Wlezien2021; Fernandez-Vazquez and Somer-Topcu Reference Fernandez-Vazquez and Somer-Topcu2019; Fortunato and Stevenson Reference Fortunato and Stevenson2013; Somer-Topcu Reference Somer-Topcu2017; Spoon and Klüver Reference Spoon and Klüver2017). We show that citizens also use patterns of gender inclusion and exclusion within parties as ideological information, in addition to what parties actually say or do. Third, the article advances gender and politics research on symbolic representation. Scholars have shown that citizens draw inferences from women’s inclusion (Bauer Reference Bauer2019; Cassese and Holman Reference Cassese and Holman2018; Holman Reference Holman2023; Stauffer Reference Stauffer2025; Taylor-Robinson and Geva Reference Taylor-Robinson and Geva2023; Wäckerle Reference Wäckerle2023). We extend this work by demonstrating that gender inclusivity also shapes parties’ perceived left–right positions and that citizens respond to multiple inclusivity signals at once, moving beyond single indicators of women’s presence toward a fuller account of how citizens integrate information about inclusion into their political assessments.
Heuristics, women’s representation, and citizens’ perceptions of politics
Citizens’ perceptions of parties’ left–right positions are central to many accounts of political behavior, especially in multi-party democracies. Voters’ left–right images of parties shape their expectations about coalition formation (Bowler, McElroy and Müller Reference Bowler, McElroy and Müller2022; Fortunato, Lee and Stevenson Reference Fortunato, Lee and Stevensonforthcoming), their beliefs about the policies those coalitions will pursue (Bowler, Gschwend and Indridason Reference Bowler, Gschwend and Indridason2020; Fortunato, Lin, Stevenson et al. Reference Fortunato, Lin, Stevenson and Wessel Tromborg2021), and the kinds and levels of strategic voting in which they engage (Bargsted and Kedar Reference Bargsted and Kedar2009). Understanding how citizens form these perceptions is therefore crucial for understanding democratic competition.
Existing work examines the factors that shape these perceptions, often making use of parties’ stated policy positions in their election manifestos (e.g., Adams, Ezrow and Somer-Topcu Reference Adams, Ezrow and Somer-Topcu2011). However, citizens do not rely solely on formal policy statements. Instead, they often draw on cognitive shortcuts (heuristics) that allow them to make inferences using limited but salient cues (Gigerenzer, Herwig and Pachur Reference Gigerenzer, Herwig and Pachur2011; Lee, Santoso and Stevenson Reference Lee, Santoso and Stevenson2026). Prior work demonstrates that citizens infer party ideologies from factors such as government participation (Fortunato and Stevenson Reference Fortunato and Stevenson2013; Spoon and Klüver Reference Spoon and Klüver2017), pre-electoral commitments to govern together (Falcó-Gimeno and Muñoz Reference Falcó-Gimeno and Munoz2017), and patterns of inter-party cooperation and conflict (Adams, Weschle and Wlezien Reference Adams, Weschle and Wlezien2021 ). These heuristics, in turn, help citizens navigate politics. When these cues are both visible and correlated with underlying party positions, such inferences can be ecologically rational.
Despite the central role heuristics play in shaping political perceptions, scholars have paid less attention to whether who is included in the party shapes how citizens perceive party ideology. This omission is notable because a large literature shows that citizens draw inferences from representatives’ ascriptive identities, especially gender. Women’s presence in elected office influences citizens’ sense of efficacy (Stauffer Reference Stauffer2025), trust and confidence in institutions (Barnes and Taylor-Robinson Reference Barnes and Taylor-Robinson2018; Schwindt-Bayer and Mishler Reference Schwindt-Bayer and Mishler2005; Toshkov and Cretti Reference Toshkov and Cretti2024), beliefs about women’s ability to govern (Alexander Reference Alexander2012), and perceptions of institutional legitimacy and responsiveness (Clayton, O’Brien and Piscopo Reference Clayton, O’Brien and Piscopo2026; Verge, Wiesehomeier and Espírito-Santo Reference Verge, Wiesehomeier and Espírito-Santo2020).
Related work shows that citizens hold gendered stereotypes about politicians. Evidence from the United States (Alexander and Andersen Reference Alexander and Andersen1993; Dolan Reference Dolan2010, Reference Dolan2014; Huddy and Terkildsen Reference Huddy and Terkildsen1993; King and Matland Reference King and Matland2003; Koch Reference Koch1997, Reference Koch2000, Reference Koch2002; Sanbonmatsu Reference Sanbonmatsu2002; Sanbonmatsu and Dolan Reference Sanbonmatsu and Dolan2009) and Flanders (Devroe and Wauters Reference Devroe and Wauters2018) suggests that women politicians are often perceived as more left-leaning than men, including in within-party comparisons (Koch Reference Koch2002; Sanbonmatsu and Dolan Reference Sanbonmatsu and Dolan2009). Citizens also tend to associate women politicians with issues such as education, childcare, health care, and poverty, which are often linked to left parties (Alexander and Andersen Reference Alexander and Andersen1993; Dolan Reference Dolan2014; Holman, Merolla and Zechmeister Reference Holman, Merolla and Zechmeister2017; Huddy and Terkildsen Reference Huddy and Terkildsen1993; Koch Reference Koch1997; Sanbonmatsu Reference Sanbonmatsu2002; Sanbonmatsu and Dolan Reference Sanbonmatsu and Dolan2009). Although this literature is largely US-focused, comparative evidence similarly suggests gendered issue inferences, for example, in evaluations of ministerial candidates in stereotypically feminine policy areas (Taylor-Robinson and Geva Reference Taylor-Robinson and Geva2023).
Citizens draw on gendered cues when evaluating both political institutions and individual politicians. Recent work shows that voters also respond to political parties’ gender composition, using it to make broader inferences about the party’s values. For example, parties with more women representatives tend to provoke less out-party hostility (Adams et al. Reference Adams, Bracken, Gidron, Horne, O’Brien and Senk2023), and voters express greater willingness to support parties with more gender-balanced delegations and women as lead candidates (Wäckerle Reference Wäckerle2023). Some scholars argue that citizens perceive gender inclusion as signaling moderation or mainstream legitimacy. Radical right parties, for instance, strategically nominate women to soften their extremist image (Weeks, Meguid, Kittilson et al. Reference Weeks, Meguid, Kittilson and Coffé2023), and increased visibility of women in Israeli politics has been shown to boost support for radical right parties, especially among women (Ben-Shitrit, Elad-Strenger and Hirsch-Hoefler Reference Ben-Shitrit, Elad-Strenger and Hirsch-Hoefler2022).
Despite this substantial body of work, we still do not know whether citizens use gender inclusivity to infer where parties stand on the left–right spectrum. Yet, there are good reasons to expect that more gender-inclusive parties will be perceived as further left. In many contexts, women’s political inclusion is linked to the left because left parties have longstanding ties to gender-egalitarian ideologies and progressive women’s movements (Beckwith Reference Beckwith2000). Leftist parties have also been more open to selecting women as candidates and cabinet ministers and more likely to incorporate feminist demands into party programs (Keith and Verge Reference Keith and Verge2018; O’Brien Reference O’Brien2018; Young Reference Young2000). Consistent with this association, women’s presence in a party’s parliamentary delegation is linked to more left-leaning behavior (Greene and O’Brien Reference Greene and O’Brien2016; Kittilson Reference Kittilson2011), and women-led parties tend to emphasize green, alternative, and libertarian issues (Kroeber Reference Kroeber2022). At the same time, other research (O’Brien Reference O’Brien2019) implies a more complicated relationship, suggesting that party leader gender shapes ideological perceptions in ways that are more consistent with perceived moderation, rather than a leftward shift.
We build on this literature in two ways. First, we test whether citizens use gender inclusivity to infer where parties stand on the left–right spectrum and, if they do, whether inclusivity shifts parties’ perceived positions leftward. Second, we conceptualize women’s inclusion not as an individual-level cue attached to a candidate, minister, or party leader, but as a party-level bundle of visible signals. We therefore define party gender inclusivity as a multidimensional concept – including who leads, who holds office, who supports the party, and whether the party adopts organizational rules intended to promote women’s inclusion – and test how these cues shape ideological placement.
Gender inclusivity as a signal of party ideology
Our central claim is that citizens use party gender inclusivity as an ideological cue when placing parties on the left–right spectrum. In particular, we expect that more gender-inclusive parties will be perceived as further left, because women’s inclusion is widely associated with egalitarian and progressive politics. We define party gender inclusivity as the extent to which women are incorporated into a party as representatives, leaders, and supporters, as well as through organizational rules intended to promote women’s inclusion.
Party gender inclusivity is conceptually distinct from both a party’s ideological orientation and its substantive policy positions on gender equality. A party may visibly incorporate women while advancing culturally conservative or exclusionary policy agendas (Celis and Childs Reference Celis and Childs2012; O’Brien Reference O’Brien2018), particularly when parties adopt inclusion selectively or strategically (Meguid et al. Reference Meguid, Coffé, Weeks and Caul Kittilson2026). Conversely, a party may advocate gender-equality policies without being gender-inclusive by our definition.
This distinction is central to our argument. Because citizens often possess limited information about parties’ policy positions, they may rely on visible signals of women’s inclusion as a readily available cue for inferring parties’ broader ideological orientation. We therefore expect citizens to perceive more gender-inclusive parties as further to the left, even though women’s visible incorporation does not necessarily reflect parties’ substantive commitments to gender equality.
Four visible cues of party gender inclusivity
One visible signal of party gender inclusivity is the gender composition of a party’s legislative delegation. We expect parties with higher proportions of women MPs to be perceived as more left-wing. This expectation is consistent with research on individual women candidates and legislators. Citizens hold gendered stereotypes about women politicians (Bauer Reference Bauer2019; Ben-Shitrit, Elad-Strenger and Hirsch-Hoefler Reference Ben-Shitrit, Elad-Strenger and Hirsch-Hoefler2022; Dolan Reference Dolan2014), and women legislators often campaign differently than men (Bauer and Santia Reference Bauer and Santia2023; Ennser-Jedenastik Reference Ennser-Jedenastik2017), communicate differently with constituents (Bauer and Cargile Reference Bauer and Cargile2023; Thomsen and Sanders Reference Thomsen and Sanders2020), and receive different media coverage (Bauer and Taylor Reference Bauer and Taylor2023; Kittilson and Fridkin Reference Kittilson and Fridkin2008). These individual-level patterns may scale up to shape party reputations. For example, media coverage of political parties increasingly emphasizes compassion-based issues as the proportion of women MPs rises (Greene and Lühiste Reference Greene and Lühiste2018). Taken together, we expect citizens to perceive parties with higher proportions of women MPs as more left-wing.
In addition to parliamentary delegations, we consider party leadership – an especially prominent signal of inclusion, but one for which prior research offers more mixed expectations and evidence. On the one hand, citizens increasingly draw inferences about parties based on their leaders, who are the public face of their organizations (Lobo and Curtice Reference Lobo and Curtice2015; McAllister Reference McAllister, LeDuc, Niemi and Norris1996; Stewart and Clarke Reference Stewart and Clarke1992). Indeed, changes in party leadership prompt voters to update their beliefs about party ideology (Fernandez-Vazquez and Somer-Topcu Reference Fernandez-Vazquez and Somer-Topcu2019; Somer-Topcu Reference Somer-Topcu2017). Research suggests that party leader gender is a particularly meaningful cue to voters: across five European countries, citizens prefer women as lead candidates (Wäckerle Reference Wäckerle2023), and in cross-national research covering roughly 600 party leaders in 46 countries over two decades, women leaders are, on average, evaluated more positively than comparable men (Dassonneville, Quinlan and McAllister Reference Dassonneville, Quinlan and McAllister2021). Survey data from Canada and New Zealand similarly indicate that voters assume women party leaders are better able to speak for women (Gidengil, Everitt and Banducci Reference Gidengil, Everitt and Banducci2010).
On the other hand, the gendered inferences discussed above do not always translate into broader party-level consequences. Despite women leaders’ popularity advantage, parties do not appear to benefit electorally from having a woman leader (Dassonneville, Quinlan and McAllister Reference Dassonneville, Quinlan and McAllister2021), and evidence of gender–trait stereotyping is limited (Gidengil, Everitt and Banducci Reference Gidengil, Everitt and Banducci2010). Most relevant for our purposes, O’Brien (Reference O’Brien2019) provides observational evidence that leader gender can shift parties’ perceived ideologies, but in ways that depend on party context: women-led right parties are perceived as more left-leaning, whereas women-led left parties are not perceived as more left-wing. More broadly, O’Brien (Reference O’Brien2019) argues that the dominant inference from women’s leadership is often moderation rather than a uniform leftward shift. Even so, because women’s inclusion remains closely associated with the left, we expect parties with women leaders to be perceived, on average, as somewhat more left-leaning, though this cue is likely weaker and more conditional than other signals of inclusivity.
A third cue comes from parties’ organizational rules, such as voluntary candidate gender quotas, which constitute an explicit, formal commitment to gender inclusivity. Distinct from statutory quotas, voluntary quotas are not legally mandated but are internally enforced by the parties themselves (Krook Reference Krook2009; Verge Reference Verge2012). Importantly, unlike the composition of a party’s candidates or leadership, voluntary quotas reflect an explicit organizational decision to prioritize gender inclusion by embedding it in formal party rules. Quotas signal that a party prioritizes the inclusion of historically underrepresented groups (Clayton, O’Brien and Piscopo Reference Clayton, O’Brien and Piscopo2026; Hinojosa and Kittilson Reference Hinojosa and Kittilson2020) and are often framed as interventionist policies that challenge conservative commitments to individualism and meritocracy (Besley, Folke, Persson et al. Reference Besley, Folke, Persson and Rickne2017; Dahlerup Reference Dahlerup2007; O’Brien Reference O’Brien2018). Although voluntary quotas are internal party rules, debates surrounding their adoption can increase the visibility of parties’ commitments to inclusion, contributing to their broader reputations on gender equality (Dahlerup Reference Dahlerup2007; Krook Reference Krook2009).
Not all left parties implement voluntary gender quotas, and some non-left parties have also adopted them (O’Brien Reference O’Brien2018; Verge Reference Verge2012). Yet, quotas are closely associated with the left: they originated with green and other left-wing niche parties (Caul Reference Caul2001; Davidson-Schmich Reference Davidson-Schmich2006, Reference Davidson-Schmich2016; Verge Reference Verge2012), and left parties are more likely to adopt higher threshold quotas, to meet those targets, and to support statutory quotas that would apply to all parties (Davidson-Schmich Reference Davidson-Schmich2006, Reference Davidson-Schmich2016; Kittilson Reference Kittilson2006; Verge Reference Verge2012). Because voluntary quotas publicly institutionalize a party’s commitment to gender inclusion – and because such quotas have historically been championed by left parties – we expect citizens to perceive parties with voluntary candidate gender quotas as more left-leaning.
Finally, citizens may also draw gender-inclusive cues from parties’ rank-and-file supporters. Across most Western publics, women citizens now tend to be somewhat more left-wing than men (Barnes, Beall and Cassese Reference Barnes, Beall and Cassese2021; Dassonneville Reference Dassonneville2021; Di Landro Reference Di Landro2025; Shorrocks Reference Shorrocks2018), with larger gender gaps emerging among younger generations (Campbell and Cowper-Coles Reference Campbell and Cowper-Coles2025). Left parties also have longstanding ties to progressive women’s movements (Beckwith Reference Beckwith2000). Conversely, men are disproportionately likely to support many populist radical right parties (Harteveld, Brug, Dahlberg et al. Reference Harteveld, Brug, Dahlberg and Kokkonen2015; Harteveld and Ivarsflaten Reference Harteveld and Ivarsflaten2018; Immerzeel, Coffé and Van der Lippe Reference Immerzeel, Coffé and Van der Lippe2015; Rippeyoung Reference Rippeyoung2007), and citizens perceive right-wing parties as more masculine (Elad-Strenger, Ben-Shitrit and Hirsch-Hoefler Reference Elad-Strenger, Ben-Shitrit and Hirsch-Hoefler2024; Köttig, Renate and Andrea Reference Köttig, Renate and Andrea2017). Together, these patterns create a strong association between party ideology and the gender composition of parties’ electoral coalitions.
Citizens also appear to be aware of social group-party linkages. In the United States, affective polarization has increasingly sorted social identities along partisan lines, such that perceptions of parties are shaped in part by who supports them (Mason Reference Mason2015). Consistent with this argument, our analysis of YouGov data shows that Americans strongly identify Democrats as the ‘party of women’ and Republicans as the ‘party of men’ (online Appendix G). Similar patterns emerge outside the US. UK voters accurately associate social groups with political parties, and this knowledge closely tracks party elites’ rhetoric (Dausgaard and Hjorth Reference Dausgaard and Hjorth2026). Danish voters likewise associate left parties with working-class constituencies and right parties with more affluent voters (Stubager and Slothuus Reference Stubager and Slothuus2013). Indeed, Lee, Santoso and Stevenson (Reference Lee, Santoso and Stevenson2026) argue that citizens use these group-party associations as cues when locating parties on the ideological spectrum. If citizens similarly associate women with parties of the left and men with parties of the right, they should perceive parties with higher proportions of women supporters as more left-leaning.
Can citizens apply a gendered heuristic?
We expect parties to be perceived as more left-leaning, even accounting for their stated policy positions, when they elect more women MPs, are led by a woman, implement candidate gender quotas, and attract more women supporters. Importantly, citizens need not possess precise information about each of these features to use a gender-based heuristic. Instead, they need only a broad sense of a party’s gender inclusivity. Nor do we expect all four dimensions to be equally salient. Women leaders and parliamentarians, for example, are likely to be more immediately visible than in internal organizational roles. Our argument does not require that citizens directly observe every dimension of party gender inclusivity. Rather, we expect broader impressions of parties’ gender inclusivity to emerge from multiple, overlapping sources of information that reflect different dimensions of women’s inclusion.
Such impressions could emerge through multiple channels. Party elites may communicate information about gender inclusivity through campaign messages, party manifestos, and public statements, highlighting women candidates, women leaders, organizational commitments such as candidate quotas, and the constituencies they seek to represent (O’Brien Reference O’Brien2018). The news media may also expose citizens to these cues by covering women politicians, party leadership contests, debates over candidate quotas, and gender gaps in party support (Campbell Reference Campbell2016; Greene and Lühiste Reference Greene and Lühiste2018). Finally, citizens encounter politics in their everyday lives through election campaigns, political discussion, and interactions with family, friends, coworkers, and other members of their social networks, which may contribute to broader impressions of which parties’ elect women and who supports them. We do not argue that any one of these channels is necessary or sufficient. Rather, repeated exposure across these sources may provide citizens with enough information to form broad perceptions of parties’ gender inclusivity without requiring detailed factual knowledge.
While surveys rarely ask respondents directly about perceptions of party-level gender inclusivity, many citizens appear broadly aware of these gender cues. In the U.S., while only one-third of respondents know how many women are in Congress, a majority know the gender of their senator and the gender composition of the Supreme Court (Dolan Reference Dolan2011). In Uruguay, Hinojosa and Kittilson (Reference Hinojosa and Kittilson2020) find that respondents accurately perceived that women’s representation increased following the implementation of a gender quota. Looking across twelve democracies, Clayton, O’Brien and Piscopo (Reference Clayton, O’Brien and Piscopo2026) find that citizens are generally aware of whether their country or major parties have adopted quota policies, even if they are less likely to correctly identify the specific threshold or design of those quotas. And in the four countries included in our survey experiments described below, citizens display high levels of awareness about which parties receive more support from women voters.Footnote 1
Taken together, this evidence suggests that citizens, even those who are not deeply knowledgeable about politics, possess enough information about the gender inclusivity of parties to apply a gender-based heuristic. Our argument, moreover, rests on the idea that citizens observe multiple dimensions of inclusivity at once. Although we expect each dimension to individually influence parties’ perceived ideologies, they are not independent. As we show below, being inclusive on one dimension increases the likelihood of being inclusive on the others. This interconnectedness is, in fact, central to the concept of a gender-based heuristic. Citizens often simultaneously observe parties electing more women politicians alongside formal commitments to gender inclusivity and greater support from women in the electorate. When considering each factor in isolation, its effect may be modest. Taken together, however, these cues may offer a powerful signal.
Measuring gender inclusivity
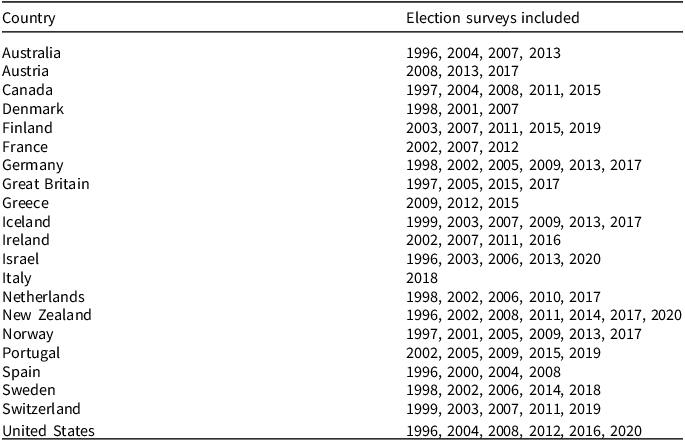
To test for the presence of a gender-based heuristic, we first analyze survey data to assess whether respondents perceive more gender-inclusive parties as more left-leaning, even when accounting for the parties’ stated policy positions. Our data on citizens’ left–right party placements come from the Comparative Study of Electoral Systems (CSES; Giebler, Lichteblau, May et al. Reference Giebler, Lichteblau, May, Melcher, Wagner and Weßels2016). The common module of the CSES surveys asks respondents to place themselves and political parties on a 0–10 left–right scale, where higher values denote more right-wing positions. We analyze CSES respondents’ party placements from 94 election surveys across 21 Western democracies between 1996 and 2020, listed in Table 1. Our dataset contains citizens’ left–right perceptions of 153 different parties, most of which were observed across multiple CSES surveys over this period. The total number of party-years in our study is 480. Table A1 in the Appendix lists these parties.
Countries and election-year surveys included in the analyses

Table 1. Long description
The table has two columns: Country and Election surveys included. It lists 21 countries and the corresponding election years surveyed. Row 1: Australia, 1996, 2004, 2007, 2013. Row 2: Austria, 2008, 2013, 2017. Row 3: Canada, 1997, 2004, 2008, 2011, 2015. Row 4: Denmark, 1998, 2001, 2007. Row 5: Finland, 2003, 2007, 2011, 2015, 2019. Row 6: France, 2002, 2007, 2012. Row 7: Germany, 1998, 2002, 2005, 2009, 2013, 2017. Row 8: Great Britain, 1997, 2005, 2015, 2017. Row 9: Greece, 2009, 2012, 2015. Row 10: Iceland, 1999, 2003, 2007, 2009, 2013, 2017. Row 11: Ireland, 2002, 2007, 2011, 2016. Row 12: Israel, 1996, 2003, 2006, 2013, 2020. Row 13: Italy, 2018. Row 14: Netherlands, 1998, 2002, 2006, 2010, 2017. Row 15: New Zealand, 1996, 2002, 2008, 2011, 2014, 2017, 2020. Row 16: Norway, 1997, 2001, 2005, 2009, 2013, 2017. Row 17: Portugal, 2002, 2005, 2009, 2015, 2019. Row 18: Spain, 1996, 2000, 2004, 2008. Row 19: Sweden, 1998, 2002, 2006, 2014, 2018. Row 20: Switzerland, 1999, 2003, 2007, 2011, 2019. Row 21: United States, 1996, 2004, 2008, 2012, 2016, 2020.
Notes: The table lists the election-year surveys from the Comparative Study of Electoral Systems that we analyzed in our study. Table A1 in the Appendix lists the parties included in the study.
The dependent variable in our observational analyses is [survey respondent i’s left-right placement of party j (t)], defined as a survey respondent i’s left–right placement of a party j in election-year t. Each respondent enters our dataset once for each party placement that they provided, and our pooled analyses across the CSES surveys listed in Table 1 cover 147,904 respondents who collectively provided 609,935 party placements, for an average of slightly more than four party placements per respondent.
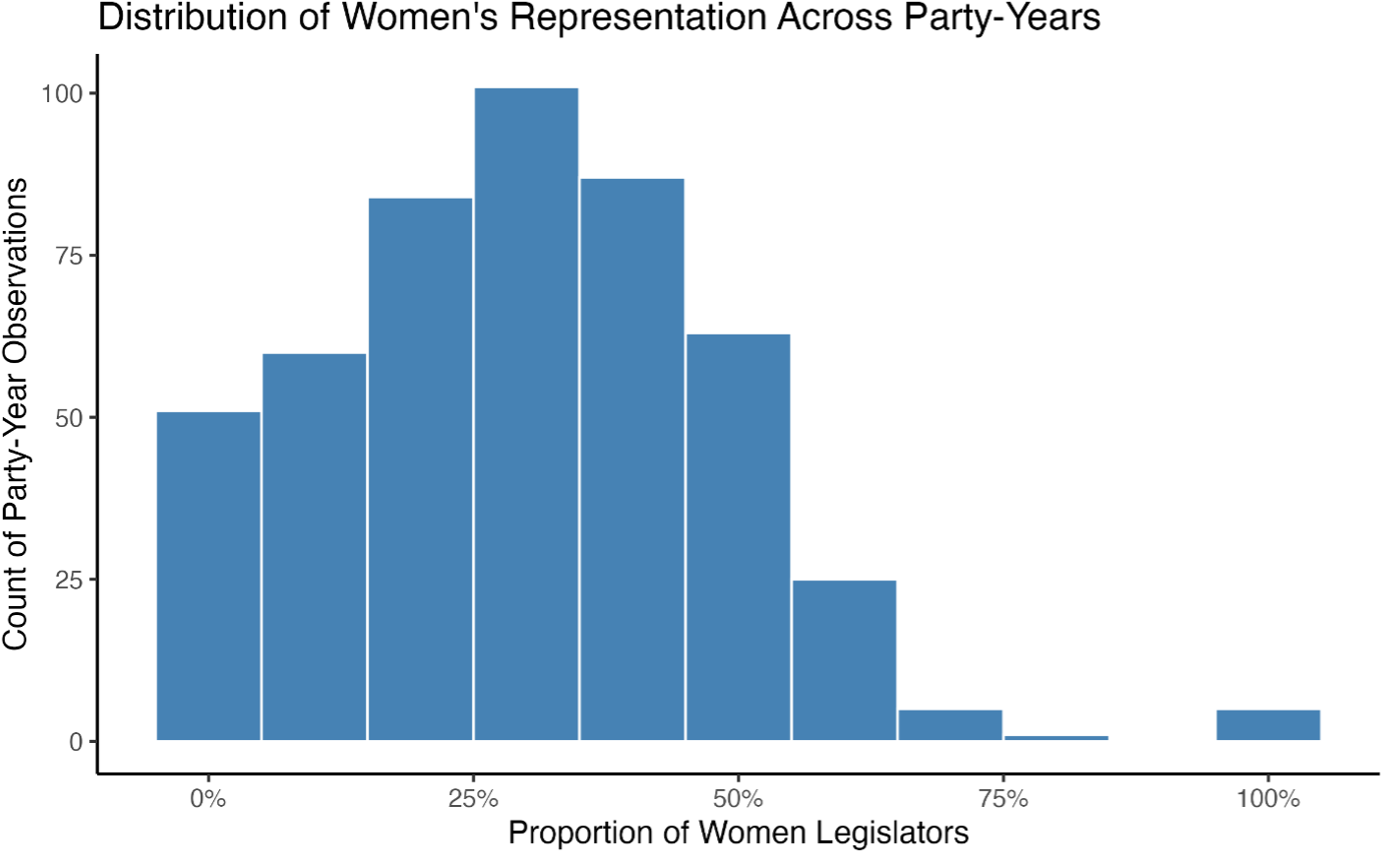
Our four key independent variables capture parties’ gender inclusivity. The first variable, [party j’s proportion of women MPs (t – 1)], is party j’s parliamentary gender composition following the previous election, scaled from zero (all of j’s MPs were men) to one (all were women). For example, for the 2013 German parliamentary election, data on the gender composition of political parties are drawn from 2009. Figure 1 displays the distribution of the proportions of women MPs across all party parliamentary delegations in our study, segmented into deciles (0.0 to 0.1, 0.1 to 0.2, etc.). In Appendix Figure A1, we plot these data by party-family. Between 1996 and 2020, the mean proportion of women representatives in parties’ parliamentary delegations was only 0.30 (SD = 0.18), and roughly one in three party delegations featured less than 20% women. Fewer than 10% were majority-women.
Women’s representation in party parliamentary delegations across 21 Western publics, 1996–2020.
Notes: The figure displays the distribution of the proportions of women MPs in the parliamentary delegations of all party-years in our study. Table 1 above reports the country-election years.

The second gender inclusivity measure, [party j’s leader is a woman (t – 1)], records the gender of the party’s leader in the run-up to the current CSES election survey, coded 1 for women and 0 for men. For the small number of parties with co-leadership arrangements in which one leader is a woman and the other is a man (e.g., the German Green Party), we code the variable as 0.5. Only 23% of the party-years in our dataset featured women leaders. The third measure, [party j has a candidate gender quota (t)], indicates whether party j had a candidate gender quota at the time of the current election that it adopted voluntarily. In our dataset, 25.3% of the party-years featured voluntary gender quotas.
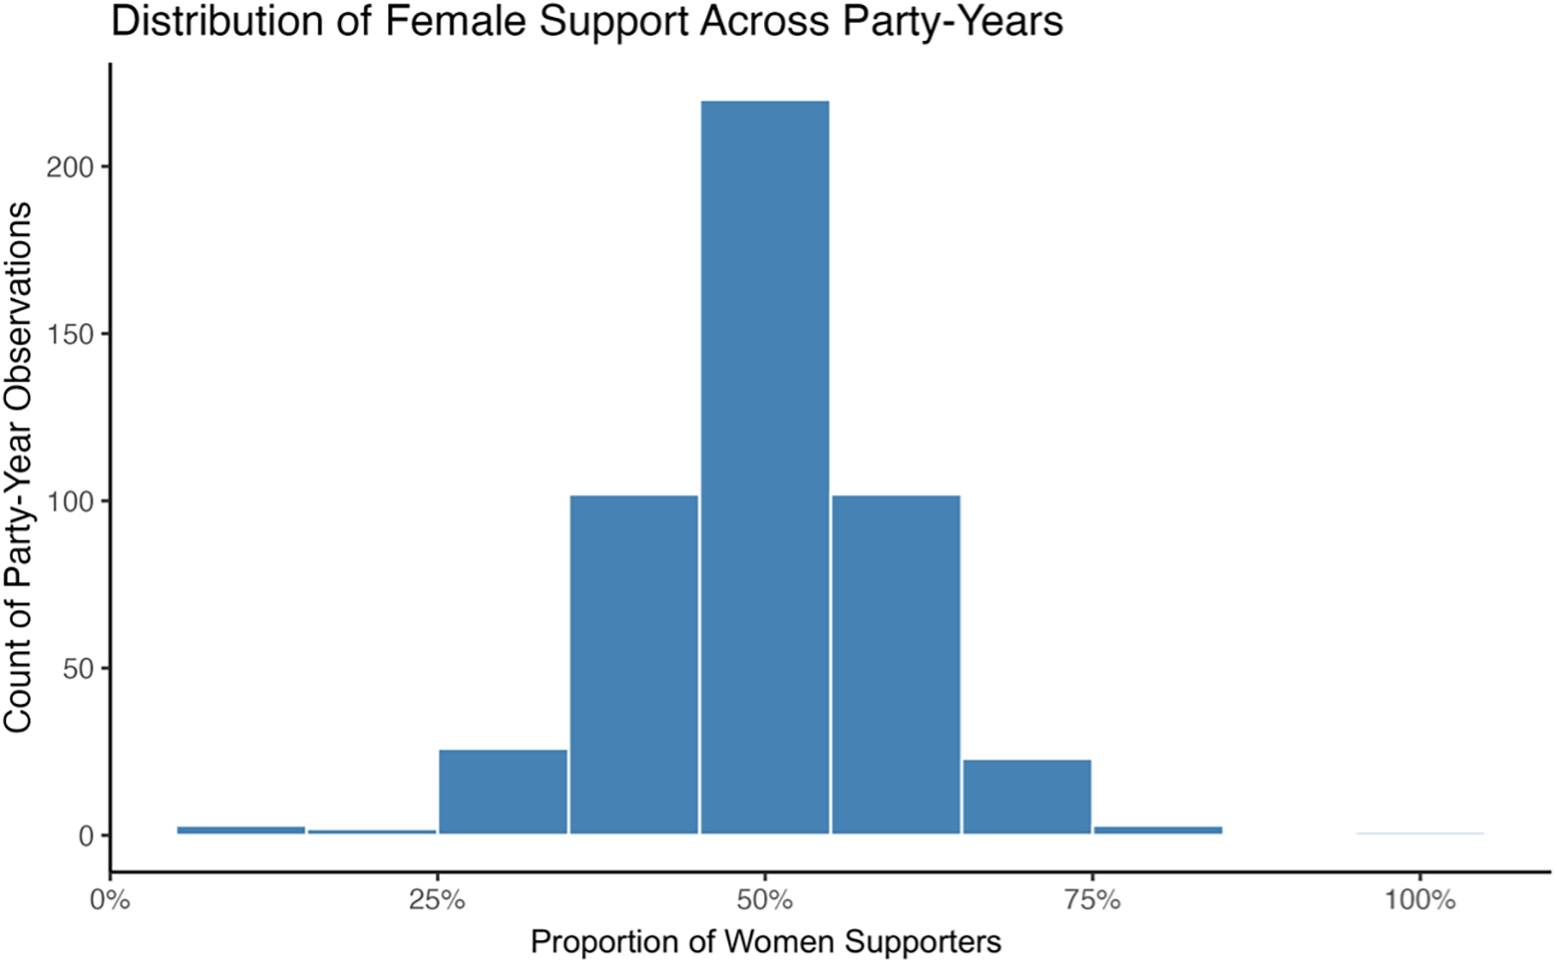
The fourth measure of gender-inclusive parties, [party j’s proportion of women supporters (t)], is the proportion of the women among CSES survey respondents who reported voting for party j in election year t. This variable is also scaled from zero (all of j’s CSES supporters in year t were men) to one (all were women). Figure 2 displays the distribution of women’s representation among party supporters across all the party-years in our study, segmented into deciles. The mean proportion of women supporters was 0.50 (SD = 0.10). In Appendix Figure A2, we plot these data by party-family.
Proportion of women party supporters across 21 Western publics, 1996–2020.
Notes: The figure displays, for all party-years in our study, the distribution of the proportion of each party’s supporters who were women, measured among CSES respondents who reported voting for that party in the current election year. Table 1 reports the country-election years included in the analysis.

For citizens to rely on a gender-based heuristic when evaluating parties, cues of gender inclusivity must be both broadly accurate and easily observable. If gender-inclusive cues provide meaningful information about party ideology, more gender-inclusive parties should, on average, be more left-leaning. This is, in fact, what we find. In our data, gender inclusivity is correlated with the ideological tone of party manifestos, as measured by the RILE index from the Comparative Manifesto Project.Footnote 2 This suggests that gender-inclusive cues provide meaningful information about party ideology and, therefore, constitute a potentially useful heuristic.
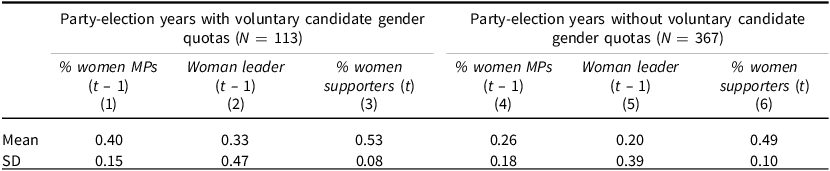
In addition to being informative, a successful heuristic must also be visible. One implication is that different indicators of gender inclusivity should reinforce one another. Indeed, our four measures – the proportion of women MPs, women’s presence in party leadership, the presence of voluntary candidate gender quotas, and the proportion of women supporters – are positively associated. Table 2 compares levels of women’s descriptive representation for parties with and without voluntary quotas.
Descriptive statistics on gender inclusivity

Table 2. Long description
A table comparing gender inclusivity metrics for party-election years with and without voluntary candidate gender quotas. The table has two main sections: one for party-election years with voluntary candidate gender quotas (113 instances) and one for those without (367 instances). Each section includes three columns: percentage of women MPs, woman leader, and percentage of women supporters. The first section shows mean values of 40 percent for women MPs, 33 percent for woman leader, and 53 percent for women supporters, with standard deviations of 0.15, 0.47, and 0.08 respectively. The second section shows mean values of 26 percent for women MPs, 20 percent for woman leader, and 49 percent for women supporters, with standard deviations of 0.18, 0.39, and 0.10 respectively.
Notes: The table displays descriptive statistics on parties’ gender representation for the 480 party-years in our dataset. Table A1 in the Appendix lists the parties included in the dataset.
Parties with quotas display higher average proportions of women MPs (0.40 vs. 0.26), women leaders (0.33 vs. 0.20), and women supporters (0.53 vs. 0.49). Moreover, women’s representation in parliamentary delegations is significantly correlated with their representation among party supporters (r = 0.21, p < 0.01). These patterns suggest that the different components of gender inclusivity tend to align, such that citizens need not observe all dimensions to form a reasonable estimate of a party’s overall gender inclusivity. Gender-based heuristics are thus not only ecologically rational but also broadly accessible to citizens.
Observational data analyses
To evaluate our expectation that gender inclusivity is related to citizens’ left–right party placements, we regress our outcome variable, [survey respondent i’s left-right placement of party j (t)], on the four measures of gender inclusivity described above. We also control for an objective party position measure, [party j’s left-right manifesto coding (t)], defined as the left–right tone of the party’s manifesto published during the current election campaign (RILE), based on the manifesto codings compiled by the Comparative Manifesto Project.Footnote 3 The RILE scale runs from −100 to +100, where higher values denote a more right-wing tone. We standardize this variable to estimate the effect of a one standard deviation change in the RILE score (about 18 points). Accounting for this measure is important because, as we explain above, gender inclusivity correlates with the left–right tone of party manifestos in our data. We also estimate country-election fixed effects, so our estimates are identified by within-survey comparisons. Accordingly, the only variation in the data used to identify our estimates occurs between parties in the same survey.
Results
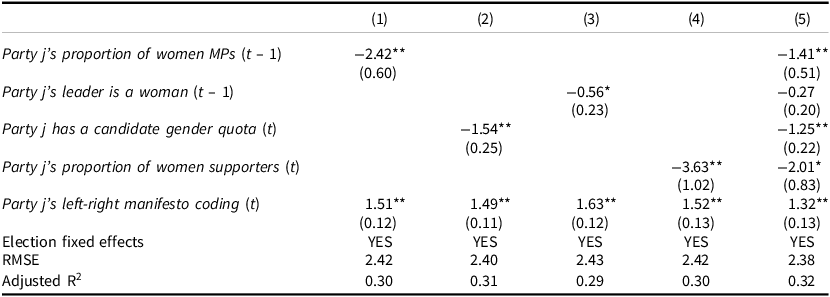
Table 3 reports the results of models predicting respondent i’s placement of party j on the 0–10 left–right scale in CSES country-year t, estimated with election fixed effects on a dataset that contains more than 600,000 respondent-party placements. The first four models (columns 1–4) include the four dimensions of party gender inclusivity, one at a time, along with the RILE control. Each gender inclusivity measure significantly predicts respondents’ party placements, even when controlling for the party’s manifesto tone. Model 5 (column 5) includes all four dimensions of party gender inclusivity along with the RILE control. Again, when accounting for the party’s manifesto tone, survey respondents systematically place more inclusive parties at more left-wing positions. Each coefficient is statistically significant except for the party leader, which is in the expected direction but not statistically significant.Footnote 4
The effects of gender inclusivity on perceived party positions (N = 609,935)

Table 3. Long description
The table has five columns and eight rows, including a header row. The columns are labeled (1), (2), (3), (4), and (5). The rows include various predictors and their coefficients. Row 1: Party’s proportion of women MPs (t-1) with coefficients -2.42, -0.56, -1.54, -3.63, and -1.41. Row 2: Party’s leader is a woman (t-1) with coefficients -0.27 and -0.27. Row 3: Party has a candidate gender quota (t) with coefficients -1.25. Row 4: Party’s proportion of women supporters (t) with coefficients -2.01. Row 5: Party’s left-right manifesto coding (t) with coefficients 1.51, 1.49, 1.63, 1.52, and 1.32. Row 6: Election fixed effects with YES in all columns. Row 7: RMSE with values 2.42, 2.40, 2.43, 2.42, and 2.38. Row 8: Adjusted R-squared with values 0.30, 0.31, 0.29, 0.30, and 0.32.
**p ≤ 0.01; *p ≤ 0.05: two-tailed tests.
Notes: The dependent variable is respondent i’s placement of party j in election year t on a 0–10 left-right scale (0 = left, 10 = right). Independent variables are described in the text. OLS models include country-election fixed effects and standard errors clustered by election. Table A4 reports models with individual fixed effects; Table A7 reports random-effects models with random intercepts for individuals and country-year.
The coefficient on the [party j’s proportion of women MPs (t – 1)] variable in the fully-specified model (Model 5), −1.41 (p < 0.01), means that a one-standard-deviation increase in the proportion of women MPs in party j’s parliamentary delegation (0.18) is associated with a predicted shift of about 0.25 units to the left in respondents’ placements of party j on the 0–10 left–right scale, all else equal. The estimate on the [party j has a candidate gender quota (t)] variable, −1.25 (p < 0.01), denotes that respondents’ predicted party placements are 1.25 units more leftward when the party has adopted a voluntary gender quota. The coefficient on the [party j’s proportion of women supporters (t)] variable, −2.01 (p < 0.05), indicates that as the proportion of party j’s women supporters increases by one standard deviation (0.10), respondents’ predicted left–right party placements shift about 0.20 units farther left, all else equal. Finally, the coefficient on the [party j’s leader is a woman (t – 1)] variable, −0.27, is in a leftward direction but not statistically significant, consistent with prior work showing that the effects of women’s leadership on perceived party ideology are mixed and often depend on party context.
The estimated relationships between party gender inclusivity and perceived left–right positions are substantively significant, particularly given that these measures are correlated. As reported in Table 2, parties in our dataset without voluntary gender quotas averaged about 26% women MPs and 49% women among their rank-and-file supporters, while parties with gender quotas averaged about 40% women MPs and 53% women supporters. These differences imply that, controlling for the party’s left–right manifesto tone and its leader’s gender, a party that voluntarily adopts a candidate gender quota is predicted to be placed 1.62 points further to the left than a party without a quota when both parties’ proportions of women MPs and women supporters are set to the corresponding group means reported in Table 2. This effect is substantively large: it exceeds the predicted effect of a one-standard-deviation change in the party’s RILE score, which shifts the party’s predicted perceived position by 1.43 units on the 0–10 scale.
Robustness checks
We conducted a series of robustness checks to evaluate whether our findings varied across different types of survey respondents and parties and across different time periods. Specifically, we re-estimated our models on all women CSES respondents in our dataset and then on all men (columns 2–3 in Table A2 in the Appendix); on the CSES surveys from 1996 to 2007 and then on the surveys from 2008 to 2020 (columns 4–5 in Table A2); on supporters of left-wing parties and then on right-wing parties’ supporters (columns 2–3 in Table A3); and on respondents’ placements of left-wing parties and then on their placements of right-wing parties (columns 4–5 in Table A3). We estimated models excluding small parties (Table A8). We also estimated models with individual fixed effects (Table A4) and estimated our models separately on respondents segmented by political knowledge levels, as measured by their performance on the knowledge quizzes included in Waves 1–4 of the CSES (Table A5). In nearly all specifications, we find similar relationships between our gender-inclusivity measures and the respondents’ party placements. The one notable difference is that these relationships appear somewhat stronger in the more recent 2008–2020 period than in the earlier 1996–2007 period. This pattern suggests that the informational value of women supporters as an ideological cue may have increased over time.
Experimental analyses
Our observational analyses show that survey respondents tend to place gender-inclusive parties at more left-wing positions, even when controlling for the left–right tone of party manifestos. These analyses, however, cannot rule out unobserved party differences that could drive these relationships. For instance, if more inclusive parties communicate positions that are further to the left than their election manifestos suggest – via avenues such as party elites’ speeches and interviews, parliamentary debates, press releases, and online communications – the associations we observe may reflect citizens’ reactions to these other forms of party communication, rather than their application of gender-based heuristics.
To address concerns about omitted variable bias – and to more reliably estimate the causal effect of each component of the gender-based heuristic – we conducted online survey experiments in which respondents were shown descriptions of parties with randomized characteristics, including information related to gender inclusivity. We then asked respondents to place each party on a left–right scale. Respondents were recruited from Qualtrics LLC’s online panel, matching population demographics on age and gender in Canada, Denmark, Germany, and the UK in 2019, with around 1,000 respondents per country (see Appendix B for more information).
These four cases offer a useful combination of comparability and heterogeneity for evaluating our argument. All are established Western democracies in which left–right competition structures party politics, making citizens’ ideological placements a substantively significant outcome. At the same time, they differ in the pervasiveness of left–right language in political discourse, in features of party competition such as the prominence of coalition politics (Lee, Santoso and Stevenson Reference Lee, Santoso and Stevenson2026), and, relatedly, in the extent to which their political institutions promote power-sharing between parties and offer extensive minority protections (Lijphart Reference Lijphart2010). They also differ in politically relevant aspects of women’s inclusion, including the prevalence of voluntary gender quotas, the extent to which women’s representation is concentrated among left parties, the size of the gender gap in voting, and whether major parties on the left and right have recently been led by women. Taken together, this variation creates a demanding test of whether citizens use gender-inclusivity cues to infer party ideology across distinct political environments. If they do, the relationship is less likely to be an artifact of any single national context.
Experimental design
In the experiment, respondents were shown a series of hypothetical new parties and asked to place each party on a 0–10 left–right scale. In each trial, there were ‘slots’ for six discrete pieces of information: the party’s name and symbol (Slot 1); the party leader (picture with name, Slot 2); the party’s pattern of cooperation with existing parties (Slot 3); the party’s position on a specific policy or value (Slot 4); the gender composition of the party’s candidates, its gender quota policy, the party’s expected size, or the geographical scope of its electoral support (Slot 5); and the party’s support among different social groups (Slot 6). We tested our gender-based heuristic using the proportion of women party candidates (Slot 5), the party leader’s gender (Slot 2), the party’s gender quota policy (Slot 4), and the usual levels of party support from men or women (Slot 6).
Slot 4 provides information about specific policies or values that map onto the broader left–right dimension (these positions are listed in Figure 3). This gives respondents explicit ideological information they can use when placing parties. The other cues we include, such as a party’s pattern of cooperation with existing parties and its support among different social groups, also make the task more realistic, as prior research shows that citizens rely on this kind of information when estimating party positions (Adams, Weschle and Wlezien Reference Adams, Weschle and Wlezien2021; Fortunato and Stevenson Reference Fortunato and Stevenson2013).
Annotated example of a party profile shown to respondents.
Notes: This is an example of a party profile displayed to British respondents in the survey experiment. Appendix B provides additional information about these experiments, which were administered in Britain, Canada, Denmark, and Germany in 2019.

Figure 3 summarizes the design and provides an annotated example of a party profile seen by British respondents. Appendix B provides relevant information for the other three countries. On each trial, one of the listed attribute statements was randomly selected from each of the six information ‘slots’, and the order of the four slots with statements was randomized but consistent for each respondent. Most respondents saw 20 trials.Footnote 5
Our design differs from the typical conjoint/factorial designs used in political science, which usually vary a small number of attributes with several levels for each attribute. In contrast, we vary many attributes with most having only two levels. For example, in the UK we included 14 policy/value statements (Slot 4) each of which comes in two versions (levels): ‘support’ or ‘oppose’ the policy/value. This design creates no logical or estimation problems and allows us to explore the impact of many more different attributes than in the typical design.Footnote 6 Importantly, since our design distributes its many attributes to only six ‘slots,’ each respondent only sees six discrete pieces of information, well below the number shown in most other conjoint studies as well as the limits recommended in Bansak, Hainmueller, Hopkins et al. (Reference Bansak, Hainmueller, Hopkins and Yamamoto2018).
The design incorporates additional features that enhance its effectiveness. First, it groups policy and values statements into the same slot so that on each trial respondents see either a policy or value statement, eliminating any possibility of conflicting statements. Second, many attributes included in our design are not directly relevant to testing gender-based heuristics. This approach aims to simulate a ‘real-world’ setting where citizens have access to a wealth of information about a party. It arguably presents a more challenging test of the role played by party inclusivity as compared to other experimental designs, which provide a more limited set of heuristics for voters to consider.
Estimation method and diagnostics
We test for a gender-based heuristic by estimating average marginal component effects (AMCEs) for the relevant party attributes. Our estimates for a given attribute are marginal effects that average over the values of the other attributes included in a party profile. Our analyses of these profile distributions demonstrate that in our application, the use of uniform marginal distributions for most of our attribute categories is both justified theoretically and makes little difference empirically, compared to plausible alternatives.Footnote 7
The use of factorial/conjoint survey experiments in political science has grown rapidly, with a corresponding increase in attention to the method by political methodologists who have provided a set of best practices to follow (de la Cuesta, Brandon and Imai Reference De la Cuesta, Egami and Imai2020; Egami and Imai Reference Egami and Imai2018; Hainmueller, Hopkins and Yamamoto Reference Hainmueller, Hopkins and Yamamoto2014). Appendix C reviews this advice and applies it to our project, including discussions on the five design assumptions that Hainmueller, Hopkins and Yamamoto (Reference Hainmueller, Hopkins and Yamamoto2014) emphasize, as well as a discussion of the appropriateness and robustness of our design’s ‘profile distribution’.
Results
Figure 4 displays point estimates of the AMCEs for the relevant gender-based heuristics, along with 95% confidence intervals, for each country included in our experimental study.Footnote 8 These results are consistent with our observational analyses. Citizens, for example, ascribe more leftist positions to parties that feature more women parliamentary candidates. For Canada, citizens who were informed that a new party featured 50% women candidates were predicted to place the party 0.53 units farther left on the 0–10 scale compared to citizens who were informed the party featured only 10% women candidates (p < 0.01), all else equal; respondents who were informed the party featured 30% women candidates placed the party 0.25 units farther to the left compared to the 10% women candidates condition (p < 0.01). For Germany, Denmark, and the UK the predicted effects are also in the hypothesized direction and are mostly significant, although their magnitudes are smaller (on the order of 0.2-unit to 0.3-unit left-shifts).
Experimental effects of gender inclusivity on perceived party positions.
Notes: The figure displays point estimates and 95% confidence intervals of the effects of parties’ gender-related attributes on subjects’ left-right party placements along a 0–10 scale (the horizontal axis). Positive numbers denote more right-wing placements, and negative numbers denote more left-wing placements. The AMCEs of all the various attributes are presented in Appendix F, and the text describes the conjoint experiments.

Figure 4. Long description
Panel A: Canada. A scatter plot shows the effects of various factors on perceived party positions in Canada. The x-axis represents different factors such as female party leader, percentage of female candidates, quotas, support among men and women, and beliefs in gender equality. The y-axis represents the effect size ranging from -1 to 1. Notable points include strong support among men at 0.46, beliefs in gender equality at 0.76, and 70 percent female candidates at 0.61. Panel B: Germany. A scatter plot shows the effects of various factors on perceived party positions in Germany. The x-axis represents different factors such as female party leader, percentage of female candidates, quotas, support among men and women, and beliefs in gender equality. The y-axis represents the effect size ranging from -1 to 1. Notable points include strong support among men at 0.29, beliefs in gender equality at -0.99, and 70 percent female candidates at -0.22. Panel C: Denmark. A scatter plot shows the effects of various factors on perceived party positions in Denmark. The x-axis represents different factors such as female party leader, percentage of female candidates, quotas, support among men and women, and beliefs in gender equality. The y-axis represents the effect size ranging from -1 to 1. Notable points include strong support among men at 0.28, beliefs in gender equality at 0.71, and 70 percent female candidates at -0.27. Panel D: UK. A scatter plot shows the effects of various factors on perceived party positions in the UK. The x-axis represents different factors such as female party leader, percentage of female candidates, quotas, support among men and women, and beliefs in gender equality. The y-axis represents the effect size ranging from -1 to 1. Notable points include strong support among men at 0.22, beliefs in gender equality at 0.69, and 70 percent female candidates at -0.25.
Citizens also ascribed more leftist positions to parties that were described as using quotas: the predicted effect of a party having 50% women candidates selected via a candidate quota compared to a party with 10% women candidates and no gender quota is a 0.48-unit left-shift in Canada (p < 0.01), a 0.41-unit left-shift in Denmark (p < 0.01), 0.27 units in Germany (p < 0.01), and 0.16 units in the UK (p < 0.05). Meanwhile, a more modest 30% women candidate quota exerts smaller (though mostly statistically significant) predicted left-shift effects on citizens’ party placements.
The estimated effects of a woman-led party are also statistically significant and in the expected direction across all four countries. Our point estimates on the woman party leader variable range from −0.09 to −0.17, denoting predicted left-shifts of about 0.1–0.2 units on the 0–10 scale when parties are described as having a woman leader, versus those described as being led by a man.
Respondents also place parties that were described as having strong support among women to the left of parties described as having weak support among women (all else equal). The estimated left-shift effect sizes are 0.58 units on the 0–10 scale in Canada (p < 0.01), 0.44 units in Germany (p < 0.01), 0.17 units in Denmark, and 0.12 units in the UK. Conversely, respondents tended to place parties described as having strong support among men farther to the right of parties described as having weak support among men, with estimated effects of 0.46 units in Canada (p < 0.01), 0.29 units in Germany (p < 0.01), 0.28 units in Denmark (p < 0.05), and 0.22 units in the UK (p < 0.05).
Considering our gender-based heuristics together, we estimate that citizens perceive more inclusive parties as significantly more left-wing. For example, we predict the average perceived position of a Canadian party that has a 50% candidate gender quota, 50% women candidates, a woman leader, and that receives strong support from women to be 1.68 units more leftist on the 0–10 scale than a party without a gender quota that features only 10% women candidates, receives weak support from women, and is led by a man. This same party comparison generates predicted left-shifts of 0.86 units in Germany, 0.99 units in Denmark, and 0.54 units in the UK.
Our design also allowed us to gauge the impact of a party’s general values concerning gender inclusivity on respondents’ left–right party placement. Specifically, we attributed one of two different value statements to some parties: the party ‘Believes that men and women should be treated equally in economic and public life’ or ‘Believes that there are legitimate reasons to treat men and women differently in economic and public life.’Footnote 9 We estimate that a direct statement of the party’s support for gender inclusivity shifted respondents’ party placements leftward, compared to the value statement that legitimized differential gender treatment, with effect sizes ranging from 0.7 to 1.0 units across all four countries (p < 0.01 in all cases). Remarkably, the cumulative perceptual experimental effects of our gender-based heuristic (perceiving more gender-inclusive parties as more left-wing) are comparable to the effects of parties’ explicit commitments to gender inclusivity.
Though our observational and experimental analyses yield broadly consistent findings regarding the relationship between gender-inclusive parties and perceived left–right positions across Western publics, there are some differences between the two. For example, in the observational analysis of the leader’s gender, the estimates are in the expected direction – and are of similar magnitudes to the experimental estimates – but are not significant when controlling for the other components of the gender inclusivity heuristic. This could reflect either the small number of women leaders in the observational dataset or the relatively high levels of collinearity between the components of our gender heuristic, both of which hamper our ability to precisely estimate this relationship.
Conversely, the estimated association between candidate gender quotas and perceived party ideology is larger in the observational analyses than in the experiment. Several factors may contribute to this difference. The adoption of voluntary gender quotas often involves extensive intra-party debates, policy changes, media coverage, and public discourse (Clayton, O’Brien, and Piscopo Reference Clayton, O’Brien and Piscopo2026), which may shape parties’ reputations beyond what can be conveyed in an experimental treatment. In addition, the ideological meaning of candidate quotas may vary across political contexts. Lower-threshold quotas may no longer constitute a particularly distinctive left-wing signal in some contemporary settings. Consistent with this possibility, respondents in our experiment generally perceive parties with a 30% gender quota as significantly more left-leaning than parties with 10% women candidates and no gender quota. Germany is the lone exception: the estimated effect is smaller and not statistically significant in Germany – a context in which the center-right CDU has long maintained a one-third women’s quota for internal party offices.Footnote 10
Finally, our estimated experimental effects are generally similar across the four publics we analyze, suggesting that the use of gender-based heuristics is a common feature of political reasoning in Western democracies. At the same time, we do estimate somewhat stronger effects in the Canadian public than in the other three publics (for which our key estimates are mostly indistinguishable from each other). This pattern is consistent with the logic of our case selection: because left–right language is comparatively less pervasive in Canadian political discourse (Carty and Cross Reference Carty, Cross, Courtney and Smith2010; Cochrane Reference Cochrane2010) than in the European cases, Canadian respondents may rely more heavily on visible heuristics – including gender-inclusivity cues – when placing parties ideologically. It may also reflect the fact that, in Canada, parties on the left include more women in both the legislature and the cabinet than does the Conservative Party. Of course, we cannot adjudicate among competing explanations for this cross-national difference, and other factors, including features of the Canadian party and media systems, may also contribute. For our purposes, however, the central result is the same across all four cases: citizens rely on gender-based heuristics when estimating parties’ ideologies.
Discussion and conclusions
Citizens use shortcuts to make sense of the political world. In this article, we argue that citizens in Western democracies draw on a gender-based heuristic when placing parties on the left–right spectrum, such that more gender-inclusive parties are seen as more leftist. Our observational analyses of election survey data from 21 Western publics between 1996 and 2020 support this claim. Even when controlling for the left–right tones of parties’ election manifestos, citizens perceive parties as more left-wing when they elect higher proportions of women MPs, implement candidate gender quotas, and enjoy greater support from women in the electorate. These relationships persist across a range of subgroup analyses: among women and men respondents; among supporters of both right-wing and left-wing parties; in respondents’ placements of both left- and right-wing parties; and in separate analyses of the earlier and later years of the 1996–2020 period. Findings from survey experiments conducted in Canada, Denmark, Germany, and the UK lend further support to the argument that citizens rely on such gender-based heuristics.
Importantly, though the effect of any one dimension of gender inclusivity on left–right placement is modest, the cumulative effect is comparable to a standard deviation shift in the left–right tones of parties’ manifestos (for the observational results) or explicit commitment to gender egalitarian policy (for the experimental results). Given that measures of gender inclusivity are correlated with one another, this suggests that the effects are substantively meaningful. Of course, including women in a center-right party will not lead the organization to be perceived as leftist. Rather, the gender-based heuristic likely affects whether a party looks more centrist or extreme within the left–right divide.
While these results may seem intuitive given recent political trends in Western democracies, no prior work has so clearly established the existence of gender-based heuristics in citizens’ evaluations of parties’ ideological positions. This kind of relationship, moreover, has not always been self-evident. For instance, the leftward gender gap in voting has only emerged in recent decades. Until the 1980s and 1990s, men were generally more supportive of the left than women (Di Landro Reference Di Landro2025; Shorrocks Reference Shorrocks2018). We have not only witnessed a reversal in women’s partisan support – from right to left – but now respondents systematically use gender-based cues to position inclusive parties on the left, suggesting that gender has become an axis of ideological differentiation in contemporary party politics.
Looking ahead, it will be important to observe whether political parties strategically include women. While traditionally male-dominated, for example, radical right parties, at least in some countries, now actively involve women and engage in some representation of women’s concerns (Erzeel and Rashkova Reference Erzeel and Rashkova2017). Weeks, Meguid, Kittilson et al. (Reference Weeks, Meguid, Kittilson and Coffé2023) argue that electorally struggling radical right parties in Europe strategically increase women’s descriptive representation in an effort to mitigate their extremist images and expand their support. Given previous research indicating that voters tend to penalize parties that explicitly alter their stated policy principles (Tavits Reference Tavits2007), mainstream center-right parties may attempt to follow suit and enhance gender diversity within their ranks. This behavior would be consistent with existing studies that argue that women’s representation is no longer solely the purview of the left. Work by Campbell and Erzeel (Reference Campbell and Erzeel2018), Celis and Childs (Reference Celis and Childs2012), O’Brien (Reference O’Brien2018), Wiliarty (Reference Wiliarty2010) Xydias (Reference Xydias2013), and others documents right parties’ efforts with respect to women’s representation.
Identifying this gender-based heuristic also lays the groundwork for future research on which citizens use these cues to infer party ideologies. Subsequent studies should consider characteristics such as respondents’ age, race or ethnicity, and level of political engagement. In supplementary analyses using CHES data (see Table A6 in the Appendix), for example, we find that political experts also tend to place gender-inclusive parties further to the left, even when accounting for their stated policy positions. This suggests that even highly engaged observers – those most attentive to politics – may be responsive to gender-based signals.
We might also consider whether the application of gender-based heuristics affects the accuracy of citizens’ estimates of party ideologies. We find that parties with greater women’s descriptive representation across different levels – along with those that implement candidate gender quotas – tend to author more left-wing election manifestos. Thus, there is a factual basis for citizens to infer that more gender-inclusive parties are more left-leaning. While this pattern supports citizens’ use of gender-based heuristics, future studies can explore whether citizens rely too heavily (or not heavily enough) on gender cues relative to other information, such as the composition of governing coalitions (Fortunato and Stevenson Reference Fortunato and Stevenson2013).
A key conceptual distinction in our framework is between party gender inclusivity and substantive commitments to gender equality. Although descriptive inclusion and gender-equality policies often coincide, parties may visibly incorporate women without substantively prioritizing gender equality, and vice versa. Future research could examine how citizens evaluate parties when visible signals of women’s inclusion diverge from their substantive commitments to gender equality. Finally, while our analyses demonstrate that party gender inclusivity shapes overall left–right ideological perceptions, future research could investigate which dimensions of ideology citizens infer from these cues – for example, whether they primarily signal socio-cultural progressivism, economic positions, or some combination of the two. Although much remains to be learned about the relationship between gender and party ideology, our findings demonstrate that visible signals of women’s inclusion do more than communicate who stands for a party – they also shape how citizens understand where that party stands.
Supplementary material
The supplementary material for this article can be found at https://doi.org/10.1017/S1475676526101923
Data availability statement
The replication data and codes are available at the Harvard Dataverse repository: https://doi.org/10.7910/DVN/ZBN3L1.
Funding statement
None.
Competing interests
None.
Ethical standards
The experimental research in this article was reviewed and approved by the University of Essex ethics committee (ETH1920-0164).
Use of AI
None.


 Open access

