





Introduction
How does school education affect how citizens evaluate democracy later in life? Are autocracies successful in undermining support for democracy in the long run? These are critical questions, given the importance of citizen support for democratic consolidation and stability (Norris Reference Norris1999; Dalton Reference Dalton2004; Claassen Reference Claassen2020). One might expect that people who lived through a dictatorship would value democracy most, given their direct comparison with a non-democratic regime. However, research shows that autocracies leave a long-lasting legacy that can hinder democratic support in transitioning countries (Neundorf Reference Neundorf2010; Fuchs-Schündeln and Schündeln Reference Fuchs-Schündeln and Schündeln2015; Pop-Eleches and Tucker Reference Pop-Eleches and Tucker2017).
One important mechanism is generational socialization: cohorts who grew up under an autocracy tend to express lower democratic support than those socialized in democracies. Figure 1 does not directly identify these cohorts but instead depicts an aggregate pattern – average democratic support is lowest in the early years after a democratic transition and tends to rise as democracy endures. In young democracies, the population average is likely influenced by a large share of citizens socialized under the prior autocratic regime, whereas in more established democracies, successive generations have experienced only democratic rule. The difference in average support between the newest and most established democracies in our sample is around 20 percentage points, consistent with the idea that regime socialization shapes attitudes over time. Existing literature on this phenomenon, however, does not explain the mechanism behind this gap.
Support for democracy by the age of the country’s democratic system.
Note: Support for democracy is measured as average agreement (per country-year) to the survey question ‘Democracy may have problems, but it is better than any other form of government’, measured on a 0–100 scale. The age of democracy is measured using the V-Dem regime classification (Coppedge et al. Reference Coppedge, Gerring, Knutsen, Lindberg, Teorell, Alizada, Altman, Bernhard, Cornell, Fish, Gastaldi, Gjerløw, Glynn, Hicken, Hindle, Ilchenko, Krusell, Lührmann, Maerz, Marquardt, McMann, Miri, Paxton, Pemstein, Seim, Sigman, Skaaning, Staton, Sundström, Tzelgov, Wang, Wig, Wilson and Ziblatt2021) and counting all years a country was classified as an (electoral or liberal) democracy between 1900 and 2020. The figure only includes countries that are classified as democracies at the time of the survey. More details are below.

We argue that education is key to understanding this puzzle. Citizens in new democracies attended school under dictatorships and did not learn democratic citizenship roles, while those in established democracies spent their formative years learning democratic values and duties. It remains unclear whether the gap in democratic support stems from the strong negative influence of autocratic education or the positive impact of democratic education. Hence, this paper examines the long-term impact of autocratic and democratic socialization, focusing on how schooling influences the development of pro-democratic attitudes.
Early modernization literature identifies education as a main driver of democratization (Lerner Reference Lerner1958; Inkeles Reference Inkeles1983), developing attitudes aligned with democratic governance (Inglehart Reference Inglehart1997; Inglehart and Welzel Reference Inglehart and Welzel2005) and increasing demand for democratic rule (Claassen Reference Claassen2020). Conversely, recent case-based and context-specific studies find that authoritarian education negatively impacts the development of pro-democratic values (Eibl-Eibesfeldt and Salter Reference Eibl-Eibesfeldt and Salter1998; Voigtländer and Voth Reference Voigtländer and Voth2015; Cantoni, Chen, Yang et al. Reference Cantoni, Chen, Yang, Yuchtman and Jane Zhang2017), with education used to perpetuate authoritarian rule (Paglayan Reference Paglayan2022). Cross-national research also shows a negative relationship between education in authoritarian regimes and democratic attitudes (Lott Reference Lott1999; Diwan and Vartanova Reference Diwan and Vartanova2020). However, these studies are limited by their reliance on aggregate regime measures, inability to identify specific causal mechanisms, and coarse-grained treatment of educational content.
Our paper offers theoretical and empirical innovations that contribute to the literature on democratization, political attitudes, and autocratic legacies. We present a unified theoretical framework of autocratic and democratic imprinting, proposing that authoritarian education suppresses long-term democratic support, while democratic education fosters positive democratic values. We theorize the mechanisms through which this imprinting occurs, focusing on the content and efforts of educational practices in autocracies and democracies. More specifically, the curricula content captures the teaching of democratic (participatory and pluralist values, critical thinking) or authoritarian values (loyalty, obedience, single-view/ideological perspectives, and uncritical thinking). In contrast, the regime’s efforts capture the institutional and curricular commitment to explicitly teach political values – whether authoritarian or democratic. This approach allows us to unpack the impact of schooling on long-term beliefs, whether clashing with or reinforcing democratic values.
Empirically, we isolate the causal effect of authoritarian versus democratic education on political attitudes, leveraging the fall of the Berlin Wall and a strict birth date cut-off in the German Democratic Republic. Our analysis shows that an extra year of schooling during the socialist period reduces long-term democratic support among East Germans by about 0.5 standard deviation. We also conduct a large-N analysis of attitudes from over 750,000 respondents in 106 countries, representing 89% of the world population, using novel cross-national data on democratic and autocratic educational policies from Varieties of Indoctrination (Neundorf, Nazrullaeva, Ksenia Northmore-Ball et al. Reference Neundorf, Nazrullaeva, Northmore-Ball, Tertytchnaya, Kim, Benavot, Bromley, Knutsen, Lutscher, Marquardt, Paglayan, Pemstein, Seim and Rydén2023).
By combining a rigorously identified case study of the GDR with a large-N cross-national analysis, we show both how authoritarian education depresses support for democracy and how democratic education fosters it. Taken together, these analyses reveal the two sides of political imprinting through education. Our evidence suggests that the primary driver of long-term pro-democratic attitudes is the effort of democracies to implement a curriculum that strongly promotes democracy. There is weaker evidence that the absence of a pro-democratic curriculum in autocracies leads to lower long-term support for democracy. Democracies are better positioned to transmit democratic values and model citizenship during their citizens’ crucial impressionable years when they are in the education system, a key policy area shaped by the state. These findings have important implications for developing a democratic political culture in transitioning societies and understanding democratic consolidation and stability more broadly.
Democratic and autocratic imprinting and its long-term effects
We assume that all political regimes attempt to influence citizens’ thinking to maintain political order (Easton Reference Easton1965; Paglayan Reference Paglayan2022). We propose that education is a crucial channel of imprinting, as it is an important policy area controlled by the state, through setting national curricula and regulating teacher recruitment. Teaching pro-regime ideas and prescribing supportive curricula in schools and universities are common features of both autocracies and democracies (Lott Reference Lott1990, Reference Lott1999; Eibl-Eibesfeldt and Salter Reference Eibl-Eibesfeldt and Salter1998).Footnote 1
It is almost impossible for ordinary citizens to escape exposure to education while growing up. Most states have compulsory education, meaning all students are exposed to state-controlled socialization efforts, unlike other forms of socialization via the media or the arts, which can be circumvented. Schools shape citizens’ beliefs from an early age. Social psychology indicates that the most intense imprinting occurs when individuals are young (Alwin and Krosnick Reference Alwin and Krosnick1991; Bartels and Jackman Reference Bartels and Jackman2014). During early childhood and adolescence, citizens are easily influenced by these regimes’ imprinting attempts, which have significant consequences for the crystallization of political values and attitudes in later life. Both democratic and autocratic imprinting are particularly strong when people live in a democracy or an autocracy during their impressionable years, which coincide with their school years.
Imprinting through education can hence be perceived as an instrument ‘to promote long-term social order by indoctrinating young children to accept the status quo, behave as “good citizens,” and respect the state and its laws’ (Paglayan Reference Paglayan2022: 11). However, democracies and autocracies define ‘good citizens’ differently, impacting school curricula and instructional methods. Democracies emphasize civic competence and internalization of democratic norms like tolerance and pluralism (Finkel and Smith Reference Finkel and Smith2011). The ‘good citizen’ in democracies learns the importance of political participation, such as viewing voting as a civic duty (Westheimer and Kahne Reference Westheimer and Kahne2004). In contrast, authoritarian education promotes obedience, loyalty to the regime, and uncritical thinking (Mirshak Reference Mirshak2020), often using rote memorization (Kipnis Reference Kipnis2011).
Given the goal of building citizen support and obedience, it is unsurprising that education is a key policy area for many autocracies. Paglayan (Reference Paglayan2021) documents that non-democracies invest in mass schooling to increase human capital and indoctrinate citizens. Autocracies validate their rule through political ideologies, nationalistic slogans, ethnic exclusions, or religious ideas (Eibl-Eibesfeldt and Salter Reference Eibl-Eibesfeldt and Salter1998; Paglayan Reference Paglayan2022; Neundorf, Nazrullaeva, Ksenia Northmore-Ball et al. Reference Neundorf, Nazrullaeva, Northmore-Ball, Tertytchnaya and Kim2024). These regimes provide a narrative to legitimize the incumbent (Gerschewski Reference Gerschewski2018, Reference Gerschewski2013) and portray them as competent (Guriev and Treisman Reference Guriev and Treisman2020).
We argue that these indoctrination efforts by autocracies result in a persistent mental imprint, even after the regime collapses. The norms and values formed during authoritarian rule become reference points for political attitudes and behavior in later life. Diwan and Vartanova (Reference Diwan and Vartanova2020) show that education in an autocracy negatively affects democratic behavior (e.g., voting and civic engagement), but their aggregate data do not identify the mechanisms driving this relationship, especially as they rely on coarse educational categories.
Research on the impact of education content is limited. Cantoni, Chen, Yang et al. (Reference Cantoni, Chen, Yang, Yuchtman and Jane Zhang2017) demonstrate that new pro-regime content in China’s school curriculum led to skepticism about free markets, increased trust in government officials, and alignment with the regime’s views on political participation and democracy. However, Kao (Reference Kao2021) finds that this effect is significant only among students whose parents worked for the government, raising doubts about the overall effectiveness of authoritarian education.
Regarding democratic education, evidence shows that civic education in schools can instil support for democracy and promote democratic knowledge in both new (Finkel and Ernst Reference Finkel and Ernst2005; Tobin Reference Tobin2010; Fesnic Reference Fesnic2016) and established democracies (Evans and Rose Reference Evans and Rose2012; Campbell and Niemi Reference Campbell and Niemi2016). Different approaches to civics instruction mediate the effect (Galston Reference Galston2004; Finkel and Ernst Reference Finkel and Ernst2005). Democratic education is most effective among disadvantaged children lacking parental socialization, with a ceiling effect among children from more educated and higher socio-economic status families, suggesting alternative channels of political socialization (Campbell and Niemi Reference Campbell and Niemi2016; Neundorf, Niemi, and Smets Reference Neundorf, Niemi and Smets2016).
Existing research highlights two gaps: the long-term effects of democratic versus autocratic education have not been directly compared, and the impact of authoritarian education on political attitudes and behavior remains understudied and contradictory. This paper addresses these gaps, aiming to uncover the mechanism between education (democratic and autocratic) and its long-term effects. We focus on two dimensions: education content and regime efforts to promote specific political education content. We will introduce the concept and measures of these dimensions below.
We formulate three theoretical expectations and raise one open question. First, we expect a long-term effect of authoritarian education on support for democracy, with more authoritarian education during impressionable years resulting in lower pro-democratic values later in life. Second, we expect democratic education to leave a lasting pro-democratic mark on citizens. Third, we anticipate that the impact of autocratic and democratic education depends on the curriculum content and the regime’s efforts to promote these values. The open question concerns the relationship between these effects: to what extent can the observable gap in democratic support between those who experienced authoritarian versus democratic education be attributed to the dampening effect of autocratic education or the boosting effect of democratic education?
We begin by establishing that the documented gap in support for democracy between those socialized in autocracies and democracies (e.g., Neundorf Reference Neundorf2010; Pop-Eleches and Tucker Reference Pop-Eleches and Tucker2017) is causally linked to education. Using the German Democratic Republic (GDR) as a case study, we test our first two theoretical expectations. We then broaden our perspective with a global analysis of democratic and autocratic education and its long-term effects, aiming to generalize our findings beyond the GDR case and address the open question.
The legacy of socialist education in East and West Germany
Focusing on the case of the German Democratic Republic (1949–1990), we first establish the causal impact of authoritarian versus democratic schooling on support for democracy. To estimate this effect, we leverage the fall of the Berlin Wall as an external shock and the birth-month cut-off rule for the school start year, examining how an extra year of exposure to socialist (rather than democratic) education impacts individuals’ support for democracy today. This empirical setup has been previously employed to study the effect of socialist education on labor market outcomes (Fuchs-Schündeln and Masella Reference Fuchs-Schündeln and Masella2016) and trust in the constitutional court (Cheruvu Reference Cheruvu2023).
The East German education system was designed to indoctrinate pupils with socialist ideology, encouraging activities aligned with the regime’s beliefs (Westheimer and Kahne Reference Westheimer and Kahne2004; Fulbrook Reference Fulbrook2014). The stated goals of civics education in the GDR were to convey knowledge about the ‘theoretical foundation of the Party of the working class, the positioning of dialectic and historical materialism in Marxism-Leninism, the program of the Socialist Unity Party of Germany (SED) as the major document that provides information about the ways and the goals of further societal development in the German Democratic Republic’ (Ministerium für Volksbildung 1980: 5; own translation). As such, it is fair to conclude that the aim of civics education in the GDR was ‘an indoctrination of Communist values, masqueraded as “state citizens education” and with an overall objective that can only be described as the very opposite of the independent and critical citizen’ (Buck and Geissel Reference Buck and Geissel2009: 233).
Until its abrupt ending in 1989/1990, the education system remained remarkably constant and was under tight control by the Ministry of People’s Education.Footnote 2 Grammes, Henning, and Hans-Joachim (Reference Grammes, Schluss and Vogler2006) describe, for example, the various control mechanisms by the state that encompassed classroom visits, inspections, surveys, and interrogations of school principals, teachers, and pupils, as well as performance tests. These measures were implemented in so-called ‘operative Einsätze’ (operative missions) for which both the Central Committee of the SED and the Ministry of People’s Education were responsible.
Until 1989, the profession of schoolteachers was heavily regulated by the state. Being overly critical of the GDR or applying for permission to leave the country (‘Ausreiseantrag’) led to severe sanctions, including occupational bans, making teachers a particularly vulnerable group. Moreover, ‘being a teacher in the GDR meant not just having a function at school, it also meant compulsory visits to parents and drawing up reports on these visits’ (Den Hertog and De Jong Reference Den Hertog, De Jong, De Jong, Lalenis and Mamadouh2000: 125). Teachers were obliged to enforce participation in state-led youth organizations (Free German Youth, FDJ). For higher positions, active membership in the regime party SED ‘was as good as indispensable’ (ibid.).
There is anecdotal evidence that, particularly at the end of the GDR, some teachers and pupils became more critical against the official doctrine and looked for ways to circumvent the official education policies (Bathke et al. Reference Bathke, Chalupsky and Hoffmann1995). Yet, this effect should be taken with a grain of salt and should not be overestimated. In qualitative interviews, even critical teachers put forward that they did not dare to openly criticize the GDR and promote democratic values, but rather that they tried to avoid glorifications of past GDR achievements (Farouk and Camia Reference Farouk and Camia2022: 52–59).Footnote 3
While education systems are usually policy areas that are very hard and slow to reform (Ansell and Lindval Reference Ansell and Lindvall2013), the transformation of the GDR education system is described in the relevant literature as ‘sweeping’ with political education as being the ‘most radical’ area (Bruen Reference Bruen2014: 317). It soon became clear that a fundamental and rapid transformation of the education sector was of critical importance for the German unification process. As such, changes were of high political priority and were funded with large sums (Pritchard Reference Pritchard1998).
If we have a closer look at the timeline of events after the fall of the Berlin Wall, this becomes evident. Already in October 1989, Margot Honecker stepped down as Minister for People’s Education. At the end of October 1989, school curricula for civics education (‘Staatsbürgerkunde’) were declared no longer binding for teachers. From November 1989 onwards, teachers were themselves responsible for the content of their teaching. During the first half of 1990, East Germany saw a massive introduction of new textbooks and school materials. In 1990, 26.5 million new textbooks were printed by the Volk und Wissen publishing house, while a further 2.46 million textbooks were supplied from West Germany (Fuchs Reference Fuchs1997: 95–96). In March 1990, a new binding framework plan for civics education was introduced (Fuchs Reference Fuchs1997: 95–99). The reformed curriculum aimed at fostering democratic competences and values in line with the free democratic basic order (‘freiheitliche-demokratische Grundordnung’, fdGO), students’ ability for critical reflection and engagement with societal topics, as well as coming to terms with the GDR past, including its socialist ideology (Ministerium für Bildung und Wissenschaft 1990).
Given these sharp qualitative differences in educational experiences, which dramatically changed within a short time, and in line with our theory, we expect that respondents with a longer time spent under the socialist education system will have lower support for democracy compared to their peers. The sweeping changes in educational practice and policy, we described above, allow us to leverage the German reunification and the strict birthdate cut-off used for school start dates in the GDR to isolate the causal effect of socialist education on support for democracy.
We employ a difference-in-difference-in-difference (DiDiD) research design that leverages the school enrollment cut-off date to ensure causal identification.Footnote 4 In this DiDiD setup, we compare three groups: (1) respondents born before June 1st, (2) cohorts still in school during reunification (born between 1973 and 1982), and (3) East and West Germans.
Firstly, in the GDR, children born before June 1st started school the same year they turned six years old, while those born on or after June 1st started school the following year. We create a binary variable (born before June) with a value of 1 for individuals born between January and May and 0 for those born between June and December. Secondly, cohorts of students born between 1973 and 1982 potentially experienced between 1 and 12 years of socialist education, with the difference spent under democratic education. Within these cohorts (born between 1973 and 1982), each respondent potentially experienced one additional year of socialist schooling if they were born before June 1st (compared to their peers who were born after June 1st), as they were all still in school after reunification in 1990. Cohorts born before 1973 had completed their education by the time the Berlin Wall fell, and those born after 1982 only experienced the reformed education system (and are not included in the analysis).Footnote 5 We generate a binary variable (Cohort) that takes a value of 1 for individuals born between 1973 and 1982 and 0 otherwise. Finally, we use information on whether individuals spent most of their youth in East or West Germany to capture their exposure to socialist schooling, creating a dummy variable (East) with a value of 1 for those from East Germany and 0 for those from West Germany.Footnote 6
The identification of the causal effect of socialist schooling relies on two main assumptions. First, we assume that a child’s month of birth is random and thus determines the year they started school without parental manipulation. Given the rigorous implementation of GDR school enrollment policies, we find no evidence that parents could influence the year their children started school.Footnote 7 Second, we assume (based on the qualitative evidence provided above) that the transition of school systems and educational practices in East Germany was swift, beginning with the 1990/91 school year. As discussed above, schools quickly adopted West German textbooks and introduced new curricula. Even if some teachers did not implement these changes promptly, this should only make our estimates more conservative.
Our analysis uses data from the biannual German General Social Survey (ALLBUS), which includes measures of democratic support for surveys conducted in 2008 and 2018.Footnote 8 The ALLBUS began incorporating respondents from the former GDR in 1991, right after reunification, providing a comprehensive dataset of individuals who were born in Germany after 1943 – as this is the first cohort to have started school after the German division in 1949Footnote 9 – and completed Germany’s tripartite secondary school system. Our dependent variable comes from the ALLBUS survey data that measures respondents’ support for the idea of democracy, on a scale from 1 (very in favor) to 6 (very opposed). We invert this variable so that higher values mean more support for democracy and lower values weaker support. We estimate the following OLS model to analyze the data:
 $$\hskip-21pt{Y_{ics}} = {\it {\beta _0} + {\beta _1}Ag{e_i} + {\beta _2}Eas{t_i} + {\beta _3}Cohor{t_i} + {\beta _4}BeforeJun{e_i} + {\beta _5}Eas{t_i} \times Cohor{t_i} + {\beta _6}Eas{t_i}} \\ \hskip16pt\times \it{BeforeJun{e_i} + {\beta _7}Cohor{t_i} \times BeforeJun{e_i} + {\beta _8}Eas{t_i} \times Cohor{t_i} \times BeforeJun{e_i}{ + _l} + {\rm{ }}{\gamma _s}}$$
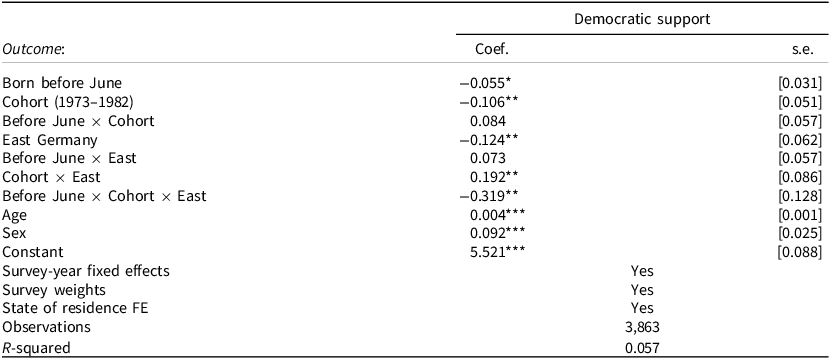
where Y is the predicted level of support for democracy reported by a respondent. The β 8 coefficient of the triple interaction between East, Cohort, and BeforeJune captures the effect of an extra year of exposure to socialist education on an individual’s support for democracy within their own birth-year cohort. More simply, this captures the within-treated cohort (born between 1973 and 1982) variation where those in the treatment condition (born before the 1st of June) have experienced one additional year of socialist schooling compared to those in the control condition (born on or after the 1st of June).Footnote 10 Our theoretical argument receives support if β 8 is negative and statistically significant. It would show that within each treated cohort, those born before June 1st (and who had spent one extra year in socialist education) have lower levels of democratic support compared to their birth-year peers born after June 1st. The γs are survey-year fixed effectsFootnote 11 , and θ l are federal state (Länder) fixed effects (to account for any unobserved regional effects), while the standard errors are clustered at the BirthYear-BeforeJune-East level. We also control for respondents’ ageFootnote 12 and gender to account for the potential life-cycle effects on the outcomes and any confounding effects within the cohort dummy.
Table 1 reports the results of the DiDiD estimation, highlighting the central coefficient β 8 of Equation 1. As expected, the coefficient of the triple interaction is negative and statistically significant. Substantively, this means that – compared to their contemporaries born in the same year – the extra year of socialist schooling in East Germany for those born before the 1st of June between 1973 and 1982 caused a decrease of 0.319 points on the original scale (at the 95% level) in democratic support. This captures the within treated cohort effect and is equivalent in size to about half of a standard deviation in democratic support for the entire sample. This result provides support for our first theoretical expectation that authoritarian indoctrination drives the negative impact of growing up in a non-democratic regime on later-life support for democracy.
DiDiD coefficients on democratic support and satisfaction (Model 1)

Table 1. Long description
A table with 12 rows and 4 columns. The columns are labeled ‘Outcome’, ‘Coef.’, ‘s.e.’, and ‘Democratic support’. The rows list various factors such as ‘Born before June’, ‘Cohort (1973-1982)’, ‘Before June x Cohort’, ‘East Germany’, ‘Before June x East’, ‘Cohort x East’, ‘Before June x Cohort x East’, ‘Age’, ‘Sex’, ‘Constant’, ‘Survey-year fixed effects’, and ‘Survey weights’. Each row provides the coefficient and standard error for the corresponding factor. Notable values include a coefficient of -0.055 for ‘Born before June’ with a standard error of 0.031, and a coefficient of -0.319 for ‘Before June x Cohort x East’ with a standard error of 0.128. The table also includes the number of observations (3,863) and the R-squared value (0.057).
Significance: ***p < 0.01, **p < 0.05, *p < 0.1.
Note: Included survey years for democratic support: 2008 and 2018. The dependent variable was inverted so that higher values represent more support for democracy. Data: ALLBUS.
Since we cannot test the parallel trends assumption given the lack of pre-treatment values for democratic support, we run several robustness tests for our analysis. First, we run models in which we remove the land fixed effects (Model A2.1) or remove university graduates (Model A2.2). The results remain substantively identical when land fixed effects are removed, while the effect is no longer statistically significant when removing university graduates from the sample. In the conclusion, we present potential reasons as to why our effect disappears when removing university graduates and provide avenues for future research. Second, we iteratively shift the treatment window in terms of months away from January to see how sensitive our treatment is to the inclusion or exclusion of treatment/control months (see Tables A4 and A5). We manage to capture the negative effect of socialist education with as little as two treatment months included in the treatment condition, and the effect similarly disappears once two control months (or more) are included in the treatment condition. Third, we run a placebo test (see Table A6) by using only months from the control condition such that each month – starting with June – is incrementally included in the treatment condition and compared with the remaining months (until December, while all the treatment months – January to May – are excluded from the analysis). These coefficients do not exert systematic or consistent effects on the outcome, do not reach standard levels of statistical significance, or, when they do, are opposite to our results, which is consistent with the expected effects of placebo tests.
Fourth, we change the treatment window of the treated cohorts to fully Soviet education years (born between 1952 and 1962) (pre-fall of the Berlin Wall) and to fully democratic education (born between 1988 and 1999) (post-fall of the Berlin Wall). These act as placebo cohorts, as the individuals within them would have been exposed to similar lengths of socialist or democratic education. There are no statistically significant effects for the DiDiD coefficient when estimating our main models with these two placebo cohorts (see Table A7). Fifth, we also combine the two approaches described above, but the DiDiD coefficient is mostly statistically insignificant when combining the placebo cohorts with the incremental placebo birth-month windows (see Tables A8 and A9). Finally, we re-estimate the main model and exclude each federal state iteratively from the estimation sample (Tables A10–12). Our results remain largely consistent under this robustness test.Footnote 13 Overall, these findings reinforce our confidence that our DiDiD setup appropriately captures the negative, long-term effect of authoritarian education on support for democracy.
Global analysis: research design
While the GDR case provides compelling causal evidence of the negative imprint of authoritarian schooling, it also raises the question of whether the effect we identify reflects primarily the presence of authoritarian content or the absence of democratic education for the treated cohorts (born January to May). To disentangle these effects and assess their broader relevance, we now turn to a cross-national analysis that explicitly measures the content and effort of political education across regimes.
Data and sample construction
In this section, we present a large-N test utilizing novel data on political education worldwide. More specifically, we conduct a comprehensive correlational analysis of 106 countries that experienced varying levels of school imprinting from the post-World War II period to today.Footnote 14 We include both democracies and autocracies, as our theory focuses on whether and how political education affects support for democracy, which varies between as well as within regimes. Here we leverage this variation. We use two types of data: individual survey data to capture democratic support, as well as novel macro data that measure characteristics of school education during respondents’ impressionable years.
Individual-level data
To test our proposition, we merged existing, publicly available survey data from numerous countries around the globe. We chose the datasets that have been designed to be fielded in several countries, which ensures that questions are less country-specific and travel across borders. We harmonized 604 country-year datasets of the following public opinion surveys (including the years that they were fielded for the outcomes studied here):Footnote 15
-
• World Values Survey (WVS), 1994–2020
-
• Latinobarometer (LB), 2002–2017
-
• Americas Barometer (AB), 2004–2019
-
• Asian Barometer (ABS), 2001–2019
-
• Afro Barometer (AFB), 1999–2001
-
• European Values Study (EVS), 1999–2009
-
• Comparative Study of Electoral Systems (CSES), 1999–2009
Pooling these datasets together gives us over 750,000 respondents for whom we have valid data on the dependent variables and all control variables.Footnote 16 The survey questions across the diverse datasets were harmonized to enable a joint analysis. Because the analysis combines data from seven cross-national survey projects, all models include study fixed effects (with the World Values Survey as the reference category) to account for systematic differences in survey design, implementation, and harmonized question wording across datasets. More details on the harmonization decisions can be found in Appendix 3.
Country-level data
We test the long-lasting imprint of authoritarian and democratic education on support for democracy, utilizing novel expert-coded data on nations’ political education. The Varieties of Indoctrination (V-Indoc) dataset (Neundorf, Nazrullaeva, Ksenia Northmore-Ball et al. Reference Neundorf, Nazrullaeva, Northmore-Ball, Tertytchnaya, Kim, Benavot, Bromley, Knutsen, Lutscher, Marquardt, Paglayan, Pemstein, Seim and Rydén2023) is based on the expertise of 760 country experts who provided their assessments in a survey fielded in collaboration with the Varieties of Democracy Institute (V-Dem). V-Indoc uses the same data collection protocol and Bayesian IRT measurement model used to create the V-Dem data, which generate country-year estimates and their confidence intervals, considering the uncertainties of experts when answering the survey (Pemstein, Marquardt, Tzelgov et al. Reference Pemstein, Marquardt, Tzelgov, Wang, Medzihorsky, Krusell, Miri and von Romer2020).Footnote 17 The data captures a variety of educational practices and policies, covering 160 countries annually from 1945 to 2021.
Measuring democratic and authoritarian school education
We distinguish between two dimensions of political education: its content and the effort devoted to political socialization. Content refers to the political values and norms conveyed through schooling, ranging from authoritarian messages that emphasize obedience and loyalty to authority to democratic messages that promote pluralism, political rights, democratic institutions, and critical thinking. Effort captures the extent to which regimes prioritize the transmission of political values through the education system, regardless of the ideological direction of those values.
To measure educational content, we construct a democratic content index based on four expert-coded indicators from the V-Indoc dataset:
-
1. Teaching democratic institutions and values: ‘How would you characterize the dominant societal model(s) or ideology(ies) promoted through the history curriculum?’Footnote 18 Selected options: Democratic norms, e.g., liberalism or pluralism, and democratic institutions, e.g., elections.
-
2. Teaching political rights: ‘To what extent does the curriculum of subjects that include the teaching of political values cover topics related to individuals’ political rights and duties?’
-
3. Teaching pluralism: ‘When historical events are taught, to what extent are students exposed to diverse views and/or interpretations of these events?’
-
4. Teaching critical thinking: ‘To what extent do students have opportunities to discuss what they are taught in history classes?’
Each indicator is also analyzed separately in the empirical section. Responses are measured on four-point ordinal scales and rescaled to range from 0 (most authoritarian) to 1 (most democratic). Higher values indicate a stronger emphasis on democratic norms and citizenship.
Political education effort is measured using an index capturing (1) whether primary school students are required to study a subject focused on political values,Footnote 19 (2) whether such instruction is required in secondary school, and (3) the extent to which the history curriculum promotes a specific societal model or ideology. Together, these indicators capture the degree to which political value transmission is institutionalized within the education system.
Following research on political socialization, we assume that educational imprinting is most likely to occur during respondents’ impressionable years. We therefore assign each respondent the average value of the educational measures observed in their country between ages 5 and 15, corresponding to the period of compulsory schooling for most cohorts. This procedure generates a unique measure of educational exposure for each country-cohort born from 1940 onwards.Footnote 20
For some respondents, these formative years overlap with a regime transition. Rather than assigning such cohorts to a single regime type, we average educational exposure across the full impressionable period. This approach reflects our interest in cumulative educational experiences and captures the mixed political messages that transitional cohorts may encounter before, during, and after regime change. Because regime transitions are relatively rare, most respondents were exposed exclusively to either democratic or authoritarian educational systems during their school years.
Exploring political education content and effort
Before turning to the main analyses, we briefly examine the relationship between the two educational dimensions introduced above. Figure 2 plots the democratic content and political education effort indices separately for democracies and autocracies. As expected, democracies and autocracies differ substantially in the content of political education. Democracies are considerably more likely to promote democratic values, institutions, rights, and pluralism through the curriculum. The average value of the democratic content index is 0.67 in democracies, compared to 0.33 in autocracies.
Relationship between education content and effort by regime type (1945–2020).
Note: Indicators range from low to high. Regime type is measured using the V-Dem regime classification (Coppedge et al. Reference Coppedge, Gerring, Knutsen, Lindberg, Teorell, Alizada, Altman, Bernhard, Cornell, Fish, Gastaldi, Gjerløw, Glynn, Hicken, Hindle, Ilchenko, Krusell, Lührmann, Maerz, Marquardt, McMann, Miri, Paxton, Pemstein, Seim, Sigman, Skaaning, Staton, Sundström, Tzelgov, Wang, Wig, Wilson and Ziblatt2021). The results are based on annual data of the 106 countries included in the analyses below. Pearson’s R correlation coefficients are reported between the two indicators by regime type. Data: V-Indoc (Neundorf et al. Reference Neundorf, Nazrullaeva, Northmore-Ball, Tertytchnaya, Kim, Benavot, Bromley, Knutsen, Lutscher, Marquardt, Paglayan, Pemstein, Seim and Rydén2023).

Differences between regime types are less pronounced when considering political education effort. Autocracies devote slightly more attention to political education overall, with an average effort score of 0.62 compared to 0.48 in democracies. At the same time, democracies exhibit considerably greater variation in effort, ranging from countries that place little emphasis on political education to those where civic education occupies a central place in the curriculum.
The relationship between content and effort also differs across regime types.Footnote 21 In democracies, the two dimensions are only weakly related, suggesting that the degree of emphasis placed on political education varies largely independently of its democratic content. In contrast, autocracies display a somewhat stronger positive association between content and effort, indicating that regimes that place greater emphasis on political education are also more likely to promote a coherent set of political values through the curriculum.
Dependent variables: support for democracy and strong leaders
Political support is one of the key factors in the development of a democratic political culture (Easton 1965; Norris Reference Norris1999; Claassen Reference Claassen2020). The aim is therefore to measure the extent to which citizens are committed to the democratic system and reject its alternatives. To measure this theoretical concept, we rely on two outcome variables. First, in the datasets that were harmonized for this study, respondents were asked uniformly how much they agreed with the statement that ‘democracy may have problems, but it is better than any other form of government’. Second, we also analyze a less abstract measure that asked people whether they support different forms of government, such as ‘having a strong leader who does not have to bother with parliament and elections’. This item represents support for personalist rule, which characterizes many contemporary autocracies and backsliding countries, such as Russia, Turkey, and Hungary. Original response scales vary across surveys (e.g., 4 or 5-point ordinal scales). All outcomes were harmonized and rescaled to a common 0–100 metric, where higher values mean more support for democracy or a strong leader. Footnote 22 This scale makes it easier to interpret effects in terms of percentage points.
Control variables
Individual-level control variables
To account for individual determinants of democratic support, we control for the age and gender of respondents, the education level (primary or less, secondary, or post-secondary),Footnote 23 and a dummy variable indicating whether a respondent is working as opposed to being unemployed, retired, or any other reason why people do not work. Unfortunately, it is not possible to control a person’s income or economic well-being beyond working, as the measures were too diverse to be harmonized.Footnote 24
Macro-level control variables
To account for alternative explanations linking educational experiences to democratic attitudes, we include a range of contextual controls measured during respondents’ impressionable years (cohort level) and at the time of the survey (period level).
At the cohort level, we control for the political and socioeconomic environment respondents experienced between ages 5 and 15. First, we include a dummy variable indicating whether respondents were socialized under an autocratic or democratic regime, based on V-Dem’s Regimes of the World classification (Coppedge et al. Reference Coppedge, Gerring, Knutsen, Lindberg, Teorell, Alizada, Altman, Bernhard, Cornell, Fish, Gastaldi, Gjerløw, Glynn, Hicken, Hindle, Ilchenko, Krusell, Lührmann, Maerz, Marquardt, McMann, Miri, Paxton, Pemstein, Seim, Sigman, Skaaning, Staton, Sundström, Tzelgov, Wang, Wig, Wilson and Ziblatt2021: 284).Footnote 25 This control is particularly important because educational content is strongly correlated with regime type. Second, we account for regime age, capturing the extent to which the political regime was institutionalized during respondents’ formative years.Footnote 26 Third, we include a modernization index following Neundorf and Shorrocks (Reference Neundorf and Shorrocks2022), as well as logged GDP per capita, to capture broader socioeconomic development. Fourth, we control for political corruption using V-Dem’s corruption index and for the provision of public goods using V-Dem’s public goods measure. These variables account for the possibility that citizens develop regime support in response to state performance rather than educational experiences alone.
To distinguish the effects of formative experiences from evaluations of current conditions, we additionally include three period-level controls measured in the survey year: logged GDP per capita and V-Dem’s electoral democracy index, as well as the political corruption index. These variables capture the contemporary economic and political environment in which respondents evaluate democratic institutions. Individual-level controls include gender, educational attainment, and employment status. Descriptive statistics for all variables are reported in Appendix 5.
The model
We test our theoretical proposition on the effect of education on support for democracy using the methodological approach of cohort analysis (Neundorf Reference Neundorf2010; Neundorf and Niemi Reference Neundorf and Niemi2014). This approach allows the identification of distinct characteristics of those generations that were socialized under different political and educational contexts. We expect to find clear generational differences in terms of democratic attitudes of people who experienced different educational contexts within the same country and between countries. This aggregate pattern of varying socialization experiences across countries and within the same country over time allows us to study the lasting imprint of political education as implemented by different political regimes.
For this, we need to distinguish three co-linear time trends: age, period, and cohort (APC) effects. A person could have positive or negative views of democracy because she is young – the so-called life cycle or ageing effect – or because she lives in a country that faces a big political corruption scandal – the so-called period effect that affects everyone, no matter their age or birth year – or because she was socialized at a certain point in history – the cohort effect. Here, we are mainly interested in the cohort effect, which we argue contains the imprinting effect of the education system in place during a person’s impressionable years. We therefore estimate an age, period, and cohort model. The most important covariates are, firstly, the age of the respondents, which we include as age in years. Secondly, cohorts are typically distinguished by their year of birth. Lastly, we include the survey year to capture the period effect. The problem of estimating these three time effects simultaneously is the so-called fundamental APC identification problem:
 $${Birth \;Year}\,\left( C \right) = {Survey \;Year}\;\left( P \right)-{Age}\;\left( A \right)$$
To break the linearity between these three factors, we refrain from including the birth year of respondents and instead (as introduced above) use the educational context during each country-cohort’s impressionable years as a proxy (Rodgers Reference Rodgers1982).Footnote 27 We then simply estimate a linear regression model, using clustered standard errors on the country-birth cohort level as well as year dummies.
Results: the long-term effect of school education on democratic attitudes
We present our results in three steps. First, we investigate the unconditional long-term effect of the education content a person was exposed to on her democratic attitudes today. Second, we present the results of an interaction between the education content and the regime type at the time of someone’s schooling. Third, we include the effort the regime puts into teaching politics in school and how this interacts with the content.
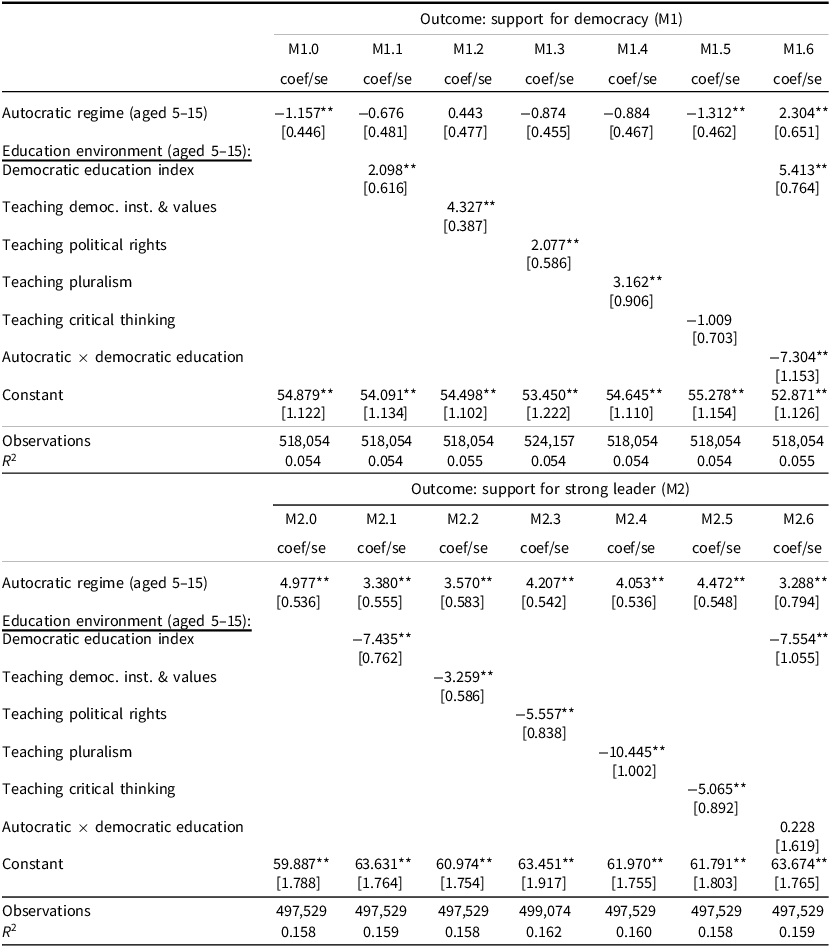
Turning to our first analysis, Table 2 reports the regression coefficients and their standard errors, estimating the effect of our five measures of education content – one index and its four sub-components – on support for democracy (upper panel) and strong leaders (lower panel). But before discussing these findings, we turn to Model 0 for both outcomes, which excludes the education measures. Here, we replicate the findings of the existing literature that demonstrates that people who grew up in an autocracy are significantly less supportive of democracy (b = −1.157) and more supportive of a system with a strong leader (b = 4.977). The goal of our analysis is to uncover the mechanism behind this observational finding by explaining away this effect or at least reducing its size.
Linear regression predicting support for democracy and strong leaders

Table 2. Long description
A table comparing the effects of different education content measures on support for democracy and strong leaders. The table has 13 rows and 12 columns. Column headers include M1.0, M1.1, M1.2, M1.3, M1.4, M1.5, M1.6, M2.0, M2.1, M2.2, M2.3, M2.4, M2.5, and M2.6. Row labels include Autocratic regime (aged 5-15), Education environment (aged 5-15): Democratic education index, Teaching democratic institutions & values, Teaching political rights, Teaching pluralism, Teaching critical thinking, Autocratic x democratic education, Constant, Observations, and R-squared. Each cell contains regression coefficients and standard errors. Notable trends include significant coefficients for autocratic regime and democratic education index across different models.
Significance: *p < 0.05; **p < 0.01. Clustered standard errors by country-birth cohort.
Note: Entries are regression coefficients and their standard errors of a linear regression model. The dependent variables are measured as 0 = ‘no support at all’ and 100 = ‘complete support’. All models control for the following: individual controls: age, gender, education, and working. Macro controls – impressionable years: Age of political regime, (log) GDP per Capita, modernization index, political corruption, public goods provision. Macro controls – survey year: (log) GDP per Capita, political corruption, level of electoral democracy. Study FE, including dummy variables for the studies that were harmonized (with the WVS as the reference category). For full results, see Appendix 6.
In Models M1.1 to M1.5 in Table 2, we add the educational context measures one by one. Except for M1.5 predicting support for democracy, the effect of the regime type becomes insignificant and is reduced by 25% (M1.4) to 62% (M1.2) in size when controlling for the educational content a person was exposed to (compared to M1.0). The results confirm that respondents’ support for democracy today is higher the more democratic the school education was when they were between 5 and 15 years old (b = 2.098). Turning to the sub-components of this index, we see that this positive effect is mainly driven by the inclusion of democratic institutions and values in the curricula (b = 4.327) and the teaching of pluralist views (b = 3.162). However, teaching critical thinking does not affect support for democracy.
Next, we turn to the results predicting support for a strong leader. First, we note that the main socialization effect of the regime type is reduced by 11% (M2.5) to 32% (M2.1) when controlling for the education context at the time (compared to M2.0), even though the effect remains significant. Table 2 confirms that the educational content someone was exposed to, especially the inclusion of more diverse, pluralist views in the curriculum (b = −10.445), has a strong impact on her support for personalist rule. Overall, being exposed to the most democratic school curriculum compared to the most autocratic one reduces support for a strong leader by 7.4 percentage points.Footnote 28
In Appendix 7, we present ten robustness tests of the findings reported in Table 2. These tests address alternative operationalizations, estimation strategies, sample restrictions, and model specifications. Specifically, we (1) distinguish regime age in democracies and autocracies, (2) restrict the analysis to country-years with at least three V-Indoc expert coders, (3) introduce country fixed effects to rely exclusively on within-country variation across cohorts, (4) estimate Hierarchical Age-Period-Cohort (HAPC) models, (5) estimate multilevel random-effects models with respondents nested in country-cohorts, (6) replicate the analyses using only the World Values Survey and European Values Study, (7) additionally control for household income, (8) include continent fixed effects, (9) exclude respondents without formal secondary education, and (10) exclude the contemporaneous democracy measure from the model.
Overall, the substantive conclusions remain highly robust. Across most specifications, the estimated effects of democratic educational content remain similar in direction and magnitude to those reported in Table 2 for both support for democracy and support for strong leaders. The strongest challenge arises from the country fixed-effects specification. Because this model relies solely on within-country variation across cohorts and removes all cross-national differences in educational content, three of the five democratic-content coefficients predicting support for democracy become statistically insignificant, although they remain positive in sign. In contrast, the corresponding effects on support for strong leaders remain consistently negative and statistically significant. Taken together, these findings suggest that part of the association between democratic educational content and democratic support is driven by cross-national differences in educational environments, whereas the relationship between democratic education and lower support for authoritarian alternatives is particularly robust across specifications. The remaining robustness tests confirm the main findings and indicate that they are not driven by coding decisions, data harmonization, sample composition, continent-specific patterns, or the inclusion of contemporary democracy as a control variable.
The results so far confirm that education content matters in shaping citizens’ democratic attitudes, whether strengthening their commitment to democracy or weakening their support for authoritarian alternatives such as personalistic rule. Table 2 estimates the average effect of our education measures using the theoretically possible range of these indicators. However, as we have shown in Figure 2 and Appendix 4, there is a considerable difference in how much democratic content autocracies and democracies implement in their education. In the next step, we therefore investigate whether the content of schooling has a different impact depending on the regime type. To assess this, we simply interact the regime in power during respondents’ youth (1 = autocratic; 0 = democratic) and the democratic content index. The results are included in Models 1.6 and 2.6 in Table 2. Figure 3 further plots the predicted values of this interaction, which reveal different patterns for our two outcomes.
Predicted values (and 95% c.i.) of the interaction between pro-democratic education content and the regime type (aged 5–15).
Note: Estimates of the interaction effects are reported in Table 2, M1.6. and M2.6..

The positive effect of democratic education on support for democracy reported in Table 2 is driven by democracies only (b = 5.413), while in autocracies we find a weak negative effect (b = −1.891). We find a similar pattern when looking at the sub-components of the index, as reported in Appendix 7. However, we find no difference between autocracies and democracies in terms of how the education context affects long-term support for personalistic rule. In both regimes, a more democratic curriculum leads to significantly lower levels of support. There are no differences in the slope between democracies and autocracies when looking at the sub-components of the index.
Does this analysis help us to understand the gap in democratic attitudes, documented in Figure 1? Yes, to some extent, given that the level of democratic education differs sharply between democracies and autocracies. For example, taking the average values of democratic education, the predicted level of support for personalistic rule is 42 percentage points in autocracies and 34 percentage points in democracies. Looking at support for democracy, the predicted levels are 69 in autocracies and 71 percentage points in democracies. This is a very small difference and does not reflect the big difference we documented in Figure 1, where levels of democratic support were significantly lower in young compared to old democracies.
In the last step, we therefore explore whether the sharp differences in democratic attitudes are not just a product of the content of education but also the effort a regime puts into teaching politics in school. Figure 4 plots the predicted values of the interaction between pro-democratic education content and the level of political education efforts for autocracies and democracies separately. The two predictive lines distinguish between low and high efforts using the bottom and top-10% value cut-off points. As the figure reveals, there are no conditional effects of the effort of authoritarian regimes in teaching more or less pro-democratic educational content. However, when turning to democracies, the effort put into promoting politics in the curriculum (e.g., having compulsory civics courses) has a strong moderating effect on the educational content. At the most pro-democratic end of the scale, we find a 9-percentage point difference between democracies that strongly emphasize politics in their curricula versus those that do not.
A similar picture emerges when looking at support for personalist rule, where we find a staggering 12-point difference between high-and low-effort democracies that both teach very pro-democratic curricula. If we compare the high-effort democracies that include average pro-democratic content in their education to high-effort autocracies with average content, the estimated difference in support for democracy is a 7-point difference, with a 13-point difference in support for a personalist ruler. However, if we compare low-effort regimes, the differences are merely 1 point for democratic support and 8 points in support for strong rulers.
Predicted values (and 95% c.i.) of the interaction between pro-democratic education content and level of political education efforts by regime type.
Note:Predicted values and their 95% confidence intervals were estimated based on the same regression as specified in M1.1 and M2.1 in Table 2, including country-birth cohort clustered standard errors. The content index ranges from 0 (most authoritarian) to 1 (most democratic). The political education effort was divided into the bottom-10% and top-10% values. The full results are reported in Appendix 9.

Discussion and conclusion
This paper examined the long-term impact of political education under autocracies and democracies on citizens’ democratic support. Our two empirical analyses provide complementary evidence of imprinting: the GDR case study offers causal evidence of how authoritarian schooling dampened democratic attitudes, while the cross-national analysis demonstrates the broader generalizability of these effects and highlights the particularly strong imprint of democratic education.
We developed and tested the theory of educational imprinting to explain why citizens who were socialized under a dictatorship remain more skeptical of democracy than those who grew up in democratic systems. Schools provide an especially powerful mechanism for imprinting because exposure is compulsory and coincides with individuals’ impressionable years. The GDR case shows that one additional year of socialist schooling significantly reduced later-life democratic support. We argue this reflects both the imprint of authoritarian indoctrination and the missed opportunity for democratic socialization. This interpretation aligns with our cross-national findings: the strongest driver of long-term democratic support is democratic schooling itself, especially when regimes invest heavily in civic education.
Our global analysis, based on 106 countries and more than 750,000 respondents, demonstrates that the teaching of democratic institutions, rights, and pluralist values leaves a lasting imprint. For example, teaching pluralism reduces support for personalist rule by more than ten percentage points. By contrast, the absence of such content under autocracies only weakly lowers democratic support, suggesting that the democracy-autocracy gap is primarily driven by the positive effect of democratic education. Democracies that combine pro-democratic curricula with strong efforts to promote civic education enjoy both the highest levels of democratic commitment and the weakest support for authoritarian alternatives.
Taken together, these findings underscore that democracy must be learned to be appreciated. Authoritarian regimes leave behind a legacy of weaker democratic support, while democracies can instill enduring pro-democratic commitments during citizens’ school years. By combining micro-level causal identification with cross-national generalization, this paper advances a unified account of how the content and effort of political education shape citizens’ political attitudes. These insights highlight the central role of civic education in democratic consolidation and stability and the importance of investing in democratic schooling as a safeguard against backsliding.
Several limitations should be acknowledged. First, the East German analysis relies on a comparatively small number of respondents in the treated cohorts. While the results remain largely robust across a range of specifications, the limited sample size reduces statistical power and precludes the use of more demanding identification strategies, such as a regression discontinuity design. The findings should therefore be interpreted as suggestive evidence regarding the long-term consequences of authoritarian civic education. Second, some robustness tests indicate that the estimated effects are sensitive to restrictions based on educational attainment. In particular, the effects become less precisely estimated when university graduates are excluded, which may reflect reduced statistical power but could also suggest that later educational experiences in democratic settings partially reshape attitudes acquired during secondary schooling. Future research should investigate the conditions under which democratic resocialization (through tertiary education or other avenues) may reinforce or offset earlier educational influences. Third, although the cross-national analysis links educational experiences during respondents’ formative years to their contemporary political attitudes, it remains observational in nature. Despite the inclusion of extensive individual, cohort, period, country, and study controls, unobserved contextual factors may still influence both educational systems and political attitudes. Consequently, the cross-national results should be interpreted as evidence of a robust association rather than a definitive causal effect.
Supplementary material
The supplementary material for this article can be found at https://doi.org/10.1017/S1475676526101832.
Acknowledgements
Previous versions were presented at the GEPS seminar at Universitat Autonoma de Barcelona (January 2024), the Hamburg Political Science Seminar Series, University of Hamburg (January 25, 2024), and the workshop on ‘Education, Social Class, and Participation’, Aarhus University (March 5, 2024). We thank the discussants and participants of these workshops and seminars for their valuable feedback.
Funding statement
This research was generously funded by the UK Economic and Social Research Council (award reference: ES/N012127/1) and a European Research Council Consolidator Grant, ‘Democracy under Threat: How Education can Save it’ (DEMED) (Grant number: 865305).
Competing interests
The authors declare none.
Replication package
Replication materials, including the analytical datasets, Stata code, and README file required to reproduce all analyses reported in this article, are available from the Harvard Dataverse at https://doi.org/10.7910/DVN/NYLYET (Neundorf 2026). The intermediate harmonized survey dataset is not included because it is derived from multiple publicly available surveys subject to their respective data redistribution agreements. Detailed documentation of the harmonization procedure, including the harmonization code, is available at https://globalcitizenpolitics.net/data/.
Use of AI
Generative AI tools were used for language editing only. The authors take full responsibility for the content of the article.




 Open access

