


Introduction
Do EU citizens want more or less EU democracy? Which factors drive their positions on this question? While there has been some research into citizens’ satisfaction with the EU’s democracy (e.g., Ares et al., Reference Ares, Ceka and Kriesi2017; Hobolt Reference Hobolt2012; Plescia et al., Reference Plescia, Daoust and Blais2021), to the best of our knowledge, there have been no studies of citizens’ demands for EU democracy. This is a notable deficiency since the EU has been said to suffer from a “democratic deficit” (Follesdal and Hix, Reference Follesdal and Hix2006; Hix, Reference Hix2008; Jensen, Reference Jensen2009), and over time, a series of institutional reforms has been adopted to make the EU more democratic. Most notably, since 1979, there have been direct elections for the European Parliament (EP), and the EP’s role in the legislative process has been strengthened since the co-decision procedure became the ordinary legislative procedure with the entry into force of the Lisbon Treaty. The EU also seeks to support political parties and civil society at the European level, supplementing the EP with additional participation channels, such as the EU Citizens’ Initiative, EU Citizens’ Panels, and the right to petition (Saurugger, Reference Saurugger2010). Even though much work has been done to make the EU more democratic, we do not really know whether citizens want more EU democracy. Insight into citizens’ demands for EU democracy is important for evaluating the potential impact of democratic reforms at the EU level and also for assessing how European integration and democratic attitudes interact more broadly.
For now, research on citizens’ opinions on the EU has been dominated by the focus on the question of support for integration (Hobolt and de Vries, Reference Hobolt and de Vries2016). This literature has highlighted significant variation in the level of support for integration across EU member states. Important correlates of support for EU integration have been identified, such as the level of education (Hakhverdian et al., Reference Hakhverdian2013) and whether people perceive EU membership as economically advantageous to their country or their own situation (Foster and Frieden, Reference Foster and Frieden2021; Gabel, Reference Gabel1998). These explanations have been complemented by research showing that opposition to European integration correlates with a strong attachment to national identity and national values (Carey, Reference Carey2002; McLaren, Reference McLaren2002; Clark and Rohrschneider, Reference Clark and Rohrschneider2019). Furthermore, in evaluating European integration, citizens often use the effectiveness of their own member state as a benchmark (De Vries, Reference De Vries2018; Sánchez-Cuenca, Reference Sánchez-Cuenca2000): the more confidence they have in the quality of their own member states, the more skeptical they tend to be of European integration as it risks undermining that national effectiveness. In turn, citizens of weaker member states tend to have a more positive view of European integration, as they perceive it as a means to strengthen and enhance the quality of their national polity.
Crucially, the question about the demand for more EU democracy cannot be regarded as a simple extension of the question of support for integration. If one supports further European integration, this need not automatically imply that one also wants more EU democracy. For one, while EU citizens may have formed a position on the desirability of European integration, they are less likely to have a clear understanding of democracy at the EU level and what it entails. What is more, other factors may interfere in the relationship between support for European integration and demand for more EU democracy, for instance, how one evaluates the EU’s current democratic performance and whether one believes that strengthening EU democracy could go together with a strong national democracy, or whether the former is more likely to proceed at the cost of the latter. Indeed, relying on the intuitions behind the benchmark theory, demand for more EU democracy is likely to be affected by the value that citizens attach to their national democracy and whether and how they expect it to be affected by an increase in EU democracy.
The present study examines how Europeans perceive democracy at the European level, their level of satisfaction with the functioning of European democracy, and whether they desire more of it. Data have been collected in 16 member states to provide tentative answers to this question in the context of the 2024 EP elections. Specifically, the paper makes two contributions. First, we combine literature on civic culture and national democracy (Almond and Verba, Reference Almond and Verba1965; Dalton and Welzel, Reference Dalton and Welzel2014; Norris, Reference Norris1999) with the literature on models of democracy (Ferrín and Kriesi, Reference Ferrín and Kriesi2016, Reference Ferrín and Kriesi2025; Mair, Reference Mair2009), to develop a typology of citizens’ views of EU democracy that juxtaposes demands for democracy with satisfaction with EU democracy. This juxtaposition helps us appreciate that satisfaction and demands are distinct aspects, and also that the distribution of how citizens combine them varies between nation-states and the EU.
Second, to unpack and explain how citizens combine satisfaction with EU democracy and demands for EU democracy, we adopt two critical explanatory factors. A first factor that informs our analysis throughout is citizens’ knowledge of the European integration process. It is often said that the EU and its policymaking process are far removed from ordinary European citizens and are particularly complex to understand, especially due to their interactions with national politics. Hence, knowledge about the European integration process may well be a critical precondition for appreciating EU democracy and forming expectations about it in the first place. What is more, we also expect knowledge to affect the ways in which the other explanatory factors influence citizens’ attitudes toward EU democracy.
As a second explanatory factor, we zoom in on citizens’ feelings of being represented at the EU level. We conjecture that citizens’ democratic evaluations depend on their perception of the democratic responsiveness of EU decision-makers, but we expect the relation between this perception and their demand for more EU democracy to be more indeterminate. In addition, we control for citizens’ general attitude toward the European integration process, assuming that this attitude is heavily correlated with both their conceptions of democratic responsiveness and their perceptions of EU democracy. In all, this article proposes an original typology of citizens’ attitudes toward EU democracy and systematically tests both the ways in which satisfaction with and demand for EU democracy interact, and the factors that drive these attitudes.
We first present our theoretical considerations. Next, we introduce our operationalization of the theoretical concepts. The analysis first offers a descriptive account of the key aspects of public opinion on EU democracy. It then examines the factors associated with citizens’ knowledge about EU democracy, their demands for and satisfaction with EU democracy, and with the types of democrats.
Theory
A typology of democrats
In their study of political culture across the globe, Dalton and Welzel (Reference Dalton and Welzel2014) distinguish between allegiant and assertive democrats. They observe a general rise of dissatisfaction with democracy, which they attribute to social modernization (see also Norris, Reference Norris1999). In contrast to the loyal, confident, and trusting citizens – the allegiant democrats – in the past, contemporary citizens, they claim, have become more assertive, that is, combine a “deep normative commitment to democratic values with dissatisfaction on how governments fulfill these ideals” (Dalton and Welzel, Reference Dalton and Welzel2014, p. 287). Satisfaction with democracy has varied in European nation-states since 2012, increasing in some respects in certain countries and decreasing in others (Landwehr and Schäfer, Reference Landwehr, Schäfer, Ferrin and Kriesi2025). EU democracy is different, however. First of all, because it is of a much more recent vintage than democracy in most nation-states, and, secondly, because it is built upon the existing national democracies. Hence, regarding satisfaction with EU democracy, EU citizens are less likely to compare their current perception with how EU democracy operated in the past. Instead, they are more likely to rely on the comparison with the norm set by their national democracy as a benchmark (cf. Sánchez-Cuenca, Reference Sánchez-Cuenca2000).
Moreover, the distinction between assertive and allegiant citizens assumes that no citizen wants less democracy. If this is a reasonable assumption for national democracy, it is unlikely to hold for the EU level. At this level, citizens may be dissatisfied with the way democracy works, but do not want to introduce more democracy, given that the extension of EU democracy might constrain national democracy. To elaborate on this point, we turn to the work of Ferrín and Kriesi (Reference Ferrín and Kriesi2016), who have systematically developed the distinction between evaluations of democracy (‘what democracy actually is’) and views of democracy (‘what democracy should be’). They argue that it is “the comparison between the democratic ideals and democracy’s actual functioning that makes for the assessment of a democratic regime” (Ferrín and Kriesi, Reference Ferrín and Kriesi2016, p. 10; Ferrín and Kriesi, Reference Ferrín and Kriesi2025).Footnote 1 Conceiving satisfaction with and demand for EU democracy as two conceptually independent dimensions, we can create a fourfold typology (Table 1) that extends Dalton and Welzel’s (Reference Dalton and Welzel2014) initial distinction. This typology includes Dalton and Welzel’s categories of allegiant and assertive democrats, who both want more democracy, but the allegiant democrats are satisfied with it, while the assertive democrats are dissatisfied. In addition, the typology also includes two more types: disaffected and delegative democrats.
Typology of EU Democrats

Table 1. Long description
The table categorizes types of EU democrats based on their satisfaction with and demand for democracy. It has two columns and four rows. The columns are labeled ‘Demand’ and ‘Evaluation of the current state of democracy’, with sub-columns ‘Satisfied’ and ‘Dissatisfied’. The rows are labeled ‘More democracy’ and ‘Less democracy’. The table categorizes individuals into four types: Allegiant democrats (satisfied with current democracy and want more), Assertive democrats (dissatisfied with current democracy and want more), Delegative democrats (satisfied with current democracy and want less), and Disaffected democrats (dissatisfied with current democracy and want less).
The category of ‘disaffected democrats’ was already coined fifty years ago in the context of a debate on the governability of established national democracies (Pharr and Putnam, Reference Pharr and Putnam2000). At the time, some observers became concerned about the growing dissatisfaction and distrust among citizens toward their government (Crozier et al., Reference Crozier, Huntington and Watanuki1975) and feared that these sentiments might lead citizens to turn away from democracy. While the preoccupations of these observers proved to be premature for most national democracies (e.g., Klingemann and Fuchs, Reference Klingemann and Fuchs1995), one can well imagine that there may be many disaffected democrats with regard to EU-level democracy, that is, citizens who are dissatisfied with the way EU democracy works and, at the same time, do not want to introduce more democracy at this level. The main reason for this is that these citizens simply do not think that the democratic shortcomings are to be mended at the EU level, or because they resist further EU democracy, since they are opposed to the EU as a polity per se (a position that most citizens are unlikely to adopt with regard to their national polity).
In turn, there may also be citizens who are satisfied with the state of EU democracy but do not demand more citizen involvement at the EU level. They are happy to delegate politics to elected officials or even to experts and businesspeople and forget about politics between elections. Such a view of democracy aligns closely with Schumpeter’s (Reference Schumpeter1962) minimalist conception of democracy, which reduces it to “electoral democracy.” Specifically with regard to the EU, Moravcsik (Reference Moravcsik2002) argues that there is no democratic deficit and no need to expand citizen participation in the EU, exactly because its decision-making power is concentrated in policy domains that lack popular salience, and that even in those domains, its political discretion is severely constrained. We shall use the term ‘delegative democrat’ to characterize such a view of democracy.Footnote 2 Citizens may consider the EU so remote that they prefer not to engage with its politics between elections and are content to delegate power to the party that wins the elections. They may even consider that there should be less democracy at the EU level and that EU decision-making should be left to technocrats.
Bearing in mind that we are focusing on democracy at the EU level, we also need to consider a fifth type. It includes citizens who have no opinion about democracy at the EU level. As already observed, citizens tend to have limited knowledge of the EU in general and of the workings of the European Parliament in particular (Hobolt, Reference Hobolt2014; Pannico, Reference Pannico2020). This is related to the fact that, between elections, the EP has traditionally been largely ignored by national media (Norris, Reference Norris2000; Peter and de Vreese, Reference Peter and de Vreese2004). To be sure, European election campaigns are increasingly more salient in the media (Gattermann et al., Reference Gattermann, de Vreese and der Brug2021; Van der Brug et al., Reference Van der Brug, Gattermann and De Vreese2016), and the European crises have rendered European politics generally, and supranational institutions in particular, more salient (Silva et al., Reference Silva, Kartalis and Lobo2022). Still, although citizens are aware of the EU, “they do not feel knowledgeable about its day-to-day activities and have a pessimistic view about their ability to bring about policy change through participation in supranational democratic procedures” (Baglioni and Hurrelmann, Reference Baglioni and Hurrelmann2016, p. 121). In other words, we expect a sizable group of citizens to have no opinion on it.
Citizens who know little about the EU are more likely to belong to this group without an opinion about EU democracy, as are citizens who are generally less knowledgeable about politics, that is, citizens of younger age, lower education, and little political interest (Carl et al., Reference Carl, Richards and Heath2019; Clark, Reference Clark2014).
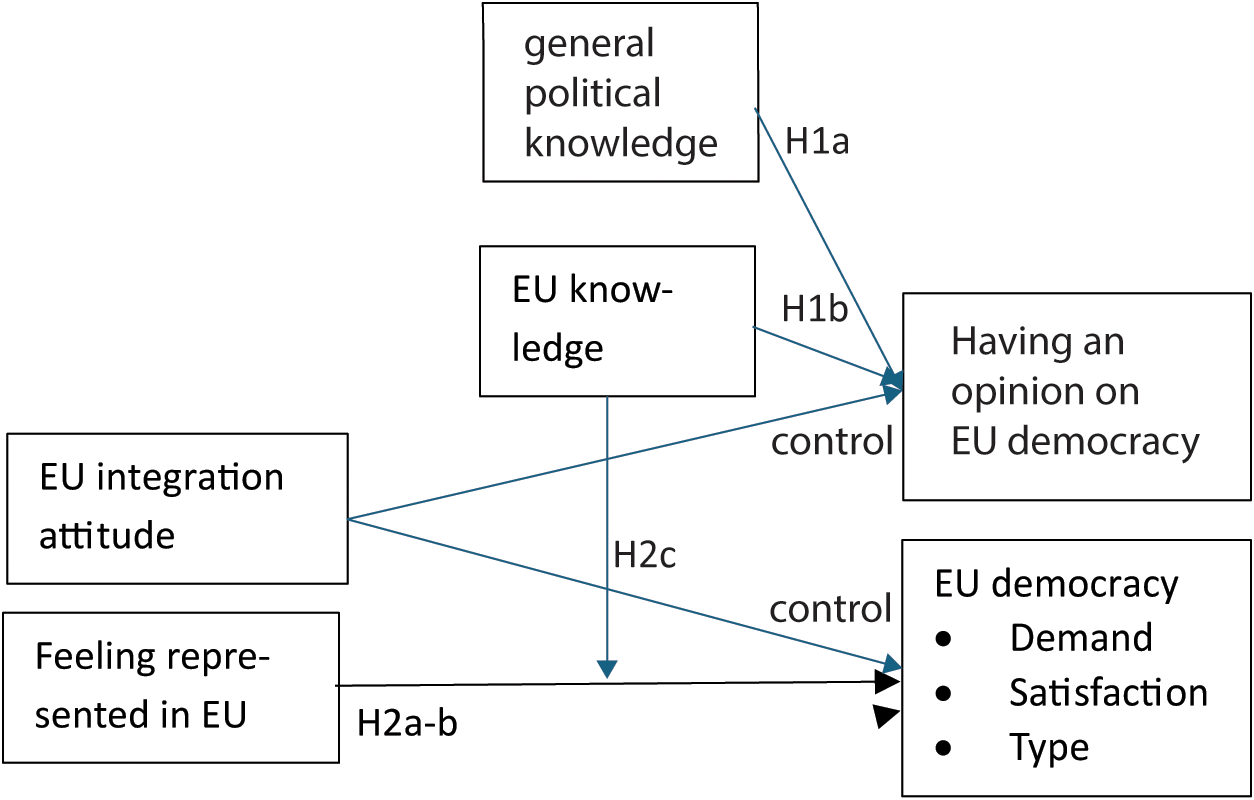
H1a: We expect citizens who are generally more knowledgeable about politics to be more likely to have an opinion about EU democracy.
H1b: We expect citizens who know a lot about the EU to be more likely to have an opinion about EU democracy.
Representation as a driver of demands for and evaluations of EU democracy
Supposing that EU citizens hold varied views on EU democracy, different factors come into play that may explain how citizens can be sorted into different types. We treat knowledge about the EU primarily as a precondition for having an opinion in the first place. To explain the citizens’ democratic demands and evaluations, and their distribution across types, we focus on their perceptions of representation and its interactions with knowledge.
For this purpose, we introduce the concept of responsiveness in representative democracy. Responsiveness is regarded as a key mechanism for the functioning of representative democracy (Bühlmann and Kriesi, Reference Bühlmann, Kriesi, Kriesi, Lavenex, Esser, Bühlmann and Bochsler2013; Dahl, Reference Dahl1971; Pitkin, Reference Pitkin1972). It connects the citizens’ preferences to the decision-making of the elected representatives. Powell (Reference Powell2004, p. 91) defines responsiveness as “what occurs when the democratic process induces the government to form and implement policies that citizens want.” Esaiasson and Wlezien (Reference Esaiasson and Wlezien2017, pp. 700–1) provide a simple model for the responsiveness process: the politicians act more or less responsively; the citizens perceive the politicians’ actions as more or less responsive, which then has consequences for their electoral choices and their support for the political system; finally, the citizens’ reactions may feed back on the politicians’ actions. Following Holmberg (Reference Holmberg2020), who focuses on the perceptions of citizens in this process, that is, their feelings of being represented, we are interested in the effect of perceived responsiveness on the part of citizens regarding their demands and evaluations of democracy at the EU level.
Perceived responsiveness is a performance evaluation, suggesting it is closely and positively associated with the evaluation of EU democracy, but to a lesser extent with the demand for democracy. Given the EU’s democratic deficit, it is likely that a large part of EU citizens do not feel represented in EU decision-making and are, therefore, not satisfied with EU democracy. To the extent that citizens do feel represented at the EU level, they are likely to be satisfied with EU democracy. In contrast, feeling represented may have a contradictory effect on democratic demands. On the one hand, the effect of feeling represented on democratic demand is likely to be positive, because those who feel represented may want more of the good thing, while those who do not feel represented may be disaffected from EU democracy altogether. On the other hand, the effect may be negative, because those who feel represented may be satisfied with the status quo and do not want more democracy, while those who do not feel represented may be critical citizens who have not yet given up the hope for more EU democracy. In terms of types, given the expected close association between feeling represented and democratic satisfaction, we expect that compared to the reference group of citizens without an explicit opinion on EU democracy, citizens who feel represented are less likely to be disaffected or assertive democrats and more likely to be delegative or allegiant democrats. All these effects, too, are expected to be more pronounced among the more knowledgeable citizens:
H2a: We expect citizens who feel represented to be more satisfied with EU democracy. They may or may not demand more EU democracy.
H2b: We expect citizens who feel represented to be less likely to be disaffected or assertive democrats and more likely to be allegiant democrats or delegative citizens.
H2c: We expect the effects on demand and satisfaction to be moderated by knowledge about the EU: the greater the EU knowledge, the greater the effects of feeling represented on democratic attitudes.
To analyze the relationship between feeling represented and democratic demand and satisfaction, we control for citizens’ attitudes toward European integration. Pro-Europeans are generally expected to demand more EU democracy and to be satisfied with the democratization process at the EU level. Overall, we expect them to be mainly allegiant democrats. In contrast, Eurosceptics, that is, citizens who do not want the European integration process to proceed further and believe it has already gone too far, are less likely to demand more democracy at the EU level and more likely to be dissatisfied with the way EU democracy operates. Overall, we expect them to be primarily disaffected with EU democracy. Figure 1 provides an overview of the hypotheses.
Overview of the hypotheses.

Data and operationalizations
We test these ideas on an original dataset that was collected shortly before the 2024 EP elections in 16 of the 27 EU member states. This sample includes member states from all regions of the EU and all 15 member states, except for Czechia, with a population of more than 8 million (covering more than 90% of the EU’s population). Specifically, it includes two Nordic countries (Finland and Sweden), six northwestern European countries (Austria, Belgium, France, Germany, Ireland, and the Netherlands), four southern European countries (Greece, Italy, Portugal, and Spain), and four eastern European countries (Hungary, Latvia, Poland, and Romania). With the exception of Latvia, where the sample size was smaller (n = 800), the national samples comprise roughly 2,000 respondents. The online interviews were conducted by YouGov between May 3 and May 14, 2024.
To operationalize the two dimensions of the typology – demand for and assessment of democracy at the EU level – we have asked a carefully targeted question for each dimension. For democratic demands, we rely on the respondents’ views on the role they envisaged for the European Parliament, that is, we asked whether they would like to see the European Parliament play a less important or a more important role, with an 11-point response scale ranging from a much less to a much more important role, and 5 indicating the status quo. This question invokes a straightforward parliamentary model of liberal democracy, according to which governments are accountable to voters through parliament. It also reflects scientific analyses of the democratic deficit that have argued that the European Parliament is too weak (Follesdal and Hix, Reference Follesdal and Hix2006). Admittedly, asking about the role of the European Parliament as a measure of democratic demand presupposes that respondents have some understanding of the EP as the EU’s primary elected and representative institution. This is not a trivial assumption given the generally low levels of knowledge about EU institutions. However, precisely because the EP is the democratic institution par excellence at the EU level as the only directly elected body with legislative powers, it provides the most appropriate and meaningful cue for gauging citizens’ desires regarding EU democracy. Alternative formulations using more abstract language about “democracy at the EU level” risk greater conceptual ambiguity, as citizens may interpret such questions through varied lenses (such as transparency, accountability, and participation) without clear institutional referents. By contrast, the EP offers a concrete focal point.
The validity of the item about the importance of the role that the EP should play is also confirmed when we compare it to the alternative of an index for democratic demands, in which we combine it with the responses to an analogous question about the role of the EU Commission (we asked whether the respondents would like to see the European Commission play a less important or a more important role, with the same 11-point response scale) and another question about the power of the European Parliament (The European Parliament should be given more powers, with a five-point disagree-agree response scale). The index for the three items was constructed based on a factor analysis. It correlates very highly (r =.94) with the single item we chose for our analysis, which is why we preferred to stick with the more straightforward single question.
As it turns out, 15.9 percent of the sample do not know what to say, and 25.4 percent opt for the middle category. Those with an explicit opinion are roughly equally divided between those who advocate for a more significant role for the EP and those who advocate for a less significant role. The high proportion of “don’t know” responses and middle-category selections that we observe validates our concern about limited knowledge, which is precisely why we devote substantial attention throughout our analysis to distinguishing those with clear opinions from those without and to examining how knowledge conditions democratic attitudes.
For democratic satisfaction, respondents were asked how satisfied they were with the functioning of democracy in the EU. Responses were also recorded on an 11-point scale, ranging from “completely dissatisfied” to “completely satisfied.” 10.5 percent did not know how to answer this question, and 16.0 percent opted for the middle category. The remainder is again rather equally divided between the dissatisfied and the satisfied. Compared to democratic demand, where roughly two-fifths of Europeans do not seem to have any clear opinions, they seem to have somewhat more crystallized opinions about democratic satisfaction. This suggests that we can expect clearer-cut results for satisfaction than for demands. For both democratic demand and satisfaction, we combined the don’t knows with the middle category.
Democratic demand and satisfaction with how democracy works at the EU level are positively correlated (r = .42), and this relationship holds in each of the countries covered by the study. The correlation ranges from a maximum of 0.63 in Sweden to a minimum of 0.23 in Portugal and Greece. It is generally lower in southern Europe, which is due to the fact that a large majority of southern Europeans want more democracy in the EU, while this is not necessarily the case in northwestern Europe.
To create the typology, we dichotomized the two variables while treating the ‘don’t know’-categories separately. In dichotomizing, we categorized the middle categories as follows: For satisfaction, we combined the middle category with those who are satisfied to clearly distinguish the dissatisfied from the rest. For demand, however, we categorized the middle category differently, depending on satisfaction: for the dissatisfied, we added it to those who demand more, whereas for the satisfied, we added it to those who demand less. In this way, we get two clearly opposed types – the disaffected, who are dissatisfied and want less democracy, and the allegiant, who are satisfied and want more democracy. The other two types are less clear-cut, since they do not only include those who demand more or less democracy, but also those who are neither demanding more nor less of it. We cross-tabulated these dichotomized indicators and added a fifth category, “no opinion,” which includes respondents who did not know how to answer either or both of the two indicators.
Turning to the independent variables, we operationalize knowledge of the European integration process with a battery of four knowledge questions, which have been presented to the respondents in random order and all of which offer four randomized response options:
-
• Which country voted in favor of leaving the European Union in 2016?
-
• Which of the following countries IS NOT a member of the European Union?
-
• Who is the current president of the European Commission?
-
• Who is the current president of the European Central Bank?
We aggregate the number of correct answers. The average number of correct responses in the whole sample is 2.2. The glass is either half empty or half full. One-seventh (14.2 percent) did not give any correct answer, and one-fifth (22.0 percent) got all four questions right.
For subjective perceptions of responsiveness, we follow Holmberg (Reference Holmberg2020), who measures responsiveness subjectively as the feeling of being personally represented, in our case, in EU decision-making. We again use an 11-point response scale ranging from “disagree completely” to “agree completely.” More than half (56.4 percent) of Europeans do not feel represented at the EU level, and fully one-fourth (26.5 percent) do not feel represented to the extreme (choosing 0 on the 11-point scale). Roughly one-fifth (22.4 percent) either do not know how to answer this question (10.7 percent) or choose the mid-point (11.8 percent). This leaves only roughly another fifth (21.1 percent) who feel, to some extent, represented, ranging from 11.4 percent in Finland to 29.5 percent in Portugal. These results again sharply contrast with those at the national level (Holmberg, Reference Holmberg2020), where up to 89 percent of respondents in Denmark feel represented by a party, and 43 percent still do so in Italy.
For the attitude toward EU integration, we use a standard question with an 11-point response scale: “Some say European integration should be pushed further. Others say it has already gone too far. How do you feel about this?” Note that 18.1 percent do not know how to answer this standard question, and 18.7 percent choose the middle position. In other words, more than a third of the sample does not have an explicit opinion about EU integration. General political knowledge is operationalized by the standard question on political interest (How interested are you in politics?) with four response categories ranging from “very interested” to “not at all interested.” As additional control variables, we introduce the level of education, gender, and age. For the analysis, we rescale all independent variables to the 0–1 scale so that their effects on democratic demand and satisfaction are comparable and correspond to the maximum effects.
For the analysis of having an opinion about EU democracy, we use logit regressions, as the dependent variable is dichotomous. For the analysis of factors associated with the demand for and satisfaction with democracy, we use Ordinary Least Squares (OLS) regressions, given that these two dimensions are measured on a continuous scale. For the analysis of the factors associated with the types, we rely on multinomial logit regressions, given the categorical character of the types. In all these analyses, we use country fixed effects to control for the specific characteristics of each country context. We also use standard errors clustered by countries, given that opinions about EU democracy are heavily shaped by the experience with democracy at the national level (Ares et al., Reference Ares, Ceka and Kriesi2017; Harteveld et al., Reference Harteveld, van der Meer and De Vries2013; Hobolt, Reference Hobolt2012).
Descriptive analysis: EU-level and national distributions
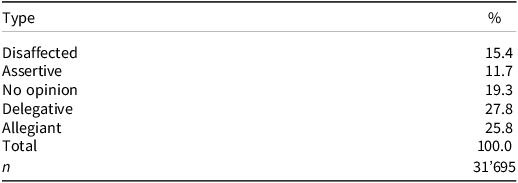
Table 2 presents the distribution of the sample over the five types. In contrast to the national level, where almost everybody wants more democracy (see Ferrín and Kriesi, Reference Ferrín and Kriesi2016), only a minority of Europeans wants more EU democracy, although a (small) majority is satisfied with it. Thus, the allegiant (25.8 percent) and assertive (11.7 percent) types together account for only approximately two-fifths of all citizens. Notably, the delegative democrats (27.8 percent) constitute the largest category, the share of citizens without an explicit opinion on EU democracy amounts to roughly one-fifth, and the disaffected democrats (15.4 percent) also make up a sizeable category.
The distribution of the sample over the five types of European democrats: percentages

Table 2. Long description
A table with five rows and two columns. The columns are labeled Type and %. The rows are labeled Disaffected, Assertive, No opinion, Delegative, Allegiant, and Total. The values in the table are as follows: Disaffected: 15.4; Assertive: 11.7; No opinion: 19.3; Delegative: 27.8; Allegiant: 25.8; Total: 100.0, 31695.
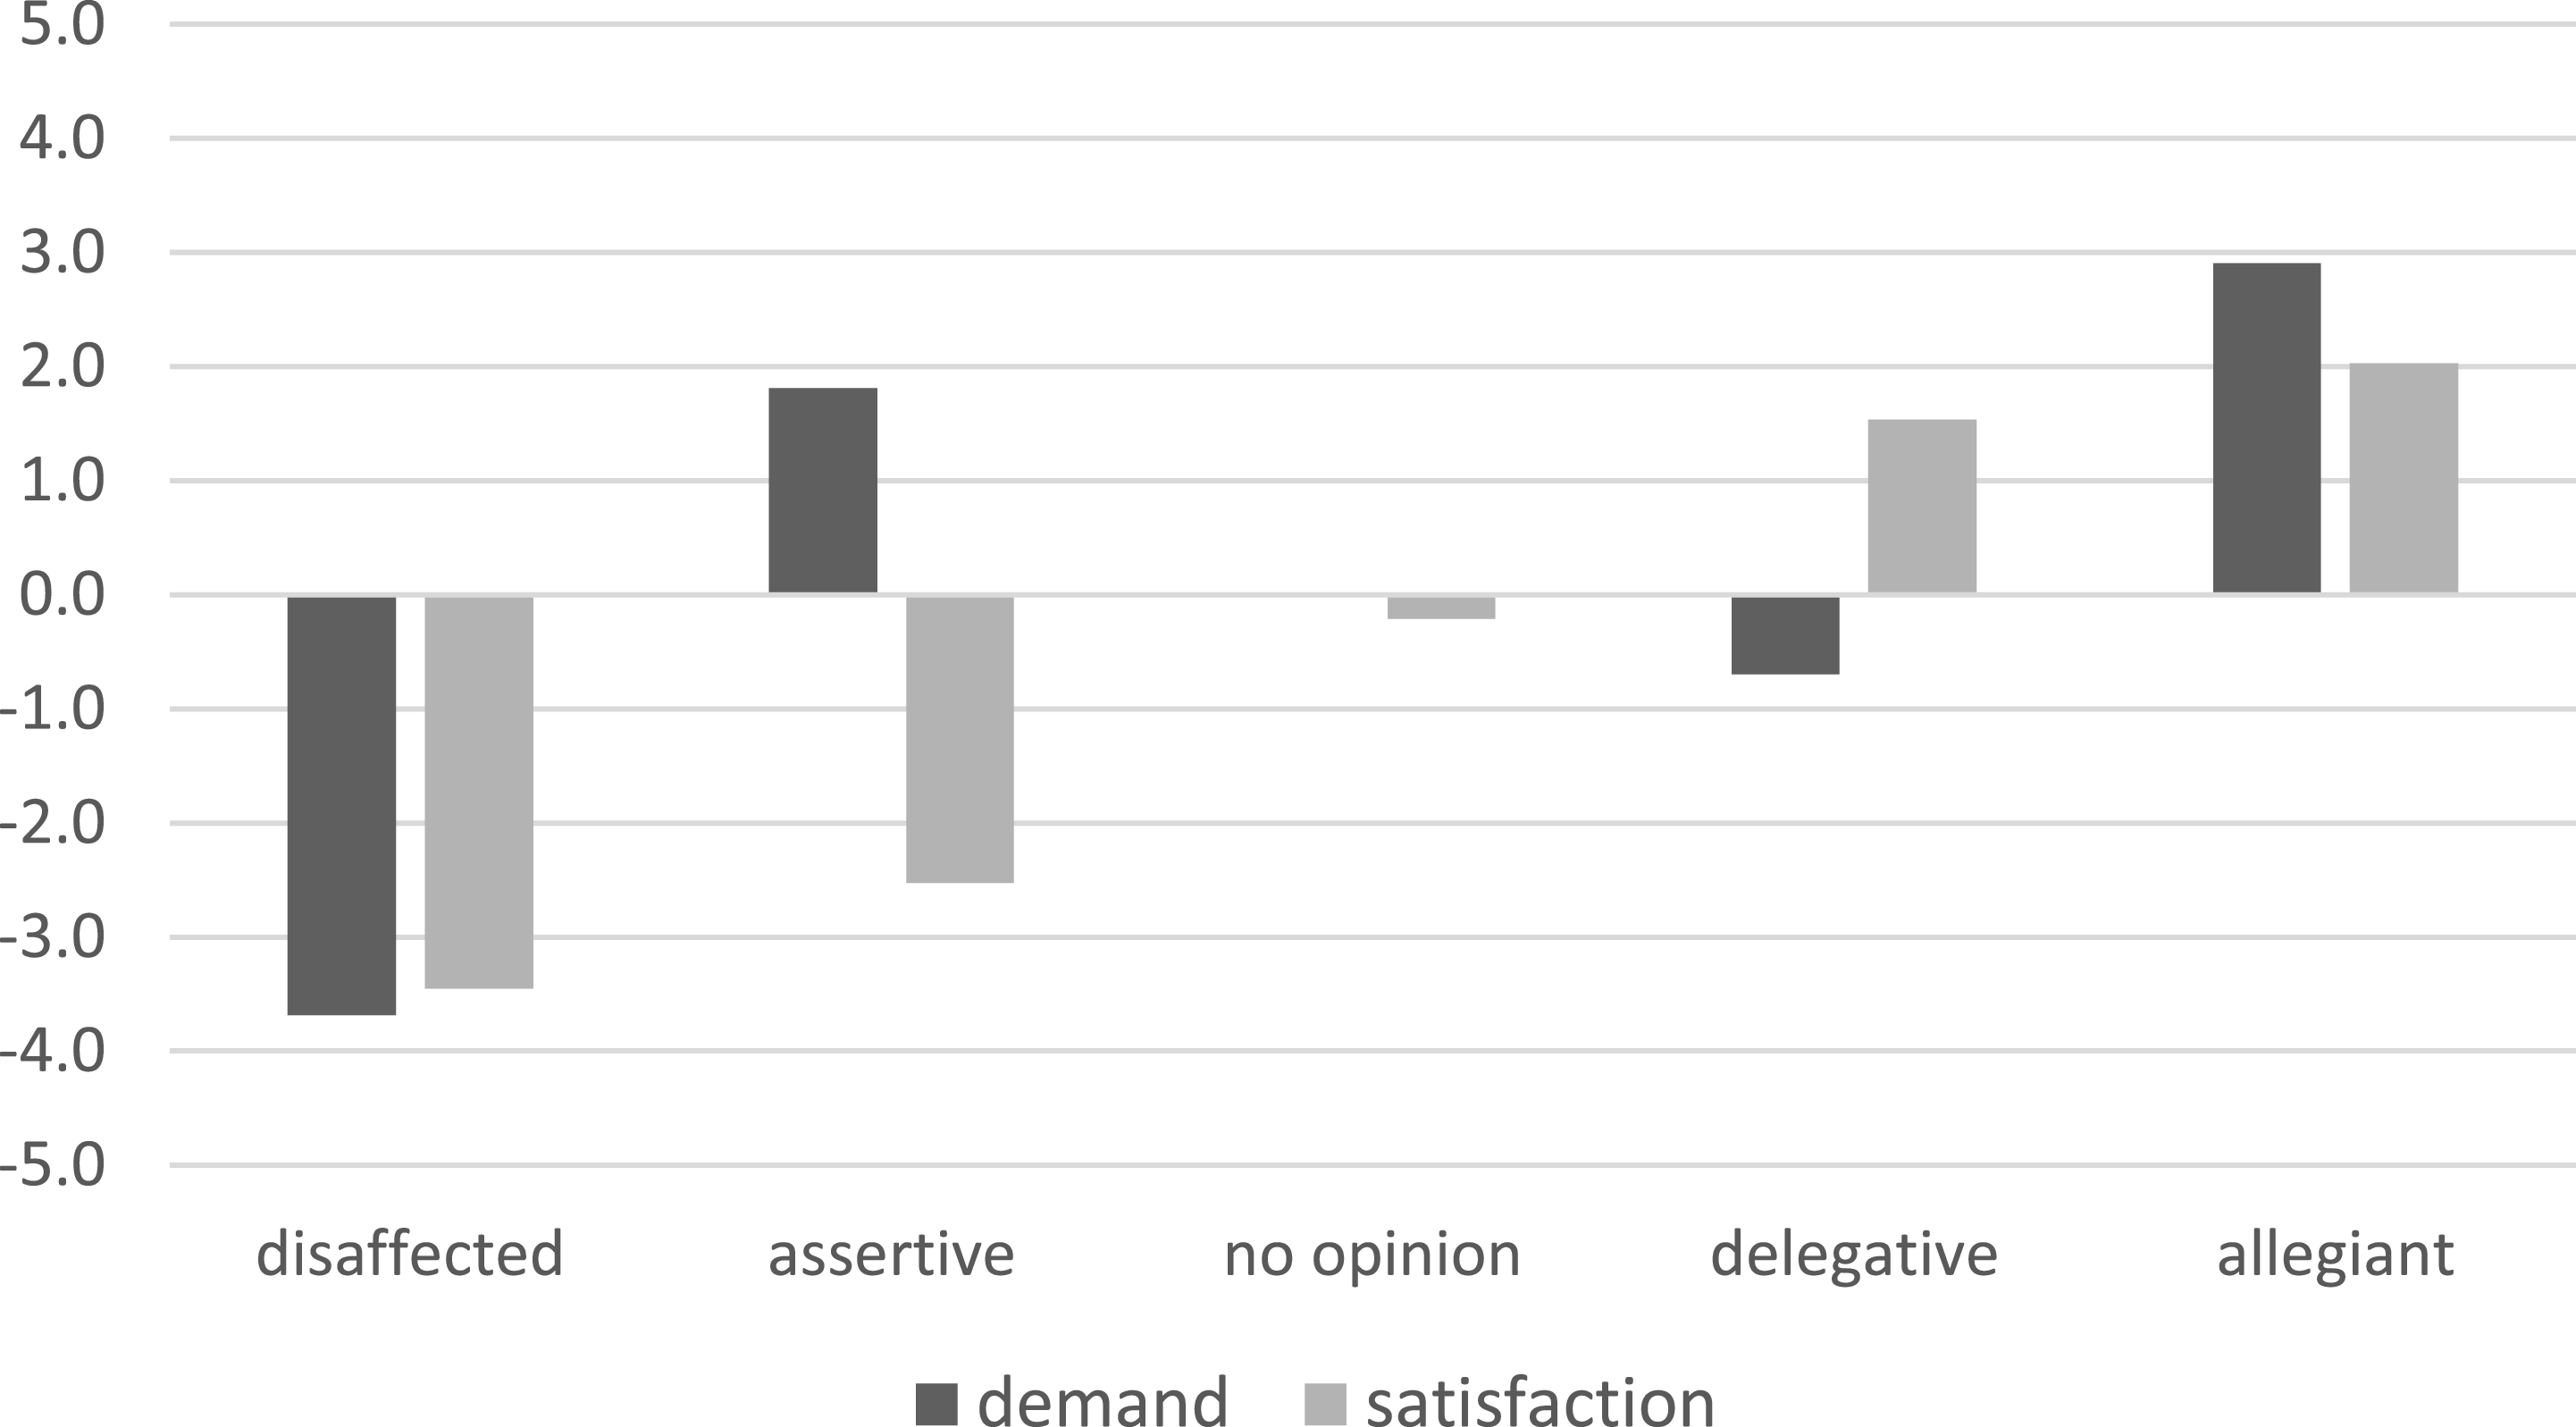
The means of the five types on the two dimensions used to construct the typology give us a more precise idea of how to conceive of the types. Figure 2 presents the results. For this presentation, we have deducted the midpoints (=5) from the average scale values, that is, the means presented in Figure 2 indicate how much the means of the different types deviate from the midpoint on the scales, which, remember, is also where we located the respondents with no opinion. Accordingly, for citizens with no opinion, the mean values for demand and satisfaction are, indeed, exactly (for demand) or almost (for satisfaction) zero. For the delegative democrats, the means do not stray much from zero either: they are somewhat satisfied (mean = 1.5), and they want only a bit less democracy than what is offered by the status quo (mean=−.7). This means that we might conceive of the delegative democrats essentially as lukewarm adherents to the democratic status quo in the EU. In line with their definition, the disaffected citizens are characterized by both their intense demand for less democracy and their great dissatisfaction with the democracy at the EU level. For these citizens, democracy at the EU level has apparently gone too far already, which explains their great dissatisfaction with EU democracy. In contrast, the allegiant citizens clearly want more democracy at the EU level and are the most satisfied of all types. But their satisfaction is rather moderate, probably because democracy at the EU level still falls short of what they would like it to be. Finally, assertive citizens also want more democracy at the EU level, but they are dissatisfied with the current state of EU democracy. Note that their demands are less intense than the demands of the allegiant citizens, while their dissatisfaction is less intense than that of the disaffected citizens. In other words, they are somewhat moderate opponents to the status quo.
Demand for and satisfaction with EU democracy per type: average scale values.

Figure 3 presents the distribution of democratic types by country. When it comes to views of democracy at the EU level, delegative and allegiant democrats together – the two satisfied types – make up at least half of the citizens everywhere, except in four northern and western European countries – Sweden, France, Belgium, and the Netherlands, where we find comparatively large numbers of dissatisfied democrats and people with no opinion about EU democracy. In contrast, in southern and eastern European countries, there are comparatively many delegative and allegiant democrats, that is, people who are satisfied with the democracy they get at the EU level. This may come as a surprise, given the harsh treatment of southern Europeans by EU authorities during the Eurozone crisis. However, this finding aligns with the benchmark theory of European support and skepticism (De Vries, Reference De Vries2018): low assessments of national democracies, which prevail in southern and eastern European countries, are accompanied by more favorable assessments of EU democracy.
The distribution of respondents over the types by country: percentages.

Explanatory analysis
Factors associated with having an opinion on EU democracy: H1
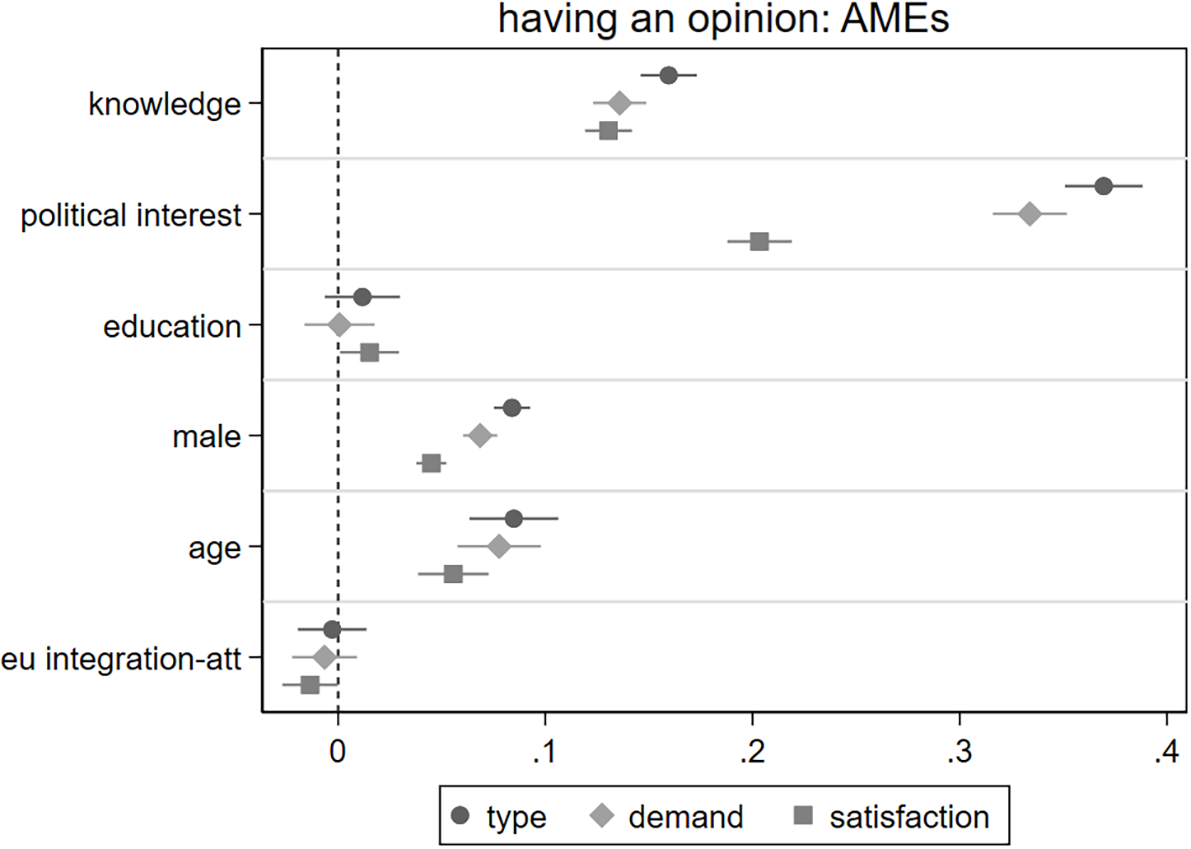
Our first hypotheses concern the group that has no opinion about EU democratization. We have already seen that large shares – approximately one-fifth in terms of our typology – of Europeans have at best a limited understanding of EU democracy. We hypothesized that these individuals are politically uninterested, less educated, and younger (H1a), and have limited knowledge of the EU (H1b). To test these hypotheses, we analyze the determinants of having an opinion: How do those who do not know an answer differ from those who offer an opinion (including the middle position)? We perform this analysis to examine democratic demands and satisfaction, and to create a typology using logit regressions. Figure 4 presents the corresponding results (for details, see Table A1 in the online Appendix).
Factors associated with having an opinion about EU democratization in terms of type, demand, and satisfaction: AMEs (predicted probabilities).
Note: These results are based on logit regressions, which are presented in detail in Table A1 of the online Appendix. The figure displays predicted probabilities and their 95% confidence intervals.

First, we observe that, particularly, political interest and, to a lesser extent, knowledge of European affairs are indeed strong predictors of having an opinion on EU democracy. Political interest increases the probability of belonging to a type (H1a), that is, of having an opinion on both dimensions, by a maximum of 38 percent, the corresponding probability for democratic demand by 34 percent, and democratic satisfaction by 22 percent. In other words, political interest is, above all, instrumental to having an opinion on the desired level of EU democracy, which is in line with the general notion that, at the EU level, opinion about democratic demand is less crystallized than opinion about democratic satisfaction. EU knowledge has a similar effect on all three indicators (H1b), increasing the probability of belonging to a type and having an opinion on demand and satisfaction by between 13 and 15 percent. Compared to these two determinants, the effect of the other predictors is much weaker (gender and age) or nonexistent (education and EU integration attitudes, which we introduced as a control variable). Independent of political interest and knowledge, the level of education does not increase the likelihood of having an opinion about EU democracy.
Factors associated with citizens’ opinions about EU democracy: H2
In the second step of the analysis, we analyze the factors associated with demand for and satisfaction with democracy. Our analysis follows the tripartite structure of Hypothesis 2: we first analyze the two dimensions separately, then turn to the factors associated with the types, and conclude with an analysis of the extent to which these factors’ effects are moderated by knowledge of the EU.
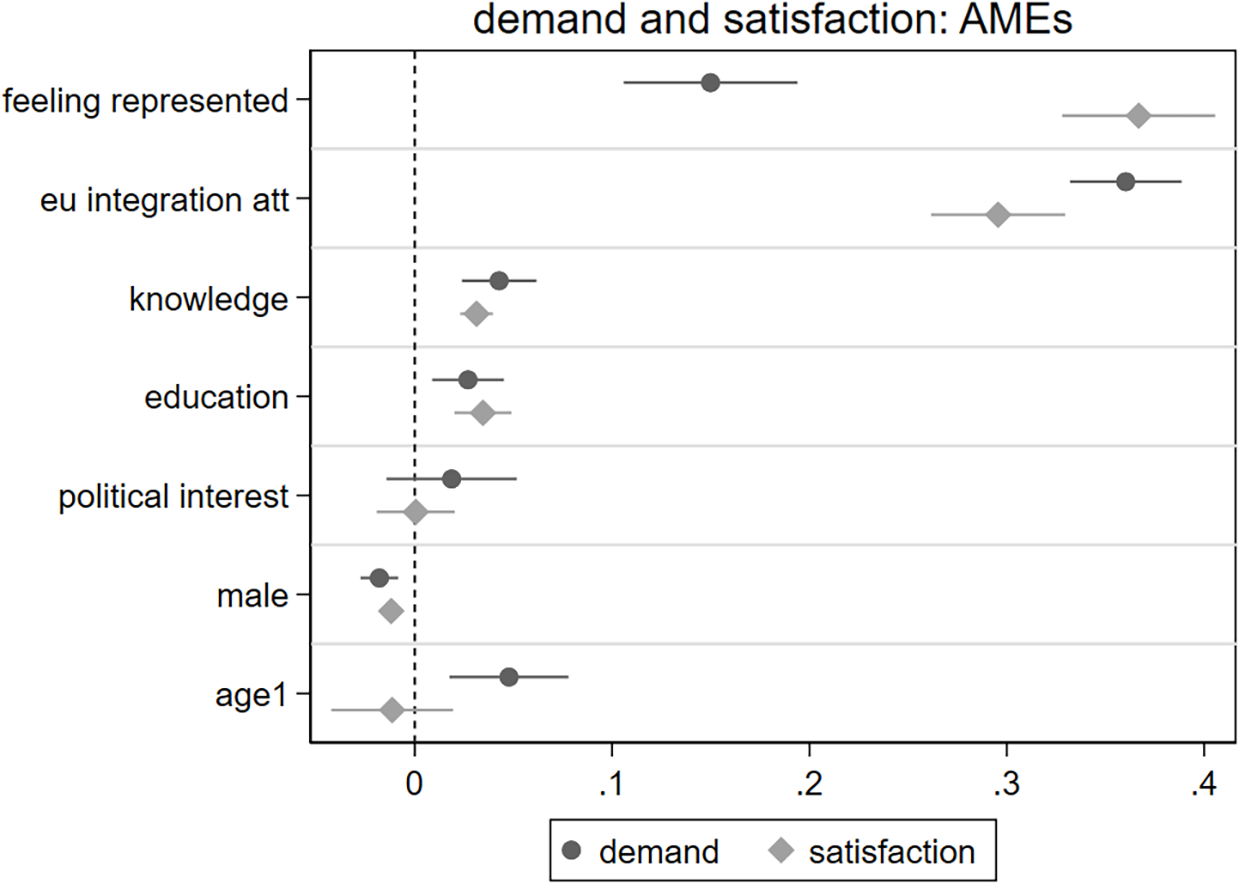
Based on just the sociodemographics (age, gender, education, and political interest) and country fixed effects, we can account for only a small portion of the variation in demand for and satisfaction with EU democracy: the corresponding R-squared values amount to 0.07 for demand and 0.04 for satisfaction. Adding the EU knowledge and the mechanism of feeling represented variables, while controlling for general European integration attitudes, raises the corresponding R2s to .27 for demand and .36 for satisfaction. The greater increase in satisfaction is in line with the fact that Europeans tend to have more crystallized opinions about satisfaction than about demand. As expected, feeling represented has a much stronger effect on satisfaction with, than on demand for, democracy. However, we now observe that the feeling represented has a positive effect on democratic demand as well. The positive mechanisms seem to be stronger than the negative ones. Feeling represented raises satisfaction with democracy by up to 37 percent, whereas it only increases demand for democracy by up to 15 percent. Figure 5 illustrates the corresponding effects, which align with the expected directions (H2a).Footnote 3
Factors associated with demand for and satisfaction with EU democracy: AMEs (predicted probabilities).
Note: These results are based on OLS regressions, which are presented in detail in Table A2 of the online Appendix. The figure displays predicted probabilities and their 95% confidence intervals.

In addition to feeling represented, as expected, general EU integration attitudes are closely associated with both demand for and satisfaction with democracy. The effect of feeling represented is considerably attenuated by the introduction of this control variable: without controlling for general EU integration attitudes (not shown), feeling represented increases demand by up to 26 percent, and satisfaction by up to 46 percent. Otherwise, the control variables are only weakly associated with democratic demand and satisfaction: knowledge has little effect on either, and none of the sociodemographic variables have strong effects.
So far, we have treated demand and satisfaction as independent of each other. Of course, this is an assumption that does not hold as they are reciprocally related (see Kriesi and Saris, Reference Kriesi, Saris, Ferrin and Kriesi2016; Palacios, Reference Palacios, Ferrin and Kriesi2025). As a robustness test, we have estimated a sem-model (see Figure A1 and Table A3 in the Appendix) that accounts for the reciprocal relationship between the two dimensions of democracy. Additional items are introduced as instruments for demand and satisfaction: Trust in the EP, measured by a standard question – “Generally speaking, how much do you personally trust the European Parliament?” – serves as an instrument for satisfaction, and an additional item focusing on the EP – “The European Parliament should be given more powers” – is introduced as an instrument for the demand side. Feeling represented and attitudes toward EU integration are expected to influence both dimensions of attitudes toward EU democracy. With this specification, demand and satisfaction mutually enhance each other, with the effect of satisfaction on demand being much stronger than that of demand on satisfaction.Footnote 4 Those who are satisfied with EU democracy demand more of it, while, to a lesser extent, those who demand more EU democracy are also more satisfied with it. The effect of feeling represented in this specification remains positive for satisfaction, but is greatly attenuated. Its effect on demand becomes contradictory, as discussed in the theory section: Feeling represented enhances demand indirectly via satisfaction, but it directly reduces demand. These contradictory effects on demand almost cancel each other out: on the one hand, feeling represented increases one’s satisfaction with EU democracy, and via the effect of satisfaction on demand, also increases demand for democracy: one wants more of the good thing. On the other hand, feeling represented reduces demand for further democratization; since one feels already represented, one does not ask for more democracy. The effect of the most important control variable – general EU integration attitude – remains positive for both demand and satisfaction, but is greatly attenuated.
Second, having established the interdependence between satisfaction with and demand for EU democracy, we examine the impact of feeling represented on the types. Based on Table A4 in the Appendix, Figure 6 presents the results. As expected (H2b), the feeling of not being represented increases the chance of being a disaffected or (to a lesser extent) an assertive democrat.Footnote 5 The inverse pattern obtains for allegiant and (to a lesser extent) for delegative democrats: feeling represented increases the likelihood of being a delegative or an allegiant democrat. The effects of the major control variable – general EU integration attitudes – are even stronger for disaffected and allegiant democrats.Footnote 6 However, surprisingly, EU integration attitudes have no effect on assertive and delegative democrats. They affect only the polar types. All the other control variables are of secondary importance, except that the politically interested and the knowledgeable are more likely to be among the allegiant democrats.Footnote 7
Factors associated with the types of EU democrats: AMEs (predicted probabilities).
Note: These results are based on multinomial logit regressions, which are presented in detail in Table A4 of the online Appendix. The figure displays predicted probabilities and their 95% confidence intervals.

Figure 6. Long description
Panel A: A scatter plot titled ‘disaffected democrats’ shows factors on the vertical axis and average marginal effects (AMEs) on the horizontal axis. Factors include feeling represented, EU integration attitude, knowledge, education, political interest, male, and age. Panel B: A scatter plot titled ‘assertive democrats’ shows similar factors on the vertical axis and AMEs on the horizontal axis. Panel C: A scatter plot titled ‘delegative democrats’ displays the same factors on the vertical axis and AMEs on the horizontal axis. Panel D: A scatter plot titled ‘allegiant democrats’ presents the same factors on the vertical axis and AMEs on the horizontal axis. Each plot shows data points representing the relationship between the factors and AMEs.
Third, we investigate the interaction effects between EU knowledge and feeling represented on the two dimensions and the types. Figure 7, which is based on Table A2 in the Appendix, presents the interaction effects for the two dimensions. As expected, the effect of feeling represented on demand and satisfaction (H2c) is enhanced by knowledge. The effect is almost twice as strong for demand as for satisfaction.Footnote 8
Interaction effects between EU knowledge and feeling represented on demand and satisfaction with EU democracy: AMEs (predicted scale values).
Note: These results are based on OLS regressions, which are presented in detail in Table A2 of the online appendix. The figure displays predicted scale values and their 95% confidence intervals.

Turning to the interaction effects between knowledge and feeling represented for the types of EU democrats, in line with H2c, we find some significant interactions (Figure 8, based on Table A4 in the Appendix). First, the positive effect of feeling represented on allegiant citizens is enhanced among the better informed: the better citizens are informed, the greater the chance that feeling represented enhances allegiance to EU democracy. In turn, the negative effect of feeling represented on disaffected citizens is also enhanced among the better informed: the better they are informed the greater the chance that not feeling represented enhances disaffection with EU democracy. Third, being well informed marginally decreases the effect of feeling represented on delegative citizens: the better one is informed the lower the chance that feeling represented has an effect on being a delegative citizen. It appears that, above all, delegative citizens with little or no knowledge of the EU are responsible for the negative effect of feeling represented on democratic demand at the EU level. They are quite satisfied with what they get in terms of EU democracy and do not want any more of it. They are happy to delegate decision-making to political elites. Finally, being knowledgeable has no moderating effect among assertive democrats.
Interaction effects between EU knowledge and feeling represented on types of democrats: AMEs (predicted scale values).
Note: These results are based on logit regressions, which are presented in detail in Table A4 of the online Appendix. The figure shows predicted scale values and their 95%-confidence intervals.

Discussion and conclusion
Overall, our findings suggest that EU democracy may be a greater concern for pundits and EU insiders than it is for the general public. A substantial share of Europeans has no, or only vague, ideas about the “democratic deficit” at the EU level. Whether Europeans have an opinion on the democratization of EU politics depends, first and foremost, on their political interest and the extent of their knowledge of EU politics more generally. This may seem obvious, but overall, these two factors have surprisingly limited explanatory power for whether Europeans have an opinion on EU democratization in the first place. We can confirm, however, that limited knowledge among Europeans about EU democracy is important because it suggests they have rather unclear ideas about what they want and what they miss in EU democracy. In line with the idea of a “virtuous circle,” the more you know about the EU, the more coherent your ideas about EU democracy are.
To the extent that they have an opinion about EU democratization, a majority of Europeans are actually satisfied with EU democracy, that is, they are either allegiant or delegative (or “weak”) EU democrats. When citizens are satisfied with EU democracy, they are roughly equally likely to be delegative or allegiant democrats, and when they are dissatisfied, they are more likely to be disaffected democrats who demand less EU democracy. The fact that “weak,” delegative democrats make up more than a quarter of EU citizens, reinforces the overall impression that EU democracy is not a topic at the forefront of the minds of the EU public.
We identified a key mechanism that drives citizens’ opinions about EU democracy: their sense of being represented at the EU level. Together with a set of controls, this factor explains satisfaction with EU democracy quite well (R 2=.36), and even if we do less well for democratic demand, we can still explain one-fourth of its variance (R 2=.27). This confirms that Europeans have clearer ideas about how democracy works in the EU than about how they want it to work. Feeling represented increases demand for and satisfaction with EU democracy. The effect is stronger on satisfaction than on demand, since countervailing considerations attenuate its effect on demand. The effects of feeling represented are reinforced by EU knowledge. In terms of types, feeling represented is most closely associated with the polar types – the allegiant and the disaffected democrats. The assertive and delegative types tend to be cross-pressured on the two dimensions, which makes for somewhat less clear-cut associations with the explanatory factor. As for the controls, pro-Europeans are more satisfied with EU democracy than Eurosceptics, and they demand more EU democracy than Eurosceptics. Accordingly, pro-Europeans are likely to be allegiant democrats, while Eurosceptics are likely to be disaffected democrats.
This article relies on only a limited set of variables, which needs to be expanded to more fully elucidate the factors that account for Europeans’ democratic preferences at the EU level. Further analysis should clarify the reasons for the widespread lack of opinion on EU democracy, particularly regarding democratic demands. In addition, it should clarify what pro-Europeans want in terms of EU democracy. That Eurosceptics, especially the most coherent among them, do not want more of it seems clear. However, what exactly pro-Europeans expect from EU democracy is less clear and requires further study.
Nevertheless, the findings here have important implications for the future trajectory of EU democracy. First and foremost, our results suggest that the “democratic deficit” at the EU level may be a more salient concern for political elites, scholars, and Brussels insiders than for ordinary European citizens. It appears that the question of how to democratize the EU has limited resonance with mass publics.
Second, the predominance of delegative democrats over assertive ones at the EU level suggests that Europeans may be willing to accept, or perhaps even prefer, a different form of democracy at the supranational level than they demand domestically. This pattern points toward what might be called a “differentiated democratic legitimacy,” where citizens expect extensive participation, responsiveness, and accountability from their national governments while simultaneously accepting a more indirect, output-oriented form of democracy at the EU level (Hobolt and Tilley, Reference Hobolt and Tilley2014; Scharpf, Reference Scharpf1999). Whether this represents a stable equilibrium or merely reflects insufficient knowledge and attention to EU politics remains uncertain. The weak explanatory power of our models for predicting who has opinions about EU democracy in the first place, suggests that low engagement with EU democratic questions may result from cognitive constraints imposed by the complexity and remoteness of EU politics rather than principled acceptance of technocratic governance.
Finally, our results point to both opportunities and challenges for the future development of EU democracy. On the one hand, the majority of citizens who hold opinions about EU democracy are satisfied with it. This suggests a degree of democratic resilience and a foundation for further development. On the other hand, the substantial minority of disaffected democrats who are both dissatisfied with EU democracy, and want less of it, represents an unprecedented phenomenon compared to national democracies, where citizens virtually never advocate for restricting democracy. This group, comprising over 15 percent of Europeans, poses a distinctive challenge to democratic deepening at the EU level. Moreover, given that knowledge and political interest, rather than demographic factors, are the primary predictors of having opinions about EU democracy, addressing the knowledge deficit will require active efforts in political communication and education. Whether the current state of limited engagement regarding EU democracy can withstand future crises – be they economic, geopolitical, or institutional – remains an open and crucial question. The answer will likely depend on the EU’s ability to build and maintain institutional trust, to communicate effectively about its democratic character, and to demonstrate responsiveness to citizen concerns even among populations with limited knowledge of its democratic workings.
Supplementary material
The supplementary material for this article can be found at https://doi.org/10.1017/S1755773926100769.
Data availability statement
The data and replication materials supporting the findings of this study will be made publicly available through Harvard Dataverse upon publication.
Acknowledgment
We wish to thank participants at the authors’ workshop “The 2024 European Elections: Crises, Contestation, and Voter-Party Linkages in EU Politics” at the EUI in November 11-12, 2024, and Simon Hix and Daniel Kovarek in particular for feedback. The usual disclaimer applies.
Financial support
This paper was supported by the European Research Council, g.n. 810356, project Policy Crisis and Crisis Politics. Sovereignty, Solidarity and Identity in the EU post 2008–SOLID.
Competing interests
There are no competing financial or non-financial interests to be disclosed for any of the three authors.
Ethical standards
The survey was administered by YouGov in accordance with established ethical standards for survey research. Participation was voluntary, respondents provided informed consent, and all data were anonymized before being made available to the researchers.
Use of AI
The authors declare that no generative artificial intelligence tools were used in the preparation of this manuscript.




 Open access

