


Social media summary
Gender gaps in preferences for good financial resources, and age gaps, vary according to levels of endorsement of restrictive gender norms.
Introduction
Choosing a partner with whom to form a romantic relationship, and potentially raise children, is an important life decision, and researchers have been interested in whether men and women place emphasis on different characteristics when making those choices (Mogilski & Shachelford, Reference Mogilski and Shackelford2023; Simpson & Campbell, Reference Simpson and Campbell2013). Researchers have also been interested in whether such preferences differ between cultural groups. For example, in a landmark study led by Buss (Reference Buss1989), participants (N = ∼10k from 37 cultural groups) were provided with a list of eighteen characteristics and were asked to rate the importance of each characteristic when choosing a potential partner and rank them in order of priority; on average, women placed greater emphasis than men on characteristics associated with the ability to provide resources, whereas men placed greater emphasis than women on the physical characteristics of a potential partner (Buss et al., Reference Buss, Abbott, Angleitner, Asherian, Biaggio, Blanco-villasenor, Bruchon-schweitzer, Ch’u, Czapinski, Deraad, Ekehammar, El Lohamy, Fioravanti, Georgas, Gjerde, Guttman, Hazan, Iwawaki, Janakiramaiah and Yang1990). Differences in men’s and women’s self-reported partner preferences have been replicated in subsequent studies (e.g., Khallad, Reference Khallad2005; Lippa, Reference Lippa2007; Schwarz & Hassebrauck, Reference Schwarz and Hassebrauck2012; Wareham et al., Reference Wareham, Pákozdy and Brown2024), and evolutionary psychologists have interpreted these findings in terms of gender differences in the evolved psychological mechanisms that are assumed to underpin universal mating strategies (e.g., Buss, Reference Buss1989, Reference Buss1994; Buss & Schmitt, Reference Buss and Schmitt2019).
However, in the dataset collected by Buss et al. (Reference Buss, Abbott, Angleitner, Asherian, Biaggio, Blanco-villasenor, Bruchon-schweitzer, Ch’u, Czapinski, Deraad, Ekehammar, El Lohamy, Fioravanti, Georgas, Gjerde, Guttman, Hazan, Iwawaki, Janakiramaiah and Yang1990), partner preferences exhibited substantial cross-cultural variability, as noted by the original authors; for example, the importance placed on ‘chastity’ was high in some countries and low in others, and the ratings of other characteristics (e.g., ‘desire for home and children’) also varied across populations. Eagly and Wood (Reference Eagly and Wood1999) argued that societal structures can shape partner preferences, and they specifically predicted that the difference in the importance that men and women place on the resource-acquisition ability of a partner would be smaller in countries with higher levels of gender equality. This prediction was based on the assumption that women in these countries would be less dependent on a romantic partner for their financial security. Eagly and Wood (Reference Eagly and Wood1999) reanalysed the dataset collected by Buss et al. (Reference Buss, Abbott, Angleitner, Asherian, Biaggio, Blanco-villasenor, Bruchon-schweitzer, Ch’u, Czapinski, Deraad, Ekehammar, El Lohamy, Fioravanti, Georgas, Gjerde, Guttman, Hazan, Iwawaki, Janakiramaiah and Yang1990) and confirmed that the gender gap in ranked preference for resource-providing abilities (i.e., preference for a partner with ‘good financial prospects’) was smaller in countries with higher levels of gender equality. These researchers proposed a biosocial model that linked gendered partner preferences with societal structures and social norms, such as gendered divisions of labour (Eagly & Wood, Reference Eagly and Wood1999; Wood & Eagly, Reference Wood and Eagly2002, Reference Wood and Eagly2012).
Inconsistent findings
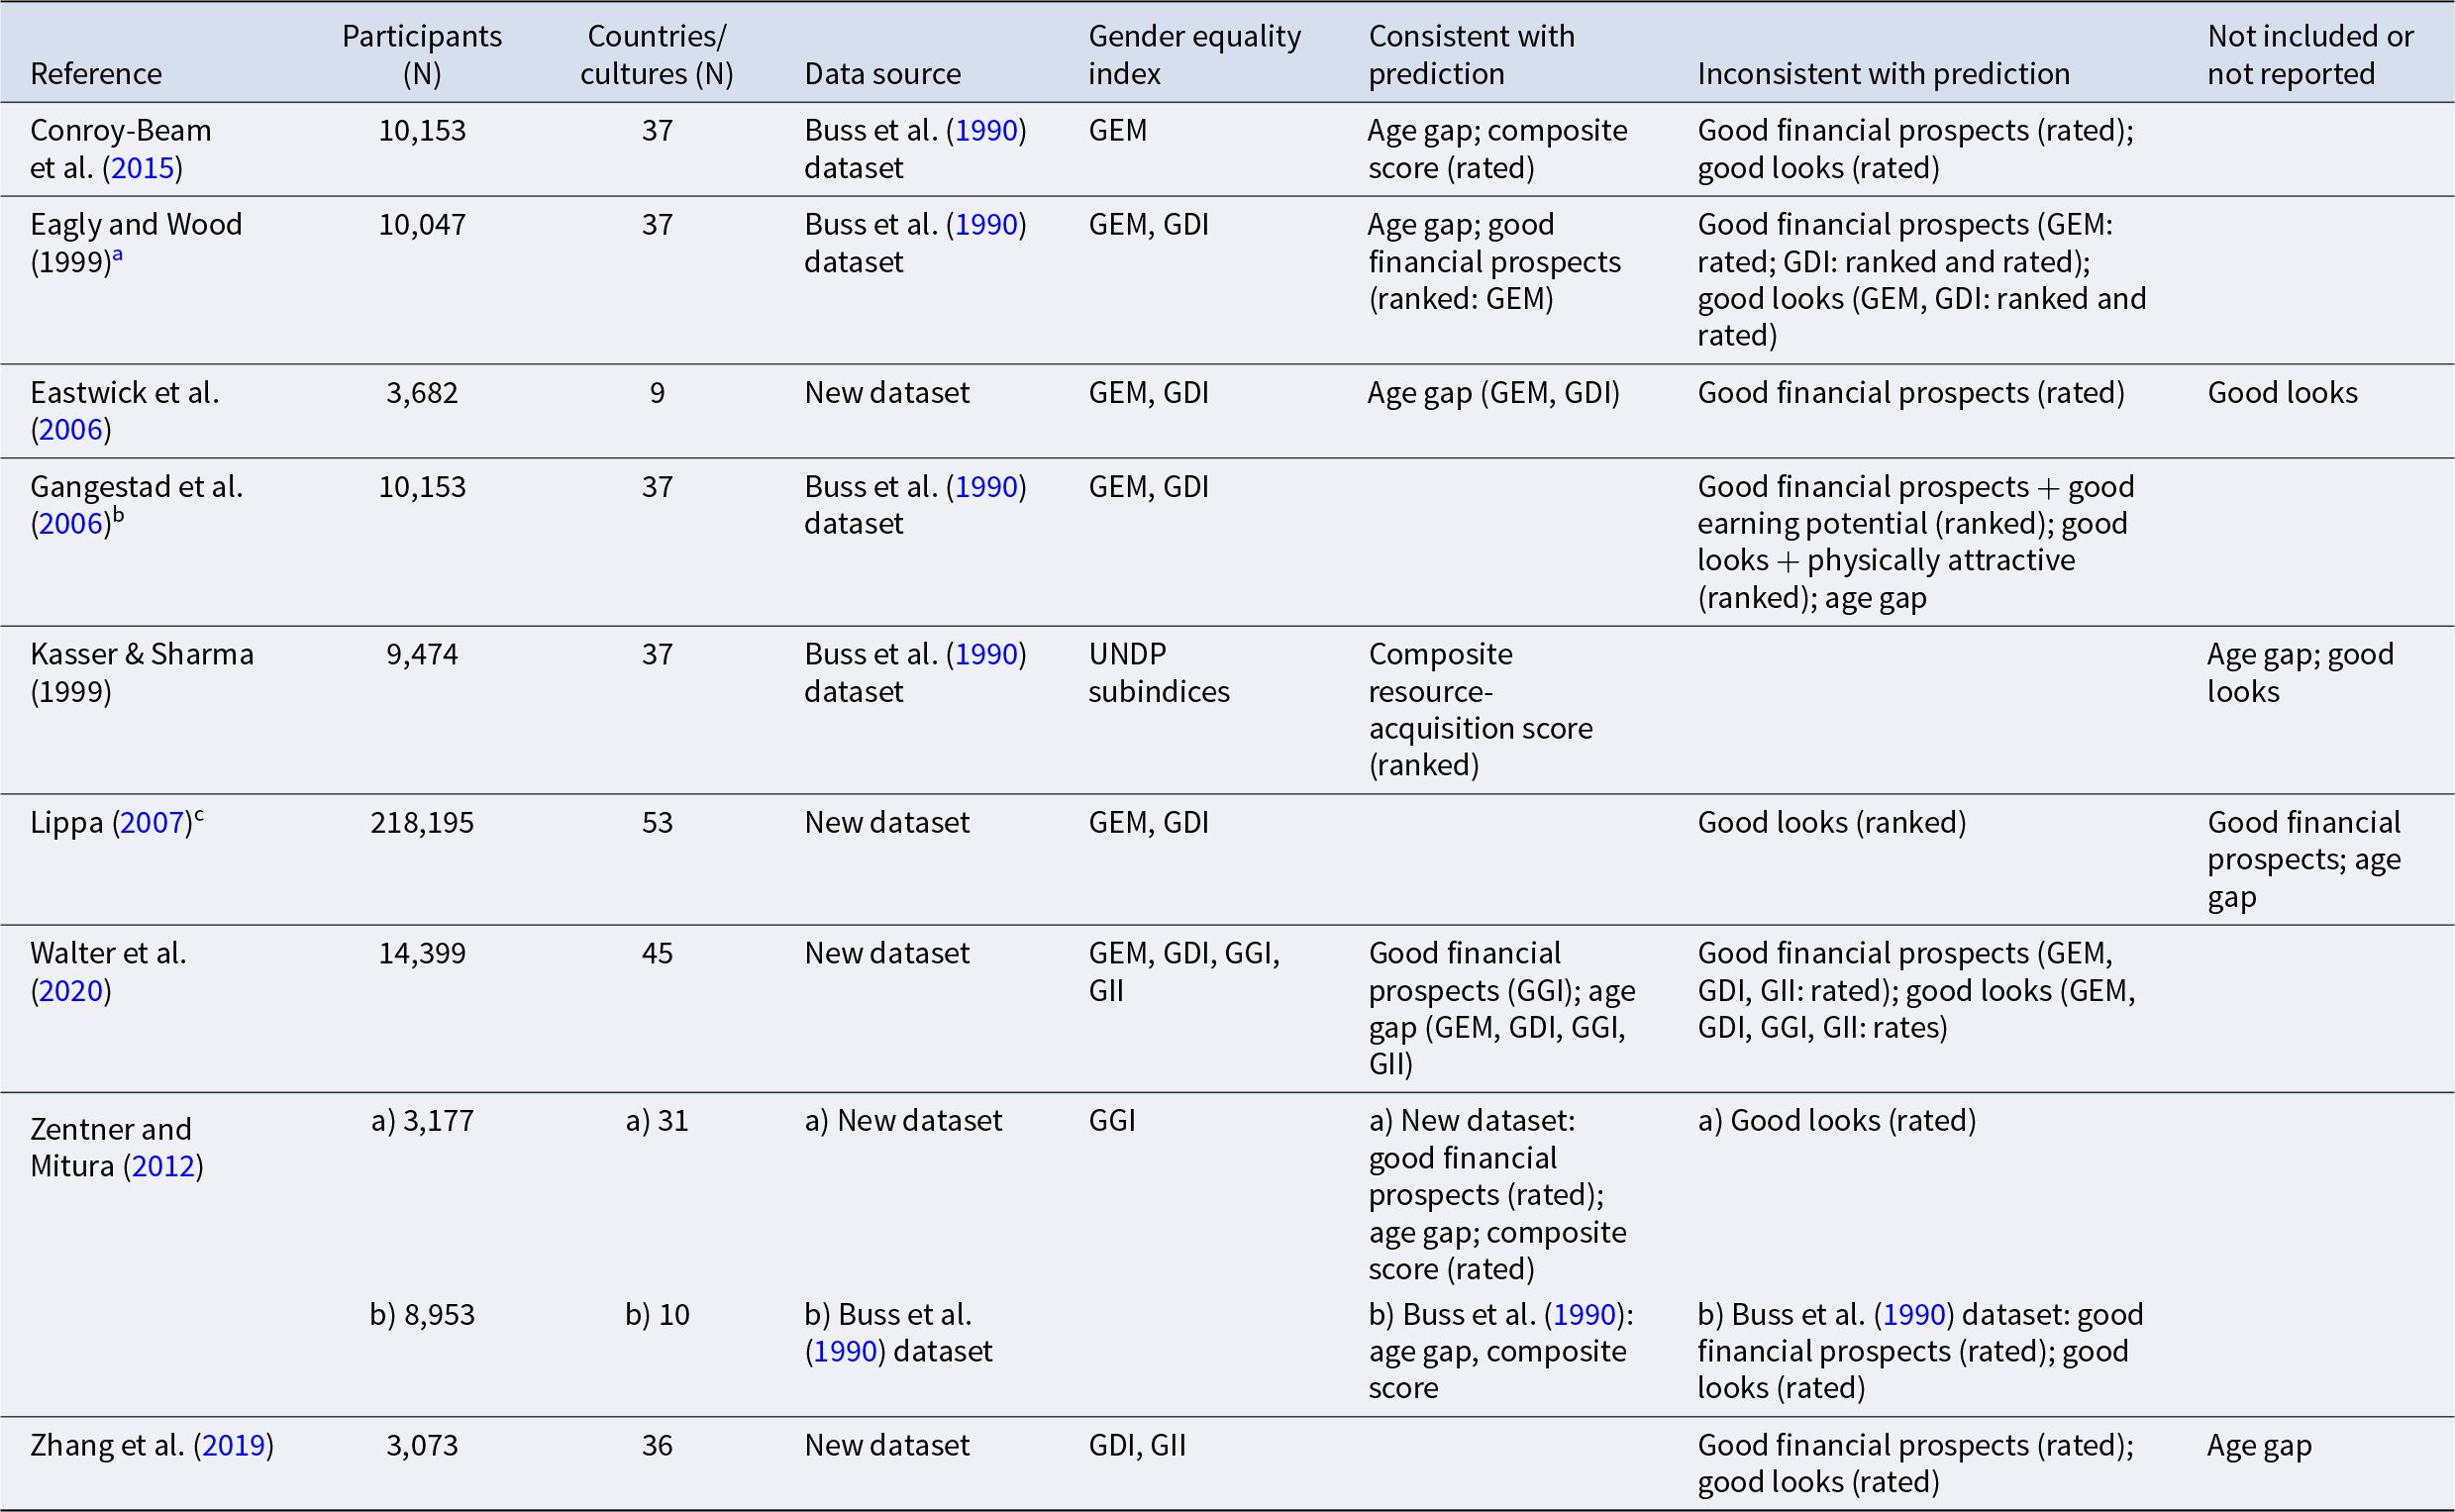
Debates on this topic have been hampered by inconsistent evidence for a link between national levels of gender equality and gender gaps in partner preferences (Table 1). For example, the reanalysis by Eagly and Wood (Reference Eagly and Wood1999) revealed that, as predicted, the gender gap in preference for a partner with ‘good financial prospects’ was negatively correlated with national gender equality for ranked partner preference scores (i.e., when participants ordered the desirability of traits relative to each other), but not for rated scores (i.e., when participants scored the importance of each trait independently), and the correlation only reached significance for one gender equality index (Gender Empowerment Measure [GEM]) and not for an alternative one (Gender-related Development Index [GDI]). In the same year, Kasser and Sharma (Reference Kasser and Sharma1999) also reanalysed Buss’ dataset and reported that the size of the gender gap in a composite, resource-acquisition score (consisting of mean rankings for ‘good financial prospects’, ‘ambition and industriousness’, and ‘favourable social status’) was smaller in countries with greater gender equality, measured using several, specific estimates (e.g., educational equality). Similarly, subsequent re-analyses of this dataset reported that gender gaps in composite scores that incorporated different combinations of rated partner traits correlated negatively with gender equality (Conroy-Beam et al., Reference Conroy-Beam, Buss, Pham and Shackelford2015; Zentner & Mitura, Reference Zentner and Mitura2012), whereas the gender gap in preference for ‘good financial prospects’ did not by itself (Conroy-Beam et al., Reference Conroy-Beam, Buss, Pham and Shackelford2015; Gangestad et al., Reference Gangestad, Haselton and Buss2006; Zentner & Mitura, Reference Zentner and Mitura2012). Thus, the findings appear to be sensitive to which measures were used.
Summary of previous studies on the relationships between gender gaps in partner preferences for three key characteristics, namely good financial prospects, good looks (physical attractiveness) and preferred age gap, and national gender equality indices (GDI: Gender-Related Development Index; GEM: Gender Empowerment Measure; GGI: Gender Gap Index; GII: Gender Inequality Index; UNDP: United Nations Development Programme), including whether or not the findings were consistent with the prediction that the gender gap would be smaller in countries with higher gender equality

Table 1 Long description
Prior studies are compared on whether gender differences in mate preferences shrink in more gender-equal countries, using national indices such as GEM, GDI, GGI, and GII. Each row lists the study, participant count, number of countries or cultures, whether data came from the Buss 1990 cross-national dataset or a new dataset, and which preference gaps matched, contradicted, or were not reported relative to the prediction. Age-gap findings most often align with the prediction: Conroy-Beam 2015, Eastwick 2006, Walter 2020, and Zentner and Mitura 2012 report age-gap results consistent with higher equality relating to smaller gaps, though some studies report age gap as inconsistent or not included. Results for good looks are frequently inconsistent with the prediction, including Eagly and Wood 1999, Lippa 2007, Walter 2020, Zentner and Mitura 2012, and Zhang 2019; Eastwick 2006 did not include looks. Findings for good financial prospects are mixed: some support appears in Eagly and Wood 1999 for ranked measures with GEM and in Walter 2020 for GGI, but multiple studies report inconsistent results for rated measures, including Conroy-Beam 2015, Eastwick 2006, Walter 2020, Zentner and Mitura 2012, and Zhang 2019. Composite measures sometimes support the prediction, such as Conroy-Beam 2015 and Kasser and Sharma 1999, and Zentner and Mitura 2012 for one dataset. Sample sizes and country coverage vary widely, from several thousand participants in nine countries to over two hundred thousand participants in fifty-three countries, and some outcomes are missing or depend on whether preferences were ranked or rated, limiting direct comparability across studies.
a Total sample size is assumed to be the same as Buss (Reference Buss1989).
b Ranked scores were presumably used in the analyses, as the article mentions characteristics that were not included in the list of rated characteristics.
c The sample size for these specific analyses could not be extracted from the article and is likely to be much smaller than the total sample stated here.
Rather than re-analysing the dataset collected by Buss et al. (Reference Buss, Abbott, Angleitner, Asherian, Biaggio, Blanco-villasenor, Bruchon-schweitzer, Ch’u, Czapinski, Deraad, Ekehammar, El Lohamy, Fioravanti, Georgas, Gjerde, Guttman, Hazan, Iwawaki, Janakiramaiah and Yang1990), other researchers collected new partner preference datasets, although sample sizes have typically been smaller (i.e., <10k participants) than in the original study by Buss et al. (Reference Buss, Abbott, Angleitner, Asherian, Biaggio, Blanco-villasenor, Bruchon-schweitzer, Ch’u, Czapinski, Deraad, Ekehammar, El Lohamy, Fioravanti, Georgas, Gjerde, Guttman, Hazan, Iwawaki, Janakiramaiah and Yang1990); in general, these studies have not found a significant correlation between gender gaps in preference for resource-acquiring characteristics and national gender equality (Eastwick et al., Reference Eastwick, Eagly, Glick, Johannesen-schmidt, Fiske, Blum, Eckes, Freiburger, Huang, Fernández, Manganelli, Pek, Castro, Sakalli-ugurlu, Six-materna and Volpato2006; Zhang et al., Reference Zhang, Lee, DeBruine and Jones2019) or have failed to include these partner characteristics in their analyses (Lippa, Reference Lippa2007). However, in their new dataset, Zentner and Mitura (Reference Zentner and Mitura2012) reported that the gender gap in preference for ‘good financial prospects’ was smaller in countries with higher levels of gender equality, measured using the Gender Gap Index (GGI) (N = ∼3k participants, 31 countries). Walter et al. (Reference Walter, Conroy-Beam, Buss, Asao, Sorokowska, Sorokowski, Aavik, Akello, Alhabahba, Alm, Amjad, Anjum, Atama, Duyar, Ayebare, Batres, Bendixen, Bensafia, Bizumic and Zupančič2020) also reported that this relationship reached significance in their new, larger dataset when using the GGI (N = ∼14k participants, 45 countries), but not when using alternative gender equality indices (including the GEM and GDI), suggesting that the robustness of this finding is sensitive to the choice of gender equality measure. The GGI includes national-level gender ratios of school enrolment and literacy, in addition to typical measures of women’s economic participation and political empowerment, which could mean that the GGI is more directly indicative than other indices of the opportunities that girls/women envisage for themselves in these societies.
Inconsistencies have also been found between different partner characteristics. For example, several studies have reported that the size of the gap between men’s and women’s age preferences is smaller in countries with higher gender equality across multiple gender equality indices (GEM: Conroy-Beam et al., Reference Conroy-Beam, Buss, Pham and Shackelford2015; Eastwick et al., Reference Eastwick, Eagly, Glick, Johannesen-schmidt, Fiske, Blum, Eckes, Freiburger, Huang, Fernández, Manganelli, Pek, Castro, Sakalli-ugurlu, Six-materna and Volpato2006; Walter et al., Reference Walter, Conroy-Beam, Buss, Asao, Sorokowska, Sorokowski, Aavik, Akello, Alhabahba, Alm, Amjad, Anjum, Atama, Duyar, Ayebare, Batres, Bendixen, Bensafia, Bizumic and Zupančič2020; GGI: Walter et al., Reference Walter, Conroy-Beam, Buss, Asao, Sorokowska, Sorokowski, Aavik, Akello, Alhabahba, Alm, Amjad, Anjum, Atama, Duyar, Ayebare, Batres, Bendixen, Bensafia, Bizumic and Zupančič2020; Zentner & Mitura, Reference Zentner and Mitura2012); on average, women commonly state that they prefer an older partner relative to their own age, whereas men state a preference for a younger partner (e.g., Buss et al., Reference Buss, Abbott, Angleitner, Asherian, Biaggio, Blanco-villasenor, Bruchon-schweitzer, Ch’u, Czapinski, Deraad, Ekehammar, El Lohamy, Fioravanti, Georgas, Gjerde, Guttman, Hazan, Iwawaki, Janakiramaiah and Yang1990; Wareham et al., Reference Wareham, Pákozdy and Brown2024), and this gender difference in preferred age gap has been reported in countries with relatively high levels of gender equality (e.g., Norway: Grøntvedt & Kennair, Reference Grøntvedt and Kennair2013). In contrast, for the physical attractiveness of potential partners, previous cross-cultural studies have consistently failed to find a significant relationship between the gender gap in the importance placed on this characteristic and national levels of gender equality (Conroy-Beam et al., Reference Conroy-Beam, Buss, Pham and Shackelford2015; Eagly & Wood, Reference Eagly and Wood1999; Gangestad et al., Reference Gangestad, Haselton and Buss2006; Walter et al., Reference Walter, Conroy-Beam, Buss, Asao, Sorokowska, Sorokowski, Aavik, Akello, Alhabahba, Alm, Amjad, Anjum, Atama, Duyar, Ayebare, Batres, Bendixen, Bensafia, Bizumic and Zupančič2020; Zhang et al., Reference Zhang, Lee, DeBruine and Jones2019). Eagly and Wood (Reference Eagly and Wood1999) argued that this non-significant result might reflect the stereotyped association between physical attractiveness and other traits that are universally valued, such as social competence or sexual warmth, although this explanation failed to convince critics (Gangestad et al., Reference Gangestad, Haselton and Buss2006). We return to the inconsistent patterns between partner characteristics later.
Current study
Here, we examined the relationship between gender equality and gender gaps in partner preferences using a direct measure of the strength of endorsement of restrictive gender norms within a society (i.e., the implicit or explicit gender-related rules or expectations that can direct the behaviour of individuals that encounter those norms), rather than using standard gender equality indices that focus on variables such as women’s economic participation rates and political empowerment. We extracted country-level data from the Gender Social Norms Index (GSNI) (UNDP, 2023), which is a subset of the World Values Survey (WVS) that asks participants about their attitudes, values and beliefs. The statements in the GSNI ask whether men and women should have equal opportunities within the spheres of economics, politics and education (e.g., whether they should have an equal right to work and higher education and are both suited to leadership positions), and whether women should have physical autonomy and safety (e.g., access to reproductive healthcare). GSNI scores indicate the percentage of individuals within a population who agree with these statements. Thus, in contrast to standard gender equality indices, where high scores denoted high levels of equality, high GSNI scores denote that a large proportion of the population endorses restrictive gender norms, i.e., unequal opportunities and differential autonomy. The GSNI correlates moderately, but not fully, with the GGI in a negative direction (−0.65; Campbell et al., Reference Campbell, Bann and Patalay2021), and it has the advantage of measuring gender role attitudes by directly asking individuals about their views, rather than relying on derived, secondary estimates of social gender norms.
We examined whether national GSNI scores correlated with gender gaps in partner preferences, using the recent, open-access dataset generated by Walter et al. (Reference Walter, Conroy-Beam, Buss, Asao, Sorokowska, Sorokowski, Aavik, Akello, Alhabahba, Alm, Amjad, Anjum, Atama, Duyar, Ayebare, Batres, Bendixen, Bensafia, Bizumic and Zupančič2020). This study collected data on the importance that participants placed on ‘good financial prospects’, ‘physical attractiveness’, ‘intelligence’, ‘health’, and ‘kindness’ of potential partners, as well as data on inferred age preferences, and the largest gender gaps were found in preferences for ‘good financial prospects’, ‘physical attractiveness’ and the size of the age gap. We predicted that gender gaps in preferences for these three characteristics would be smaller in countries with more restrictive gender norms (i.e., higher GSNI scores), and no directional predictions were made for ‘intelligence’, ‘health’, or ‘kindness’. To examine whether the restrictiveness of social norms in general, rather than gender norms specifically, correlated with gender gaps in partner preferences, we repeated the analyses using national levels of cultural tightness, which is defined as the strictness of cultural norms and the harshness of punishments for norm violations (Gelfand et al., Reference Gelfand, Raver, Nishii, Leslie, Lun, Lim, Duan, Almaliach, Ang, Arnadottir, Aycan, Bohnke, Boski, Cabencinhas, Chan, Chhokar, D’amato, Ferrer, Fischlmayr and Yamaguchi2011). To account for non-independence of nations, we examined the effects of controlling for cultural closeness, operationalised as spatial proximity and language similarity, using Bayesian techniques (Claessens et al., Reference Claessens, Kyritsis and Atkinson2023), as well as gross domestic product (GDP) per capita as an index of economic development. Previous studies on this topic have typically failed to control for cultural closeness (e.g., Eagly & Wood, Reference Eagly and Wood1999) or have used simpler estimates of closeness, such as geographical region or latitude from the equator (e.g., Zentner & Mitura, Reference Zentner and Mitura2012; Zhang et al., Reference Zhang, Lee, DeBruine and Jones2019). Thus, our study design had several strengths over previous studies, namely using a direct measure of gender norm attitudes, examining the effects of cultural tightness, and controlling for the non-independence of nations using a recently validated method.
Methods
The analysis scripts for this research are publicly available (https://osf.io/ycweh/).
Measures
i) Partner preference dataset
We used the open-access, individual-level dataset collected by Walter et al. (Reference Walter, Conroy-Beam, Buss, Asao, Sorokowska, Sorokowski, Aavik, Akello, Alhabahba, Alm, Amjad, Anjum, Atama, Duyar, Ayebare, Batres, Bendixen, Bensafia, Bizumic and Zupančič2020), which consists of data from 14,399 participants (7,909 women, i.e., 54.9%; age: mean ± SD = 28.8 yrs ± 10.6) from forty-five countries. This dataset was chosen on the basis that it was the largest open-access dataset available from the previous studies that we reviewed on this topic (Table 1). Sample sizes per country ranged from 92 participants (Indonesia) to 1061 participants (Türkiye) (mean ± SD = 320.0 ± 197.8, median = 260). In brief, Walter et al. (Reference Walter, Conroy-Beam, Buss, Asao, Sorokowska, Sorokowski, Aavik, Akello, Alhabahba, Alm, Amjad, Anjum, Atama, Duyar, Ayebare, Batres, Bendixen, Bensafia, Bizumic and Zupančič2020) asked participants to rate the importance of five characteristics when choosing a partner for a long-term romantic relationship, using a 7-point Likert scale (where high scores denote strong preference for the characteristic): ‘good financial prospects’, ‘physical attractiveness’, ‘intelligence’, ‘health’, and ‘kindness’. Participants also reported their own age and their current partner’s age (years), and these values were converted to an absolute ‘age gap’ score (i.e., women’s age gap = partner’s age minus own age; men’s age gap = own age minus partner’s age); the difference between men’s and women’s mean ‘age gap’ scores was used an estimate of gender differences in age gap preferences.
The number of countries included in each analysis depended on the availability of relevant national-level data (i.e., GSNI and cultural tightness scores), as described in the relevant sections below, and on the removal of outliers (see ‘Statistical analyses’ section). Sample sizes tended to be smaller for age-related analyses, as 38.1% of participants reported that they were not in a relationship, or did not report their partner’s age, and were treated as missing data points. In addition, 3.3% reported an implausibly low partner age (values less than ‘10’) perhaps due misunderstandings or issues with translation of this question; the data from three specific countries (Türkiye, Malaysia, and Peru) were removed due to concerns about this specific issue (for Türkiye, 23% of participants who reported being in relationship reported their partner’s age as less than ‘10’; for Malaysia, 57% of participants who reported being in a relationship reported ‘0’ as their partner’s age; for Peru, 10% of participants who reported being in relationship reported their partner’s age as less than ‘10’), which meant that only 0.2% in the remaining sample reported an implausibly low partner age, and these individual participants were classified as missing data points (as in Walter et al., Reference Walter, Conroy-Beam, Buss, Asao, Sorokowska, Sorokowski, Aavik, Akello, Alhabahba, Alm, Amjad, Anjum, Atama, Duyar, Ayebare, Batres, Bendixen, Bensafia, Bizumic and Zupančič2020).
ii) Gender Social Norms Index (GSNI)
The GSNI was compiled by the United Nations Development Programme (UNDP (United Nations Development Programme), 2023) and consists of responses to seven items from three waves of the WVS (2005–09; 2010–14; 2017–22). These items asked participants whether they endorse statements about gender norms that relate to: i) economics (i.e., ‘Men should have more right to a job than women’, ‘Men make better business executives than women do’), ii) politics (i.e., ‘Men make better political leaders than women do’, ‘Women have the same rights as men’), iii) education (i.e., ‘University is more important for a man than for a woman’), and iv) physical autonomy (i.e., ‘Abortion is never justified’, ‘It is justifiable for a man to beat his wife’). GSNI data are available as country-level scores, not individual-level responses. The specific GSNI measure used in the current study denotes the percentage of participants in the sample from a specific country who endorsed at least two of these statements (i.e., GSNI2, henceforth GSNI), where GSNI scores range from 8.7% of participants (New Zealand) to 98.5% of participants (Pakistan) (mean ± SD = 63.5% ± 26.8%, median = 71.7%). An acceptable degree of non-invariance has been demonstrated for a subset of gender norm statements from the WVS using alignment optimisation methods (Lomazzi, Reference Lomazzi2018).
Consistent with previous evidence (e.g., Campbell et al., Reference Campbell, Bann and Patalay2021), we confirmed that the GSNI correlates moderately, but variably, with standard gender equality indices, including the GEM, GDI and GGI (Table S1 in Supplementary Material; magnitudes of r range from 0.563 to 0.842). As GSNI scores were unavailable for nine countries that were included in the partner preference dataset, our analyses were maximally conducted on partner preference data from thirty-six countries (N = 12,050; 55.2% women) (Table S2). As age gap data were unavailable for an additional four countries (Bulgaria, Jordan, Uruguay, Vietnam) and were excluded for three countries (Türkiye, Malaysia, and Peru), the age-related analyses were maximally conducted on the subset of twenty-nine countries (Table S2). Given that the GSNI scores were not available for five European countries that were included in the partner preference dataset, we repeated the study using a combined dataset on gender norms extracted from the WVS and European Value Survey (2017–22) (Study 2 in Supplementary Material); any deviations in findings between the two studies, which are minimal, are described in the Discussion.
iii) Cultural tightness
Country-level scores for cultural tightness were extracted from a published dataset that consists of responses from 22,863 participants (52.5% women) across fifty-seven countries (Eriksson et al., Reference Eriksson, Strimling, Gelfand, Wu, Abernathy, Akotia, Aldashev, Andersson, Andrighetto, Anum, Arikan, Aycan, Bagherian, Barrera, Basnight-brown, Batkeyev, Belaus, Berezina, Björnstjerna and Van Lange2021). In brief, Eriksson et al. (Reference Eriksson, Strimling, Gelfand, Wu, Abernathy, Akotia, Aldashev, Andersson, Andrighetto, Anum, Arikan, Aycan, Bagherian, Barrera, Basnight-brown, Batkeyev, Belaus, Berezina, Björnstjerna and Van Lange2021) asked participants to state their agreement with six items related to social norms (e.g., ‘There are many social norms that people are supposed to abide by in this country’, ‘People in this country almost always comply with social norms’). This scale has been cross-validated against other relevant measures (Uz, Reference Uz2018). As cultural tightness scores were unavailable for fifteen countries that were included in the partner preference dataset, our analyses were maximally conducted on partner preference data from thirty countries (N = 10,091, 56.2% women) (Table S3). As age gap data were unavailable or excluded for an additional six countries (see section above), the age-related analyses were maximally conducted on a subset of twenty-four countries (Table S3).
Statistical analyses
All analyses were conducted in R, and continuous variables were standardised using z-scores. Univariate multilevel models were used to generate main effects of gender and social norm indices (i.e., GSNI and the cultural tightness score) and interaction terms between gender and social norms for each partner preference characteristic (gender coded as 0 = women, 1 = men), using lme4 with derivative-free BOBYQA optimiser (Bates et al., Reference Bates, Mächler, Bolker and Walker2015). Random intercepts for country and random slopes for gender were included in all models, and outliers were identified for each analysis using a standard approach (i.e., data points that were 1.5 times the interquartile range either above the upper quartile or below the lower quartile) (details of outliers are provided in the table legends for Tables S2 and S3). As the random effects in the multilevel model accounted for individual-level variation, outlier removal was conducted at the country level (i.e., if either men’s or women’s country-level mean was flagged as an outlier for a specific trait, data for that country were removed). Where interaction terms were significant, simple slopes were calculated separately for men’s and women’s scores. To examine the effects of including control variables, we ran Bayesian multilevel models, developed by Claessens et al. (Reference Claessens, Kyritsis and Atkinson2023), that included GDP (values extracted from Walter et al., Reference Walter, Conroy-Beam, Buss, Asao, Sorokowska, Sorokowski, Aavik, Akello, Alhabahba, Alm, Amjad, Anjum, Atama, Duyar, Ayebare, Batres, Bendixen, Bensafia, Bizumic and Zupančič2020), spatial proximity and linguistic similarity; in brief, the models were fitted to the data using the brms package that interfaces with Stan in R (Bürkner, Reference Bürkner2017), with weakly informative priors used for the intercept and coefficients, and all parameters showed good convergence (Rhat ∼1).
Results
Gender gaps in partner preferences
As in the original study (Walter et al., Reference Walter, Conroy-Beam, Buss, Asao, Sorokowska, Sorokowski, Aavik, Akello, Alhabahba, Alm, Amjad, Anjum, Atama, Duyar, Ayebare, Batres, Bendixen, Bensafia, Bizumic and Zupančič2020), our analyses confirmed the significant main effects of gender for all partner characteristics (Table S4). In summary, men rated ‘physical attractiveness’ as being more important, on average, than women, whereas women had higher average ratings than men for ‘good financial prospects’, ‘intelligence’, ‘health’, and ‘kindness’, and the difference between men’s and women’s ‘age gap’ scores was significant and negative, demonstrating that, for all countries combined, men preferred a larger age gap than did women.
Gender norms and partner preferences
a) Good financial prospects: Preference scores for ‘good financial prospects’ were higher in countries with higher GSNI scores (i.e., more restrictive gender norms) (b = 0.17, SE = 0.03, p < .001; Table 2, Fig. 1a), and the interaction between GSNI scores and gender was also significant (b = −0.07, SE = 0.03, p = 0.011; Table 2, Fig. 2a). Simple slopes revealed a significant, positive relationship for both women’s scores (b = 0.17, SE = 0.03, p < .001) and men’s scores (b = 0.09, SE = 0.04, p = .023; Fig. 1a). The main effect remained credibly different from zero when including for GDP, spatial proximity and linguistic similarly (Table S5), and the interaction effect also remained when controlling for these variables, except for linguistic similarity (β = −0.06, 95% CI [−0.14, 0.02]; Table S5).
b) Physical attractiveness: The main effect of GSNI was non-significant for ‘physical attractiveness’ (b = 0.04, SE = 0.04, p = .302; Table 2, Fig. 1b), and the interaction between GSNI scores and gender was also non-significant for this partner characteristic (b = −0.04, SE = 0.03, p = .225; Table 2, Fig. 2b).
c) Intelligence: The main effect of GSNI was non-significant for ‘intelligence’ (b = 0.02, SE = 0.04, p = 0.682; Table 2, Fig. 1c), and the interaction between GSNI scores and gender was also non-significant for this partner characteristic (b = −0.01, SE = 0.03, p = 0.661; Table 2, Fig. 2c).
d) Health: Preference scores for ‘health’ were higher in countries with higher GSNI scores (b = 0.10, SE = 0.04, p = 0.010; Table 2, Fig. 1d), whereas the interaction between GSNI scores and gender was non-significant (b = −0.04, SE = 0.03, p = 0.178; Table 2, Fig. 2d). The main effect remained credibly different from zero when controlling for spatial proximity (Table S5), although not when controlling for GDP (β = 0.07, 95% CI [−0.04, 0.18]) or linguistic similarity (β = 0.09, 95% CI [0.00, 0.18]).
e) Kindness: Preference scores for ‘kindness’ were lower in countries with higher GSNI scores (b = −0.09, SE = 0.04, p = 0.031; Table 2, Fig. 1e). The interaction effect was non-significant (b = 0.03, SE = 0.03, p = 0.201; Table 2, Fig. 2e). The main effect no longer remained credibly different from zero when controlling for GDP (β = −0.08, 95% CI [−0.21, 0.04]), spatial proximity (β = −0.07, 95% CI [−0.14, 0.01]) or linguistic similarity (β = −0.05, 95% CI [−0.14, 0.05]; Table S5).
f) Age gap: The main effect of GSNI was significant for absolute ‘age gap’ (b = 0.05, SE = 0.02, p = .035; Table 2; Fig. 1f), meaning that the average age gap was larger in countries with more restrictive gender norms. The interaction between GSNI and gender was non-significant (b = 0.02, SE = 0.02, p = .384; Table 2; Fig. 2f). The main effect remained credibly different from zero when including the control variables, except for GDP (β = 0.01, 95% CI [−0.07, 0.08]; Table S5).
Figure 1.Country-level GSNI scores (where high GSNI scores indicate that a higher percentage of individuals in that country endorse restrictive gender norms) and mean partner preference scores separated by gender (women = green circles; men = blue triangles) for a) ‘good financial prospects’, b) ‘physical attractiveness’, c) ‘intelligence’, d) ‘health’, e) ‘kindness’, and f) ‘age gap’ (i.e., partner age minus own age for both women and men for visualisation purposes only). Asterisks denote significance of the main effects of gender, GSNI and the interaction between gender and GSNI; no asterisk indicates a non-significant effect, and age gap results are based on the absolute size of the age gap (as described in Methods). *p < .05, **p < .01, ***p < .001.

Figure 1 Long description
Six scatter plots comparing Gender Social Norm Index (GSNI) with various partner preferences and age gap. Each plot uses circles for women and triangles for men. Plot A shows preference for good financial prospects. The x-axis is labeled Gender Social Norm Index, ranging from 0 to 100 and the y-axis is labeled Preference for Good Financial Prospects, ranging from 4.5 to 6.5. Both lines slope upward, indicating increased preference with higher GSNI. Plot B shows preference for physical attractiveness. The x-axis is Gender Social Norm Index and the y-axis is Preference for Physical Attractiveness, both with the same ranges as Plot A. The lines show a slight upward trend, with women’s preference increasing more steeply. Plot C shows preference for intelligence. The axes are the same as previous plots. The lines are nearly horizontal, indicating little change in preference with GSNI. Plot D shows preference for health. The axes are consistent with previous plots. Both lines slope upward, showing increased preference with higher GSNI. Plot E shows preference for kindness. The axes remain the same. Both lines slope downward, indicating decreased preference with higher GSNI. Plot F shows age gap. The x-axis is Gender Social Norm Index and the y-axis is Age Gap, ranging from negative 6 to positive 6. The dashed line at y equals 0 serves as a reference. The line for women is above zero and slopes upward, while the line for men is below zero and slopes downward, indicating a positive age gap for women and negative for men. Overall, preferences for financial prospects, physical attractiveness and health increase with higher GSNI, while kindness decreases. The age gap shows opposite trends for women and men. Statistical significance is indicated by asterisks: for p<0.001, for p<0.01, for p<0.05.
Figure 2.Country-level GSNI scores (where high GSNI scores indicate that a higher percentage of individuals in that country endorse restrictive gender norms) and differences between men’s and women’s mean partner preference scores (i.e., men’s mean score minus women’s mean score for each country) for a) ‘good financial prospects’, b) ‘physical attractiveness’, c) ‘intelligence’, d) ‘health’, e) ‘kindness’, and f) ‘age gap’.
Figure 2 Long description
Scatter plot A with the horizontal axis labeled Gender Social Norm Index, ranging from 0 to 100. The vertical axis is labeled Pref. for Good Fin. Prosp. (Diff.), ranging from negative 1.0 to 1.0. A horizontal dashed reference line is drawn at 0. A fitted line slopes downward across the plot. Scatter plot B with the horizontal axis labeled Gender Social Norm Index, ranging from 0 to 100. The vertical axis is labeled Pref. for Physical Attrac. (Diff.), ranging from negative 1.0 to 1.0. A horizontal dashed reference line is drawn at 0. A fitted line slopes downward across the plot. Scatter plot C with the horizontal axis labeled Gender Social Norm Index, ranging from 0 to 100. The vertical axis is labeled Pref. for Intelligence (Diff.), ranging from negative 1.0 to 1.0. A horizontal dashed reference line is drawn at 0. A fitted line is nearly horizontal with a slight upward slope. Scatter plot D with the horizontal axis labeled Gender Social Norm Index, ranging from 0 to 100. The vertical axis is labeled Pref. for Health (Diff.), ranging from negative 1.0 to 1.0. A horizontal dashed reference line is drawn at 0. A fitted line slopes downward across the plot. Scatter plot E with the horizontal axis labeled Gender Social Norm Index, ranging from 0 to 100. The vertical axis is labeled Pref. for Kindness (Diff.), ranging from negative 1.0 to 1.0. A horizontal dashed reference line is drawn at 0. A fitted line slopes upward across the plot. Scatter plot F with the horizontal axis labeled Gender Social Norm Index, ranging from 0 to 100. The vertical axis is labeled Pref. for Age Gap (Diff.), ranging from negative 4 to 4. A horizontal dashed reference line is drawn at 0. A fitted line slopes upward across the plot.
Table 2.Multilevel models for strength of gender norms: main effect of GSNI, and interaction between GSNI and gender, for each partner characteristic. Random intercepts for country and random slopes for gender were included in all models. After removal of outliers, n = 36 for each model except n = 29 for the age gap. No additional control variables were included in the reported models
Table 2 Long description
Multilevel regression results link the strength of gender norms (GSNI) to how much people value specific partner characteristics, and test whether this link differs by gender. Higher GSNI is associated with placing more importance on good financial prospects (b 0.17, SE 0.03, p less than.001) and health (b 0.10, SE 0.04, p 0.010), and with a small increase in preference for an age gap (b 0.05, SE 0.02, p 0.035). Higher GSNI is associated with placing less importance on kindness (b minus 0.09, SE 0.04, p 0.031). Physical attractiveness and intelligence show no clear GSNI association (p 0.302 and p 0.803). For gender interactions, only good financial prospects shows a statistically reliable interaction (b minus 0.07, SE 0.03, p 0.011), while interactions for the other characteristics are not statistically reliable. Sample size is 36 for most models and 29 for the age-gap model, and results are from models with country random intercepts and gender random slopes, without additional covariates.
* p < .05, **p < .01, ***p < .001.


Cultural tightness and partner preferences
As in the previous analyses, the main effects of gender were significant for all partner characteristics (data not shown for brevity; for main effects of cultural tightness and interactions with gender, see Figures S1 and S2).
a) Good financial prospects: Neither the main effect of cultural tightness (b = 0.09, SE = 0.05, p = 0.078), nor the interaction between cultural tightness and gender (b = −0.02, SE = 0.04, p = 0.653), was significant for ‘good financial prospects’.
b) Physical attractiveness: Neither the main effect of cultural tightness (b = 0.06, SE = 0.04, p = 0.134), nor the interaction between cultural tightness and gender (b = −0.05, SE = 0.04, p = 0.199), was significant for ‘physical attractiveness’.
c) Intelligence: Neither the main effect of cultural tightness (b = −0.04, SE = 0.04, p = 0.279), nor the interaction between cultural tightness and gender (b = 0.02, SE = 0.03, p = 0.609), was significant for ‘intelligence’.
d) Health: Neither the main effect of cultural tightness (b = 0.05, SE = 0.04, p = 0.247), nor the interaction between cultural tightness and gender (b = −0.03, SE = 0.03, p = 0.279), was significant for ‘health’.
e) Kindness: Neither the main effect of cultural tightness (b = −0.003, SE = 0.05, p = 0.946), nor the interaction between cultural tightness and gender (b = 0.02, SE = 0.03, p = 0.572), was significant for ‘kindness’.
f) Age gap: Neither the main effect of cultural tightness (b = 0.02, SE = 0.03, p = 0. 415), nor the interaction between cultural tightness and gender (b = 0.00, SE = 0.02, p = 0.857), was significant for ‘age gap’.
Discussion
This study provides evidence that gender gaps in preference for some partner characteristics are larger in countries with more restrictive gender norms. More specifically, the analyses showed that the gender gap in preference for a partner with good financial prospects was larger in countries with more restrictive gender norms, and the difference between own age and partner age followed the same pattern. For all other partner characteristics that were available in the open-access dataset (Walter et al., Reference Walter, Conroy-Beam, Buss, Asao, Sorokowska, Sorokowski, Aavik, Akello, Alhabahba, Alm, Amjad, Anjum, Atama, Duyar, Ayebare, Batres, Bendixen, Bensafia, Bizumic and Zupančič2020), the interaction effects were not significant, although, on average, for both men and women, preferences for health were higher, and preferences for kindness were lower, in countries with more restrictive gender norms. The results also revealed that none of the gender gaps in partner preferences were correlated with national levels of cultural tightness, which suggests that the findings specifically relate to gender norms. While these findings are consistent with the hypothesis that societal norms about men’s and women’s roles influence gendered partner preferences (Eagly & Wood, Reference Eagly and Wood1999; Wood & Eagly, Reference Wood and Eagly2002, Reference Wood and Eagly2012), the results also provide evidence of some relatively stable gender gaps in preferences across populations and raise questions about the variability of effects across different partner characteristics.
Gender gaps in partner preferences
One of our key findings was that, on average, the gender gap in preference for a partner with good financial prospects was larger in countries with more restrictive gender norms. In their original analyses, Walter et al. (Reference Walter, Conroy-Beam, Buss, Asao, Sorokowska, Sorokowski, Aavik, Akello, Alhabahba, Alm, Amjad, Anjum, Atama, Duyar, Ayebare, Batres, Bendixen, Bensafia, Bizumic and Zupančič2020) similarly reported that the gender gap in preference for good financial prospects was larger in countries with lower gender equality when estimated using the GGI. Longitudinal datasets have provided evidence that the importance placed on the financial prospects of potential partners varies over time within populations; for example, data from the US have indicated that the gender gap in preference for a partner with good financial prospects has narrowed in line with an increase in women’s labour force participation across decades (Boxer et al., Reference Boxer, Noonan and Whelan2015). Alongside experimental evidence that preference for a partner with resources is sensitive to the perceived harshness or unpredictability of the environment (e.g., Burtăverde & Ene, Reference Burtăverde and Ene2021; Lammers & Imhoff, Reference Lammers and Imhoff2021), these results collectively suggest that the importance placed on good financial prospects is sensitive to local social norms and gendered social structures. While Walter et al. (Reference Walter, Conroy-Beam, Buss, Asao, Sorokowska, Sorokowski, Aavik, Akello, Alhabahba, Alm, Amjad, Anjum, Atama, Duyar, Ayebare, Batres, Bendixen, Bensafia, Bizumic and Zupančič2020) did not present separate correlations for men and women for each partner characteristic, in our analyses, men, as well as women, placed greater importance on a partner’s good financial prospects in countries with more restrictive, compared to less restrictive, gender norms, and the interaction was robust to the inclusion of GDP. It is possible that, where men are expected to take on the burden of providing for their families, they favour partners with good financial prospects to partially mitigate these expectations. Future studies could investigate how preferences for a partner with financial resources are sensitive to more specific aspects of gender roles and expectations.
In contrast, the gender gap in the importance placed on the physical attractiveness of a potential partner did not correlate with the restrictiveness of gender norms in the current study, and, similarly, gender gaps in preference for physical attractiveness do not appear to be related to national levels of gender equality (e.g., Eagly & Wood, Reference Eagly and Wood1999; Walter et al., Reference Walter, Conroy-Beam, Buss, Asao, Sorokowska, Sorokowski, Aavik, Akello, Alhabahba, Alm, Amjad, Anjum, Atama, Duyar, Ayebare, Batres, Bendixen, Bensafia, Bizumic and Zupančič2020; Zentner & Mitura, Reference Zentner and Mitura2012). Eagly and Wood (Reference Eagly and Wood1999) suggested that the apparently universal gender gap in the importance placed on physical attractiveness could reflect the association between this characteristic and sexual arousal, which would be consistent with evidence for men’s higher average sex drive (e.g., Frankenbach et al., Reference Frankenbach, Weber, Loschelder, Kilger and Friese2022). Alternatively, this finding could potentially reflect a trade-off between the importance placed by men on different partner characteristics; specifically, more restrictive gender norms were associated with men placing more importance on the youthfulness, health, and financial prospects of partners compared to men in countries with less restrictive gender norms, rather than being associated with greater importance being placed on physical attractiveness per se. However, the term ‘physically attractive’ might simply be a phrase that is stereotypically associated with being a woman across a broad range of populations. Future studies could investigate how participants across cultural groups interpret this term and respond to related concepts of attraction. In a study of US participants, men placed greater emphasis than women on a partner being slender and good-looking, but men and women placed similar importance on a potential partner being physically attractive to them (Fales et al., Reference Fales, Frederick, Garcia, Gildersleeve, Haselton and Fisher2016), which suggests that asking participants about the importance of physical attractiveness only addresses one aspect of sexual attraction.
Rather than finding a correlation between gender gaps in preferences for health, kindness and intelligence and the restrictiveness of gender norms, our results revealed contrasting main effects of gender norms on preferences for health and kindness. On average, individuals in countries with more restrictive gender norms placed greater emphasis on a potential partner’s health, whereas they placed less importance on a partner’s kindness. The effects were similar for both men and women. One possible reason could be that health may carry greater practical value in countries with restrictive gender roles, potentially due to the physical demands of economic and household contribution. However, this effect became non-significant when controlling for GDP, suggesting that the correlation between health preference and restrictive gender norms could be partially impacted by the accessibility of medical resources, which is likely to be related to economic development. In contrast, kindness, which is likely to be related to emotional warmth and intimacy, might be rated as more important by both men and women in more egalitarian societies where intimacy and mutual reciprocity are considered important components of a relationship (Sorokowski et al., Reference Sorokowski, Kowal, Sternberg, Aavik, Akello, Alhabahba, Alm, Amjad, Anjum, Asao, Atama, Duyar, Ayebare, Conroy-Beam, Bendixen, Bensafia, Bizumic, Boussena, Buss and Sorokowska2023). However, this effect was not robust to controlling for cultural closeness in the current dataset, which suggests that kindness and other emotional concepts could be sensitive to numerous factors, including subjective interpretations and cultural contexts.
In the current study, women were, on average, younger than their partners in all countries, and the size of the age gap between an individual and their partner was larger, on average, in countries with more restrictive gender norms. Unfortunately, the data represented age gaps in actual relationships, rather than ideal preferences, which explains why the raw age gap data were distributed roughly symmetrically around zero for men versus women. Thus, an interaction between gender and GSNI scores was not expected to be found (i.e., men’s and women’s stated age gaps were likely to vary in line with each other, assuming that the data reflected a closed, heterosexual population). Previous studies that have asked participants to state their ideal age gap preference, rather than the actual age gap with their partner, have similarly reported that the size of preferred age gap correlates negatively with national levels of gender equality in using a multiple indices, including the GGI (GEM: Conroy-Beam et al., Reference Conroy-Beam, Buss, Pham and Shackelford2015; GGI: Zentner & Mitura, Reference Zentner and Mitura2012), which suggests that this specific finding is relatively robust to study design. Other datasets have also reported that age gaps between spouses decrease within populations over time in line with greater economic development and longer lengths of time spent in formal education (e.g., Durowaa-Boateng & Kebede, Reference Durowaa-Boateng and Kebede2025; Van Poppel et al., Reference Van Poppel, Liefbroer, Vermunt and Smeenk2001). Collectively, these results suggest that age gap preferences are malleable and sensitive to environmental and social parameters, including gender norms.
Limitations and future directions
The datasets used in our analyses have additional limitations. The partner preference dataset collected by Walter et al. (Reference Walter, Conroy-Beam, Buss, Asao, Sorokowska, Sorokowski, Aavik, Akello, Alhabahba, Alm, Amjad, Anjum, Atama, Duyar, Ayebare, Batres, Bendixen, Bensafia, Bizumic and Zupančič2020) included a prescribed number of countries (N = 45) with a limited geographical range (e.g., relatively few African countries) and varied sample sizes across countries, and, as mentioned, the age-related data were based on actual partnerships. GSNI and cultural tightness scores were unfortunately not available for all countries included in this partner preference dataset. To examine whether the specific selection of countries might have impacted the findings, we conducted a second study that extracted gender norm scores from a combination of the WVS and European Values Survey, thus allowing a slightly different sub-set of partner preference data to be included in the analyses (Supplementary material); all of the main findings were upheld, with the only exception being that the interaction between GSNI and gender for ‘good financial prospects’ was reduced when controlling for spatial proximity and linguistic similarity, rather than only linguistic similarity. As the dataset collected by Walter et al. (Reference Walter, Conroy-Beam, Buss, Asao, Sorokowska, Sorokowski, Aavik, Akello, Alhabahba, Alm, Amjad, Anjum, Atama, Duyar, Ayebare, Batres, Bendixen, Bensafia, Bizumic and Zupančič2020) included clusters of countries with similar languages (e.g., Brazil, Mexico, Portugal, Spain), evidence for the non-independence of data points is not unexpected. Given that biased representation is commonly found (e.g., over half of nations and cultural groups included in the dataset collected by Buss et al. (Reference Buss, Abbott, Angleitner, Asherian, Biaggio, Blanco-villasenor, Bruchon-schweitzer, Ch’u, Czapinski, Deraad, Ekehammar, El Lohamy, Fioravanti, Georgas, Gjerde, Guttman, Hazan, Iwawaki, Janakiramaiah and Yang1990) were European or North American: Eagly & Wood, Reference Eagly and Wood1999), future studies on partner preferences should aim for much broader geographical representation. Such studies should also continue to take into account the non-independence of national-level data points through approaches such as the Bayesian framework devised by Claessens et al. (Reference Claessens, Kyritsis and Atkinson2023) that was implemented here.
Conclusions
This study has demonstrated that gender gaps in some partner preferences vary according to the level of endorsement of restrictive gender norms, whereas other gender gaps appear to be more stable across populations. Evolutionary Psychologists have reasoned that evolved partner preferences might be context-specific and responsive to relevant cues in local environments (e.g., Gangestad et al., Reference Gangestad, Haselton and Buss2006; Gangestad & Simpson, Reference Gangestad and Simpson2000; Schmitt, Reference Schmitt and Buss2023), which means that such accounts could potentially acknowledge sociocultural factors without rejecting the core assumption that men and women differ in their evolved psychologies. However, proponents of biosocial models have questioned whether the universality of partner preferences, including predictable context-specific strategies, requires explanations based on domain-specific processing in the human brain (Eagly & Wood, Reference Eagly and Wood1999; Wood & Eagly, Reference Wood and Eagly2012). In fact, given that universal preferences could also be constructed across individual lifespans via consistent socialisation patterns or life history parameters, evidence of cross-cultural consistency in partner preferences does not provide clarity on whether such preferences are underpinned by evolved psychological mechanisms. For instance, age gaps, which were present even in countries with less restrictive gender norms, could reflect gendered aspects of human life histories (e.g., relative sexual maturation rates and reproductive lifespans), without being underpinned by predefined, domain-specific psychological mechanisms that might generate such preferences. While cross-cultural datasets can certainly provide insights into the diversity of human behaviour (Brown et al., Reference Brown, Dickins, Sear and Laland2011), the debates about the evolutionary and biosocial underpinnings of partner preferences would benefit from greater clarity on what might constitute evidence for evolved psychological mechanisms and why predictions for cross-cultural variability might differ between partner characteristics.
Supplementary material
The supplementary material for this article can be found at https://doi.org/10.1017/ehs.2026.10065.
Data Availability Statement
All of the primary used in this study are available open access: a) the partner preference dataset published by Walter et al. (Reference Walter, Conroy-Beam, Buss, Asao, Sorokowska, Sorokowski, Aavik, Akello, Alhabahba, Alm, Amjad, Anjum, Atama, Duyar, Ayebare, Batres, Bendixen, Bensafia, Bizumic and Zupančič2020), including GDP scores, can be accessed via the Open Science Framework (https://osf.io/gb5cn/); b) the Gender Social Norms Index (GSNI) data are available via the Human Development Reports website (2023 Gender Social Norms Index (GSNI) | Human Development Reports); c) the cultural tightness dataset published by Eriksson et al. (Reference Eriksson, Strimling, Gelfand, Wu, Abernathy, Akotia, Aldashev, Andersson, Andrighetto, Anum, Arikan, Aycan, Bagherian, Barrera, Basnight-brown, Batkeyev, Belaus, Berezina, Björnstjerna and Van Lange2021) can be accessed via the Open Science Framework (https://osf.io/pm5kc/); and d) the spatial proximity and linguistic similarity scores were obtained from the repository developed by Claessens et al. (Reference Claessens, Kyritsis and Atkinson2023) (https://github.com/ScottClaessens/crossNationalCorrelations).
Acknowledgements
The authors would like to thank Scott Claessens for statistical advice and the anonymous reviewers for constructive feedback on an earlier version.
Author contributions
J.X. and G.B. conceived and designed the study; J.X. conducted data gathering and statistical analyses; J.X. and G.B. wrote the article.
Financial support
J.X. was funded by a China Scholarship Council PhD scholarship.
Competing interests
The authors declare no conflicts of interest.


 Open access

