





Introduction
Smallholder crop production in sub-Saharan Africa (SSA) is dominated by maize (Zea mays L.), which provides more than 30% of food calories in the region (Erenstein et al., Reference Erenstein, Jaleta, Sonder, Mottaleb and Prasanna2022; Smale, Reference Smale1995). Maize is also important for livestock feeding in SSA (Valbuena et al., Reference Valbuena, Erenstein, Tui, Abdoulaye, Claessens, Duncan, Gérard, Rufino, Teufel and van Rooyen2012; Kaushal et al., Reference Kaushal, Sharma, Vaidya, Gupta, Saini, Anand, Thakur, Verma, Thakur and Priyanka2023). Demand is expected to rise as the population increases. In Zimbabwe, about 90% of smallholder farmers produce maize under rain-fed conditions, contributing almost 60% of national maize grain requirements (Chiturike et al., Reference Chiturike, Gotosa, Nyakudya, Madamombe, Mandumbu, Chirinda, Kugedera and Nyamadzawo2024; FAO, 2020). However, maize productivity in SSA remains very low, with average grain yields less than 1100 kg ha−1, far below expected optimum levels of 8000–15,000 kg ha−1 that can be achieved under good agronomic practices (Chekole and Ahmed, Reference Chekole and Ahmed2023; Van Ittersum et al., Reference Van Ittersum, Van Bussel, Wolf, Grassini, Van Wart, Guilpart, Claessens, De Groot, Wiebe and Mason-D’Croz2016).
Low maize productivity in smallholder systems and large yield gaps are due to several factors such as erratic rainfall (Cairns et al., Reference Cairns, Hellin, Sonder, Araus, MacRobert, Thierfelder and Prasanna2013; Silva et al., Reference Silva, Baudron, Ngoma, Nyagumbo, Simutowe, Kalala, Habeenzu, Mphatso and Thierfelder2023), declining soil fertility (Imran et al., Reference Imran, Ortas and Benkeblia2022; Vanlauwe et al., Reference Vanlauwe, Descheemaeker, Giller, Huising, Merckx, Nziguheba, Wendt and Zingore2015), weeds, pests, and diseases (Benjamin et al., Reference Benjamin, Idowu, Babalola, Oziegbe, Oyedokun, Akinyemi and Adebayo2024; Kaur and Verma, Reference Kaur and Verma2016), and poor agronomic practices such as monocropping (Chekole and Ahmed, Reference Chekole and Ahmed2023; Thierfelder et al., Reference Thierfelder, Matemba-Mutasa and Rusinamhodzi2015). Sustainable intensification strategies are thus essential for improving productivity in smallholder maize systems (Kassam et al., Reference Kassam, Friedrich and Derpsch2019; Thierfelder et al., Reference Thierfelder, Baudron, Setimela, Nyagumbo, Mupangwa, Mhlanga, Lee and Gérard2018, Reference Thierfelder, Mhlanga, Nyagumbo, Kalala, Simutowe, Chiduwa, MacLaren, Silva and Ngoma2024; Tufa et al., Reference Tufa, Kanyamuka, Alene, Ngoma, Marenya, Thierfelder, Banda and Chikoye2023). Conservation agriculture (CA) is one approach, based on minimum soil disturbance, mulching, and crop diversification. CA leads to reduced soil erosion and to improved soil moisture retention, soil organic matter(SOM) and soil biodiversity, and to increased productivity over time (Kassam et al., Reference Kassam, Friedrich and Derpsch2019; Shrestha et al., Reference Shrestha, Subedi, Timsina, Chaudhary, Kandel and Tripathi2020; Thierfelder, Reference Thierfelder, Dang, Dalal and Menzies2020).
The crop diversification pillar of CA can improve crop productivity by reducing both biotic and abiotic stress within cropping systems (Chadfield et al., Reference Chadfield, Hartley and Redeker2022; Cruz-López et al., Reference Cruz-López, Granados-Echegoyen, Pérez-Pacheco, Robles, Álvarez-Lopeztello, Morales, Bastidas-Orrego, García-Pérez, Dorantes-Jiménez and Landero-Valenzuela2024). In SSA, maize is sometimes intercropped or rotated with multipurpose legumes such as cowpea (Vigna unguiculata L. Walp.), groundnut (Arachis hypogea L.), or common beans (Phaseolus vulgaris L.) (Mupangwa et al., Reference Mupangwa, Nyagumbo, Liben, Chipindu, Craufurd and Mkuhlani2021; Thierfelder et al., Reference Thierfelder, Mhlanga, Nyagumbo, Kalala, Simutowe, Chiduwa, MacLaren, Silva and Ngoma2024). The inclusion of multipurpose legumes contributes to food, feed, and nutrition security in smallholder maize-based farming systems (Mupangwa et al., Reference Mupangwa, Nyagumbo, Liben, Chipindu, Craufurd and Mkuhlani2021). In particular, legumes provide considerable amounts of calories and protein for both food and feed (Thierfelder et al., Reference Thierfelder, Mhlanga, Nyagumbo, Kalala, Simutowe, Chiduwa, MacLaren, Silva and Ngoma2024), can spread crop production risks when compared to sole maize (Mwila et al., Reference Mwila, Mhlanga and Thierfelder2021; Snapp et al., Reference Snapp, Grabowski, Chikowo, Smith, Anders, Sirrine, Chimonyo and Bekunda2018), and can contribute to soil nitrogen availability through biological nitrogen fixation (BNF; Vanlauwe et al., Reference Vanlauwe, Hungria, Kanampiu and Giller2019).
Cowpea is an especially important multipurpose legume in Zimbabwe and across SSA (Chikowo et al., Reference Chikowo, Mapfumo, Nyamugafata and Giller2004; Thierfelder et al., Reference Thierfelder, Cheesman and Rusinamhodzi2012). Cowpea provides leaves, green pods, and grain for human consumption, while its residues offer quality fodder for livestock and help to return organic material to the soil (Gonçalves et al., Reference Gonçalves, Goufo, Barros, Domínguez-Perles, Trindade, Rosa, Ferreira and Rodrigues2016; Smith et al., Reference Smith, Rouquette and DeLaune2020). Another versatile crop, pigeon pea (Cajanus cajan L.), is popular in countries including Malawi, Mozambique, Kenya, Tanzania, and Uganda (Mashifane et al., Reference Mashifane, Chiulele and Gwata2024; Uloh et al., Reference Uloh, Ede, Onyeke and Bar-Anyam2023), where it is mainly grown for its grain and its contribution to soil health improvement, while its woody stems are sometimes used as fuelwood (Jeevarathinam and Chelladurai, Reference Jeevarathinam, Chelladurai, Manickavasagan and Thirunathan2020). Pigeon pea has a deep taproot that accesses moisture and nutrients from deeper soil layers (Henderson, Reference Henderson, Chen and Byrne2023; Mugi-Ngenga et al., Reference Mugi-Ngenga, Bastiaans, Anten, Zingore, Baijukya and Giller2023), and it is valued for its adaptability to low soil fertility and drought (Mashifane et al., Reference Mashifane, Chiulele and Gwata2024; Senkoro et al., Reference Senkoro, Marandu, Ley and Wortmann2017). However, pigeon pea is currently not widely grown in Zimbabwe (Musokwa and Chavhunduka, Reference Musokwa, Chavhunduka, Nciizah, Roopnarain, Ndaba and Malobane2024), despite previous research indicating that it could make an important contribution to soil fertility in marginal environments (Mapfumo et al., Reference Mapfumo, Mafongoya and Mpepereki2004; Mapfumo, Reference Mapfumo, K., Mpepereki and Mafongoya1999).
Cowpea is generally shorter in stature and growth duration than pigeon pea, and produces less biomass, but its fast growth can contribute to weed suppression (Masvaya et al., Reference Masvaya, Nyamangara, Descheemaeker and Giller2017; Singh et al., Reference Singh, Ajeigbe, Tarawali, Fernandez-Rivera and Abubakar2003). In contrast, the initially slow growth rate of pigeon pea may enhance its compatibility with maize when intercropped (Ayenan et al., Reference Ayenan, Ofori, Ahoton and Danquah2017). These differences between cowpea and pigeon pea could significantly influence their performance and interactions with maize in mixed cropping systems.
Several studies in Southern and Eastern Africa have explored the diversification of maize-based systems for smallholder farmers (Kinyua et al., Reference Kinyua, Kihara, Bekunda, Bolo, Mairura, Fischer and Mucheru-Muna2023; Madembo et al., Reference Madembo, Mhlanga and Thierfelder2020), but no clear consensus has yet emerged on optimal crop combinations or layouts (Mwila et al., Reference Mwila, Silva, Kalala, Simutowe, Ngoma, Nyagumbo, Mataa and Thierfelder2024; Thierfelder et al., Reference Thierfelder, Mhlanga, Nyagumbo, Kalala, Simutowe, Chiduwa, MacLaren, Silva and Ngoma2024). There is extensive evidence that both rotations and intercrops can improve food production or resource use efficiency for smallholder farmers (Daryanto et al., Reference Daryanto, Fu, Zhao, Wang, Jacinthe and Wang2020; Franke et al., Reference Franke, Van den Brand, Vanlauwe and Giller2018), including those with pigeon pea and cowpea (Musokwa and Chavhunduka, Reference Musokwa, Chavhunduka, Nciizah, Roopnarain, Ndaba and Malobane2024; Thierfelder et al., Reference Thierfelder, Cheesman and Rusinamhodzi2012). Strip cropping, a form of intercropping that comprises alternating strips of multiple rows of different crops, has shown benefits in Zambia and Ghana, leading to improved yields and farmer incomes (Rahman et al., Reference Rahman, Larbi, Kotu, Asante, Akakpo, Mellon-Bedi and Hoeschle-Zeledon2021). In Zimbabwe, recent work has demonstrated benefits of strip cropping when integrated with grass borders (Madembo et al., Reference Madembo, Baudron, Mashingaidze, Murungweni, Bangira, Muoni and Thierfelder2025). However, studies comparing different diversification options are limited, especially considering that each option can be implemented in different contexts and with different crops. Here, we address this gap by systematically comparing maize-legume rotations, intercrops, and strip crops under CA, using two legumes with contrasting growth habits (pigeon pea and cowpea), under fertilized and non-fertilized conditions, and on two different soil types (clayey vs sandy). We hypothesized that cropping system performance would depend on the choice of legume, with the contrasting growth habits of cowpea and pigeon pea expected to influence their interactions with maize in different diversification layouts, and under fertilized vs. unfertilized conditions. In Zimbabwe, many smallholder farmers face severe constraints in accessing fertilizers due to cost and availability, and the inclusion of the unfertilized treatments aimed to evaluate the relative resilience of different diversification layouts to nutrient-limited conditions.
Materials and Methods
Study sites
Two identical experiments were conducted near Harare over three cropping seasons (2019–20 to 2022–23) at Domboshava Training Centre (DTC, 31°07′33″E, 17°35′17″S, 1560 m elevation) and the University of Zimbabwe farm (UZ, 31°00′48″E,17°42′24″S, 1490 m elevation). Both study sites have a unimodal rainfall distribution with an average of 1000 mm of rainfall during the growing season from November to April. The climate ranges from warm temperate to tropical, featuring hot summers and dry winters, with frequent mid-season droughts. The experiments were not irrigated. The sandy loam soils at DTC were Lixisols derived from granite (Soropa et al., Reference Soropa, Mbisva, Nyamangara, Nyakatawa, Nyapwere and Lark2021), with 73% sand, 22% clay and 5% silt (Table S1). The sandy clay loam soil at UZ was xanthic Ferralsols, with 39% sand, 40% clay, and 21% silt (Table S1). Soil organic carbon content was 7.3 g kg−1 at DTC and 16.8 g kg−1 at UZ; additional soil characteristics and agronomic history for both sites are provided in Table S1. The contrasting soil conditions at each site are typical of the range of soil types found among smallholder farms in sub-humid central Zimbabwe, with DTC representing low-fertility sandy soils and UZ representing more fertile clay-rich soils.
The experiment was established in the 2019/2020 growing season, but no data were collected in the first season while the crop rotations to become established. Data were collected for three growing seasons, from 2020/2021 to 2022/2023.
Experiment design, treatments, and crop management
A split strip randomized complete block design with four replicates was implemented, with each replicate split lengthwise into two fertilizer treatment plots and perpendicularly into eight cropping system plots. Fertilizer treatments included fertilized (Fert+) and unfertilized (Fert-). There were six cropping system treatments: (1) maize (MZ) monoculture, (2) maize-cowpea rotation (MZ-CP), (3) maize-pigeon pea rotation (MZ-PP), (4) maize-cowpea double-row strip cropping (MZCP2), (5) maize-pigeon pea traditional intercropping (MZPP1), and (6) maize-pigeon pea double-row strip cropping (MZPP2) (Figure 1). In the traditional intercrop, maize and pigeon pea are planted in alternating stations within the same row. Two plots were allocated to cater for MZ-CP and MZ-PP sequences each season so that the rotations were fully phased, i.e. each crop was present each season on a separate plot. However, at analysis, these rotations were considered as one treatment each with three maize and three legume harvests (i.e. mean outcomes are calculated across both rotation plots in each replicate).
A diagrammatic representation of the tested cropping systems. Blue circles = maize plants, green triangles = pigeon pea plants, and purple diamonds = cowpea plants (spacing not to scale). The rotations alternated between a maize crop and a legume crop each year. Two plots in each replicate in the experiment were allocated to the rotation so that both the maize and the legume phases were fully represented in the experiments in each year. See main text for plant density and row spacing information.

A total of 64 plots were established per site (16 fertilizer by cropping system plots in four replicates). Each plot measured 8 m × 6 m. Medium-maturity varieties of maize (PGS 63), cowpea (CBC2), and pigeon pea (Mthawajuni) were grown in all seasons. Both legumes were determinant varieties, maturing around 100 and 150 days after sowing for cowpea and pigeon pea, respectively. Field operations undertaken to manage the trials at each site, and dates thereof, are summarized in Table S2.
Planting practices in our experiments maintained a consistent maize density of 44,400 plant ha−1 across treatments and followed typical practices among smallholder farmers in Zimbabwe. Seeds were sown in basins dug with hand hoes, approximately 15 cm diameter and 15 cm depth, with seed covered by 2 cm of soil. Maize and pigeon pea were each sown at 44,400 plant ha−1. In MZ and MZ-PP, maize and pigeon pea were planted in basins spaced at 90 cm (between rows) × 50 cm (within rows) with two plants per basin. This practice follows farmers’ preference for two plants per basin and a wide within-row spacing to minimize labour and to make weeding (by hand hoe) easier. Alternatively, this space can be used to add an intercrop; thus, in MZPP1, basins were spaced at 90 × 25 cm with two plants per basin, but with maize and pigeon pea sown in alternate basins. In MZPP2, both maize and pigeon pea were sown in double row strips of each crop, with 50 × 50 cm spacing with two plants per basin. Maize and pigeon pea strips were separated by 40 cm.
In MZ-CP, cowpea was sown at 74,100 plant ha−1 spaced at 45 × 30 cm with one plant per basin. In MZCP2, maize was also sown in double rows with 50 × 50 cm spacing and with two plants per basin (44,400 plant ha−1), while cowpea was sown in triple rows with 30 × 30 cm spacing. The maize and cowpea strips were separated by 35 cm, leading to 55,600 cowpea plants ha−1. In both strip cropping systems, strips were rotated each season, so no crop was sown in the same rows as in the previous season.
In the fertilized treatments, a compound fertilizer (Compound D) comprising 12 kg N ha−1, 14 kg ha−1 P, and 8 kg ha−1 K was applied by hand to planting basins for all crops as a basal application at planting. Maize plants also received two subsequent topdressings of ammonium nitrate (34.5% N), each providing 26 kg ha−1 N. Thus, maize plants received a total seasonal N of 64 kg N ha−1 (this is below the optimal rate for maize, but mimics the amount of fertilizer that smallholder farmers could feasibly acquire). Ammonium nitrate was spot applied by hand to maize plants at four weeks (6-leaf stage) and seven weeks after planting (12-leaf stage).
Glyphosate [N-(phosphono-methyl) glycine] was sprayed soon after sowing to control initial weeds at the rate of 1.025 L active ingredient ha−1. Weed control was done manually using hoes when weeds were roughly 10 cm tall or 10 cm in diameter for stoloniferous. Pests and diseases were controlled using appropriate chemicals when necessary. After harvesting each season, crop residues were retained on the plots where they were grown and left in place until the subsequent planting. During the first season of trial establishment, crop residues from previous maize crops were left in the field. No residue imports were made. This consistent management ensured that carry-over effects on soil fertility were confined to the same plots.
Data collection
Crop harvesting
All crops were hand-harvested individually at physiological maturity. The harvested area for yield determination was a 5 m length of the four central rows for maize and pigeon pea sole crops, and the eight central rows for cowpea sole crops. For MZPP2 and MZCP2, the harvest area was the two central strips of each crop (four rows of maize and pigeon pea, and six rows of cowpea). The harvest row length was 5 m for all treatments.
Ears and pods were removed from plants and their fresh weight recorded, then all plants were cut at ground level, and the fresh weight of the plant biomass (stalks and leaves) was also recorded. A sub-sample of 10 ears for maize, or 500 g pods for cowpea and pigeon pea, was taken to determine grain weight per ear/pod and the fresh to dry weight ratio. For plant biomass, a sub-sample of approximately 500 g of plant material was taken to determine fresh vs dry weight. Crop grain yields are reported at 12.5% moisture.
Crop grain yields and plant biomass are expressed on a per hectare basis for each system in each season. Rotation yields are expressed per hectare of each crop, thus not accounting for the fact that one hectare of each crop in a rotation requires twice as much land as a single hectare of both crops in an intercrop or strip crop. We therefore complement the individual crop yields with the system yield per hectare of calories and protein per hectare (below).
Calorie and protein productivity of cropping systems
Total grain protein (kg ha−1) and calorie yields (million kcal ha−1) for each plot in each season were determined from the grain yield for each treatment using conversion factors for maize, cowpea, and pigeon pea of 9.5 g, 23.4 g, and 20.9 g protein 100 g−1 grain and 356, 342, and 343 kcal kg−1 grain, respectively (FAO, 2001).
Data analysis
All analyses in this study were conducted using R (R Core Team, 2024). We used mixed linear regression models to explore differences among treatments in the strip plot experiment in the grain yields of each crop, and in system calories, protein, and total biomass. A separate model was created for each response variable. In all models, the fixed effects included the cropping system, fertilizer level, site, season, and all interactions between these variables. The models also included random effects that accounted for multiple measures taken from a strip plot experiment design at each site: replicate, fertilizer plot nested within replicate, cropping system plot nested within replicate, and the interaction between fertilizer plot and cropping system plot. The effect of season could also have been considered random, given it is due to weather differences in each growing season, but we included it as a fixed rather than random variable to investigate how other variables interacted with season. Residuals were examined to ensure models fit the assumptions of normality and homoscedasticity, and where necessary, response variables were either log- or square root-transformed to meet these assumptions. Models were created in R package lme4.
For all models, the significance of terms was tested using Type III ANOVA (Kenward–Roger F-tests) using packages pbkrtest (Halekoh and Højsgaard, Reference Halekoh and Højsgaard2014) and lmerTest (Kuznetsova et al., Reference Kuznetsova, Brockhoff and Christensen2017). If treatment terms (cropping system and fertilizer) were significant in the ANOVA, we explored differences among treatments using post hoc pairwise comparisons (using a Tukey correction for multiple tests) of estimated marginal means, using functions in package emmeans (Lenth et al., Reference Lenth, Bolker, Buerkner, Giné-Vázquez, Herve, Jung, Love, Miguez, Riebl and Singmann2023). In the main text, comparisons were conducted within sites to assess whether treatment performance differed between sites, but across seasons to identify the best overall-performing treatments in each site (given that farmers cannot change between long-term systems such as rotations in response to the weather each season). However, where season was significant, results for different seasons can be found in the Supplementary Materials.
We used the standard deviation to assess maize yield stability within treatments. Yield stability was only assessed for maize, as maize is typically considered by farmers to be the most important crop, and ensuring sufficient and stable maize production is a key determinant of whether or not smallholder farmers will adopt diversified systems (Snapp and Fisher, Reference Snapp and Fisher2015).
Radar plots were used to explore trade-offs existing within the cropping systems (Droppelmann et al., Reference Droppelmann, Snapp and Waddington2017; Thierfelder et al., Reference Thierfelder, Mhlanga, Nyagumbo, Kalala, Simutowe, Chiduwa, MacLaren, Silva and Ngoma2024). To create these plots, the marginal means of each response variable for each cropping system by fertilizer treatment combination across both sites and all seasons were extracted from the models (above). These marginal means were then scaled to a proportion of the maximum mean for that response variable, i.e. scaled to between 0 and 1, where 1 was equal to the maximum mean of all treatments. These scaled means were then plotted on the axis for their respective response variable. For the SD, an inverse metric was calculated: the minimum SD across all treatments divided by the SD of each treatment. This means the most stable treatment (lowest SD) has a value of 1, and treatments with higher SDs have lower values on the radar plot (while never reaching zero, given that the SD has no upper limit).
Results
Individual crop grain yields
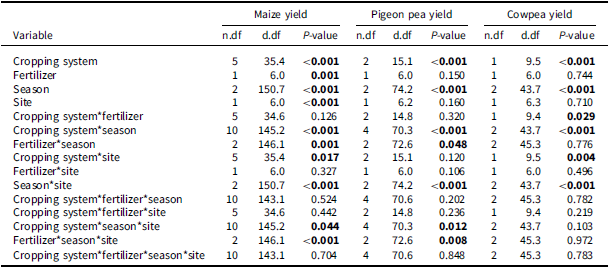
Maize grain yields differed among cropping systems and fertilizer treatments but were not affected by the interaction between cropping system and fertilizer treatment (Table 1). The effects of cropping system and fertilizer on maize yields differed between sites and seasons (Table 1) but the overall pattern among treatments was similar across sites and seasons (Figures 2, S1). Overall, the cropping systems with the highest mean maize yields were MZ-CP (DTC = 2081 kg ha−1, UZ = 4250 kg ha−1), MZ-PP (DTC = 1483 kg ha−1, UZ = 4129 kg ha−1), and MZPP2 (DTC = 1252 kg ha−1, UZ = 4406 kg ha−1). The differences between systems varied between sites: at DTC, MZ-CP had significantly higher maize yields than all other systems, whereas MZPP2 did not differ significantly from the lowest performing treatment, MZCP2 (857 kg ha−1) (Figure 2a). Fertilizer increased mean maize yields by 172% (1238 kg ha−1) at DTC and by 52% (1530 kg ha−1) at UZ (Figure 2b). On average across all cropping systems and fertilizer levels, maize yields were 76% lower at DTC (1264 kg ha−1) compared to UZ (3669 kg ha−1).
Mean grain yields for maize for each cropping system (left panel) and both fertilizer levels (right panel) at each site. Large points are estimated marginal means with 95% confidence intervals, and small points are the underlying yield observations. Letters indicate significant differences between treatments within sites (points of the same shape and colour); treatments that do not share differ significantly (P < 0.05). See Supplementary Figure S1 for mean yields separated by season. Maize yields are reported at 12.5% moisture. Fert- = no fertilizer, Fert+ = fertilized. See Figure 1 for cropping system abbreviations.

P-values, numerator degrees of freedom (n.df), and denominator degrees of freedom (d.df) from ANOVA type III Kenward–Roger F-tests for each model for maize, cowpea, and pigeon pea yields, analysing the effects of cropping system, fertilizer, season, site, and their interactions. P-values highlighted in bold text are significant at the 5% level (P < 0.05)

Table 1. Long description
A table comparing the effects of cropping system, fertilizer, season, site, and their interactions on maize, cowpea, and pigeon pea yields. The table has 12 rows and 12 columns. The columns are labeled as follows: Variable, Maize yield n.df, Maize yield d.df, Maize yield P-value, Pigeon pea yield n.df, Pigeon pea yield d.df, Pigeon pea yield P-value, Cowpea yield n.df, Cowpea yield d.df, Cowpea yield P-value. The rows are labeled as follows: Cropping system, Fertilizer, Season, Site, Cropping system*fertilizer, Cropping system*season, Fertilizer*season, Cropping system*site, Fertilizer*site, Season*site, Cropping system*fertilizer*season, Cropping system*fertilizer*site, Cropping system*season*site, Cropping system*fertilizer*season*site. Row 1: Cropping system, 5, 35.4, <0.001, 2, 15.1, <0.001, 1, 9.5, <0.001. Row 2: Fertilizer, 1, 6.0, 0.001, 1, 6.0, 0.150, 1, 6.0, 0.744. Row 3: Season, 2, 150.7, <0.001, 2, 74.2, <0.001, 2, 43.7, <0.001. Row 4: Site, 1, 6.0, <0.001, 1, 6.2, 0.160, 1, 6.3, 0.710. Row 5: Cropping system*fertilizer, 5, 34.6, 0.126, 2, 14.8, 0.320, 1, 9.4, 0.029. Row 6: Cropping system*season, 10, 145.2, <0.001, 4, 70.3, <0.001, 2, 43.7, <0.001. Row 7: Fertilizer*season, 2, 146.1, 0.001, 2, 72.6, 0.048, 2, 45.3, 0.776. Row 8: Cropping system*site, 5, 35.4, 0.017, 2, 15.1, 0.120, 1, 9.5, 0.004. Row 9: Fertilizer*site, 1, 6.0, 0.327, 1, 6.0, 0.106, 1, 6.0, 0.496. Row 10: Season*site, 2, 150.7, <0.001, 2, 74.2, <0.001, 2, 43.7, <0.001. Row 11: Cropping system*fertilizer*season, 10, 143.1, 0.524, 4, 70.6, 0.202, 2, 45.3, 0.782. Row 12: Cropping system*fertilizer*site, 5, 34.6, 0.442, 2, 14.8, 0.236, 1, 9.4, 0.219. Row 13: Cropping system*season*site, 10, 145.2, 0.044, 4, 70.3, 0.012, 2, 43.7, 0.103. Row 14: Fertilizer*season*site, 2, 146.1, <0.001, 2, 72.6, 0.008, 2, 45.3, 0.972. Row 15: Cropping system*fertilizer*season*site, 10, 143.1, 0.704, 4, 70.6, 0.848, 2, 45.3, 0.783.
Pigeon pea yields tended to be higher in MZ-PP (DTC = 894 kg ha−1, UZ = 622 kg ha−1) than in MZPP1 (DTC = 392 kg ha−1, UZ = 302 kg ha−1) or MZPP2 (DTC = 410 kg ha−1, UZ = 468 kg ha−1), although the difference was greater at DTC than UZ (Figure 3a). Fertilizer had a negative effect on pigeon pea yields at DTC, reducing yields by 24% (150 kg ha−1), but not at UZ (Figure 3b). Cowpea grain yields were affected by cropping system and its interaction with fertilizer and by cropping system and its interaction with site (but not the three-way cropping system × site × fertilizer interaction; Table 1). Cowpea yields were 250% higher in MZ-CP (747 kg ha−1) than MZCP2 (211 kg ha−1) at UZ, but not significantly different between cropping systems at DTC (Figure 3c). Fertilizer enhanced the difference between MZ-CP and MZCP2 at both sites (Figure 3d). Both cowpea and pigeon pea yields, and the effects of cropping system and fertilizer on those yields, differed between seasons (Table 1), but the overall pattern was similar across seasons (Figures S2 and S3). Mean pigeon pea and cowpea yields were similar at DTC and UZ (Table 1).
Mean grain yields for pigeon pea and cowpea. Panel A = mean pigeon pea yields in each cropping system treatment by site, B = mean pigeon pea yields under each fertilizer treatment by site, C = mean cowpea yields in each cropping system by site, and D = mean cowpea yields in each cropping system by fertilizer treatment. Large points are estimated marginal means with 95% confidence intervals, and small points are the underlying yield observations. Letters indicate significant differences; treatments that do not share a letter are differ significantly (P < 0.05). For Panels A – C, letters indicate differences within sites (points of the same shape and colour). For Panel D, letters indicate differences among all four treatment combinations. See Supplementary Figure S2 for means separated by season. Fert- = no fertilizer, Fert+ = fertilized. See Figure 1 for cropping system abbreviations.

Figure 3. Long description
Panel A: This scatter plot shows the mean pigeon pea yields in each cropping system treatment by site. The x-axis represents the cropping system, and the y-axis represents the pigeon pea grain yield in kg per hectare. The sites are represented by different colors: DTC in teal and UZ in yellow. Large points are estimated marginal means with 95% confidence intervals, and small points are the underlying yield observations. Letters indicate significant differences; treatments that do not share a letter are significantly different (P < 0.05). For Panel A, letters indicate differences within sites (points of the same shape and color). Panel B: This scatter plot shows the mean pigeon pea yields under each fertilizer treatment by site. The x-axis represents the fertilizer treatment, and the y-axis represents the pigeon pea grain yield in kg per hectare. The sites are represented by different colors: DTC in teal and UZ in yellow. Large points are estimated marginal means with 95% confidence intervals, and small points are the underlying yield observations. Letters indicate significant differences; treatments that do not share a letter are significantly different (P < 0.05). For Panel B, letters indicate differences within sites (points of the same shape and color). Panel C: This scatter plot shows the mean cowpea yields in each cropping system by site. The x-axis represents the cropping system, and the y-axis represents the cowpea grain yield in kg per hectare. The sites are represented by different colors: DTC in teal and UZ in yellow. Large points are estimated marginal means with 95% confidence intervals, and small points are the underlying yield observations. Letters indicate significant differences; treatments that do not share a letter are significantly different (P < 0.05). For Panel C, letters indicate differences within sites (points of the same shape and color). Panel D: This scatter plot shows the mean cowpea yields in each cropping system by fertilizer treatment. The x-axis represents the cropping system, and the y-axis represents the cowpea grain yield in kg per hectare. The fertilizer treatments are represented by different shapes: Fert- as diamonds and Fert+ as triangles. Large points are estimated marginal means with 95% confidence intervals, and small points are the underlying yield observations. Letters indicate significant differences; treatments that do not share a letter are significantly different (P < 0.05). For Panel D, letters indicate differences among all four treatment combinations.
Cropping system biomass yields
Aboveground plant biomass production differed between cropping system and fertilizer treatments but were not affected by cropping systems by fertilizer interactions (Table 2). At both UZ and DTC, plant biomass was highest in MZPP2 (DTC = 4118 kg ha−1, UZ = 8107 kg ha−1) and lowest in MZ-CP (DTC = 1519 kg ha−1, UZ = 2343 kg ha−1), although the differences between treatments were greater at UZ (Figure 4). Fertilizer had a positive effect on plant biomass production at both sites (Figure 4). The magnitude of cropping system effects varied by season, but the overall ranking among treatments remained similar (Figure S4). When averaged across all cropping systems and fertilizer levels, biomass production was 48% lower at DTC (2426 kg ha−1) than UZ (4650 kg ha−1).
Mean aboveground plant biomass production for each cropping system at each site (left panel) and for each fertilizer level (right panel). Large points are estimated marginal means with 95% confidence intervals, and small points are the underlying yield observations. Lowercase letters indicate significant differences; treatments that do not share a letter differ significantly (P < 0.05). In the left-hand panel, letters should only be compared within site (points of the same shape and colour). See Supplementary Figure S4 for means separated by season. Fert- = no fertilizer, Fert+ = fertilized. See Figure 1 for cropping system abbreviations.

Figure 4. Long description
The image contains two scatter plots with estimated marginal means and confidence intervals. Panel A on the left shows plant biomass production for various cropping systems at two sites, DTC and UZ. The x-axis represents different cropping systems, and the y-axis measures plant biomass in kilograms per hectare. Each site is represented by different colored points, with DTC in teal and UZ in yellow. Lowercase letters indicate significant differences within each site. Panel B on the right compares plant biomass production under fertilized and non-fertilized conditions. The x-axis shows fertilizer treatments, and the y-axis measures plant biomass in kilograms per hectare. Points represent estimated marginal means with 95% confidence intervals, and small points are the underlying yield observations. Lowercase letters indicate significant differences between treatments. Fert- denotes no fertilizer, and Fert+ denotes fertilized conditions.
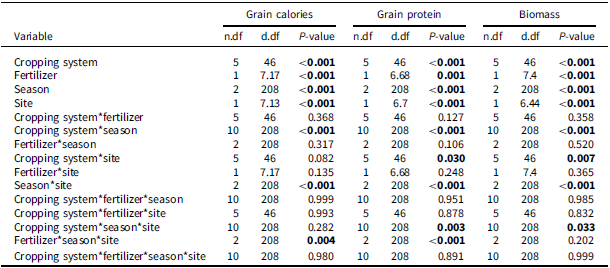
P-values, numerator degrees of freedom (n.df), and denominator degrees of freedom (d.df) from ANOVA type III Kenward–Roger F-tests for each model for system calories, protein, and aboveground plant biomass, analysing the effects of cropping system, fertilizer, season, site, and their interactions. P-values highlighted in bold text are significant at the 5% level (P < 0.05)

Table 2. Long description
A table with 16 rows and 9 columns comparing the effects of various variables on grain calories, grain protein, and biomass. The columns are labeled with the variables and their respective degrees of freedom (n.df and d.df) and P-values. The rows list the variables: cropping system, fertilizer, season, site, cropping system*fertilizer, cropping system*season, fertilizer*season, cropping system*site, fertilizer*site, season*site, cropping system*fertilizer*season, cropping system*fertilizer*site, cropping system*season*site, fertilizer*season*site, and cropping system*fertilizer*season*site. Each row provides the n.df, d.df, and P-value for grain calories, grain protein, and biomass. Significant P-values at the 5% level (P < 0.05) are highlighted in bold text. The table shows that cropping system, fertilizer, season, site, and several of their interactions have significant effects on grain calories, grain protein, and biomass.
Cropping system grain calories and grain protein yield
System grain calorie yields differed among cropping systems and fertilizer levels, but there was no significant interaction between cropping system and fertilizer treatments (Table 2, Figure 4a and b), nor between cropping system and site (Figure 5a). Mean grain calorie yields were highest in MZPP2 (9.14 million kcal ha−1) and MZPP1 (6.79 million kcal ha−1), intermediate in MZCP2 (6.55 million kcal ha−1) and MZ (5.96 million kcal ha−1), and lowest in the two rotations, MZ-PP (4.18 million kcal ha−1) and MZ-CP (4.31 million kcal ha−1). Fertilizer had a positive effect on grain calorie yields at both sites (Table 2, Figure 4b), increasing yields by 101% (2.82 million kcal ha−1) at DTC and by 50% (3.63 million kcal ha−1) at UZ. Mean grain calorie yields were 56% lower at DTC (3.96 million kcal ha−1) compared to UZ (8.92 million kcal ha−1), when averaged across all cropping systems and fertilizer levels.
Mean grain calories (a, b) and protein (c, d) yields for each cropping system (a, c) and fertilizer level (b, d). Means are shown by site in all panels except A, where the cropping system by site interaction was not significant (Table 2). Large points are estimated marginal means with 95% confidence intervals, and small points are the underlying yield observations. Lowercase letters indicate significant differences between treatments within sites; treatments that do not share the same letter are significantly different (P < 0.05). Letters should be compared within sites (points of the same shape and colour), except for panel A. See Supplementary Figures S5–S7 for means separated by season. Fert- = no fertilizer, Fert+ = fertilized. See Figure 1 for cropping system abbreviations.

System grain protein yields followed a similar pattern to grain calorie yields among treatments, although unlike for calories, the cropping system by site interaction was significant (Table 2, Figure 5c). At both sites, the highest mean protein yields were produced in the strip crops, MZPP2 (DTC = 203 kg ha−1, UZ = 468 kg ha−1) and MZCP2 (DTC = 159 kg ha−1, UZ = 330 kg ha−1). MZPP1 also produced high protein yields at DTC (186 kg ha−1). At UZ, the lowest protein yields were found in the MZ-PP rotation (207 kg ha−1), whereas at DTC, the lowest protein yields were found in the MZ monoculture (89 kg ha−1). Fertilizer increased mean grain protein yields by 76% (84 kg ha−1) at DTC and by 43% (107 kg ha−1) at UZ (Figure 5d). On average across all cropping systems and fertilizer levels, grain protein yields were 50% lower at DTC (146 kg ha−1) compared to UZ (296 kg ha−1).
Maize yield stability
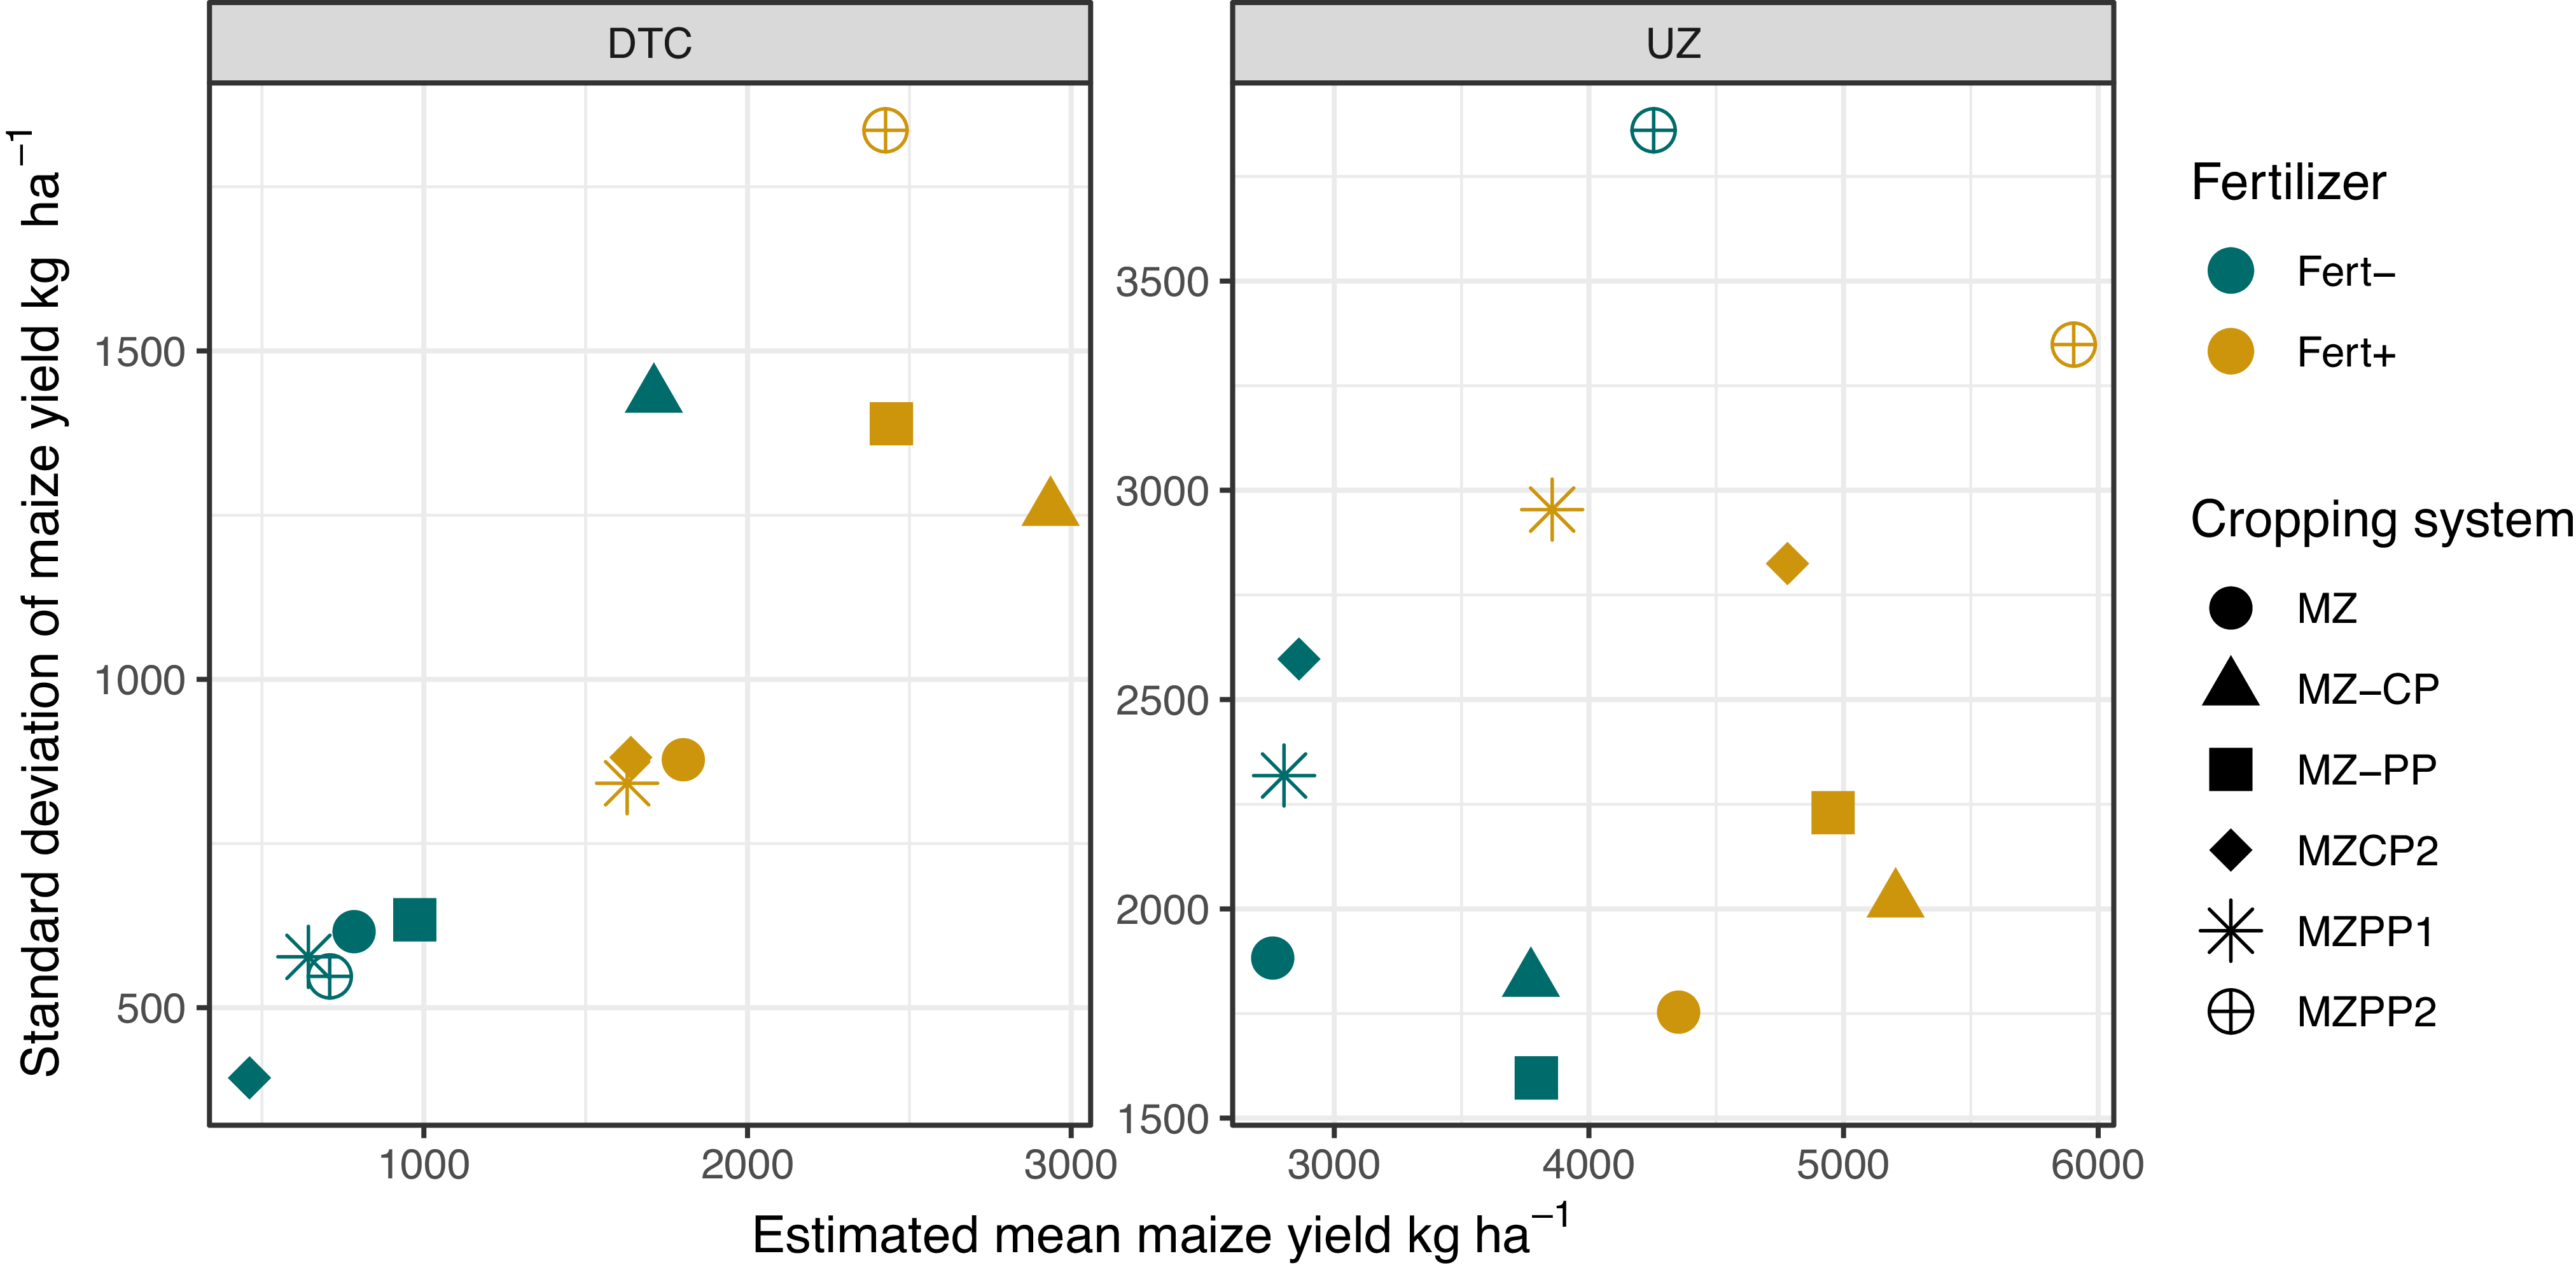
Maize yields were more stable among sites and seasons in lower- compared with higher-yielding systems and sites (Figure 6). Standard deviations were relatively high for MZPP2 and relatively low for MZ, MZ-PP, and MZ-CP, with the exception of unfertilized plots at DTC.
The standard deviation of the maize yield relative to the mean maize yield for each cropping system and fertilizer combination in each site across all seasons. Higher standard deviations indicate less stable yields. Fert- = no fertilizer, Fert+ = fertilized. See Figure 1 for cropping system abbreviations.

Relative advantages and disadvantages of cropping systems
The radar plots (Figure 7) show the relative mean of all response parameters for each cropping system and fertilizer combination across both sites and all seasons. The outer line is the maximum mean achieved among cropping systems, while the inner line is zero, e.g. for no cowpea yield in MZ and PP (sole crops). MZPP2 had the highest maize grain yield, total biomass yield, and calorie and protein yields. MZPP2 had about 50% of the pigeon pea grain yield compared with MZ-PP, but MZPP2 had relatively low maize grain yield stability. In contrast to MZPP2, MZ and the two rotations had low biomass, calorie, and protein yields, but high maize yield stability and high cowpea or pigeon pea yields. Fertilizer application consistently increased productivity across all cropping systems through its effect on maize yields, while legume yields were similar between fertilized and unfertilized conditions, and in some cases higher in unfertilized conditions (Figures 2 and 7). Fertilizer was associated with increased stability for a given yield but greater instability overall (Figures 6 and 7).
Radar plot summarizing the relative advantages and disadvantages of each cropping system (MZ.Y = maize yield, CP.Y = cowpea yield, PP.Y = pigeon pea yield, CAL = grain calorie yield, PRO = grain protein yield, BM = biomass yield, SD = inverse standard deviation). Points indicate the mean response of each treatment across all seasons and both sites, expressed as a proportion of the maximum among treatments (outer dashed line). The central dashed line indicates half of the maximum, and the inner dashed line indicates zero. Fert- = no fertilizer, Fert+ = fertilized. See Figure 1 for cropping system abbreviations.

Discussion
Cropping system performance and productivity
Of the six cropping systems tested in this study, we found that overall performance across multiple productivity indicators was greatest in strip crop layouts, and when pigeon peas rather than cowpeas were included to diversify the system. MZPP2 had a high maize yield and the highest mean yields of grain calories and protein, and of total biomass, demonstrating high complementarity and resource efficiency compared to other cropping systems. MZPP2 preserves high maize yields while also contributing decent pigeon pea yields (around half of that achieved in MZ-PP), making it a practical option for adoption by smallholders (Snapp and Fisher, Reference Snapp and Fisher2015; Muoni et al., Reference Muoni, Barnes, Öborn, Watson, Bergkvist, Shiluli and Duncan2019). Our results suggest that strip cropping with pigeon pea imposes less competition on maize than strip cropping with cowpea. Cowpea has rapid early growth and thus potentially competes more for resources with maize in its most active growth period (Kinyua et al., Reference Kinyua, Kihara, Bekunda, Bolo, Mairura, Fischer and Mucheru-Muna2023; Madembo et al., Reference Madembo, Mhlanga and Thierfelder2020; Mugi-Ngenga et al., Reference Mugi-Ngenga, Bastiaans, Anten, Zingore, Baijukya and Giller2023). In contrast, the later maturation of pigeon pea may lead to greater temporal niche separation with maize, a mechanism known to promote higher overall resource uptake and productivity (Li et al., Reference Li, Li, Wu, Zhang, Li, Li, Lambers and Li2016; Yu et al., Reference Yu, Stomph, Makowski and van Der Werf2015) and to mitigate the risk of crop failure due to abiotic and biotic stresses (Andersen et al., Reference Andersen, Hauggaard-Nielsen, Weiner and Jensen2007; Stomph et al., Reference Stomph, Dordas, Baranger, de Rijk, Dong, Evers, Gu, Li, Simon and Jensen2020).
Our observation of higher performance in MZPP2 compared to MZPP1 also suggests greater complementarity in strip cropping compared to the traditional inter-row intercropping layout. Other studies have reported that strip cropping increases light availability to different parts of the crop canopy, thus increasing overall light interception in strip crops relative to traditional intercrops (Francis et al., Reference Francis, Jones, Crookston, Wittler and Goodman1986; Wang et al., Reference Wang, Sun, Bai, Wang, Wang, Zhang, Zhang, Yang, Liu, Nie, Chen, Duan and Zhang2021). Strip cropping may also promote high soil nutrient and water use through complementary root distributions (Homulle et al., Reference Homulle, George and Karley2021).
Rotations, intercrops, or strip crops: Which pathway for productive systems?
Overall, the diverse cropping systems in our study outperformed the monoculture in terms of maize yields, system biomass, calories, and protein. Among the diverse systems, the results of our study highlight an important trade-off between rotations and intercrops or strip crops. Compared to intercrops, both rotations had larger grain yields per hectare of each crop species and more stable maize grain yields. However, these individual crop grain yields do not account for the fact that in a rotation, only half the land can be allocated to each crop, or only one crop can be grown per year. Thus, when total grain yields from both crops per hectare of each cropping system are aggregated to grain calorie and grain protein yields, we see that the strip crops and the intercrop produced more calories and protein than rotations. These systems also produced more plant biomass per hectare than rotations.
Our results concur with other studies showing that cereal-legume rotations could increase maize yields by 20-30% compared to continuous monocropping (Franke et al., Reference Franke, Van den Brand, Vanlauwe and Giller2018). In Malawi, rotations with legumes increased economic profits by 75% compared to maize monoculture. However, these rotations resulted in a 54% lower average caloric yield (Komarek et al., Reference Komarek, Koo, Haile, Msangi and Azzarri2018). Maize has a very high caloric yield (Kaushal et al., Reference Kaushal, Sharma, Vaidya, Gupta, Saini, Anand, Thakur, Verma, Thakur and Priyanka2023; Nuss and Tanumihardjo, Reference Nuss and Tanumihardjo2010), so when maize is substituted for another crop in a rotation, total calorie yields tend to drop compared to maize monocropping. In contrast, we observed similar protein yields in rotations to maize monocrops, due to the relatively high protein content in legume grains.
Intercropping and strip cropping systems increase productivity through maintaining the same maize plant population in each season, while adding legumes to the system. Although competition from the legumes tends to reduce maize grain yields, their complementary use of resources leads to higher overall productivity (Bedoussac et al., Reference Bedoussac, Journet, Hauggaard-Nielsen, Naudin, Corre-Hellou, Jensen, Prieur and Justes2015; Stomph et al., Reference Stomph, Dordas, Baranger, de Rijk, Dong, Evers, Gu, Li, Simon and Jensen2020). Improved productivity in maize-legume intercrops has also been reported in Kenya, central Mozambique, Zambia, and northern Tanzania when compared to monocropping (Kinyua et al., Reference Kinyua, Kihara, Bekunda, Bolo, Mairura, Fischer and Mucheru-Muna2023; Mwila et al., Reference Mwila, Silva, Kalala, Simutowe, Ngoma, Nyagumbo, Mataa and Thierfelder2024; Rusinamhodzia et al., Reference Rusinamhodzi, Corbeels, Nyamangara and Giller2012; Thierfelder et al., Reference Thierfelder, Mhlanga, Nyagumbo, Kalala, Simutowe, Chiduwa, MacLaren, Silva and Ngoma2024). Higher plant biomass produced by strip crops and intercrops could also be advantageous for smallholder farmers who practice mixed farming due to competing uses for crop residues, either as livestock feed or left in the field as a protective cover for the soil (Valbuena et al., Reference Valbuena, Erenstein, Tui, Abdoulaye, Claessens, Duncan, Gérard, Rufino, Teufel and van Rooyen2012).
Overall, intercrops and strip crops are more productive per unit of land area; however, if farmers have plenty of land, they may still prefer rotations to achieve higher grain yields from each crop (Mwila et al., Reference Mwila, Silva, Kalala, Simutowe, Ngoma, Nyagumbo, Mataa and Thierfelder2024). In neighbouring Zambia, for example, rotations may generally be more advantageous as most farmers are not land-limited, and rotations also require less labour to establish than intercrops and strip crops (Mwila et al., Reference Mwila, Silva, Kalala, Simutowe, Ngoma, Nyagumbo, Mataa and Thierfelder2024; Thierfelder et al., Reference Thierfelder, Mhlanga, Nyagumbo, Kalala, Simutowe, Chiduwa, MacLaren, Silva and Ngoma2024). However, high population densities in communal farming areas in Zimbabwe lead to reduced land available for each farmer, making it difficult to implement crop rotation systems that require more space (Makate et al., Reference Makate, Wang, Makate and Mango2016; Mango et al., Reference Mango, Zamasiya, Makate, Nyikahadzoi and Siziba2014). The amount of available arable land can therefore determine whether crop rotations or intercropping will be more rewarding. Crop rotations can be targeted where arable land is abundant and intercropping on land-constrained farms (Mwila et al., Reference Mwila, Silva, Kalala, Simutowe, Ngoma, Nyagumbo, Mataa and Thierfelder2024; Thierfelder et al., Reference Thierfelder, Cheesman and Rusinamhodzi2012).
Effects of fertilizer and soil fertility on cropping system performance
Fertilizer enhances crop yields by providing essential nutrients needed for plant growth (Dimkpa et al., Reference Dimkpa, Adzawla, Pandey, Atakora, Kouame, Jemo and Bindraban2023; Zhou et al., Reference Zhou, Wang, Wang, Liu, Li and Guo2023). However, many smallholders in Zimbabwe farm under severe input constraints. Mineral fertilizer is often scarce, unaffordable, or seen as risky, and research has confirmed that many fields receive no nutrients at all (Chikowo et al., Reference Chikowo, Zingore, Snapp and Johnston2014; Falconnier et al., Reference Falconnier, Cardinael, Corbeels, Baudron, Chivenge, Couëdel, Ripoche, Affholder, Naudin, Benaillon, Rusinamhodzi, Leroux, Vanlauwe and Giller2023; Mutambara, Reference Mutambara2016). The unfertilized plots in our experiments represent the reality faced by many smallholder farmers who cannot reliably access fertilizer due to cost and availability constraints (Chivenge et al., Reference Chivenge, Zingore, Ezui, Njoroge, Bunquin, Dobermann and Saito2022; Kihara et al., Reference Kihara, Nziguheba, Zingore, Coulibaly, Esilaba, Kabambe, Njoroge, Palm and Huising2016; Nezomba et al., Reference Nezomba, Mtambanengwe, Chikowo and Mapfumo2014). We found that maize yields were substantially lower under unfertilized compared to fertilized conditions, confirming the critical role of nutrient inputs, especially on sandy soils (Kihara et al., Reference Kihara, Nziguheba, Zingore, Coulibaly, Esilaba, Kabambe, Njoroge, Palm and Huising2016; Masvayaa et al., Reference Masvayaa, Nyamangarac, Descheemaekerb and Gillerb2017; Rurinda et al., Reference Rurinda, Zingore, Jibrin, Balemi, Masuki, Andersson, Pampolino, Mohammed, Mutegi, Kamara, Vanlauwe and Craufurd2020). In contrast, legume yields did not differ between fertilizer treatments, as legumes can meet some of their own nutrient needs via BNF (Stomph et al., Reference Stomph, Dordas, Baranger, de Rijk, Dong, Evers, Gu, Li, Simon and Jensen2020). Pigeon pea yields may even have increased slightly in unfertilized conditions at DTC (perhaps driven by fertilizer increasing weed pressure; Masamba et al., Reference Masamba, MacLaren, Mabasa, Chikowo and Thierfelder2026). Integrating legumes into maize-based systems could therefore contribute to enhancing resilience to fertilizer scarcity. However, we observed higher calorie and protein productivity across all cropping systems at both sites under fertilized compared to unfertilized conditions. Our results emphasize that combining diversification with fertilization increases smallholder cropping system productivity more than either intervention alone (MacLaren et al., Reference MacLaren, Mead, van Balen, Claessens, Etana, de Haan, Haagsma, Jäck, Keller, Labuschagne, Myrbeck, Necpalova, Nziguheba, Six, Strauss, Swanepoel, Thierfelder, Topp, Tshuma, Verstegen, Walker, Watson, Wesselink and Storkey2022).
Our two sites with distinct soil types strongly mediated cropping system outcomes. On DTC’s sandy loam soils, maize yields were 76% lower than at UZ, but more responsive to fertilizer (172% increase), reflecting the poor nutrient content typical of coarse-textured soils (Vanlauwe et al., Reference Vanlauwe, Descheemaeker, Giller, Huising, Merckx, Nziguheba, Wendt and Zingore2015; Imran et al., Reference Imran, Ortas and Benkeblia2022). In contrast, clayey soils at UZ resulted in higher maize yields but smaller relative fertilizer gains (52%), consistent with the buffering capacity of clay-rich soils (Tittonell and Giller, Reference Tittonell and Giller2013). In contrast to maize, legume yields were similar between sites and fertilizer levels, reflecting legumes’ capacity for BNF to compensate for reduced soil fertility (Vanlauwe et al., Reference Vanlauwe, Hungria, Kanampiu and Giller2019). For cowpea, strip cropping reduced yields compared to rotation at UZ but not at DTC, suggesting cowpea experienced reduced competition from maize when maize growth was limited by soil fertility (Masvaya et al., Reference Masvaya, Nyamangara, Descheemaeker and Giller2017). However, despite the minimal differences in legume yields between sites, the strong positive response of maize to UZ’s more fertile soils meant that system-level productivity in terms of calories and protein was consistently greater at UZ than at DTC. Practices that increase SOM, combined with fertilization, are needed to increase maize yields on sandy soils (Laub et al., Reference Laub, Corbeels, Ndungu, Mucheru-Muna, Mugendi, Necpálová, Van De Broek, Waswa, Vanlauwe and Six2023). Diverse cropping systems can contribute to increasing SOM (Beillouin et al., Reference Beillouin, Corbeels, Demenois, Berre, Boyer, Fallot, Feder and Cardinael2023), but over longer timescales than the duration of this study.
Maize-pigeon pea strip cropping adoption and uptake
Our results, alongside studies from other countries, suggest that the inclusion of pigeon pea into cropping systems could provide numerous benefits, including a reliable source of protein for both human consumption and livestock feed, enhanced soil health, and increased resilience to drought conditions (Ayenan et al., Reference Ayenan, Ofori, Ahoton and Danquah2017; Mhango et al., Reference Mhango, Snapp and Phiri2013). Many farmers find intercropping unappealing due to concerns about potential reductions in main crop yields (Snapp and Fisher, Reference Snapp and Fisher2015), but our results suggest this downside can be avoided by strip cropping. There is also substantial emerging evidence around the globe that strip cropping can be used successfully to improve productivity in cropping systems (Juventia and van Apeldoorn, Reference Juventia and van Apeldoorn2024; Kinyua et al., Reference Kinyua, Kihara, Bekunda, Bolo, Mairura, Fischer and Mucheru-Muna2023; Thierfelder et al., Reference Thierfelder, Mhlanga, Nyagumbo, Kalala, Simutowe, Chiduwa, MacLaren, Silva and Ngoma2024).
To encourage strip cropping and pigeon pea cultivation in Zimbabwe, several strategies could be implemented. Participatory research and education activities, such as farmer field schools and on-farm trials, could spread knowledge of these cropping systems and give farmers confidence in their performance (Bakker et al., Reference Bakker, Dugué and de Tourdonnet2021). Increased labour requirements for intercrop and strip crop layouts could potentially be mitigated through appropriate small-scale mechanization, such as small tractor-drawn planting implements or using basin diggers to make planting stations. While the initial investment in mechanization can be high, the long-term benefits, including increased productivity and reduced labour costs, often outweigh the initial expenses (Sims and Kienzle, Reference Sims and Kienzle2017).
Uncertainty about the market demand for diverse crop products can increase farmers’ reluctance to diversify (Ekepu and Tirivanhu, Reference Ekepu and Tirivanhu2016; Muoni et al., Reference Muoni, Barnes, Öborn, Watson, Bergkvist, Shiluli and Duncan2019). Interventions that reduce the cost of diversification, such as the provision of pigeon pea together with maize seeds during government input programmes, could help here (Funduluka et al., Reference Funduluka, Hachibamba, Mukuma, Bwembya, Keith, Kumwenda and Mwila2023; Jones et al., Reference Jones, Freeman and Monaco2002; Kumar et al., Reference Kumar, Surjit and Khan2018). By adopting such strategies, Zimbabwe could harness the potential of maize-pigeon pea strip cropping to contribute to sustainable agriculture and improved livelihoods for smallholder farmers.
Study limitations
While our findings provide important insights into the performance of diversified maize-legume systems under CA, several limitations should be acknowledged. The study was conducted at two sites over three seasons, which may not capture the full variability of Zimbabwean smallholder environments. Pigeon pea was treated as an annual crop to allow direct comparison with cowpea, but this approach does not reflect its full potential as a perennial species. In addition, calorie and protein contents were estimated using FAO standard conversion factors (FAO, 2001) rather than laboratory analyses, which may have limited precision in nutrient estimates. Longer-term, multi-site studies that incorporate perennial management of pigeon pea and accurate nutritional analyses could better capture the true potential of diversified maize-legume-based systems.
Conclusion
We found that diversifying maize-based cropping systems with legumes improved crop grain yields, calories, protein, crop biomass, and maize yield stability, under both fertilized and unfertilized conditions. Combining diversification and fertilization had the most potential to improve productivity for smallholder farmers in Zimbabwe. Among diversified cropping systems, the maize-pigeon pea strip crop performed best on average across outcomes, in contrast to the maize-cowpea systems, which offered relatively small improvements over the maize monoculture. This difference suggests that legume characteristics are important in determining the performance of diversification options. Diversifying maize-based cropping systems with the right legumes in the correct arrangements can improve the quantity and diversity of crop production for smallholder farming households. Neither pigeon pea nor strip cropping are currently common in Zimbabwe, but raising awareness of this cropping system could be an opportunity to help farmers increase their crop productivity.
Supplementary material
The supplementary material for this article can be found at https://doi.org/10.1017/S0014479726100386.
Data availability statement
The data underpinning this study are available on the CIMMYT Dataverse: https://doi.org/10.71682/10549322.
Acknowledgements
We thank the CIMMYT field staff at the Domboshava Training Centre and the University of Zimbabwe farm sites for their contributions to maintaining the experiments and collecting data.
Author contributions
BM = conceptualization; methodology; investigation; writing – original draft; CM = data curation, formal analysis, writing – review and editing; RC = conceptualization, supervision, writing – review and editing; CT = conceptualization, methodology, resources, funding acquisition, supervision, writing – review and editing.
Funding statement
This study was financially supported by the CGIAR initiatives ‘Ukama Ustawi: Diversification for resilient agribusiness ecosystems in East and Southern Africa and ‘Excellence in Agronomy‘, focused on improving productivity, sustainability, and resilience for smallholder farmers in the Global South. We also received support from ‘Africa Research in Sustainable Intensification for the Next Generation‘ of the U.S. Government’s Feed the Future initiative. CM was also supported by a Horizon Europe Marie Skłodowska-Curie Action Postdoctoral Fellowship (101063481, ‘EcoDiv’).
Competing interests
The authors declare that they have no conflicts of interest.







 Open access

