





Introduction
South China, endowed with favourable light, temperature, and water resources, is a core production base for high-quality indica rice in China, with a long-standing history of breeding and cultivating premium rice varieties (Zhou et al., Reference Zhou, Chen, Guo, Chen, Li, Chen, Chen, Liu and Zhang2022; Yang et al., Reference Yang, Wu, Zhang, Yang and Zou2025). Among these, Simiao rice stands out as a quintessential representative of high-quality indica rice native to the region, originating in Guangzhou City, Guangdong Province, celebrated for its slender grain shape, crystal-clear transparency, and distinctive flavour, Simiao rice occupies a prominent position in the high-end rice market. To standardize and promote the industry’s development, Guangdong Province established the Simiao Rice Industry Alliance in 2018 and formulated two group standards: Guangdong Simiao Rice Product Standard (Guangdong Seed Association, 2019a) and Guangdong Simiao Rice Variety Standard (Guangdong Seed Association, 2019b). Currently, 16 varieties have been certified under these standards (Guangdong Seed Association, 2019b), and due to their excellent rice quality and broad ecological adaptability, Simiao rice varieties have been widely cultivated across South China and the middle and lower reaches of the Yangtze River. With the ongoing trend of consumption upgrading and increasing market demand, the Simiao rice industry is expanding rapidly. However, to enhance its overall competitiveness, there is an urgent need to optimize the cultivation technology system for achieving both high grain yield and superior quality.
In South China, the double cropping rice system (early and late seasons) is a vital agricultural production model, making significant contributions to regional grain security (Cao et al., Reference Cao, Liu, Ma, Lu, Kong, Kong, Zhu, Zhu, Tian, Jin, Wu and Zhang2024). Simiao rice has strong adaptability and is widely cultivated in both cropping seasons, creating a dual-use production pattern in which the same varieties are grown for both early and late rice. Nevertheless, notable seasonal differences in climatic conditions exist: the early season is characterized by temperatures rising from low to high, while the late-season experiences a reverse trend of decreasing temperatures; additionally, sunshine duration and solar radiation intensity vary markedly between the two seasons (Yang et al., Reference Yang, Yang, Zeng, Wang, Xiong, Wu and Zhang2022; Liu et al., Reference Liu, Yang, Zou, Wu, Bao and Zhang2025).
These seasonal variations in light and temperature resources are known to alter rice’s efficiency in absorbing and utilizing nutrients, particularly nitrogen (N), thereby influencing yield component formation and grain quality development (Fu et al., Reference Fu, Zhong, Zeng, Liang, Pan, Xin, Liu, Hu, Peng, Chen, Hu and Huang2021; Liu et al., Reference Liu, Yang, Zou, Wu, Bao and Zhang2025). In addition to climatic factors, cultivation practices such as mechanical transplanting also influence N efficacy. Mechanical transplanting has emerged as a core modern cultivation technology for high-quality rice, offering advantages such as high operational efficiency, optimized population structure, and stable high yields (Hang et al., Reference Hang, Zhang, Song, Jiang, Deng, He, Lu and Zhang2014; Shan et al., Reference Shan, Jiang, Fang, Cao, Zhang, Chen, Yin, Tao, Lei, Huang and Zou2020). However, research on the effects of N application rates on the grain yield and quality of early-and late-season dual-use Simiao rice under mechanical transplanting remains insufficient. This knowledge gap severely limits the optimization and promotion of high-quality, high-yield cultivation techniques for Simiao rice.
Nitrogen is an essential nutrient for plant growth and development, playing a pivotal regulatory role in rice growth, panicle development, and grain filling (Zhou et al., Reference Zhou, Liang, Ponce, Marundon, Ye and Zhao2015; Cai et al., Reference Cai, Zhao, Pittelkow, Fan, Zhang and Yan2023). Therefore, scientific N management is critical for balancing high yield and high quality in rice production. Due to variations in ecological conditions, soil fertility, and cropping systems across China’s rice-growing regions, N application rates exhibit significant spatial heterogeneity (Yuan et al., Reference Yuan, Zhang, Cao, Zhu, Zhang and Wu2014; Cheng et al., Reference Cheng, Jiang and Cao2021). Numerous studies have demonstrated that optimized N application can enhance yield by regulating population structure, promoting tillering, increasing panicle number and spikelets per panicle, and coordinating source-sink relationships (Fu et al., Reference Fu, Wang, Zhang, Huang and Peng2019, Reference Fu, Zhong, Zeng, Liang, Pan, Xin, Liu, Hu, Peng, Chen, Hu and Huang2021; Zhang et al., Reference Zhang, Hou, Peng, Ma, Shao, Jing, Gu, Liu, Wang, Liu and Yang2019; Yan et al., Reference Yan, Xia and Ti2022; Zhou et al., Reference Zhou, Yuan, Zhang, Gu, Liu, Zhang, Wang and Yang2023).
Conversely, excessive N application deteriorates canopy ventilation and light penetration, increases the incidence of pests and diseases, elevates lodging risk, and ultimately leads to yield reduction (Peng et al., Reference Peng, Buresh, Huang, Zhong, Zou, Yang, Wang, Liu, Hu, Tang, Cui, Zhang and Dobermann2010; Zhang et al., Reference Zhang, Wang, Pan, Luo, Liu, Gu, Liu, Zhai, Lindsey, Zhang, Lei, Wu, Smith and Liu2018; Zhou et al., Reference Zhou, Yuan, Zhang, Gu, Liu, Zhang, Wang and Yang2023). In addition to grain yield, N management also profoundly affects rice quality, a comprehensive trait encompassing milling quality (brown rice rate, milled rice rate, and head rice rate) and appearance quality (chalky grain rate and chalkiness), which directly influence processing economic benefits and market acceptance, respectively (You et al., Reference You, Zafar, Zhang, Zhu, Chen, Shen, Zhao, Zhang and Xu2022). In South China’s high-quality rice market, head rice rate and chalkiness directly determine grade and price, yet their seasonal responses to N remain unclear. Appropriate N application can improve these quality traits by promoting the accumulation and translocation of photosynthetic products and optimizing grain-filling processes (Zhu et al., Reference Zhu, Zhang, Guo, Xu, Dai, Wei, Gao, Hu, Cui and Huo2017; Zhang et al., Reference Zhang, Zhang, Song, Chen, Sun, Peng, Huang and Zhao2021; Fei et al., Reference Fei, Yang, Ma, Lunzhu, Wang, Wang and Guo2023). However, N regulation of rice quality exhibits a threshold effect: excessive N not only fails to further improve quality but may also cause deterioration (Zhu et al., Reference Zhu, Zhang, Guo, Xu, Dai, Wei, Gao, Hu, Cui and Huo2017; Li et al., Reference Li, Shi, Cheng, Zhao, Pan, Cao and Jiang2023).
While previous studies have explored N management for single rice or double rice cultivation, limited attention has been paid to dual-use high-quality Simiao rice in double cropping systems (Gu et al., Reference Gu, Chen, Chen, Wang, Zhang and Yang2015; Zhang et al., Reference Zhang, Wang, Pan, Luo, Liu, Gu, Liu, Zhai, Lindsey, Zhang, Lei, Wu, Smith and Liu2018; Fu et al., Reference Fu, Wang, Zhang, Huang and Peng2019, Reference Fu, Zhong, Zeng, Liang, Pan, Xin, Liu, Hu, Peng, Chen, Hu and Huang2021; Liu et al., Reference Liu, Yang, Zou, Wu, Bao and Zhang2025). Furthermore, Simiao rice varieties exhibit significant differences in key quality traits such as low chalkiness, and their responses to N application, particularly across seasons, remain unclear. This lack of understanding hinders the development of precise N management strategies tailored to Simiao rice’s dual-season cultivation.
To address these research gaps, this study employed multiple representatives of early-and late-season dual-use Simiao rice varieties as experimental materials under mechanical transplanting conditions to systematically investigate the regulatory effects of different N application rates on their yield and quality. The specific objectives were (1) to evaluate the impacts of N application rates on grain yield, yield components, aboveground biomass, milling quality, and appearance quality of Simiao rice in both early and late seasons; (2) to clarify the seasonal differences and varietal responses of Simiao rice yield and quality traits to N application; and (3) to propose optimized N management strategies for synergistically improving the yield and quality of dual-use Simiao rice in South China. The findings of this study will provide a theoretical and practical basis for high-quality, high-yield Simiao rice production and the precise application of N fertilizers in the double cropping rice region of South China.
Materials and methods
Experimental site
Field experiments were conducted in 2022 and 2023 at the Baiyun Base of the Guangdong Academy of Agricultural Sciences (113.4° E, 23.4° N), located in the South Asian subtropical monsoon climate zone. The daily average temperature, precipitation, and sunshine hours during the rice growing seasons in 2022 and 2023 are shown in Figure S1. Before the experiment in 2022, soil samples (0–15 cm) were collected and analysed for basic physicochemical properties, which were as follows: pH 5.5, organic matter content 22.3 g kg−1, and total nitrogen content 1.2 g kg−1.
Experiment design
The experiment adopted a two-factor split-plot design with three replicates. The main plot factor was N application rate, set at three levels: N1 (105 kg ha−1), N2 (135 kg ha−1), and N3 (165 kg ha−1). The subplot factor was rice variety, with 8 varieties tested in both early and late seasons of 2022, and 6 varieties tested in the same two seasons of 2023.
In 2022, the tested Simiao rice varieties for both early and late seasons included Meixiangzhan2 (MXZ2), Gengxiangyoulisimiao (GXYLSM), Hengfengyouyouxiang (HFYYX), Qingxiangyou19xiang (QXY19X), 19 Xiang (19X), Taixiang812 (TX812), Xiangzhuxiangsimiao (XZXSM), and Xiangxiuzhan (XXZ). In 2023, the varieties evaluated in both early and late seasons were GXYLSM, HFYYX, QXY19X, 19X, XZXSM, and XXZ.
Field management
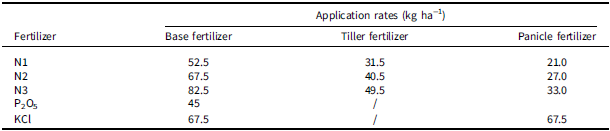
Seedlings were raised using nursery substrate and transplanted mechanically. Transplanting was performed with a row spacing of 30 cm and a hill spacing of 14 cm, with 2–4 seedlings per hill. Nitrogen fertilizer was applied as urea (containing 46.4% N), phosphorus fertilizer as single superphosphate (containing 12% P2O5), and potassium fertilizer as potassium chloride (containing 60% KCl). The basal fertilizer was applied on the day of transplanting, tillering fertilizer was applied seven days after transplanting, and panicle fertilizer was applied during the second stage of panicle differentiation. The application rates of fertilizers at each stage are detailed in Table 1. The rice growth calendar is presented in Table S1. Water management and pest, disease, and weed control during the rice growing season were conducted using local high-yield cultivation techniques.
Specific fertilizer application rates

Table 1. Long description
A table detailing fertilizer application rates at different stages of rice growth. The table has 5 rows and 4 columns. The columns are labeled ʼFertilizerʼ, ʼBase fertilizerʼ, ʼTiller fertilizerʼ, and ʼPanicle fertilizerʼ, with application rates given in kilograms per hectare (kg ha^-1). The fertilizers listed are N1, N2, N3, P2O5, and KCl. Row 1: N1, Base fertilizer 52.5, Tiller fertilizer 31.5, Panicle fertilizer 21.0. Row 2: N2, Base fertilizer 67.5, Tiller fertilizer 40.5, Panicle fertilizer 27.0. Row 3: N3, Base fertilizer 82.5, Tiller fertilizer 49.5, Panicle fertilizer 33.0. Row 4: P2O5, Base fertilizer 45, Tiller fertilizer not applicable, Panicle fertilizer 33.0. Row 5: KCl, Base fertilizer 67.5, Tiller fertilizer not applicable, Panicle fertilizer 67.5.
N1, N2, and N3 denote N application rates of 105, 135, and 165 kg ha−1, respectively.
Aboveground biomass
At the heading and maturity stages, six representative rice hills per subplot were sampled based on the average panicle number. The roots were carefully removed, and the samples were thoroughly washed. Subsequently, the samples were oven-dried at 105 °C for 30 minutes to deactivate enzymes, followed by drying at 70 °C until constant weight was achieved.
Leaf SPAD value
At the heading stage of late rice in 2023, tillers with uniform growth and synchronized panicle emergence were selected and labelled. Twenty labelled tillers per subplot were monitored for subsequent measurements. At three time points (heading stage, 10 days after heading, and 20 days after heading), the SPAD values of the flag leaf, second leaf, and third leaf were measured using a portable chlorophyll metre (SPAD 502Plus, Konica Minolta, Tokyo, Japan). For each leaf, the measurement was taken at the midpoint of the leaf blade, carefully avoiding the main vein. At this position, three consecutive readings were recorded by slightly repositioning the metre each time, and the average of the three readings was used as the SPAD value for that leaf. The mean SPAD value per leaf position (flag leaf, second leaf, and third leaf) was then calculated across the 20 labelled tillers for statistical analysis.
Grain-filling parameters
At the heading stage of early rice in 2023, panicles with uniform growth and synchronized emergence were selected and labelled. Approximately 50 panicles per subplot were marked for subsequent sampling. At 5, 10, 15, 20, and 25 days after heading, six panicles per subplot were collected and divided into superior and inferior grains according to the method described by Dou et al. (Reference Dou, Tang, Li, Liu, Ding, Chen, Wang and Ding2017). Empty and diseased grains were removed. Samples were then oven-dried at 70 °C until constant weight, after which mean grain weight was determined.
The grain-filling process was modelled using the three-parameter logistic equation (Shi et al., Reference Shi, Muthurajan, Rahman, Selvam, Peng, Zou and Jagadish2013):
 $y={K \over 1+e^{a-bx}}$
where y = measured grain weight (mg); x = days after heading (d); K = final grain weight (mg); and a, b = regression coefficients.
Key grain-filling parameters were derived as follows:
Initial grain-filling rate (GR0):
 $GR_{0}={Kbe^{a} \over (1+{e^{a}})^{2}}$
Maximum grain-filling rate (GRmax):
 $GR_{max}={Kb \over 4}$
Mean grain-filling rate (GRmean):
 $GR_{mean}={Kb \over a-{ln} \left(100/ 99+1\right)}$
Time to reach maximum rate (Tmax):
 $T_{max}={a \over b}$
Active grain-filling duration (D):
 $D={2.994+a \over b}$
Grain yield and yield components
At maturity in both early and late seasons, 50 hills of rice were surveyed in each subplot. Based on the average panicle number, six hills were sampled, manually threshed, and the grains were counted using a seed analyser (Wanshen SC-G, Wanshen Testing Technology Co., Ltd., Hangzhou, China). Spikelets per panicle, total spikelets, filled grain percentage, and grain weight were calculated. An additional 100 hills per subplot were harvested, threshed, and naturally air-dried. Grain yield was calculated and adjusted to a moisture content of 13.5%.
Milling and appearance quality
After storage in a cool, dry environment for three months, the harvested grain was evaluated for milling and appearance quality according to the Chinese National Standard GB/T 17891–2017 (National Standardization Management Committee, 2017). The grain was first dehusked using a husker and then milled with a rice polisher to obtain milled rice. Head rice rate, chalkiness, and chalky grain rate were determined using a grain quality analyser and its supporting software (Wanshen C-E, Wanshen Testing Technology Co., Ltd., Hangzhou, China).
Statistics and analysis
A two-way analysis of variance was performed to assess the effects of variety and N fertilizer treatment on grain yield, yield components, aboveground biomass, milling quality, and appearance quality. All data were analysed using IBM SPSS Statistics version 20.0.
Results
Grain yield and yield components
The effects of N application rate on grain yield of Simiao rice showed significant seasonal differences (Figures 1 and 2). For early rice, no significant differences in average grain yield across tested varieties were observed among the N1, N2, and N3 treatments in either 2022 or 2023 (Figures 1A and 2A). In contrast, late rice grain yield across varieties showed a clear increasing trend with increasing N application rate (Figures 1G and 2G). Specifically, in 2022, the average grain yield under N1 was 5.83 Mg ha−1, which was 11.8% and 16.3% lower than that under N2 (6.52 Mg ha−1) and N3 (6.78 Mg ha−1), respectively. In 2023, the average grain yield under N1 was 5.60 Mg ha−1, representing a 6.2% and 11.3% reduction compared to N2 (5.95 Mg ha−1) and N3 (6.24 Mg ha−1), respectively.
Grain yield and yield components in 2022 as affected by N application rate. Panels A–F represent data for early rice, while panels G–L represent those for late rice. N1, N2, and N3 denote N application rates of 105, 135, and 165 kg ha−1, respectively. Error bars represent the standard deviation. Different lowercase letters indicate significant differences among treatments at p < 0.05 according to the LSD test (n = 24). The horizontal line inside each box represents the mean value, while the top and bottom edges of the box correspond to the upper and lower quartiles, respectively.

Figure 1. Long description
Multiple graphs depict the effects of nitrogen application rates on grain yield and yield components for early and late rice. The graphs include box plots and line graphs. Panels A to F represent data for early rice, while panels G to L represent data for late rice. N1, N2, and N3 denote nitrogen application rates of 105, 135, and 165 kg per hectare, respectively. Error bars represent the standard deviation. Different lowercase letters indicate significant differences among treatments at p < 0.05 according to the LSD test (n = 24). The horizontal line inside each box represents the mean value, while the top and bottom edges of the box correspond to the upper and lower quartiles, respectively. Panel A: A box plot shows grain yield in megagrams per hectare for early rice across different nitrogen application rates. Panel B: A box plot displays the number of panicles per square meter for early rice. Panel C: A box plot illustrates the number of spikelets per panicle for early rice. Panel D: A box plot presents the total number of spikelets per square meter for early rice. Panel E: A box plot shows the filled grain percentage for early rice. Panel F: A box plot depicts grain weight in milligrams for early rice. Panel G: A box plot shows grain yield in megagrams per hectare for late rice across different nitrogen application rates. Panel H: A box plot displays the number of panicles per square meter for late rice. Panel I: A box plot illustrates the number of spikelets per panicle for late rice. Panel J: A box plot presents the total number of spikelets per square meter for late rice. Panel K: A box plot shows the filled grain percentage for late rice. Panel L: A box plot depicts grain weight in milligrams for late rice.
Grain yield and yield components in 2023 as affected by N application rate. Panels A–F represent data for early rice, while panels G–L represent those for late rice. N1, N2, and N3 denote N application rates of 105, 135, and 165 kg ha−1, respectively. Error bars represent the standard deviation. Different lowercase letters indicate significant differences among treatments at p < 0.05 according to the LSD test (n = 18). The horizontal line inside each box represents the mean value, while the top and bottom edges of the box correspond to the upper and lower quartiles, respectively.

For early rice, no significant differences were detected in the average panicle number, total spikelets, filled grain percentage, or grain weight across tested varieties among N treatments in both 2022 and 2023 (Figures 1B, D–F and 2B, D–F), with the exception of a significant difference in the average spikelets per panicle in 2022 (Figure 1C). For late rice in 2022, significant differences among N treatments were observed in the average panicle number, spikelets per panicle, total spikelets, and grain weight across tested varieties, whereas no such difference was found in the filled grain percentage (Figure 1H–L). For late rice in 2023, only the average panicle number and total spikelets across tested varieties exhibited significant differences among N treatments (Figure 2H–L).
Specifically, relative to N1, the average panicle number across tested varieties under N2 and N3 for late rice was significantly elevated by 9.0% and 11.2% in 2022 and by 5.4% and 9.8% in 2023, respectively (Figures 1H and 2H). Similarly, compared with N1, the average total spikelets across tested varieties under N2 and N3 were significantly increased by 11.9% and 17.3% in 2022 and by 5.2% and 9.8% in 2023, respectively (Figures 1J and 2J). Additionally, the average spikelets per panicle across tested varieties under N3 were 5.0% higher than that under N1 for late rice in 2022 (Figure 1I). In addition, Pearson correlation analysis indicated that grain yield of late rice was significantly positively correlated with total spikelets in both 2022 (P < 0.01) and 2023 (P < 0.05) (Figure 3A, B).
Pearson correlations among grain yield, total spikelets, and aboveground biomass of late rice (n = 72 in 2022, n = 54 in 2023). *and **indicate significant correlations at p < 0.05 and highly significant correlations at p < 0.01, respectively.

Figure 3. Long description
The image contains six scatter plots showing the relationships between grain yield, total spikelets, and aboveground biomass of late rice for the years 2022 and 2023. Panel A: A scatter plot for 2022 showing the relationship between grain yield (Mg ha^-1) and total spikelet (10^3 m^-2). The x-axis ranges from 20 to 60, and the y-axis ranges from 4.0 to 9.0. The linear regression equation is y = 0.109x + 1.806 with a correlation coefficient of r = 0.701, indicating a significant correlation. Panel B: A scatter plot for 2023 showing the relationship between grain yield (Mg ha^-1) and total spikelet (10^3 m^-2). The x-axis ranges from 30 to 50, and the y-axis ranges from 4.0 to 8.0. The linear regression equation is y = 0.046x + 4.186 with a correlation coefficient of r = 0.304, indicating a significant correlation. Panel C: A scatter plot for 2022 Heading showing the relationship between grain yield (Mg ha^-1) and aboveground biomass (Mg ha^-1). The x-axis ranges from 7 to 14, and the y-axis ranges from 4.0 to 9.0. The linear regression equation is y = 0.672x - 0.766 with a correlation coefficient of r = 0.829, indicating a highly significant correlation. Panel D: A scatter plot for 2023 Heading showing the relationship between grain yield (Mg ha^-1) and aboveground biomass (Mg ha^-1). The x-axis ranges from 7 to 11, and the y-axis ranges from 4.0 to 8.0. The linear regression equation is y = 0.477x + 1.695 with a correlation coefficient of r = 0.671, indicating a highly significant correlation. Panel E: A scatter plot for 2022 Maturity showing the relationship between grain yield (Mg ha^-1) and aboveground biomass (Mg ha^-1). The x-axis ranges from 7 to 15, and the y-axis ranges from 4.0 to 9.0. The linear regression equation is y = 0.608x - 0.902 with a correlation coefficient of r = 0.893, indicating a highly significant correlation. Panel F: A scatter plot for 2023 Maturity showing the relationship between grain yield (Mg ha^-1) and aboveground biomass (Mg ha^-1). The x-axis ranges from 9 to 14, and the y-axis ranges from 4.0 to 8.0. The linear regression equation is y = 0.480x + 0.366 with a correlation coefficient of r = 0.822, indicating a highly significant correlation.
Aboveground biomass
Aboveground biomass of Simiao rice was significantly affected by N application rate and growing season (Figures 4 and 5). For early rice, average aboveground biomass across varieties at heading and maturity showed no significant difference among N either in 2022 or 2023 (Figures 4A, B and 5A, B). In contrast, for late rice, the aboveground biomass of tested varieties at heading and maturity showed an increasing trend with increasing N application rate in both 2022 and 2023 (Figures 4C, D and 5C, D). Specifically, in 2022, compared to N1, the aboveground biomass under N2 and N3 increased significantly by 5.5% and 10.8% at heading and by 10.2% and 14.3% at maturity, respectively (Figures 4C, D). Similarly, in 2023, compared to N1, the aboveground biomass under N2 and N3 increased by 4.7% and 7.1% at heading and by 5.5% and 9.7% at maturity, respectively (Figure 5C, D). In addition, Pearson correlation analysis indicated that grain yield of late rice was significantly positively correlated with aboveground biomass at heading in 2022 (P < 0.01) and 2023 (P < 0.01) (Figure 3C, D) and with aboveground biomass at maturity in 2022 (P < 0.01) and 2023 (P < 0.01) (Figure 3E, F).
Aboveground biomass in 2022 as affected by N application rate. Panels A and B represent data for early rice, while panels C and D represent those for late rice. N1, N2, and N3 denote N application rates of 105, 135, and 165 kg ha−1, respectively. Error bars represent the standard deviation. Different lowercase letters indicate significant differences among treatments at p < 0.05 according to the LSD test (n = 24). The horizontal line inside each box represents the mean value, while the top and bottom edges of the box correspond to the upper and lower quartiles, respectively.

Aboveground biomass in 2023 as affected by N application rate. Panels A and B represent data for early rice, while panels C and D represent those for late rice. N1, N2, and N3 denote N application rates of 105, 135, and 165 kg ha−1, respectively. Error bars represent the standard deviation. Different lowercase letters indicate significant differences among treatments at p < 0.05 according to the LSD test (n = 18). The horizontal line inside each box represents the mean value, while the top and bottom edges of the box correspond to the upper and lower quartiles, respectively.

Milling and appearance quality
In both 2022 and 2023, the average milled rice rate across varieties showed no significant differences among N treatments in either season (Figures 6A, E and 7A, E). In contrast, the average head rice rate across varieties exhibited distinct seasonal responses to N application (Figures 6B, F and 7B, F). For early rice, the head rice rate increased significantly with increasing N application rate in both years. Specifically, compared to N1, the average head rice rate under N2 and N3 increased significantly by 1.0 and 1.9 percentage points in 2022 and by 1.4 and 2.7 percentage points in 2023, respectively (Figures 6B and 7B). For late rice, N application rate exerted no significant effect on head rice rate in either year (Figures 6F and 7F). Notably, varietal differences in head rice rate were prominent in early rice in both years: varieties MXZ2, GXYLSM, HFYYX, and QXY19X showed a more pronounced increase in head rice rate with increasing N application rate, while varieties 19X, TX812, XZXSM, and XXZ maintained high head rice rates across all N treatments with no significant changes (Figures 6B and 7B).
Milled rice rate, head rice rate, chalky grain rate, and chalkiness in 2022 as affected by N application rate. Panels A–D represent data for early rice, while panels E–H represent those for late rice. N1, N2, and N3 denote N application rates of 105, 135, and 165 kg ha−1, respectively. Error bars represent the standard deviation. Different lowercase letters indicate significant differences among treatments at p < 0.05 according to the LSD test (n = 24). The horizontal line inside each box represents the mean value, while the top and bottom edges of the box correspond to the upper and lower quartiles, respectively.

Figure 6. Long description
Panel A: A box-and-whisker plot showing the milled rice rate for early rice. The horizontal axis represents nitrogen application rates (N1, N2, N3) with values 105, 135, and 165 kg per hectare respectively. The vertical axis represents the milled rice rate in percent, ranging from 62 to 72 percent. Each box plot shows the distribution of milled rice rates for different nitrogen application rates. The boxes are vertical and include markers for the median, lower quartile, and upper quartile. Whiskers extend to the minimum and maximum values, and outliers are indicated by individual points. Different lowercase letters indicate significant differences among treatments at p < 0.05 according to the LSD test. Panel B: A box-and-whisker plot showing the head rice rate for early rice. The horizontal axis represents nitrogen application rates (N1, N2, N3) with values 105, 135, and 165 kg per hectare respectively. The vertical axis represents the head rice rate in percent, ranging from 35 to 55 percent. Each box plot shows the distribution of head rice rates for different nitrogen application rates. The boxes are vertical and include markers for the median, lower quartile, and upper quartile. Whiskers extend to the minimum and maximum values, and outliers are indicated by individual points. Different lowercase letters indicate significant differences among treatments at p < 0.05 according to the LSD test. Panel C: A box-and-whisker plot showing the chalky grain rate for early rice. The horizontal axis represents nitrogen application rates (N1, N2, N3) with values 105, 135, and 165 kg per hectare respectively. The vertical axis represents the chalky grain rate in percent, ranging from 8 to 40 percent. Each box plot shows the distribution of chalky grain rates for different nitrogen application rates. The boxes are vertical and include markers for the median, lower quartile, and upper quartile. Whiskers extend to the minimum and maximum values, and outliers are indicated by individual points. Different lowercase letters indicate significant differences among treatments at p < 0.05 according to the LSD test. Panel D: A box-and-whisker plot showing the chalkiness for early rice. The horizontal axis represents nitrogen application rates (N1, N2, N3) with values 105, 135, and 165 kg per hectare respectively. The vertical axis represents the chalkiness in percent, ranging from 4 to 16 percent. Each box plot shows the distribution of chalkiness for different nitrogen application rates. The boxes are vertical and include markers for the median, lower quartile, and upper quartile. Whiskers extend to the minimum and maximum values, and outliers are indicated by individual points. Different lowercase letters indicate significant differences among treatments at p < 0.05 according to the LSD test. Panel E: A box-and-whisker plot showing the milled rice rate for late rice. The horizontal axis represents nitrogen application rates (N1, N2, N3) with values 105, 135, and 165 kg per hectare respectively. The vertical axis represents the milled rice rate in percent, ranging from 66 to 74 percent. Each box plot shows the distribution of milled rice rates for different nitrogen application rates. The boxes are vertical and include markers for the median, lower quartile, and upper quartile. Whiskers extend to the minimum and maximum values, and outliers are indicated by individual points. Different lowercase letters indicate significant differences among treatments at p < 0.05 according to the LSD test. Panel F: A box-and-whisker plot showing the head rice rate for late rice. The horizontal axis represents nitrogen application rates (N1, N2, N3) with values 105, 135, and 165 kg per hectare respectively. The vertical axis represents the head rice rate in percent, ranging from 50 to 70 percent. Each box plot shows the distribution of head rice rates for different nitrogen application rates. The boxes are vertical and include markers for the median, lower quartile, and upper quartile. Whiskers extend to the minimum and maximum values, and outliers are indicated by individual points. Different lowercase letters indicate significant differences among treatments at p < 0.05 according to the LSD test. Panel G: A box-and-whisker plot showing the chalky grain rate for late rice. The horizontal axis represents nitrogen application rates (N1, N2, N3) with values 105, 135, and 165 kg per hectare respectively. The vertical axis represents the chalky grain rate in percent, ranging from 8 to 18 percent. Each box plot shows the distribution of chalky grain rates for different nitrogen application rates. The boxes are vertical and include markers for the median, lower quartile, and upper quartile. Whiskers extend to the minimum and maximum values, and outliers are indicated by individual points. Different lowercase letters indicate significant differences among treatments at p < 0.05 according to the LSD test. Panel H: A box-and-whisker plot showing the chalkiness for late rice. The horizontal axis represents nitrogen application rates (N1, N2, N3) with values 105, 135, and 165 kg per hectare respectively. The vertical axis represents the chalkiness in percent, ranging from 2 to 8 percent. Each box plot shows the distribution of chalkiness for different nitrogen application rates. The boxes are vertical and include markers for the median, lower quartile, and upper quartile. Whiskers extend to the minimum and maximum values, and outliers are indicated by individual points. Different lowercase letters indicate significant differences among treatments at p < 0.05 according to the LSD test.
Milled rice rate, head rice rate, chalky grain rate, and chalkiness in 2023 as affected by N application rate. Panels A–D represent data for early rice, while panels E–H represent those for late rice. N1, N2, and N3 denote N application rates of 105, 135, and 165 kg ha−1, respectively. Error bars represent the standard deviation. Different lowercase letters indicate significant differences among treatments at p < 0.05 according to the LSD test (n = 18). The horizontal line inside each box represents the mean value, while the top and bottom edges of the box correspond to the upper and lower quartiles, respectively.

Chalky grain rate and chalkiness exhibited significant seasonal differences in response to N application across both years (Figures 6C, D, G, H and 7C, D, G, H). For early rice, the average chalky grain rate and chalkiness across varieties decreased significantly with increasing N application rate (Figures 6C, D and 7C, D). Specifically, compared to N1, the average chalky grain rate under N2 and N3 decreased significantly by 1.3 and 2.4 percentage points in 2022 and by 1.4 and 2.6 percentage points in 2023, respectively (Figures 6C and 7C). The average chalkiness under N2 and N3, relative to N1, decreased significantly by 0.6 and 1.5 percentage points in 2022 and by 0.7 and 1.3 percentage points in 2023, respectively (Figures 6D and 7D). Furthermore, the responses of chalky grain rate and chalkiness to N application exhibited significant varietal differences in early rice (Figures 6C, D and 7C, D). For varieties MXZ2, GXYLSM, HFYYX, and QXY19X, both chalky grain rate and chalkiness decreased with increasing N application rate. For varieties 19X, TX812, XZXSM, and XXZ, chalky grain rate and chalkiness remained consistently low across N treatments with no significant differences observed. For late rice, N application rate had no significant effect on average chalky grain rate or chalkiness in both years (Figures 6G, H and 7G, H).
Pearson correlation analysis indicated that the head rice rate of early rice was significantly negatively correlated with chalky grain rate (P < 0.01) and chalkiness (P < 0.01) in 2022 (Figure 8A, C), as well as with chalky grain rate (P < 0.01) and chalkiness (P < 0.01) in 2023 (Figure 8B, D).
Pearson correlations among head rice rate, chalky grain rate, and chalkiness of early rice season (n = 36 in 2022, n = 27 in 2023). *and ** indicate significant correlations at p < 0.05 and highly significant correlations at p < 0.01, respectively.

Leaf SPAD value of late rice and grain-filling parameters of early rice
Leaf SPAD value of late rice was significantly affected by the N application rate in 2023 (Figure 9). For late rice, the SPAD value of all tested varieties at the grain-filling stage increased with increasing N application rate: N3 treatments had the highest SPAD value, followed by N2 and N1.
Leaf SPAD values of late rice in 2023 as affected by N application rate. N1, N2, and N3 denote N application rates of 105, 135, and 165 kg ha−1, respectively. Error bars represent the standard deviation (n = 3).

Figure 9. Long description
Six line graphs depict the leaf SPAD values of late rice in 2023 affected by different nitrogen application rates. Each graph represents a different rice variety: GXYLSM, HFYYX, QXY19X, 19X, XZXSM, and XXZ. The x-axis represents days after heading (d) with values at 0, 10, and 20 days. The y-axis represents SPAD values ranging from 30 to 45. Each graph includes three lines representing different nitrogen application rates: N1 (105 kg ha^-1), N2 (135 kg ha^-1), and N3 (165 kg ha^-1). Error bars represent the standard deviation (n = 3). Panel A: GXYLSM shows SPAD values increasing initially and then decreasing for all nitrogen rates, with N3 having the highest values. Panel B: HFYYX shows a similar trend with N3 having the highest SPAD values. Panel C: QXY19X shows a slight increase and then a decrease in SPAD values, with N3 having the highest values. Panel D: 19X shows a peak at 10 days and then a decrease, with N3 having the highest values. Panel E: XZXSM shows a decrease in SPAD values over time, with N3 having the highest values. Panel F: XXZ shows an increase and then a decrease in SPAD values, with N3 having the highest values. Overall, higher nitrogen application rates tend to result in higher SPAD values across all rice varieties.
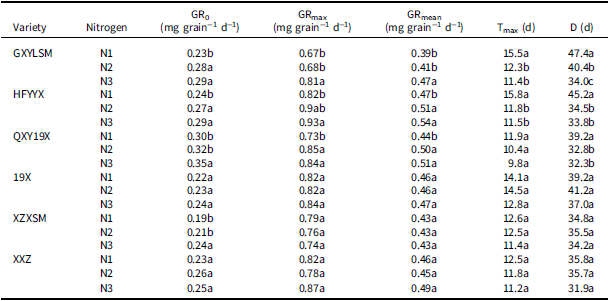
For early rice, the grain-filling parameters of inferior spikelets were affected by N application rates, particularly in varieties GXYLSM, HFYYX, and QXY19X (Table 2). In these responsive varieties, increased N application resulted in higher GR0, GRmax, and GRmean, while shortening the Tmax and D. In contrast, the grain-filling parameters of 19X, XZXSM, and XXZ remained largely unaffected by N application (Table 2).
Grain-filling parameters of inferior spikelets in early rice as affected by N application rate in 2023

Table 2. Long description
The table presents grain-filling parameters of inferior spikelets in early rice varieties affected by nitrogen application rates. It includes data for six varieties: GXYLSM, HFYYX, QXY19X, 19X, XZXSM, and XXZ. The table has six columns: Variety, Nitrogen, GR0 (mg grain⁻¹ d⁻¹), GRmax (mg grain⁻¹ d⁻¹), GRmean (mg grain⁻¹ d⁻¹), Tmax (d), and D (d). Each variety is tested under three nitrogen levels (N1, N2, N3). Row-wise data: Row 1: GXYLSM, N1, 0.23b, 0.67b, 0.39b, 15.5a, 47.4a. Row 2: GXYLSM, N2, 0.28a, 0.68b, 0.41b, 12.3b, 40.4b. Row 3: GXYLSM, N3, 0.29a, 0.81a, 0.47a, 11.4b, 34.0c. Row 4: HFYYX, N1, 0.24b, 0.82b, 0.47b, 15.8a, 45.2a. Row 5: HFYYX, N2, 0.27a, 0.9ab, 0.51a, 11.8b, 34.5b. Row 6: HFYYX, N3, 0.29a, 0.93a, 0.54a, 11.5b, 33.8b. Row 7: QXY19X, N1, 0.30b, 0.73b, 0.44b, 11.9a, 39.2a. Row 8: QXY19X, N2, 0.32b, 0.85a, 0.50a, 10.4a, 32.8b. Row 9: QXY19X, N3, 0.35a, 0.84a, 0.51a, 9.8a, 32.3b. Row 10: 19X, N1, 0.22a, 0.82a, 0.46a, 14.1a, 39.2a. Row 11: 19X, N2, 0.23a, 0.82a, 0.46a, 14.5a, 41.2a. Row 12: 19X, N3, 0.24a, 0.84a, 0.47a, 12.8a, 37.0a. Row 13: XZXSM, N1, 0.19b, 0.79a, 0.43a, 12.6a, 34.8a. Row 14: XZXSM, N2, 0.21b, 0.76a, 0.43a, 12.5a, 35.5a. Row 15: XZXSM, N3, 0.24a, 0.74a, 0.43a, 11.4a, 34.2a. Row 16: XXZ, N1, 0.23a, 0.82a, 0.46a, 12.5a, 35.8a. Row 17: XXZ, N2, 0.26a, 0.78a, 0.45a, 11.8a, 35.7a. Row 18: XXZ, N3, 0.25a, 0.87a, 0.49a, 11.2a, 31.9a. The table shows how different nitrogen application rates affect the grain-filling parameters of various rice varieties.
N1, N2, and N3 denote N application rates of 105, 135, and 165 kg h a−1, respectively. GR0, initial grain-filling rate; GRmax, maximum grain-filling rate; GRmean, mean grain-filling rate; Tmax, time to reach the maximum grain-filling rate; D, active grain-filling period. Different lowercase letters indicate significant differences among treatments at p < 0.05 according to the LSD test (n = 3).
Discussion
Increasing N application rates enhanced the grain yield of Simiao rice in the late season
The effect of N fertilizer on rice grain yield has long been reported to be inconsistent in existing studies. Most studies have indicated that appropriately increasing N application rates can effectively improve rice grain yield (Pan et al., Reference Pan, Liu, Zhong, Lampayan, Singleton, Huang, Liang, Peng and Tian2017; Zhu et al., Reference Zhu, Zhang, Guo, Xu, Dai, Wei, Gao, Hu, Cui and Huo2017; Qiao et al., Reference Qiao, Wang, Zhao, Zhou, Schwenke, Yan and Liu2022), while several other studies have highlighted that the yield response of rice to N fertilizer is not universal but is significantly influenced by seasonal variations and varietal genetic characteristics (Gu et al., Reference Gu, Chen, Chen, Wang, Zhang and Yang2015; Fu et al., Reference Fu, Wang, Zhang, Huang and Peng2019; Zhang et al., Reference Zhang, Wang, Pan, Luo, Liu, Gu, Liu, Zhai, Lindsey, Zhang, Lei, Wu, Smith and Liu2018). The results of this study further verified the latter conclusion, showing that the effect of N application rates on Simiao rice grain yield exhibited striking seasonal differences (Figures 1A, G and 2A, G). Specifically, increasing N application rates had no significant promoting effect on the grain yield of early rice (Figures 1A and 2A), and from the sole perspective of yield formation, an N application rate of 105 kg ha−1 was sufficient to meet the normal growth and development needs of early rice. Higher N inputs (135 kg ha−1 or 165 kg ha−1) not only failed to contribute to further yield increases but also might bring potential risks of environmental pollution such as N leaching and runoff (Peng et al., Reference Peng, Buresh, Huang, Zhong, Zou, Yang, Wang, Liu, Hu, Tang, Cui, Zhang and Dobermann2010; Cai et al., Reference Cai, Zhao, Pittelkow, Fan, Zhang and Yan2023). In contrast, the grain yield of late rice increased significantly with the increase in N application rates (Figures 1G and 2G), and a higher N application rate (165 kg ha−1) was necessary to achieve the maximum grain yield potential of late rice, which underscores the necessity of season-specific N management practices.
Rice grain yield is jointly determined by the interaction of four yield components: panicle number, spikelets per panicle, filled grain percentage, and grain weight. As an essential macronutrient for rice growth and development, N ultimately regulates rice grain yield by modulating these key yield components (Sepaskhah and Barzegar, Reference Sepaskhah and Barzegar2010; Pan et al., Reference Pan, Liu, Zhong, Lampayan, Singleton, Huang, Liang, Peng and Tian2017; Tegeder and Masclaux-Daubresse, Reference Tegeder and Masclaux-Daubresse2018). Existing studies have consistently shown that the yield-increasing effect of higher N application rates is mainly achieved by increasing panicle number and spikelets per panicle (Pan et al., Reference Pan, Liu, Zhong, Lampayan, Singleton, Huang, Liang, Peng and Tian2017; Zhu et al., Reference Zhu, Zhang, Guo, Xu, Dai, Wei, Gao, Hu, Cui and Huo2017; Fu et al., Reference Fu, Wang, Zhang, Huang and Peng2019), and this study obtained consistent results in late rice. In this study, N application rates had no significant regulatory effect on nearly all yield components of early rice (Figures 1B–F and 2B–F), while high N application rates significantly increased the total spikelets of late rice (Figures 1J and 2J), a key yield-determining index, by increasing panicle number and spikelets per panicle (Figures 1H, I and 2H). Correlation analysis further confirmed that the grain yield of late rice was significantly positively correlated with total spikelets (Figure 3A, B), indicating that the increase in total spikelets is the core physiological basis for the significant yield increase of late rice under high N conditions.
Aboveground biomass accumulation is a critical physiological determinant of rice yield formation, and appropriate increases in N supply can effectively promote the aboveground biomass production of rice, thereby laying a solid material foundation for high grain yield (Pan et al., Reference Pan, Liu, Zhong, Lampayan, Singleton, Huang, Liang, Peng and Tian2017; Zhou et al., Reference Zhou, Yuan, Zhang, Gu, Liu, Zhang, Wang and Yang2023). In line with the grain yield response trend, the aboveground biomass accumulation of early rice at both heading and maturity stages remained unaffected by N application rates (Figures 4A, B and 5A, B), while that of late rice increased significantly with the increase in N application rates (Figures 4C, D and 5C, D). Moreover, the aboveground biomass of late rice at heading and maturity stages was significantly positively correlated with grain yield (Figure 3C–F), which fully demonstrated that the enhanced aboveground biomass production capacity of late rice under high N fertilization is another key factor driving its high yield. Additionally, we observed that leaf SPAD values of late rice during the heading and grain-filling stages showed an increasing trend with higher N application rates (Figure 9), indicating improved N status in rice plants for assimilate production (Yang et al., Reference Yang, Yang, Li and Liu2018), which further corroborates the higher yield potential of late rice under adequate N supply.
This seasonal discrepancy is largely driven by differences in climatic conditions. As shown in Figure S1, the early rice growing season is characterized by lower daily average temperatures and higher cumulative rainfall before heading, as well as reduced sunshine hours compared to the late season. These conditions may limit photosynthetic efficiency and N uptake/utilization (Zhou et al., Reference Zhou, Li, Cao, Li, Huang and Peng2018; Fu et al., Reference Fu, Zhong, Zeng, Liang, Pan, Xin, Liu, Hu, Peng, Chen, Hu and Huang2021), offsetting the potential benefits of higher N application and leading to no significant gains in biomass or grain yield. In contrast, the late-season features higher daily average temperatures before heading and abundant sunshine hours during grain filling (Figure S1), which may create optimal conditions for N absorption, photosynthesis, and biomass accumulation (Fu et al., Reference Fu, Zhong, Zeng, Liang, Pan, Xin, Liu, Hu, Peng, Chen, Hu and Huang2021; Liu et al., Reference Liu, Yang, Zou, Wu, Bao and Zhang2025).
Increasing N application rates improved the milling and appearance quality of Simiao rice in the early season
Rice milling and appearance quality are core indicators of the commercial value and market competitiveness of rice products. They directly affect consumer preferences and the economic benefits of rice production (You et al., Reference You, Zafar, Zhang, Zhu, Chen, Shen, Zhao, Zhang and Xu2022). For the regulatory effect of N application on head rice rate, a key milling quality index, existing studies have presented inconsistent conclusions: many studies have reported that appropriate increases in N application rates can effectively enhance the head rice rate of rice (Zhu et al., Reference Zhu, Zhang, Guo, Xu, Dai, Wei, Gao, Hu, Cui and Huo2017; Zhang et al., Reference Zhang, Zhang, Song, Chen, Sun, Peng, Huang and Zhao2021), while other studies have found no significant effect of N application on head rice rate and emphasized that the response of rice milling quality to N fertilizer has substantial seasonal and genotypic variations (Gu et al., Reference Gu, Chen, Chen, Wang, Zhang and Yang2015; Zhou et al., Reference Zhou, Liang, Ponce, Marundon, Ye and Zhao2015; Rogers et al., Reference Rogers, Norman, Siebenmorgen, Grigg, Hardke, Brye and Gbur2016).
The results of this study on Simiao rice further supplemented the above research conclusions: N application rates had no significant effect on the milled rice rate of Simiao rice in either early or late seasons (Figures 6A, E and 7A, E), while the regulatory effect of N application on head rice rate exhibited marked seasonal differences. Specifically, increasing N application rates significantly improved the head rice rate of early rice (Figures 6B and 7B), whereas no significant change in head rice rate was observed in late rice with the variation of N application rates (Figures 6F and 7F). This seasonal differential response of head rice rate to N application is closely related to the change in chalkiness traits of N-sensitive Simiao rice varieties in the early season. As shown in Figures 6B and 7B, the head rice rate of typical early rice varieties such as MXZ2, GXYLSM, HFYYX, and QXY19X increased significantly with the increase in N application rates, and this improvement in head rice rate was accompanied by a significant reduction in both chalky grain rate and chalkiness degree of these varieties (Figures 6C, D and 7C, D).
This correlation between head rice rate and chalkiness traits is consistent with the conclusions of most existing studies: high chalkiness will increase the fragility of rice grains and lead to increased grain breakage during the milling process, thereby significantly reducing the head rice rate (Jing et al., Reference Jing, Wang, Shen, Wang, Zhu, Wang and Yang2016; Chen et al., Reference Chen, Li, Zheng, Hu, Dong, Zhou, Liu, Liu and Yang2024), and there is a strong negative correlation between rice head rice rate and chalkiness traits. The correlation analysis results of this study also verified this classic conclusion: a significant negative correlation was identified between the head rice rate of early rice and both chalky grain rate and chalkiness degree (Figure 8). Therefore, the observed increase in head rice rate of early rice with elevated N application rates is primarily due to the significant reduction in chalkiness traits of N-responsive varieties under high N conditions, which reduces grain breakage during milling and ultimately improves the milling quality of early rice.
The regulatory effect of N application on rice chalkiness has been widely reported yet remains inconsistent across studies: most investigations have demonstrated that an appropriate increase in N application can reduce rice chalky grain rate and chalkiness (Zhou et al., Reference Zhou, Liang, Ponce, Marundon, Ye and Zhao2015; Zhang et al., Reference Zhang, Zhang, Song, Chen, Sun, Peng, Huang and Zhao2021; Fei et al., Reference Fei, Yang, Ma, Lunzhu, Wang, Wang and Guo2023), while a few studies have found that elevated N rates may increase chalkiness in japonica rice (Zhu et al., Reference Zhu, Zhang, Guo, Xu, Dai, Wei, Gao, Hu, Cui and Huo2017). The present study on dual-use Simiao rice in double cropping systems further revealed a pronounced seasonal specificity in the N regulation of chalkiness, with increasing N application significantly reducing chalky grain rate and chalkiness in the early season but exerting no significant effect in the late season (Figures 6C, D, G, H and 7C, D, G, H). More notably, a significant varietal difference was detected for these two appearance quality traits in the early season: increased N application markedly decreased chalky grain rate and chalkiness in high-chalkiness varieties (MXZ2, GXYLSM, HFYYX, and QXY19X), whereas no obvious regulatory effect was observed in low-chalkiness varieties (19X, TX812, XZXSM, and XXZ) (Figures 6C, D and 7C, D).
Chalkiness is a complex agronomic trait jointly controlled by genetic background, environmental conditions, and agronomic management practices (Chen et al., Reference Chen, Li, Zheng, Hu, Dong, Zhou, Liu, Liu and Yang2024). Previous studies have confirmed that under high-temperature conditions, appropriate N application can significantly enhance crop photosynthetic capacity during grain filling, especially in the late filling stage (Zhao et al., Reference Zhao, Zhao, Peng, Sun, Zhang, Zhang, Ran, Shen, Liu, Ding and Tang2025), thus promoting smooth grain filling and improving rice appearance quality (Dou et al., Reference Dou, Tang, Li, Liu, Ding, Chen, Wang and Ding2017; Wada et al., Reference Wada, Hatakeyama, Onda, Nonami, Nakashima, Erra-Balsells, Morita, Hiraoka, Tanaka and Nakano2019; Wang et al., Reference Wang, Wang, Yin, Zhao, Liu, Shen, Ding and Tang2021). In this study, the grain-filling period of early rice coincided with relatively high ambient temperatures (Figure S1), increased N application improved grain-filling efficiency (increased GR0, GRmax, and GRmean) of inferior spikelets in high-chalkiness varieties (Table 2), with these physiological improvements mitigating chalkiness formation (Zhang et al., Reference Zhang, Zhang, Song, Chen, Sun, Peng, Huang and Zhao2021). In contrast, the grain-filling period of late rice occurred under optimal temperature conditions (Figure S1), and the basal levels of chalky grain rate and chalkiness of all tested varieties were consistently low (<5%). This inherent low-chalkiness background left little room for N-mediated regulatory effects, resulting in the non-significant response of late-season appearance quality to N application.
It is noteworthy that the present study identified a potential association between the grain length-to-width ratio of Simiao rice and the regulatory effect of N fertilizer on its milling and appearance quality. Specifically, Simiao rice varieties with a lower grain length-to-width ratio (e.g., MXZ2, GXYLSM, HFYYX, and QXY19X) exhibited more pronounced improvements in milling and appearance quality in response to N application in the early season (Figures 6C, D and 7C, D; S2). By contrast, varieties with a higher grain length-to-width ratio (e.g., 19X, TX812, XZXSM, and XXZ) showed minimal variations in these quality traits under different N application rates. These results indicate that long-grain Simiao rice varieties not only inherently possess superior milling and appearance quality but also have a relatively stable quality performance independent of N application levels. This finding provides a novel insight for the precise N management of Simiao rice, and future studies should focus on elucidating the specific response patterns and underlying physiological mechanisms of different grain-type Simiao rice varieties to N availability (Zhou et al., Reference Zhou, Liang, Ponce, Marundon, Ye and Zhao2015; Tan et al., Reference Tan, Miao, Xu, Zhou, Wang, Gu, Liang, Wang, Chen, Zhu, Zuo, Yang, Gong, You, Wu, Liang and Zhou2023).
Limitations and future perspectives
This study has preliminarily clarified the response characteristics of Simiao rice yield to N application, yet the physiological and ecological mechanisms underlying the seasonal variation in yield response, especially the insensitivity of early rice yield and positive response of late rice yield to N, remain unclear. In addition, this study only focused on the effects of N application on rice milling and appearance quality, with the regulatory impact of N on cooking and eating quality remaining unexplored. Future research should integrate multi-dimensional data including meteorological, agronomic, and physiological variables to systematically elucidate the regulatory mechanisms of N on Simiao rice yield and quality traits and further examine the effects of N application on cooking and eating quality so as to realize the synergistic improvement of yield and quality in Simiao rice production.
Conclusions
This two-year study investigated the effects of N application rate on grain yield and quality of early-and late-season dual-use Simiao rice. The main conclusions are as follows: (1) N application rate had no significant effect on early rice yield but significantly increased late rice yield, with the yield gain primarily attributed to increased total spikelets. (2) For early rice, increasing N application rate improved head rice rate and reduced chalky grain rate and chalkiness in high-chalkiness varieties, while low-chalkiness varieties showed no significant quality changes across N treatments. For late rice, N application rate had no significant effect on milling or appearance quality in any variety. (3) The beneficial effects of N application were mediated by enhanced aboveground biomass accumulation, leaf SPAD value, and grain-filling efficiency. (4) According to the two-year data on yield and quality responses, the recommended N rate for early rice is 105 kg ha−1. For high-chalkiness varieties, a higher rate of 135 kg ha−1 is suggested to further enhance milling and appearance quality. The suitable N range for late rice is 135–165 kg ha−1, with 135 kg ha−1 balancing economic benefits and 165 kg ha−1 delivering the highest yield. These findings demonstrate that adjusting N application rate according to seasonal characteristics and varietal traits is a feasible agronomic strategy to improve the yield and quality of dual-use Simiao rice. This optimized N management provides a scientific basis for sustainable production of high-quality double cropping rice in South China.
Supplementary material
The supplementary material for this article can be found at https://doi.org/10.1017/S0014479726100404.
Data availability statement
The authors declare no conflicts of interest.
Acknowledgements
This work was supported by the Junior Associate Researcher Program of Guangdong Academy of Agricultural Sciences (R2023PY–QF001) and the National Natural Science Foundation of China (32201900).
Author contributions
Conceptualization, J.Z. and T.Y.; investigation, H.Y. and J.L.; writing—original draft, H.Y.; writing—review and editing, J.L., L.W., X.B., B.Z., J.Z. and T.Y.; visualization, H.Y.; funding acquisition, T.Y. All authors have read and agreed to the published version of the manuscript.
Competing interests
The authors declare no competing financial interests.




 Open access

