



%20--%3e%3c!DOCTYPE%20svg%20PUBLIC%20'-//W3C//DTD%20SVG%201.0//EN'%20'http://www.w3.org/TR/2001/REC-SVG-20010904/DTD/svg10.dtd'%3e%3csvg%20version='1.0'%20id='Layer_1'%20xmlns='http://www.w3.org/2000/svg'%20xmlns:xlink='http://www.w3.org/1999/xlink'%20x='0px'%20y='0px'%20width='64px'%20height='64px'%20viewBox='5.5%20-3.5%2064%2064'%20enable-background='new%205.5%20-3.5%2064%2064'%20xml:space='preserve'%3e%3cg%3e%3ccircle%20fill='%23FFFFFF'%20fill-opacity='0'%20cx='37.785'%20cy='28.501'%20r='28.836'/%3e%3cpath%20fill='%23595959'%20d='M37.441-3.5c8.951,0,16.572,3.125,22.857,9.372c3.008,3.009,5.295,6.448,6.857,10.314%20c1.561,3.867,2.344,7.971,2.344,12.314c0,4.381-0.773,8.486-2.314,12.313c-1.543,3.828-3.82,7.21-6.828,10.143%20c-3.123,3.085-6.666,5.448-10.629,7.086c-3.961,1.638-8.057,2.457-12.285,2.457s-8.276-0.808-12.143-2.429%20c-3.866-1.618-7.333-3.961-10.4-7.027c-3.067-3.066-5.4-6.524-7-10.372S5.5,32.767,5.5,28.5c0-4.229,0.809-8.295,2.428-12.2%20c1.619-3.905,3.972-7.4,7.057-10.486C21.08-0.394,28.565-3.5,37.441-3.5z%20M37.557,2.272c-7.314,0-13.467,2.553-18.458,7.657%20c-2.515,2.553-4.448,5.419-5.8,8.6c-1.354,3.181-2.029,6.505-2.029,9.972c0,3.429,0.675,6.734,2.029,9.913%20c1.353,3.183,3.285,6.021,5.8,8.516c2.514,2.496,5.351,4.399,8.515,5.715c3.161,1.314,6.476,1.971,9.943,1.971%20c3.428,0,6.75-0.665,9.973-1.999c3.219-1.335,6.121-3.257,8.713-5.771c4.99-4.876,7.484-10.99,7.484-18.344%20c0-3.543-0.648-6.895-1.943-10.057c-1.293-3.162-3.18-5.98-5.654-8.458C50.984,4.844,44.795,2.272,37.557,2.272z%20M37.156,23.187%20l-4.287,2.229c-0.458-0.951-1.019-1.619-1.685-2c-0.667-0.38-1.286-0.571-1.858-0.571c-2.856,0-4.286,1.885-4.286,5.657%20c0,1.714,0.362,3.084,1.085,4.113c0.724,1.029,1.791,1.544,3.201,1.544c1.867,0,3.181-0.915,3.944-2.743l3.942,2%20c-0.838,1.563-2,2.791-3.486,3.686c-1.484,0.896-3.123,1.343-4.914,1.343c-2.857,0-5.163-0.875-6.915-2.629%20c-1.752-1.752-2.628-4.19-2.628-7.313c0-3.048,0.886-5.466,2.657-7.257c1.771-1.79,4.009-2.686,6.715-2.686%20C32.604,18.558,35.441,20.101,37.156,23.187z%20M55.613,23.187l-4.229,2.229c-0.457-0.951-1.02-1.619-1.686-2%20c-0.668-0.38-1.307-0.571-1.914-0.571c-2.857,0-4.287,1.885-4.287,5.657c0,1.714,0.363,3.084,1.086,4.113%20c0.723,1.029,1.789,1.544,3.201,1.544c1.865,0,3.18-0.915,3.941-2.743l4,2c-0.875,1.563-2.057,2.791-3.541,3.686%20c-1.486,0.896-3.105,1.343-4.857,1.343c-2.896,0-5.209-0.875-6.941-2.629c-1.736-1.752-2.602-4.19-2.602-7.313%20c0-3.048,0.885-5.466,2.658-7.257c1.77-1.79,4.008-2.686,6.713-2.686C51.117,18.558,53.938,20.101,55.613,23.187z'/%3e%3c/g%3e%3c/svg%3e)
%20--%3e%3c!DOCTYPE%20svg%20PUBLIC%20'-//W3C//DTD%20SVG%201.0//EN'%20'http://www.w3.org/TR/2001/REC-SVG-20010904/DTD/svg10.dtd'%3e%3csvg%20version='1.0'%20id='Layer_1'%20xmlns='http://www.w3.org/2000/svg'%20xmlns:xlink='http://www.w3.org/1999/xlink'%20x='0px'%20y='0px'%20width='64px'%20height='64px'%20viewBox='5.5%20-3.5%2064%2064'%20enable-background='new%205.5%20-3.5%2064%2064'%20xml:space='preserve'%3e%3cg%3e%3ccircle%20fill='%23FFFFFF'%20fill-opacity='0'%20cx='37.637'%20cy='28.806'%20r='28.276'/%3e%3cg%3e%3cpath%20fill='%23595959'%20d='M37.443-3.5c8.988,0,16.57,3.085,22.742,9.257C66.393,11.967,69.5,19.548,69.5,28.5c0,8.991-3.049,16.476-9.145,22.456%20C53.879,57.319,46.242,60.5,37.443,60.5c-8.649,0-16.153-3.144-22.514-9.43C8.644,44.784,5.5,37.262,5.5,28.5%20c0-8.761,3.144-16.342,9.429-22.742C21.101-0.415,28.604-3.5,37.443-3.5z%20M37.557,2.272c-7.276,0-13.428,2.553-18.457,7.657%20c-5.22,5.334-7.829,11.525-7.829,18.572c0,7.086,2.59,13.22,7.77,18.398c5.181,5.182,11.352,7.771,18.514,7.771%20c7.123,0,13.334-2.607,18.629-7.828c5.029-4.838,7.543-10.952,7.543-18.343c0-7.276-2.553-13.465-7.656-18.571%20C50.967,4.824,44.795,2.272,37.557,2.272z%20M46.129,20.557v13.085h-3.656v15.542h-9.944V33.643h-3.656V20.557%20c0-0.572,0.2-1.057,0.599-1.457c0.401-0.399,0.887-0.6,1.457-0.6h13.144c0.533,0,1.01,0.2,1.428,0.6%20C45.918,19.5,46.129,19.986,46.129,20.557z%20M33.042,12.329c0-3.008,1.485-4.514,4.458-4.514s4.457,1.504,4.457,4.514%20c0,2.971-1.486,4.457-4.457,4.457S33.042,15.3,33.042,12.329z'/%3e%3c/g%3e%3c/g%3e%3c/svg%3e)
1 Introduction
Inertial confinement fusion (ICF) research stands as one of the foremost scientific challenges in the world today, and its successful implementation holds profound significance for national energy security and fundamental scientific exploration[ Reference Betti and Hurricane 1 ]. Large-scale laser facilities serve as the critical platforms for such research, with representative examples being the National Ignition Facility (NIF) in the United States[ Reference Burkhart, Bliss, Di Nicola, Kalantar, Lowe-Webb, McCarville, Nelson, Salmon, Schindler, Villanueva and Wilhelmsen 2 – Reference Zylstra, Hurricane and Callahan 5 ] and the Laser Megajoule (LMJ) facility in France[ Reference Luttmann, Denis, Gendeau, Lanternier, Baudon, Schiano, Espert, Seguineau, Henry and Raffestin 6 , Reference Miquel, Lion and Vivini 7 ], where the NIF has already achieved an energy gain greater than one. For these massive laser facilities, the precise alignment of thousands of optical components in the beamlines to micrometer or even sub-micrometer accuracy is paramount to the final output performance[ Reference Zhu, Yang, Zhang, Liu, Zhou, Liu, Tang, Guo, Fan and Liu 8 ].
The core of achieving high-precision alignment lies in the real-time and accurate quantitative analysis of the laser spot images propagating through the entire amplification chain. The morphology and center position of these spots are the most direct information carriers reflecting beam quality and spatial alignment status[ Reference Ke, Zeng, Xie, Jiang, Liang, Yang and Zhao 9 ]. From a technical perspective, traditional automatic spot image analysis methods face significant challenges. Despite their widespread use, classical automatic spot analysis methods face fundamental limitations that severely constrain their effectiveness in modern high-power laser facilities. Threshold segmentation methods[ Reference Otsu 10 – Reference Kittler and Illingworth 13 ] assume bimodal grayscale distributions and perform poorly when spots exhibit low contrast, nonuniform illumination or overlapping boundaries – conditions prevalent in high-power laser beamlines due to thermal effects and optical damage. Edge detection algorithms[ Reference Sobel and Feldman 14 – Reference Marr and Hildreth 16 ] rely on gradient-based feature extraction and are highly sensitive to noise and stray light, often producing fragmented or spurious contours that compromise subsequent morphological analysis. Centroid algorithms[ Reference Hu 17 , Reference Singer 18 ], while computationally efficient, are inherently global statistical measures that cannot distinguish between multiple overlapping spots or adapt to irregular morphologies, and their accuracy degrades significantly under partial occlusion or asymmetric intensity distributions.
Furthermore, these classical methods typically serve as isolated preprocessing modules within conventional proportional–integral–derivative (PID)-based closed-loop control systems, where the segmentation, feature extraction and control decision-making stages are decoupled. This modular separation prevents end-to-end optimization: errors propagate cumulatively from segmentation to positioning, the system cannot autonomously adapt to new spot morphologies without manual parameter retuning and the lack of instance-level discrimination makes parallel multi-beamline alignment infeasible. Consequently, classical approaches require extensive human intervention for parameter adjustment and validation, rendering them inadequate for the unattended, high-throughput alignment demands of next-generation laser facilities such as Shenguang-II (SG-II). While methods based on traditional machine learning show some improvement, their overall performance remains limited by the representational capacity of handcrafted features.
In recent years, deep learning technology, particularly the convolutional neural network (CNN), has achieved a series of groundbreaking advances in the field of computer vision[ Reference Krizhevsky, Sutskever and Hinton 19 – Reference Gupta, Bruce, Powis and Dholakia 21 ], offering novel research ideas and technical pathways for spot analysis. These methods can automatically learn deep, abstract features highly relevant to the task from raw image data, demonstrating strong generalization capabilities against complex conditions such as illumination variations and noise interference. Nevertheless, most current research efforts still focus on the preliminary detection and rough localization of spots. Key issues such as sub-pixel-level fine contour segmentation, automatic quantitative extraction of multi-dimensional morphological parameters and the robust, adaptive determination of reference centers under varying operational conditions still lack systematic solutions. Deep learning is adopted here because classical methods cannot meet three key requirements: pixel-level instance discrimination for overlapping spots; adaptive feature representation for variable spot morphologies across amplification stages; and an end-to-end pipeline integrating image interpretation and control parameter generation. Unlike generic computer vision tasks, laser spot analysis has domain-specific challenges (weak contrast, micrometer-scale positioning, real-time constraints), justifying specialized architectural adaptations instead of off-the-shelf models.
To address the requirement for intelligent, fully automated and rapid alignment of the SG-II laser facility, this paper presents the development of a deep learning-based spot analysis system. The core of this method is an improved YOLOv8-seg instance segmentation model, which enables accurate recognition and pixel-level contour segmentation of typical spots during alignment operations. Furthermore, a multi-mode alignment reference center detection framework is designed. This framework integrates a deep learning-driven cross-mark localization algorithm with a geometry-constrained four-dot recognition algorithm to achieve rapid detection and identification of the spatial reference benchmarks throughout the facility’s alignment chain. The results obtained from the aforementioned methods are subsequently fed into a feature quantification module to automatically calculate spot centroids, morphological parameters and their offset vectors relative to the reference centers. The system achieves a network inference time of 55 ± 2 ms per frame, measured as the model forward-pass duration on an NVIDIA RTX 4060 GPU, averaged over three independent runs across the full validation set. The complete processing workflow encompasses image preprocessing, instance segmentation, multi-mode reference center detection and morphological feature quantification. With a network inference latency of only 55 ms and moderate additional overhead from the aforementioned stages, the total processing time remains comfortably within the 1 s cycle budget of the SG-II facility’s alignment system, thereby meeting the real-time requirement for automated closed-loop alignment. The system outputs structured adjustment commands to drive motorized optical components.
2 System architecture and core algorithms
The system developed in this study is designed for the alignment of the SG-II high-power laser facility. The upgraded SG-II facility comprises eight nanosecond laser beams and a ninth beam capable of delivering either nanosecond or picosecond pulses[ Reference Zhu, Zhu, Li, Zhu, Ma, Lu, Fan, Liu, Zhou and Xu 22 ]. Its alignment beamline is illustrated in Figure 1, where two sets of imaging systems are deployed at key alignment nodes of the beamline. The key specifications of the imaging systems are as follows: the system at position (1) in Figure 1 has an image resolution of 2040×2048 with a pixel size of 7.4 μm; the system at position (2) in Figure 1 has an image resolution of 782×582 with a pixel size of 8.3 μm.
SG-II alignment beamline. TSF, transport spatial filter; CSF, cavity spatial filter; PEPC, plasma electrode Pockels cell.

Figure 1 Long description
The diagram illustrates a complex laser system layout.
* Bottom Row (Cavity Section): The path begins at a Cavity mirror on the far left. The beam passes through a Polarizer and a P E P C (plasma electrode Pockels cell). It enters the C S F (cavity spatial filter), which features a callout (1) showing a four-dot pinhole array. The beam then passes through the Cavity amplifier and reflects off a Deformable mirror at the far right of this section.
* Middle Transition: The beam reflects back through the cavity components and is redirected by a set of three Mirrors on the left side of the diagram toward the upper section.
* Top Row (Transport Section): The beam enters a Power amplifier. It then passes into the T S F (transport spatial filter) housed in a dashed rectangular box. A Frontend and pre-amp module feeds into the T S F via a callout (2) showing a single crosshair pinhole.
* Final Path: After exiting the T S F, the beam enters a dashed box containing four Guiding mirrors arranged in a U-shape. The beam then passes through an F O A (final optics assembly) and enters the Chamber, focusing onto a Target point on the far right.
In this paper, we propose three types of reference centers: the four-dot pattern, the cross-mark and the image geometric center. They are deployed at position (1) in Figure 1, position (2) in Figure 1 and the far-field position before main amplifier injection, respectively. Example images of these three types of reference centers are presented in Figure 2. The proposed spot analysis system is uniformly applied to all nine beamlines of the SG-II facility, and all experimental data used in this study are real alignment images captured from routine physical experiments on this operational large-scale high-power laser facility.
Three types of reference center images: (a) four-dot pattern, serving as the far-field reference from the grating in the main amplifier CSF cavity; (b) cross-mark, used as the near-field reference before main amplifier injection; (c) image geometric center, provided by the charge-coupled device (CCD) sensor plane as the far-field reference before main amplifier injection.

These reference centers are all physical benchmarks fixed during the facility installation and precision alignment stage, rather than digitally superimposed markers. The cross-mark is a physical reticle placed at the confocal plane of the rod-amplifier spatial filter, serving as the absolute far-field reference. The four-dot pattern consists of four physical pinholes arranged in a square at the focal plane of the cavity spatial filter (CSF), whose geometric center is defined as the absolute alignment reference. Both mechanical references are precisely calibrated to coincide with the theoretical optical axis, guaranteeing the stability and repeatability of alignment benchmarks.
2.1 Overall system architecture
The entire processing system, as illustrated in Figure 3, consists of three modules: a raw image preprocessing module, an improved YOLOv8-seg module and a feature quantification module. The system takes raw image data
$I\in {\mathbb{R}}^{H\times W\times C}$
 captured by an alignment camera as its input. This input, a raw spot image with dimensions H×W×C (where H is height, W is width and C is the number of channels), is first uniformly resized through preprocessing. It is then processed by the improved YOLOv8-seg model, which outputs an instance mask set
$M=\left\{{M}_1,{M}_2,\cdots, {M}_N\right\}$
 (where
${M}_{i}\in {\left\{0,1\right\}}^{H\times W}$
 is the binary mask matrix for the ith spot (in which N is the total number of detected spots) and the reference center coordinates
${C}_{\mathrm{ref}}=\left({x}_{\mathrm{ref}},{y}_{\mathrm{ref}}\right)$
 . Subsequently,
$M$
 and
${C}_{\mathrm{ref}}$
 are fed into the feature quantification module. Through comprehensive computation, this module derives the geometric, morphological and spatial offset parameters for each spot, forming a feature set
$F=\left\{{f}_1,{f}_2,\cdots, {f}_N\right\}$
 , thereby providing complete data support for alignment decision-making.
Architecture of the laser spot analysis system.

Figure 3 Long description
The flowchart consists of four main modules enclosed in dashed boxes, connected by thick black arrows from left to right.
1. Image acquisition and preprocessing: Receives a raw input image I in R super H times W times C. The module performs image normalization, resizing to S sub target, and color space conversion, resulting in a normalized image I sub pre.
2. Instance segmentation: Uses an enhanced YOLO v 8 instance segmentation module. It features a C B A M attention mechanism, adaptive multi-scale fusion, shape-aware data augmentation, and loss function optimization. It outputs a spot mask set M = {M sub 1, M sub 2, ..., M sub N}, where M sub i is an element of {0, 1} super H times W.
3. Reference center detection: A multi-mode reference center detection module using a three-level strategy: 1. four black dots detection, 2. cross marker detection, and 3. default center strategy. It outputs a reference center C sub ref = (x sub ref, y sub ref).
4. Feature parameter quantification: A spot feature quantification module performing contour refinement, geometric feature calculation, spatial relationship analysis, and shape-specific parameters. It outputs a feature set F = {f sub 1, f sub 2, ..., f sub N}.
Final Outputs: A blue-bordered box on the far right lists the results: classification and segmentation results (spot categories, precise contours), center position deviation (offset distance, direction vector), and analysis results (morphological params, statistical reports).
The uniform resizing to 800 × 800 pixels is performed to meet the YOLOv8-seg input requirements while using letterbox padding to maintain the aspect ratio and avoid geometric distortion. This preprocessing also ensures consistent annotation formats and enables efficient batch processing.
The calculated offset vectors and geometric parameters are further converted into adjustment direction, step size and step count for motorized optical components. These structured parameters support closed-loop alignment control with a processing latency within 1 s, matching the 1 Hz data acquisition rate of the facility’s alignment system.
2.2 Improved YOLOv8-seg instance segmentation model
2.2.1 Loss function reconstruction and weight optimization
The general total loss function of the YOLOv8-seg model is composed of three weighted components: bounding box regression loss
$\mathcal{L}_{\mathrm{box}}$
 , classification loss
$\mathcal{L}_{\mathrm{cls}}$
 and segmentation mask loss
$\mathcal{L}_{\mathrm{mask}}$
 . Among these,
$\mathcal{L}_{\mathrm{box}}$
 employs complete intersection over union (CIoU) loss function, while
$\mathcal{L}_{\mathrm{cls}}$
 and
$\mathcal{L}_{\mathrm{mask}}$
 use binary cross-entropy (BCE) loss.
Spot analysis in this context involves three categories – circle, square and irregular – with circular targets constituting a high proportion in the segmentation task. To address this characteristic, this paper introduces a shape constraint term to reconstruct the loss function.
Considering that the circularity of the circle category spots is closest to the ideal value, a circularity constraint weight
${\lambda}_{\mathrm{circle}}$
 is added to the mask loss to guide the predictions for circular spots closer to a geometric true circle. The corresponding loss function is as follows:

where
$\kappa$
 represents the circularity, with a value of 1 denoting a perfect circle. This constraint encourages the predictions for circular spots to better approximate the ideal geometry.
The new, reconstructed total loss function is expressed as follows:

In the equation,
${\lambda}_{\mathrm{box}}$
 ,
${\lambda}_{\mathrm{cls}}$
 ,
${\lambda}_{\mathrm{mask}}$
 and
${\lambda}_{\mathrm{circle}}$
 are the weight coefficients for each loss term, and
$\mathcal{L}_{\mathrm{circle}}$
 is the circularity constraint loss term. The values of the weight coefficients are set according to the configuration file, with the mask loss weight
${\lambda}_{\mathrm{mask}}=2.0$
 and the circularity constraint weight
${\lambda}_{\mathrm{circle}}=1.5$
 , ensuring a balance among all loss components during the training process.
2.2.2 Network architecture improvements
In recent years, instance segmentation models have evolved into two dominant technical paradigms: (1) CNN-based detection-segmentation frameworks, including two-stage models such as Mask R-CNN and single-stage models such as the YOLO segmentation series, which excel in real-time inference and deployment-friendliness; (2) transformer-based end-to-end frameworks, pioneered by a detection transformer (DETR)[ Reference Carion, Massa, Synnaeve, Usunier, Kirillov and Zagoruyko 23 ] and hierarchical vision backbones such as Swin Transformer[ Reference Liu, Lin, Cao, Hu, Wei, Zhang, Lin and Guo 24 ], which achieve strong global context modeling but often come with a high computational overhead and slow inference speed. Considering the real-time detection requirement and limited computing resources of the laser spot alignment scenario, this paper adopts the YOLOv8-seg model as the baseline and proposes targeted structural improvements. The improved model consists of a three-stage architecture: a backbone, a neck for feature fusion and a head, as shown in Figure 4. The detailed optimizations for the three core components are described below.
Improved YOLOv8-seg network architecture diagram.

Figure 4 Long description
The flowchart begins on the far left with an input image block leading to preprocessing (normalization/resize).
1. Backbone: feature extraction (C 2 f models + C B A M attention). This vertical green container includes four C 2 f modules interleaved with C B A M attention blocks (channel + spatial calibration). Arrows flow downward through these modules, with lateral connections from C 2 f modules 2, 3, and 4 leading into the next stage.
2. Neck: feature fusion (P A Net + adaptive weight allocation). This central purple container receives inputs from the backbone into an up-sampling & down-sampling fusion sub-block. This sub-block contains two columns of pink and purple parallelograms: the left column alternates between feature fusion and upsample, while the right column alternates between downsample and feature fusion. Below this, the data splits into high-scale feature F sub high, mid-scale feature F sub mid, and low-scale feature F sub low. These feed into an adaptive multi-scale fusion block, which also receives multi-scale inputs {480, 640, 736}, resulting in fused feature maps.
3. Head: task branches (decoupled classification/localization/segmentation). The fused feature maps feed into three parallel pink branches in an orange container: classification branch (class prediction), localization branch (bounding box regression), and segmentation branch (mask generation). All three branches converge into a final output block (class + coordinates + mask).
To clarify the actual processing effects of the proposed network on laser spot images, the corresponding visualization results are presented in Figure 5, which are strictly aligned with the core modules of the network architecture shown in Figure 4.
Workflow of the proposed laser spot analysis system: (a) raw input spot image with cross-mark reference, acquired from the SG-II facility; (b) laser spot detection result with a bounding box, output by the improved YOLOv8-seg model; (c) pixel-level instance segmentation mask from the segmentation branch, providing an accurate contour for morphological parameter calculation; (d) final center localization and quantitative result, including the spot center, reference center and offset distance.

Figure 5 Long description
Panel a shows a raw grayscale input of a bright circular laser spot overlaid with a black cross-mark reference. Panel b displays the detection result where a light blue bounding box and a semi-transparent blue mask cover the spot. Panel c illustrates the pixel-level instance segmentation with a pink mask highlighting the precise contour of the spot against a darkened background. Panel d presents the final quantitative analysis. A red circle outlines the spot perimeter. At the center of the spot is a blue dot, and at the intersection of the black cross-mark is a green plus sign. A text box in the top-left corner of panel d lists the following data. S I N G L E S P O T V I E W. Spot Type: C I R C L E. Spot Center: (412, 445). Reference Center: (457, 451). Reference Type: cross. Distance: 45.40 p x.
Firstly, attention mechanisms have become a core module to boost the feature representation capability of CNN models for dense prediction tasks. The pioneering squeeze-and-excitation networks (SENets)[
Reference Hu, Shen and Sun
25
] first introduced channel-wise attention to adaptively recalibrate feature weights, while the efficient channel attention network (ECA-Net)[
Reference Wang, Wu, Zhu, Li, Zuo and Hu
26
] and subsequent visual attention frameworks[
Reference Guo, Lu, Liu, Cheng and Hu
27
] further optimized this paradigm with a lightweight local cross-channel interaction strategy, achieving a better trade-off between performance and computational cost. However, both the SENet and ECA-Net only model channel attention, ignoring spatial information that is critical for detecting weak boundary spots. Therefore, we embed the convolutional block attention module (CBAM)[
Reference Woo, Park, Lee and Kweon
28
], which comprises channel and spatial attention sub-modules, as shown in Figure 6, into the C2f modules of the backbone. This enables the network to adaptively calibrate feature weights, thereby enhancing its perception of spots with low contrast and weak boundaries. Specifically, the input feature maps undergo channel attention learning (which learns weights for C channels, where C is the channel number of the raw image
$I\in \mathbb{R}^{H\times W\times C}$
 ) and spatial attention learning (which learns H×W spatial weights, where H and W are the height and width of
$I\in \mathbb{R}^{H\times W\times C}$
 ). The channel and spatial weights are then dynamically adjusted and combined to output an enhanced feature set, improving the capture capability for boundaries with low grayscale differences.
CBAM network structure diagram, where
$\otimes$
 represents convolution.

Secondly, within the neck, the path aggregation network (PANet) architecture was improved by introducing a dynamic weight allocation mechanism. The fusion weights for low-, medium- and high-level feature maps were changed from fixed values to a ratio generated in real-time by a lightweight attention module. This allows the neck to adaptively adjust its fusion strategy based on the scale distribution of the input spots, avoiding the feature dilution problem associated with fixed weights.
Finally, the head contains three parallel branches for classification, localization and mask prediction, combined with a prototype network (ProtoNet) to generate the final segmentation masks. During inference, multi-scale testing augmentation is employed to ensure detection stability for spots ranging from 5 to 200 pixels in size.
During training, a comprehensive shape-aware data augmentation pipeline is applied to introduce controlled geometric and photometric variations that simulate real-world operational perturbations encountered in high-power laser beamlines, including thermal drift, optical component wear and illumination fluctuations. These perturbations are dynamically generated on-the-fly from the fixed training set during each iteration to enhance the model’s robustness and generalization capability under varying imaging conditions, thereby improving its adaptability to diverse spot morphologies across different amplification stages. The data augmentation pipeline includes two categories of transformations: geometric transformations and HSV color space perturbations. The geometric transformations consist of random rotation (±5°), random isotropic scaling (0.7×–1.3×, uniform sampling), random perspective transformation and random horizontal flipping (applied with a probability of 0.5). For color perturbations, we apply random hue shift (±0.1, hue channel normalized to [0,1]), random saturation scaling (0.8×–1.2×, uniform sampling) and random value (brightness) scaling (0.8×–1.2×, uniform sampling).
2.2.3 Training strategy optimization
To effectively prevent overfitting and enhance training efficiency, this study adopts a transfer learning-based model initialization and training strategy. Specifically, the model is first initialized with weights pre-trained on a general-purpose dataset. Subsequently, the parameters of the first 10 layers in the backbone network are frozen, and only the detection head is fine-tuned.
Ablation study on frozen layer depth (0, 5, 10, 15 layers), as shown in Table 1, showed that freezing 10 layers achieves optimal balance: preserving low-level feature extractors while allowing sufficient adaptation to laser spot characteristics. Freezing fewer layers risks overfitting; freezing more limits adaptation.
Ablation study on frozen backbone layer settings (network component analysis) a .

Table 1 Long description
The table consists of five columns and five data rows. The columns are labeled: Frozen layers, m A P at 0.5, m A P at 0.5 to 0.95, Convergence epoch, and Final loss.
* Row 1: 0 frozen layers (full fine-tune) results in m A P at 0.5 of 0.898 plus or minus 0.003, m A P at 0.5 to 0.95 of 0.782 plus or minus 0.004, convergence at 85 epochs, and a final loss of 0.234.
* Row 2: 5 frozen layers results in m A P at 0.5 of 0.899 plus or minus 0.002, m A P at 0.5 to 0.95 of 0.785 plus or minus 0.003, convergence at 78 epochs, and a final loss of 0.228.
* Row 3: 10 frozen layers results in m A P at 0.5 of 0.901 plus or minus 0.002, m A P at 0.5 to 0.95 of 0.788 plus or minus 0.003, convergence at 72 epochs, and a final loss of 0.221.
* Row 4: 15 frozen layers results in m A P at 0.5 of 0.894 plus or minus 0.004, m A P at 0.5 to 0.95 of 0.779 plus or minus 0.005, convergence at 68 epochs, and a final loss of 0.235.
* Row 5: 22 frozen layers (head only) results in m A P at 0.5 of 0.887 plus or minus 0.005, m A P at 0.5 to 0.95 of 0.771 plus or minus 0.006, convergence at 65 epochs, and a final loss of 0.248.
The data indicates that freezing 10 layers provides the highest m A P and lowest final loss.
a Freezing 10 layers achieves optimal balance between convergence speed and accuracy. Freezing fewer layers risks overfitting; freezing more limits adaptation to laser spot characteristics. The term ‘ablation study’ here refers to machine learning-based network component contribution analysis, and does not refer to physical laser ablation.
The model is initialized with weights pre-trained on the Common Objects in Context (COCO) dataset (YOLOv8-seg official weights), which contains over 200,000 images across 80 categories. The first 10 layers of the backbone are frozen during fine-tuning to preserve low-level feature extractors while adapting higher layers to laser spot characteristics.
For the optimization strategy, a cosine annealing learning rate scheduler with a warm-up phase is employed. Given a total training epoch of E, a batch size of B and a learning rate
$\eta$
 , the dynamic adjustment of the learning rate with respect to the current epoch
$t\in \left[1,E\right]$
 follows the rule

where
${\eta}_0=5\times {10}^{-4}$
 is the initial learning rate, representing the maximum step size for parameter updates;
${\eta}_{\mathrm{min}}=1\times {10}^{-5}$
 is the minimum learning rate, preventing training stagnation due to the learning rate decaying to zero; and
${T}_{\mathrm{warmup}}$
 is the number of warm-up epochs, during which the learning rate is linearly increased at the beginning of training to stabilize gradients. In addition, an early stopping mechanism is applied with a patience parameter set to 30 epochs, effectively avoiding the waste of computational resources.
2.3 Multi-mode reference center detection
To address the application scenarios involving multiple types of reference centers across the entire facility chain, this paper designs a three-level progressive reference center detection framework, as illustrated in Figure 7. This framework establishes a clear detection priority: four-dot pattern → cross-mark → image geometric center. Through redundant design, it ensures the continuous availability of the spatial reference frame under operational conditions such as occlusion, wear and strong glare. This design achieves a balance between detection robustness and accuracy through the priority mechanism, demonstrating higher reliability under various lighting and occlusion conditions compared to single-reference detection methods.
Three-level progressive reference center detection flowchart.

Figure 7 Long description
The flowchart begins at a top oval labeled start.
Level 1: A rectangular process block for four black dots detection using adaptive thresholding, morphology, contour filtering, and geometric constraints. This leads to a blue diamond decision node checking if detection is successful based on circularity kappa > 0.7, area A in the range of 200 to 5000 pixels squared, and geometric constraints.
- If Yes (green arrow), it moves to a green process block to calculate geometric center C sub ref super dots = (1/4 summation from j=1 to 4 of x sub j, 1/4 summation from j=1 to 4 of y sub j). This leads to a yellow output block: output reference center, reference type: four black dots.
Level 2: If No (red arrow) from Level 1, it moves to a rectangular process block for cross mark detection using Y O L O v 8 inference with confidence > 0.25 and I o U > 0.45. This leads to a second blue diamond decision node checking if a valid prediction box exists.
- If Yes (green arrow), it moves to a green process block to calculate bounding box center C sub ref super cross = (x sub 1 + x sub 2 all over 2, y sub 1 + y sub 2 all over 2). This leads to a yellow output block: output reference center, reference type: cross mark.
Level 3: If No (red arrow) from Level 2, it moves to a green process block for default center strategy: geometric image center. This leads to a yellow output block: output reference center, reference type: image geometric center.
All three yellow output blocks converge at a final oval labeled end at the bottom of the diagram.
2.3.1 Four-dot pattern detection
The detection of the four-dot pattern employs a traditional image processing-based algorithm, with its core workflow detailed below.
Firstly, adaptive threshold segmentation is applied to the grayscale image
${I}_{\mathrm{g}}$
 (as shown in Figure 8(a)). The local threshold for each pixel
$\left(x,y\right)$
 is calculated as follows:

Schematic diagram of the four black dots center detection process: (a) original image; (b) after binarization; (c) after morphological processing; (d) all contours; (e) filtered contours; (f) reference center obtained after geometric constraints.

Figure 8 Long description
The sequence is arranged in two rows of three panels.
Top row:
Panel a shows the original grayscale capture with four dark circular dots arranged in a rough rectangle and a faint central circular artifact.
Panel b displays the result of binarization, appearing as a high-contrast noisy texture of black and white pixels.
Panel c shows the result after morphological processing, where the noise is reduced to distinct white speckles on a black background, highlighting the four main dots as larger white rings.
Bottom row:
Panel d displays all contours, where every speckle from the previous step is outlined in yellow.
Panel e shows filtered contours, where only the four primary dots are isolated, each marked with a green circle and a red center point.
Panel f illustrates the final geometric constraint. Two cyan diagonal lines connect the opposite pairs of dots, intersecting at a central point labeled center in pink text.
where
${\mu}_{\mathrm{local}}$
 and
${\sigma}_{\mathrm{local}}$
 represent the local mean and standard deviation, respectively, within a
$31\times 31$
 neighborhood centered at
$\left(x,y\right)$
 , and
$\beta$
 is an adjustment coefficient. Pixels with grayscale values below this threshold are marked as foreground, generating a binary image
${I}_{\mathrm{b}}$
 (Figure 8(b)).
Next, morphological filtering is performed on the binary image. An opening operation removes isolated noise points, and a closing operation fills holes within the targets, both using a
$3\times 3$
 rectangular structuring element. The processed result is shown in Figure 8(c), from which all contours are extracted (Figure 8(d)). Candidate regions are then screened through contour analysis by calculating the area
${A}_j$
 , perimeter
${P}_j$
 and circularity
${\kappa}_j=\frac{4\pi {A}_j}{P_j^2}$
 for each contour. Here,
${A}_j$
 is the total number of pixels within the contour region,
${P}_j$
 is the total length of the contour boundary and
${\kappa}_j$
 is a dimensionless parameter measuring how closely the contour approximates an ideal circle. Only contours with a circularity greater than 0.7 and an area within the range of
$\left[200,5000\right]$
 pixels are retained, as shown in Figure 8(e).
Finally, geometric constraint verification is applied to the center points of the filtered contours. Given the coordinates of four candidate points
$\left({x}_1,{y}_1\right),\left({x}_2,{y}_2\right),\left({x}_3,{y}_3\right)\ \mathrm{and}\ \left({x}_4,{y}_4\right)$
 , the aspect ratio, opposite-side length differences and diagonal length differences of the quadrilateral they form are calculated. The four-dot pattern is validated against specific geometric constraints: the aspect ratio must fall within 0.9–1.1 (±10%), the opposite-side length difference and diagonal length difference must not exceed 5%, the circularity must exceed 0.7 and the area must lie within [100, 5000] pixels. Only when all these geometric deviations remain below their respective preset thresholds are the four points recognized as constituting a valid square reference pattern. The reference center is then determined as the geometric center of these four points (Figure 8(f)), calculated by the following:

2.3.2 Cross-mark detection
For cross-mark detection, we adopt a dedicated lightweight YOLOv8 sub-network, with core design considerations as follows. As the key near-field reference for laser alignment, cross-mark imaging is frequently disturbed by partial occlusion, stray light and contrast fluctuation in practical beamline operation, where traditional template-matching methods have insufficient robustness to meet the high-reliability requirements of unattended closed-loop alignment. Meanwhile, this model can accurately extract the structural features of cross-marks to achieve stable high-precision localization; its unified architecture with the main improved YOLOv8-seg model also simplifies system deployment, and the ultra-low computational overhead fully guarantees the real-time performance of the system.
Specifically, the detector takes an input resolution of
$640\times 640$
 pixels and relies on the CNN to encode deep visual patterns, such as the geometric structure of the cross, linear edge features and symmetry. Compared to traditional template-matching methods, this learning-based detection approach exhibits superior adaptability to disturbances such as partial occlusion and contrast fluctuations. Once the cross-mark is located, its reference center is defined as the center point of the predicted bounding box:

where
$({x}_1,{y}_1)$
 are the pixel coordinates of the top-left corner of the predicted box and
$({x}_2,{y}_2)$
 are the coordinates of the bottom-right corner. For model inference, post-processing is performed using a confidence threshold
${\tau}_{\mathrm{conf}}=0.25$
 and an intersection over union (IoU) threshold
${\tau}_{\mathrm{iou}}=0.45$
 . This parameter combination, determined through receiver operating characteristic (ROC) analysis to reside at the optimal operating point, achieves a good balance between recall and precision.
2.3.3 Fallback center strategy
When both aforementioned detection levels fail, the system automatically adopts a protective fallback strategy that uses the calculated image geometric center as the reference benchmark, defined as follows:

where W and H represent the width and height of the image in pixels, respectively.
2.4 Spot feature extraction and post-processing optimization
2.4.1 Contour feature refinement
Upon obtaining the segmentation masks output by the head, the spot contour is first extracted from the target image. The Douglas–Peucker algorithm[ Reference Douglas and Peucker 29 ] is then employed for polygon approximation to reduce the number of contour points. In this study, the algorithm’s threshold is set to 0.5% of the contour perimeter. This threshold achieves a favorable balance between accuracy and efficiency on the validation set – it reduces the average number of contour points by 72% while introducing an increase in centroid coordinate error of less than 0.3 pixels, which has a negligible impact on the final sub-pixel analysis accuracy.
2.4.2 Geometric feature quantification
The system constructs a three-dimensional feature parameter system encompassing geometry, shape and spatial relationships, which include the following: area
${A}_{i}={\sum}_{\left(x,y\right)}{{M}}_{i}\left(x,y\right)$
 , defined as the total number of foreground pixels of the ith spot; perimeter
${P}_{i}={\sum}_j\left\Vert {p}_{j+1}-{p}_j\right\Vert$
 , the total length of the refined contour chain code; centroid coordinates
$\left({c}_{x_{i}},{c}_{y_{i}}\right)$
 , satisfying
${c}_{x_{i}}=\frac{M_{10}}{M_{00}},{c}_{y_{i}}=\frac{M_{10}}{M_{00}}$
 , where
${M}_{pq}={\sum}_x{\sum}_y{x}^p{y}^q{{M}}_{i}\left(x,y\right)$
 is the (p+q)th-order geometric moment, physically representing the weighted sum of pixel coordinates and grayscale values; circularity
${\kappa}_{i}$
 , a dimensionless parameter calculated as
${\kappa}_{i}=\frac{4\pi {A}_{i}}{P_{i}^2}$
 ; equivalent radius
${r}_{\mathrm{eq},i}=\sqrt{\frac{A_{i}}{\pi }}$
 ; offset distance
${d}_{i}=\sqrt{{\left({c}_{x_{i}}-{x}_{\mathrm{ref}}\right)}^2+{\left({c}_{y_{i}}-{y}_{\mathrm{ref}}\right)}^2}$
 , the Euclidean distance from the spot’s centroid to the reference center; and azimuth angle
${\theta}_{i}=\arctan \frac{c_{y_{i}}-{y}_{\mathrm{ref}}}{c_{x_{i}}-{x}_{\mathrm{ref}}}$
 , the direction angle relative to the reference center.
3 Results and discussion
To comprehensively evaluate the overall processing capability of the proposed system, multiple sets of experiments were designed and conducted. The experimental design covers various aspects including overall model performance, ablation analysis, comparative experiments, convergence studies and reference detection accuracy, aiming to provide a holistic assessment of the method’s comprehensive efficacy and practical engineering applicability. All comparative experiments adhere to a consistent training–validation–test dataset split to ensure the comparability of the results. The final reported values are averaged over three independent runs using different random seeds.
3.1 Dataset and experimental environment
3.1.1 Dataset construction
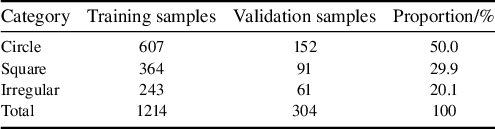
All data for the validation experiments were sourced from laser spot images acquired during the operation of the SG-II facility from 2024 to 2025. The dataset comprises 1214 training images and 304 validation images, encompassing three typical spot morphologies: ‘circle’, ‘square’ and ‘irregular’.
These three morphologies coexist simultaneously during facility operation and correspond to spot patterns at different optical path positions. Specifically, the circular spot is the near-field morphology of the rod amplifier before main amplification injection, the square spot is the near-field morphology at the main amplification output and the irregular spot is the far-field morphology at the main amplification output.
Standard examples of these three categories are shown in Figure 9. All images were uniformly resized to 800×800 pixels during preprocessing. Pixel-level annotation was performed using the LabelMe tool and subsequently converted to the YOLO format.
Examples of three types of laser spots: (a) circle; (b) square; (c) irregular.

While the dataset size (1214 training + 304 validation images) is modest for deep learning, strong pre-training on the COCO database and data augmentation effectively mitigate overfitting risks. Three independent runs show stable performance, indicating good generalization.
The detailed category distribution of the dataset is presented in Table 2. It can be observed that the ‘circle’ category constitutes approximately 50% of the dataset, which aligns with the most common physical characteristic of far-field spots in the actual operation of the SG-II facility.
Distribution of the laser spot dataset.

Table 2 Long description
The table consists of four columns: Category, Training samples, Validation samples, and Proportion/percent.
* Row 1: Circle category contains 607 training samples and 152 validation samples, accounting for 50.0 percent of the dataset.
* Row 2: Square category contains 364 training samples and 91 validation samples, accounting for 29.9 percent of the dataset.
* Row 3: Irregular category contains 243 training samples and 61 validation samples, accounting for 20.1 percent of the dataset.
* Row 4: Total values are 1214 training samples and 304 validation samples, totaling 100 percent.
The dataset is mainly derived from normal SG-II facility alignment scenarios, with approximately 20% low signal-to-noise ratio (SNR) (<15 dB) samples included, while systematic coverage of extreme anomalies (beam missing, strong saturation, severe misalignment, out-of-reference spots) is limited due to their extremely low occurrence frequency and insufficient annotated samples. For real-time alignment, a graceful degradation mechanism is adopted: the system raises detection failure flags for abnormal cases instead of outputting erroneous estimates, triggering manual intervention to ensure operational safety.
3.1.2 Experimental environment
The experiments were conducted on a computer running the Windows 11 operating system. The hardware configuration included an Intel Core i9-14900HX processor (with a base frequency of 2.20 GHz) and an NVIDIA GeForce RTX 4060 Laptop GPU (with 16 GB of VRAM). The software environment consisted of Python 3.13, PyTorch 2.8.0 and CUDA 12.9. The training was implemented based on the Ultralytics YOLOv8 framework.
3.2 Evaluation metrics
This study employs a three-tier evaluation system encompassing segmentation accuracy, localization accuracy and reference center accuracy.
Segmentation performance is primarily evaluated using the mean average precision (mAP), which is calculated strictly following the standard COCO evaluation protocol for instance segmentation tasks. The core calculation rules are defined as follows: average precision (AP) is computed as the area under the precision–recall curve for each spot category, and mAP is the arithmetic mean of AP across all three spot categories. The IoU between the predicted segmentation mask and the ground-truth mask is used as the core criterion to distinguish true positive and false positive predictions. Two mAP variants are adopted in this study:
(1) mAP@0.5 uses a fixed IoU threshold of 0.5, and the final value is the mean of AP for all categories under this single threshold;
(2) mAP@0.5:0.95 averages the AP results over 10 evenly spaced IoU thresholds from 0.5 to 0.95 with a step size of 0.05, serving as the primary metric for comprehensive segmentation accuracy evaluation.
Localization accuracy is quantified by the Euclidean distance between the predicted centroid and the annotated ground-truth centroid. Reference center accuracy is comprehensively assessed based on the localization error and the detection success rate, the latter defined as the proportion of samples where the localization error is less than 5 pixels.
3.3 Ablation study (network component analysis) and module contribution validation
3.3.1 Impact of backbone network improvements
Progressive ablation experiments demonstrate that the baseline YOLOv8-seg model achieves a baseline mAP@0.5 performance of 0.872 ± 0.003. The introduction of the CBAM module increases this score to 0.891 ± 0.002, an improvement of 2.18%, validating its effectiveness in extracting features from low-contrast spots. Although the dynamic multi-scale fusion strategy causes a slight overall decrease in mAP@0.5 to 0.885 ± 0.004, it increases the recall rate for the irregular category by 4.1%, indicating enhanced adaptability to deformed targets. The circularity constraint loss function raises the average circularity of circle-type spots from 0.832 to 0.896.
The full model, integrating all improvements, achieves an mAP@0.5 of 0.901±0.002, representing a 3.33% improvement over the baseline, with only a 10 ms increase in inference time. It maintains real-time processing capability at 55 ms per frame on an RTX 4060 GPU. The detailed results are listed in Table 3.
Results of ablation experiments on backbone network improvements (network component analysis) a .

Table 3 Long description
The table consists of five columns: Model configuration, m A P at 0.5, m A P at 0.5 to 0.95, Inference time in milliseconds, and Training G P U memory in G B.
* Y O L O v 8-seg baseline: m A P at 0.5 is 0.872 plus or minus 0.003. m A P at 0.5 to 0.95 is 0.756 plus or minus 0.004. Inference time is 45 plus or minus 1. G P U memory is 8.7 plus or minus 0.2.
* Plus C B A M attention: m A P at 0.5 is 0.891 plus or minus 0.002. m A P at 0.5 to 0.95 is 0.774 plus or minus 0.003. Inference time is 48 plus or minus 1. G P U memory is 8.9 plus or minus 0.2.
* Plus Dynamic multi-scale fusion: m A P at 0.5 is 0.885 plus or minus 0.004. m A P at 0.5 to 0.95 is 0.781 plus or minus 0.002. Inference time is 52 plus or minus 1. G P U memory is 9.1 plus or minus 0.2.
* Plus Circle constraint loss: m A P at 0.5 is 0.888 plus or minus 0.003. m A P at 0.5 to 0.95 is 0.771 plus or minus 0.005. Inference time is 47 plus or minus 1. G P U memory is 8.8 plus or minus 0.2.
* Full model: m A P at 0.5 is 0.901 plus or minus 0.002. m A P at 0.5 to 0.95 is 0.788 plus or minus 0.003. Inference time is 55 plus or minus 2. G P U memory is 9.2 plus or minus 0.2.
Asterisks indicate statistically significant improvements over the baseline with p less than 0.01 for single asterisk and p less than 0.005 for double asterisks.
a The term ‘ablation experiments’ here refers to network component validation in machine learning, not the physical process of laser ablation.
* and ** indicate statistically significant improvement compared to baseline (*p < 0.01, **p < 0.005).
Per-class performance metrics.

Table 4 Long description
The table consists of six columns: Class, A P @ 0.5, A P @ 0.5 to 0.95, Precision, Recall, and F 1.
* Circle: A P @ 0.5 is 0.912, A P @ 0.5 to 0.95 is 0.798, Precision is 0.926, Recall is 0.908, and F 1 is 0.917.
* Square: A P @ 0.5 is 0.898, A P @ 0.5 to 0.95 is 0.782, Precision is 0.918, Recall is 0.918, and F 1 is 0.918.
* Irregular: A P @ 0.5 is 0.893, A P @ 0.5 to 0.95 is 0.784, Precision is 0.872, Recall is 0.901, and F 1 is 0.886.
* Mean: A P @ 0.5 is 0.901, A P @ 0.5 to 0.95 is 0.788, Precision is 0.905, Recall is 0.909, and F 1 is 0.907.
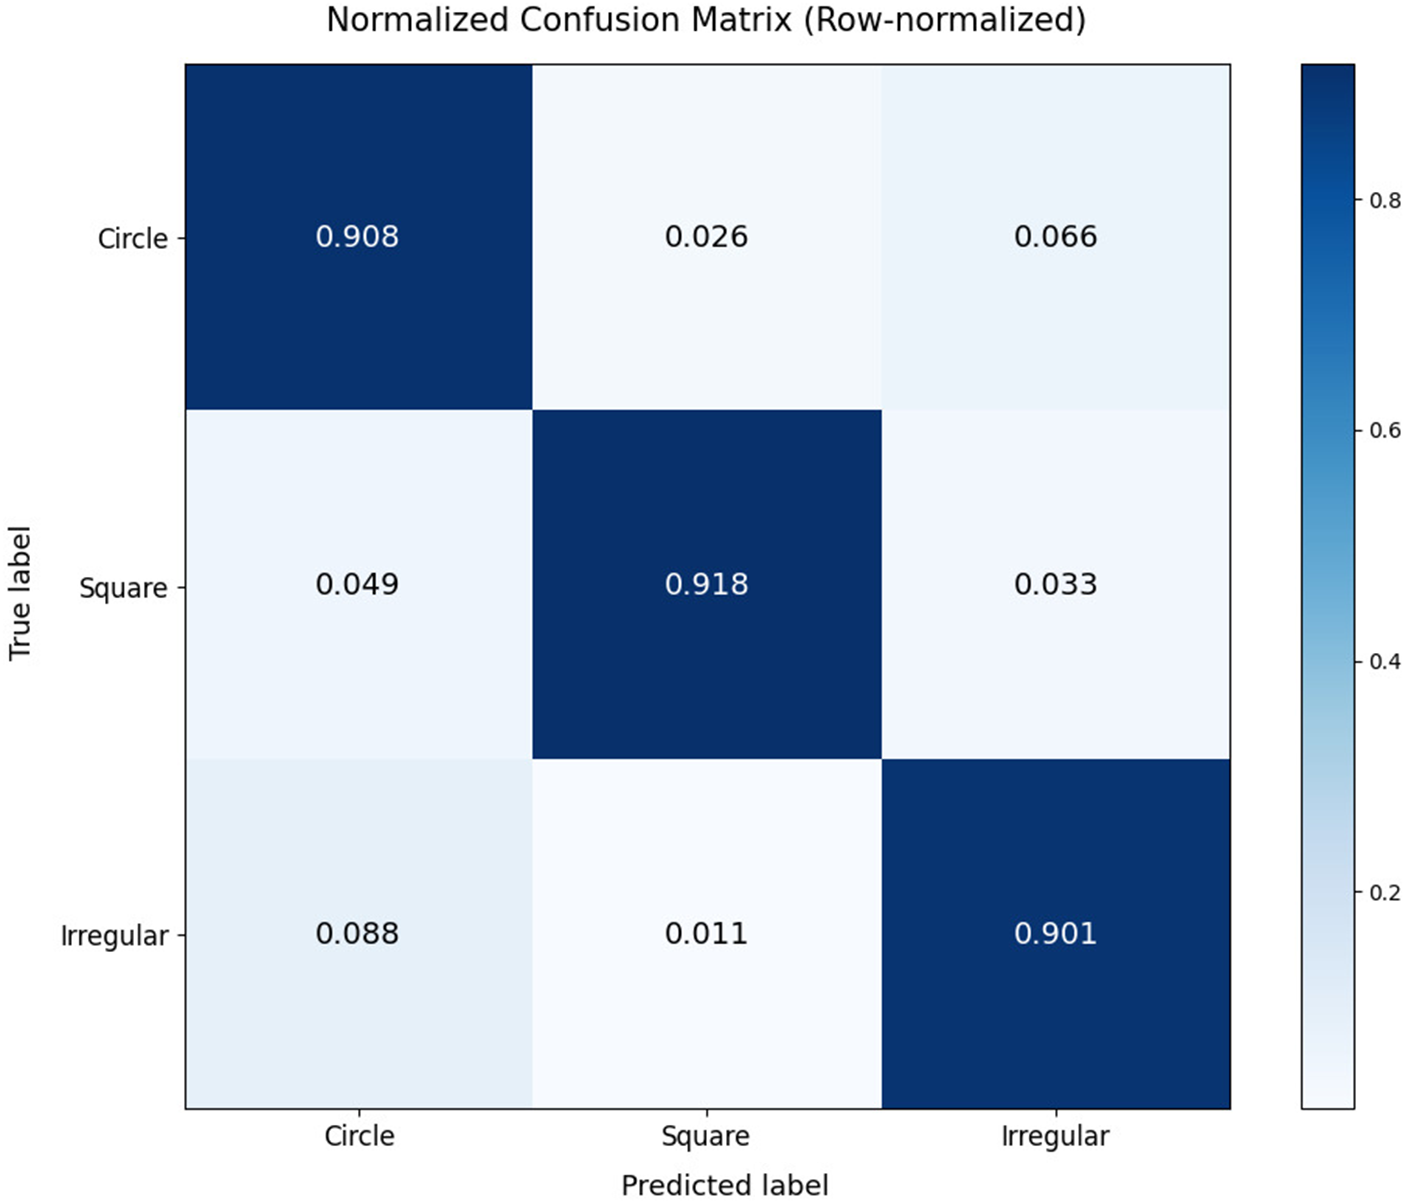
To further analyze the model’s performance across different spot types, we present the confusion matrix and per-class metrics in Figure 10. The results demonstrate that the model achieves consistent performance across all three categories.
Confusion matrix for three spot types at the IoU threshold of 0.5.

Figure 10 Long description
The heatmap displays a three by three grid with Truth labels on the vertical y-axis and Predict labels on the horizontal x-axis. Both axes list Circle, Square, and Irregular. A color scale bar on the right indicates values from 0.0 to 0.8 in shades of blue.
* The first row for Truth label Circle shows values of 0.908 for Circle, 0.026 for Square, and 0.066 for Irregular.
* The second row for Truth label Square shows values of 0.049 for Circle, 0.918 for Square, and 0.033 for Irregular.
* The third row for Truth label Irregular shows values of 0.088 for Circle, 0.011 for Square, and 0.901 for Irregular.
The diagonal cells from top-left to bottom-right represent correct predictions and are colored dark blue, indicating high accuracy above 0.9 for all categories.
The model achieves consistent and competitive detection performance across all three spot categories, with a mean AP@0.5 of 0.901. Notably, the circle class achieves the highest AP@0.5 (0.912), with a precision of 0.926 and recall of 0.908, benefiting from its distinct circular shape and abundant training samples (50% of the dataset). The irregular class, despite having the smallest sample size (20% of the dataset), maintains excellent performance with an AP@0.5 of 0.893 and the highest F1-score of 0.918, demonstrating the model’s outstanding robustness to shape variations. The square class also delivers balanced detection capability with a high recall of 0.901, ensuring reliable and low-miss-rate detection in practical laser alignment scenarios, as shown in Table 4.
3.3.2 Impact of post-processing optimization on contour quality
The post-processing module takes the raw segmentation mask as input and sequentially performs morphological filtering and shape constraint optimization. Without post-processing, the radius error for circle-type spots was 2.35 ± 0.15 pixels, and the circularity error was 0.068 ± 0.008. After introducing the morphological filtering layer (with a 1×1 opening kernel and a 4×4 closing kernel), the radius error decreased to 2.01 ± 0.11 pixels (an improvement of 14.5%, p < 0.01), the circularity error decreased to 0.051 ± 0.006, and the processing time increased by 3 ms. Upon adding the circularity constraint layer (which blends the predicted mask with an ideal circle in a 3:7 weight ratio), the radius error was further reduced to 1.92 ± 0.09 pixels (a cumulative improvement of 18.3%, p < 0.01) and the circularity error decreased to 0.041 ± 0.005, with a total processing time increase of 8 ms. The effects of post-processing optimization are summarized in Table 5.
Summary of post-processing optimization effects a .

Table 5 Long description
The table consists of four columns: Post-processing configuration, Radius error forward slash pixel, Circularity error, and Processing time forward slash m s.
Row 1: No post-processing. Radius error is 2.35 plus or minus 0.15. Circularity error is 0.068 plus or minus 0.008. Processing time is the Baseline.
Row 2: plus Morphological filtering. Radius error is 2.01 plus or minus 0.11. Circularity error is 0.051 plus or minus 0.006. Processing time is plus 3.
Row 3: plus Circle constraint. Radius error is 1.92 plus or minus 0.09 asterisk. Circularity error is 0.041 plus or minus 0.005 asterisk. Processing time is plus 5.
Row 4: Complete post-processing. Radius error is 1.92 plus or minus 0.09 asterisk. Circularity error is 0.041 plus or minus 0.005 asterisk. Processing time is plus 8.
Notes: asterisk indicates statistically significant improvement where p is less than 0.01.
a * indicates statistically significant improvement (p < 0.01).
3.3.3 Training dynamics analysis and performance evaluation
This study provides a detailed analysis of the model’s performance throughout the training process, with a specific focus on the evolution of the segmentation loss and the mAP.
Figure 11 illustrates the variation of the segmentation loss during training and validation. After a brief peak at epoch 56, the segmentation loss continued to decline, indicating stable learning convergence. The brief validation loss peak at epoch 56 coincides with the transition from learning rate warm-up to cosine annealing schedule. This transient instability quickly resolves as the optimizer adapts to the new learning rate regime, demonstrating good training robustness.
Segmentation loss trend.

Figure 11 Long description
The x-axis is labeled Epoch and ranges from 0 to 140. The y-axis is labeled Loss and ranges from 0 to 4. A legend in the top right identifies two lines. Train seg loss in dark blue and Val seg loss in yellow.
* The Train seg loss line begins at approximately 1.3 and follows a steady asymptotic decay, decreasing smoothly to approximately 0.5 by epoch 140.
* The Val seg loss line begins much higher at approximately 4.7. It drops sharply within the first 5 epochs to around 1.6, then exhibits significant volatility between epochs 5 and 40.
* A prominent vertical spike occurs in the Val seg loss at approximately epoch 55, reaching a loss value of 2.7 before immediately returning to the baseline trend.
* After epoch 60, the Val seg loss stabilizes with minor fluctuations, maintaining a consistent gap above the training loss and ending at approximately 0.8.
Figure 12 shows the progression of the segmentation mAP metrics across training epochs. It can be observed that both mAP@0.5 and mAP@0.5:0.95 increased rapidly during the initial phase before stabilizing. The final mAP@0.5 approached 0.9, while mAP@0.5:0.95 stabilized around 0.75, demonstrating a steady improvement in segmentation performance.
Segmentation mAP metrics trend.

Figure 12 Long description
The X-axis is labeled Epoch and ranges from 0 to 140. The Y-axis is labeled m A P and ranges from 0.1 to 0.9. Two lines are plotted.
* The top line, colored yellow, represents m A P at 0.5. It shows a rapid logarithmic increase from 0.1 to approximately 0.75 within the first 10 epochs. It then continues a jagged upward trend, fluctuating between 0.8 and 0.9 for the remainder of the training. A significant sharp downward spike occurs near epoch 55 before immediately recovering.
* The bottom line, colored dark red, represents m A P at 0.5 colon 0.95. It follows a similar trajectory but at a lower intensity, rising quickly to 0.6 by epoch 10 and then stabilizing into a slow, jagged climb that plateaus around 0.75. It also exhibits the same sharp downward spike at epoch 55.
A legend in the bottom right corner identifies the yellow line as m A P at 0.5 and the dark red line as m A P at 0.5 colon 0.95.
The loss variation curve indicates that the model can stably learn effective feature representations from the data. As training progresses, the loss value continuously decreases, reflecting a gradual improvement in the model’s fit to the training samples and a corresponding reduction in prediction error. The transient peak in the mid-training phase is attributed to the learning rate strategy transition, rather than model overfitting or dataset bias. The model quickly recovers and continues to optimize thereafter, further validating its excellent training stability and robustness. Concurrently, the mAP metrics show a steady upward trend, with a particularly noticeable improvement during the initial training stage, indicating that the model’s segmentation performance is substantively enhanced as training proceeds. Overall, the proposed model exhibits stable convergence characteristics and continuous performance improvement throughout the training process, and converges stably to high performance, providing a reliable foundation for its further optimization and practical deployment.
3.4 Comparative validation with mainstream methods
To validate the performance of the proposed system in practical applications and provide an objective comparison with current mainstream image segmentation models, this section conducts comparative experiments using a separately acquired standard test set against classical segmentation models, such as U-Net and Mask R-CNN. This test set is independent from the validation set (304 images) used in the ablation experiments in terms of acquisition time and sample distribution. It specifically includes approximately 20% of low SNR (<15 dB) samples to thoroughly evaluate the generalization capability of each model on unseen data, particularly under challenging conditions.
All comparison models use identical training/validation data splits and data augmentation strategies. Each model is trained for 100 epochs with its default optimizer configuration to ensure fair comparison at their respective optimal settings.
For comprehensive evaluation, we also include DeepLabv3+[ Reference Chen, Zhu, Papandreou, Schroff and Adam 30 ] and SegFormer[ Reference Xie, Wang, Yu, Anandkumar, Alvarez and Luo 31 ], two representative semantic segmentation methods. DeepLabv3+ employs atrous spatial pyramid pooling (ASPP) for multi-scale feature extraction, while SegFormer leverages transformer architecture for global context modeling. These methods complement the comparison by representing different architectural paradigms: CNN-based encoder–decoder (U-Net, DeepLabv3+), two-stage detector (Mask R-CNN), transformer-based (SegFormer) and single-stage instance segmentation (YOLOv8-seg).
As shown in Table 6, the comparative results indicate that U-Net’s performance is significantly limited in overlapping spot scenarios due to its lack of an instance discrimination mechanism, achieving an mAP@0.5 of only 0.853 ± 0.005 with an inference time of 56 ± 2 ms/frame, making it difficult to meet alignment requirements. Although Mask R-CNN achieves a precision of 0.879 ± 0.004, its two-stage detection pipeline results in a heavy computational burden, with an inference time of 83 ± 3 ms/frame, a parameter count of 4.42 × 10⁷ and excessive computational overhead. Among the additional semantic segmentation methods included for comprehensive comparison, DeepLabv3+ achieves mAP@0.5 = 0.871 ± 0.004 with an inference time of 45 ± 2 ms/frame, outperforming U-Net but still limited by its semantic segmentation architecture in instance-level tasks, while SegFormer achieves mAP@0.5 = 0.884 ± 0.003 with an inference time of 67 ± 2 ms/frame, demonstrating the effectiveness of transformer architectures, but its higher computational cost (3.78 × 10⁷ parameters, 2.83 × 10¹⁰ Mac FLOPs) and slower inference make it less suitable for real-time applications. All these methods lack explicit instance discrimination mechanisms, resulting in performance degradation when handling overlapping spots. In contrast, the proposed system achieves mAP@0.5 = 0.901 ± 0.002 and mAP@0.5:0.95 = 0.765 ± 0.003 on the standard test set, with an inference time of only 55 ± 2 ms/frame (comparable to U-Net at 56 ms but with 4.8% higher accuracy), more than 30% faster than Mask R-CNN (83 ms versus 55 ms) and 18% faster than SegFormer (67 ms versus 55 ms). Furthermore, it maintains the lowest resource consumption among all compared methods with only 2.65 × 10⁷ parameters, 1.57 × 10¹⁰ Mac FLOPs and 2.1 GB memory usage. The proposed system attains the optimal balance of accuracy, speed and efficiency, with the 55 ms inference time being significantly lower than the 1 Hz cycle requirement of the SG-II laser facility, demonstrating significant advantages for practical deployment.
Performance comparison among different segmentation methods a .

Table 6 Long description
The table compares five methods across six columns: Method, m A P at 0.5, m A P at 0.5 to 0.95, Inference time in milliseconds, Parameters in M, F L O P s in G Mac, and Inference memory usage in G B.
* U-Net: 0.853 plus or minus 0.005, 0.732 plus or minus 0.006, 56 plus or minus 2, 31.0, 18.2, 2.8.
* Mask R-C N N: 0.879 plus or minus 0.004, 0.761 plus or minus 0.005, 83 plus or minus 3, 44.2, 42.5, 4.1.
* DeepLabv3 plus: 0.871 plus or minus 0.004, 0.748 plus or minus 0.005, 45 plus or minus 2, 35.6, 24.8, 3.2.
* SegFormer: 0.884 plus or minus 0.003, 0.769 plus or minus 0.004, 67 plus or minus 2, 37.8, 28.3, 3.5.
* Proposed system: 0.901 plus or minus 0.002, 0.765 plus or minus 0.003, 55 plus or minus 2, 26.5, 15.7, 2.1.
The Proposed system shows statistically significant improvements in m A P at 0.5, Inference time, Parameters, F L O P s, and Memory usage.
a Generalization to other laser facilities with different imaging parameters (pixel size, magnification, spot characteristics) remains to be validated. The proposed method framework can be adapted through fine-tuning on target facility data. It should be noted that the real-time inference performance reported in this paper is obtained from offline platform tests. * indicates statistically significant improvement (p < 0.01).
3.5 Evaluation of reference center detection accuracy
The three-level progressive reference detection framework proposed in this paper demonstrates robust performance on a 500-image test set, with recognition results for the three types of centers shown as examples in Figure 13. Performance evaluation on the standard test set (n = 500) shows that the four-dot pattern detection achieves a localization error of 1.8 ± 0.3 pixels with a success rate of 98.5%. This high precision primarily stems from its strict geometric constraint mechanism. The cross-mark detection strategy, implemented via a lightweight YOLOv8 model (with only 2.3 × 10⁶ parameters), achieves robust localization under partial occlusion, with a detection error of 1.9 ± 0.4 pixels and a success rate of 96.2%. When both aforementioned detection levels fail, the system automatically defaults to using the image geometric center.
Effects of three types of reference center detection: (a) four-dot pattern; (b) cross-mark; (c) image geometric center.

Figure 13 Long description
A three-panel set of digital captures showing reference center detection.
Panel a shows a four-dot pattern. Four green circles are positioned at the corners of an X-shape, connected by cyan lines that intersect at a central red circle. Text in the top-left corner reads: Spot type circle, Center (404, 276), Distance 7.6 p x, Reference four_dots.
Panel b shows a cross-mark pattern. A large red circle contains a black crosshair. At the intersection of the crosshair, there is a small green and blue marker. Text in the top-left corner reads: Spot type circle, Center (378, 303), Distance 7.2 p x, Reference cross.
Panel c shows an image geometric center. A blue square is inscribed within a cyan circle. A small cyan dot with a yellow tail indicates the center point. Text in the top-left corner reads: Spot type square, Center (421, 435), Distance 40.8 p x, Reference default.
3.6 Visual analysis of experimental results
To intuitively validate the practical performance of the proposed method, this section presents the spot segmentation results and reference center identification outcomes under typical scenarios.
Figure 14 demonstrates the segmentation effects for the three spot types. The results in typical scenarios show that the system achieves high-precision segmentation and parameter extraction for circle-type spots (radius: 143.0 pixels, offset: 10.3 pixels), square-type spots (side length: 303.8 pixels, offset: 14.6 pixels, rotation angle: 3.38°) and irregular-type spots (offset: 50.1 pixels). These results verify the method’s strong adaptability to diverse spot morphologies.
Segmentation results of the three spot types: (a) circle; (b) square; (c) irregular.

Figure 14 Long description
A three-panel set of microscopic or optical spot segmentations on a black background.
Panel a, top-left. Text indicates Spot type circle, Center 400, 426, Distance 10.3 p x, and Reference cross. The visual shows a red circle outline centered on a faint circular spot with a green crosshair at the center.
Panel b, center. Text indicates Spot type square, Center 260, 242, Distance 14.6 p x, and Reference default. The visual shows a dark square shape outlined in blue, enclosed within a larger cyan circle. A small green circle and crosshair are at the center.
Panel c, top-right. Text indicates Spot type irregular, Center 690, 514, Distance 50.1 p x, and Reference cross. The visual shows a bright, irregular white blob outlined in blue, centered within a cyan circle. A green crosshair marks the central reference point.
4 Conclusion
To address the fundamental limitations of classical alignment pipelines and the demand for automated alignment of the SG-II high-power laser facility, this study proposes a full-stack intelligent spot analysis system. The core breakthroughs of this work lie in three systematic methodological innovations for high-power laser alignment, which go far beyond incremental architectural optimizations to the instance segmentation model.
-
(1) An end-to-end perception-to-control alignment framework that directly maps raw spot images to executable motor control parameters, eliminating cumulative errors from multi-stage decoupled processing in classical pipelines.
-
(2) A three-level progressive reference center detection methodology with priority-based redundant design, which solves the long-standing reliability bottleneck of single-reference methods under complex imaging conditions.
-
(3) A multi-objective collaborative optimization methodology that balances segmentation accuracy, real-time inference performance and operational safety for engineering pre-deployment.
Guided by the above methodological framework, we further optimize the YOLOv8-seg instance segmentation model via circularity constraint loss, CBAM attention mechanism and dynamic multi-scale fusion. The optimized model achieves an mAP@0.5 of 0.901 with superior parameter efficiency compared to mainstream segmentation models. Offline validation fully confirms the effectiveness of the proposed methodological innovations: the three-level progressive reference detection framework achieves a localization error within 1.9 pixels and a 98.7% success rate, with significantly higher reliability than single-mode detection methods; the end-to-end alignment framework reduces full-process processing latency to 0.8 s, well below the 1 Hz cycle requirement of the facility; the multi-objective optimization methodology enables the system to achieve the optimal balance among accuracy, speed and resource consumption, with only 2.65 × 10⁷ parameters and 2.1 GB memory usage.
Compared to current mainstream methods, the proposed system demonstrates excellent performance in segmentation accuracy, real-time capability and parameter efficiency.
At the current stage, the system has completed full offline test validation, and we are conducting performance testing with the latest alignment image data from the facility. After the processing speed and detection success rate meet the engineering requirements, the system will be deployed to the facility for online verification.
Subsequent research will focus on the practical deployment of the alignment system. This includes model lightweighting to adapt to multi-beamline parallel processing, exploring online incremental learning to counteract performance drift caused by optical component aging and integrating digital twin technology to achieve predictive control of the alignment process. These efforts aim to advance the facility’s beamline alignment from a semi-automatic adjustment mode towards an intelligent and autonomous operational paradigm.
Acknowledgement
This work was supported by the Operation Project of the Shenguang-II Laser Facility, National Laboratory on High Power Laser and Physics, Shanghai Institute of Optics and Fine Mechanics, Chinese Academy of Sciences (Grant No. 86CL020101).













 Open access

