Introduction
The exponential growth in data traffic driven by 5G and 6G systems requires advanced interconnects able to operate at millimeter-wave frequencies, such as E-band (60–90 GHz), W-band (75–110 GHz), D-band (110–170 GHz), G-band (140–220 GHz), and beyond up to 300 GHz with the new IEEE 802.15.3d [Reference Petrov, Kurner and Hosako1]. These frequency bands are increasingly important for advancing technologies such as telecommunications, automotive systems, and radar and defense applications [Reference Nallappan, Guerboukha, Cao, Xu, Nerguizian, Mittleman and Skorobogatiy2–Reference Geiger, Grüner, Fischer, Dürr, Chaloun and Waldschmidt4]. Rectangular and circular hollow-core metallic waveguides have traditionally been used at these frequencies, but a lack of flexibility limits their suitability for mm-wave systems [Reference Pozar5,Reference De Wit, Ooms, Philippe, Zhang and Reynaert6]. Flexible waveguides (FWGs) can overcome these constraints, enabling more compact and integrated designs. Such FWGs are applicable to terahertz imaging in confined spaces, support signal transmission through complex geometries, and enable new interconnect approaches for radar systems [Reference Geiger, Grüner, Fischer, Dürr, Chaloun and Waldschmidt4,Reference Li and Zhang7,Reference Koala, Maru, Iyoda, Yi, Fujita and Nagatsuma8]. However, this flexibility also introduces some drawbacks, such as increased losses and dispersion, which have to be reduced.
Despite recent progress in FWGs and coaxial cables for millimeter-wave applications, several limitations remain regarding bandwidth, losses, flexibility, weight, and manufacturing complexity. A preliminary version of the proposed FWG was presented at the EuMW Conference in 2025 [Reference Renau, Gyawali, Cranny, Logette, Géas, Baudin, Charif, Burgnies, Szriftgiser and Ducournau9], demonstrating a FWG using an industrial-grade polytetrafluoroethylene (PTFE) core operating in a single-mode regime over a partial frequency range of the W-band. The present manuscript significantly extends the previous work through several key advancements. First, a PTFE core with lower dielectric loss is introduced to lower the attenuation constant of the FWG. Second, the waveguide cross-sectional sizes are geometrically downscaled to achieve single-mode operation across the entire W-band. Third, the attenuation constant is analytically derived and systematically compared with simulation and measurement results. Fourth, coupling loss and the effective refractive index are experimentally extracted and analyzed in detail. Table 1 summarizes the differences between the conference paper and the present extended manuscript.
Evolution of the proposed FWG in comparison with the previous one shown in [Reference Renau, Gyawali, Cranny, Logette, Géas, Baudin, Charif, Burgnies, Szriftgiser and Ducournau9]

Table 1 Long description
Three columns compare Feature values for EuMW 2025 and This Work. For PTFE loss tangent, EuMW 2025 is 0.0005 and This Work is 0.0002. For single mode bandwidth, EuMW 2025 is 45 to 86 GHz, noted as partial W band, and This Work is 58 to 117 GHz, noted as full W band. For attenuation constant, EuMW 2025 states, Comparison of the measured losses with simulation, while This Work states, Comparison the measured losses with analytical formulas and simulation. For effective refractive index analysis, EuMW 2025 is, Shortly presented, and This Work is, Analyzed in detail.
The previously reported wideband signal transmission measurement at 80 GHz is retained unchanged to demonstrate the practical interconnect capability of the proposed waveguide. The contribution of this work doesn’t merely lie in low-loss performance, but also in the realization of a FWG platform that combines a broad bandwidth with single-mode operation, tight bendability, lightweight, simple industrial-grade fabrication, together with a comprehensive characterization of losses.
Dielectric waveguides have significantly evolved since the early theoretical investigations by Hondros and Debye in 1910, which first explored electromagnetic (EM) propagation in dielectric media [Reference Hondros and Debye10]. Early implementations focused on solid dielectric rods in free space but exhibited inherent radiation losses, particularly under bending and discontinuities [Reference Morgan11,Reference Tischer12]. This understanding was further advanced in the 1990s and 2000s through rigorous analysis of rectangular dielectric cores inside metallic enclosures, which highlighted the importance of using low-permittivity and low-loss-tangent materials to minimize attenuation [Reference Abbas, Pollard and Kelsall13,Reference Yeh and Shimabukuro14]. Meanwhile, PTFE emerged as a prime candidate for waveguide applications due to its appealing microwave/mm-wave properties, including a low-loss tangent and a stable relative permittivity [Reference García Pérez, Tercero and Ruiz15,Reference Burger, Taute and Hoeft16]. Recent research focuses on various methods for fabricating dielectric waveguides, including precision machining, 3D printing, and extrusion with polymer jackets and conductive coatings [Reference Xu and Skorobogatiy17–Reference Mirzaee and Kim19]. Although modern fabrication technologies simplify production, dielectric-based FWGs still face some performance degradations, including increased losses, dispersion, and potential issues with signal integrity. As a result, FWGs often require a trade-off between transmission performance, manufacturing cost, and ease of fabrication.
In this study, we propose a novel design for a flexible dielectric metallic waveguide fabricated using industrial-grade processes. The FWG was manufactured first by means of an industrial-grade PTFE extrusion with a home-fabricated rectangular-shaped nozzle producing a continuous dielectric core with the required sizes. Then, the dielectric core was wrapped with a silver-plated copper ribbon with spiral deposition for shielding. A metal wire braid was deposited around the metalized core to both protect the ribbon and to contribute to the EM shielding by reducing the suck-out effect commonly appearing in transmission cables, as it will be shown hereafter [Reference Villegas, Adams, Thompson and Jackson20]. Fabrication process is outside the scope of the manuscript, and the parameters of each fabrication stage (extrusion, wrapping, and braiding) were previously optimized for achieving the proposed FWG. The outermost layer of the FWG is coated with fluorinated ethylene propylene (FEP) for protection and durability. Unlike open dielectric waveguides, which suffer from significant performance degradation upon physical contact, the integrated shielding ensures the proposed FWG is touch-insensitive and robust for practical handling without compromising electrical performance.
Waveguide design and analysis
Waveguide design
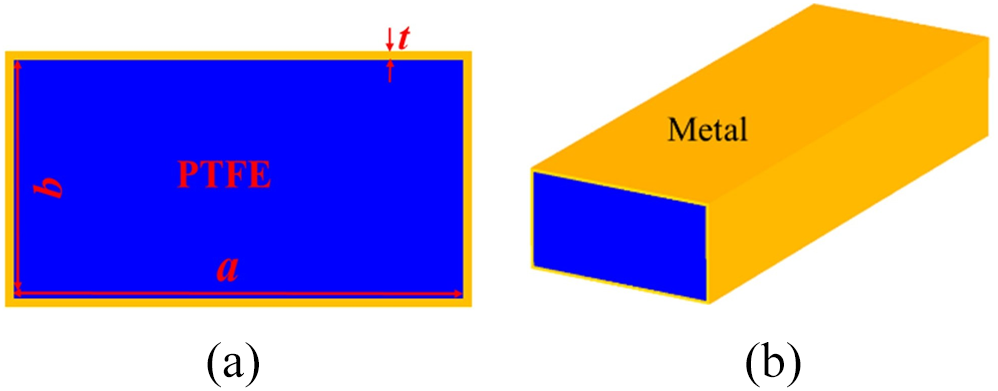
Figure 1 shows the cross-section and perspective view of the waveguide. It consists of a rectangular PTFE core with dimensions a = 1.77 mm and b = 0.88 mm, enclosed by EM shielding. Sizes a and b were optimized through a parametric simulation sweep in CST Studio Suite [21] to ensure single-mode propagation over the entire W-band. In the present work, FWG samples were fabricated using a high-grade PTFE with a complex permittivity of εr = 2.1 (1 – i 0.0002). The loss tangent of high-grade PTFE is lower than tan δ = 0.0005 for the PTFE used in the previous study [Reference Renau, Gyawali, Cranny, Logette, Géas, Baudin, Charif, Burgnies, Szriftgiser and Ducournau9]. The EM shielding is implemented using both a metal ribbon and a conductive wire braid, producing a shielding thicker than the skin depth in the W-band. Then, a solid silver conductor layer with thickness t = 0.03 mm was used in simulation as an idealized representation, as shown in Fig. 1(b). The core sizes were numerically optimized in order to achieve the required cutoff frequency and to ensure single-mode operation in the entire W-band. The proposed waveguide was analyzed and optimized through EM simulation using CST Studio Suite. To reduce computational cost, simulations were performed on short waveguide lengths (1, 2, and 5 mm) to extract both the attenuation constant and the effective refractive index. Since the waveguide is longitudinally uniform, the simulated results are length-independent and can be directly compared with the experimental values extracted with longer samples.
(a) Cross-section and (b) perspective view of the flexible waveguide.

Theoretical calculations
The calculated cutoff frequencies of the FWG are 58, 117, 118, and 213 GHz for the first four modes TE10, TE20, TE01, and TE11, respectively. These values confirm a single-mode operation of the fundamental TE10 mode from 58 to 117 GHz. The theoretical analysis of the PTFE-filled rectangular waveguide focuses on calculating the attenuation due to both dielectric and conductor losses for the fundamental TE10 mode. The waveguide has a rectangular core with dimensions a and b. The attenuation constant of the waveguide in dB/m due to dielectric loss can be calculated by [Reference Pozar5],
 \begin{equation}
\begin{split}
{\alpha _d}\, & = 8.686\, \times \,\frac{{{k^2}tan\delta }}{{2\beta }},\,with\,\beta \,\left( {propagation\,constant} \right)\, \\
& = \,\sqrt {{k^2} - {{\left( {\frac{\pi }{a}} \right)}^2}}
\end{split}
\end{equation}
In this expression, k represents the propagation constant of a plane wave in the PTFE, defined as  $k\, = \,\omega \sqrt {\mu \varepsilon } $. Similarly, the attenuation constant of the waveguide in dB/m due to conductor loss can be calculated by [Reference Pozar5],
 \begin{equation*}{a_c} = 8.686\, \times \,\frac{{{R_s}}}{{{a^3}\beta k\eta }}\,\left( {2b{\pi ^2} + {a^3}{k^2}} \right)\,with\,{R_s}\, = \,\sqrt {\frac{{\omega {\mu _0}}}{{2\sigma }}} \end{equation*}
where Rs is the surface resistance of the conducting walls of conductivity σ, μ0 is the permeability of free space, and η is the intrinsic impedance of a plane wave in the dielectric medium, given by  $\eta = \sqrt{\mu/\varepsilon} $. The total attenuation of the waveguide is obtained by summing the dielectric and conductor losses
 $\alpha \, = \,{\alpha _c}\, + \,{\alpha _d}$.
Experimental setup
Characterization of the FWG was performed using a Rohde & Schwarz ZNA26 vector network analyzer (VNA) coupled with 75–110 GHz external millimeter-wave frequency extenders (ZC110 type). The developed waveguides were not mounted with WR-10 flanges. In order to prevent potential damage to the metrological WR10 interface at the output of the external mm-wave heads, two-inch WR10 waveguide sections were added as protective transitions. A TRM (Thru–Reflect–Match) calibration was then carried out to calibrate the VNA together with these additional WR10 transitions, as schematized in Fig. 2. The direct insertion of the FWG in the WR10 introduces some coupling losses, which have been overcome for waveguide loss estimation.
(a) Schematic of calibration plane. (b) View of a flexible waveguide under test: injection at ZC110 extender Port 2.

As demonstrated in previous work [Reference Renau, Gyawali, Cranny, Logette, Géas, Baudin, Charif, Burgnies, Szriftgiser and Ducournau9], the FWG shows consistent electrical performance in both straight and bent configurations. In the present work, all FWG samples were again characterized under both conditions, with the bent configuration using a bending radius as low as Rc = 2 cm, as shown in Fig. 3.
Measurement setup for FWG samples: (a) 30 cm long in straight configuration, (b) 50 cm long in bent configuration with a bending radius Rc = 2 cm.

Measurements of FWG
S-parameters measured in straight configuration
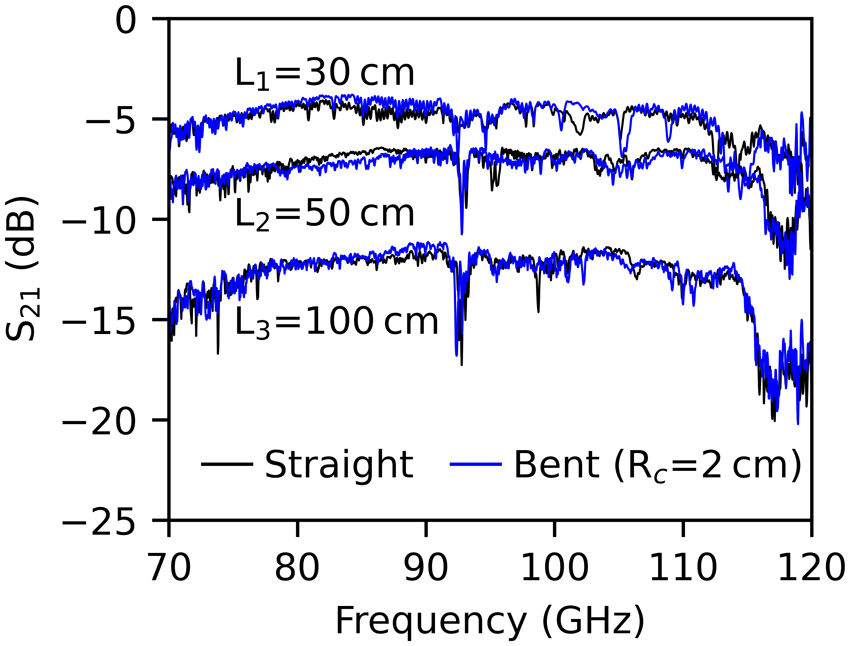
FWG samples of several lengths (L = 30, 50, and 100 cm) were prepared for measurement. The FWG samples can be bent to a minimum curvature radius Rc = 2 cm. S-parameters and group delay for each sample were measured in the frequency range 70–120 GHz. The raw S-parameter data as a function of frequency are plotted in Fig. 4.
S-parameters as a function of frequency: (a) S11, (b) S21.

Figure 4 Long description
S subscript 11, open parenthesis decibel close parenthesis, as a multi line graph with three lines. The horizontal axis label is Frequency, open parenthesis gigahertz close parenthesis, with tick labels 70, 80, 90, 100, 110, 120. The vertical axis label is S subscript 11, open parenthesis decibel close parenthesis, with tick labels 0, negative 20, negative 40, negative 60. Legend entries are L equals 30 centimeter, L equals 50 centimeter and L equals 100 centimeter. The three lines fluctuate across the full frequency range, with repeated narrow dips. Most values lie between about negative 10 and negative 40, with several dips reaching near negative 60. The image B showing S subscript 21, open parenthesis decibel close parenthesis, as a multi line graph with three lines. Text above the plot reads, Single mode. The horizontal axis label is Frequency, open parenthesis gigahertz close parenthesis, with tick labels 70, 80, 90, 100, 110, 120. The vertical axis label is S subscript 21, open parenthesis decibel close parenthesis, with tick labels 0, negative 5, negative 10, negative 15, negative 20, negative 25. Legend entries are L equals 30 centimeter, L equals 50 centimeter and L equals 100 centimeter. The three lines are separated by level across most of the frequency range: the highest line stays near about negative 5 to negative 10, the middle line stays near about negative 10 to negative 15 and the lowest line stays near about negative 15 to negative 20. All three lines show multiple narrow notches, including a deeper notch near the high frequency end close to 120 gigahertz.
In Fig. 4, S 11 is almost the same for all waveguide lengths, confirming a relatively good input impedance matching of the FWG with WR-10. However, even if the S 11 is quite reproducible, it is not perfect, as so far, there is no mode matching/transition from the hollow-core waveguide (WR10) to the FWG input. The S 21 spectrum for the three different lengths evidences an attenuation increase with the waveguide length, validating the expected length-dependent attenuation trend (including the coupling losses integrated in the measurement). The narrowband attenuation shown at 91−94 GHz in Fig. 4(b) is related to the suck-out effect due to an unavoidable small gap between overlapped metallic ribbons producing a small field leakage. Such an effect commonly appears in high-speed transmission cables shielded by a ribbon with spiral deposition [Reference Villegas, Adams, Thompson and Jackson20]. The frequency of the dip strongly depends on both the gap size (distance between overlapped ribbons) and the gap width (overlap length) [Reference Villegas, Adams, Thompson and Jackson20]. The tension applied to the ribbon during the shielding production acts directly on the value of the gap size, and the frequency of the dip was shown to be highly sensitive to the tension value. Specifically, a shift of the attenuation peak toward a higher frequency was observed for the highest ribbon tensions. As shown in Fig. 4(b), the frequency of the dip is length-independent, but the magnitude of the dip increases when the FWG is longer because the suck-out effect is cumulative. The larger drop near 117 GHz and, more generally, effects beyond 115 GHz are related to the cutoff of the first higher-order mode. In such a case, the waveguide can no longer support a single-mode operation. The resulting mode conversion leads to significant mismatch and loss. As a consequence, extractions shown in the next section will be discussed up to 110 GHz.
Comparison between straight and bent configurations/measurements
Figure 5 presents the measured S 21 responses of the 30, 50, and 100 cm FWGs under both straight and bent configurations, with the bent configuration maintained at a constant bending radius of Rc = 2 cm. Each waveguide was arranged into circular loops: one loop for the 30 cm waveguide, two loops for the 50 cm waveguide, and five loops for the 100 cm waveguide, while maintaining the same fixed bending radius of 2 cm. This arrangement also ensured a consistent separation distance between the two horn antennas, as illustrated in Fig. 3.
Measured S21 responses of 30, 50, and 100 cm flexible waveguides in straight and bent configurations at a constant bending radius of Rc = 2 cm.

For all three waveguide lengths, the measured S 21 magnitude curves for the straight and bent configurations almost overlap, indicating that bending introduces negligible additional propagation loss. This demonstrates the mechanical flexibility of the waveguide and confirms that it can be repeatedly bent to a minimum radius of 2 cm without any significant degradation in transmission performance.
Attenuation constant of the FWG
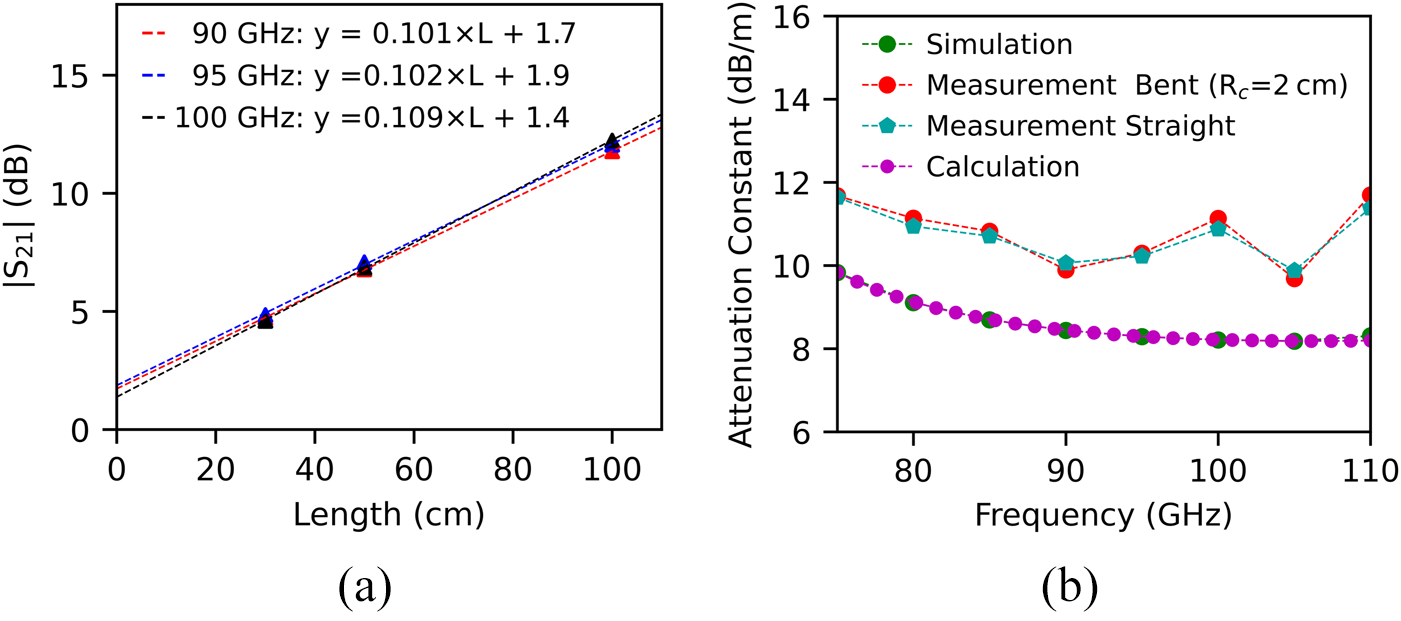
To reduce standing-wave ripples and enable efficient analysis, the raw data were smoothed in linear scale using a 3 GHz moving-average filter. The attenuation constant was extracted using three waveguide lengths (30, 50, and 100 cm). For each frequency, |S₂₁| (in dB) was plotted as a function of length, and a linear regression was performed. The slope of the linear fit yields the attenuation constant (α), while the intercept with the vertical axis (y-axis coordinate) corresponds to the coupling loss (not considered in the analysis). As an example, the attenuation constant, obtained as the slope of the linear fit for three different selected frequencies, is illustrated in Fig. 6(a).
(a) Magnitude of S21 as a function of the waveguide length measured in straight configuration, actual data (triangles) and linear regression (dashed lines). (b) Comparison of the attenuation constant of the flexible waveguide as a function of frequency.

For further analysis, the measured attenuation constant in the 75–110 GHz band is compared with both simulations and theoretical calculations, as presented in Fig. 6(b). To allow a direct comparison of the attenuation constant and the effective refractive index, the FWG was simulated in CST Studio Suite for different lengths. At each frequency, the attenuation constant was obtained in simulation through a linear regression of |S₂₁| versus length, following the same procedure used in experiments. On the other hand, the attenuation constant was also calculated by means of equations (1) and (2). The comparison illustrated in Fig. 6(b) shows acceptable agreement between simulation and measurement results.
All the measured, calculated, and simulated attenuation constants shown in Fig. 6(b) similarly decrease when the frequency increases. Minor deviations observed at 95, 100, and 110 GHz are attributed to ripples in the measured response, likely caused by impedance mismatches during manual waveguide installation. These mismatches are mainly due to small gaps at the transitions, resulting from the lateral size difference between the FWG and the WR-10 metallic waveguide. Despite these localized discrepancies, the overall difference between simulation and measurement remains within approximately 2 dB/m across the entire W-band, and the total attenuation constant for the full W-band is less than 11.7 dB/m.
In addition, the two different sets of measurements (straight and bent configurations) exhibit no significant difference and follow exactly the same trend, confirming that the flexibility of the waveguide does not alter the attenuation constant. This level of agreement confirms that the FWG maintains consistent performance in bent configurations and is suitable for flexible millimeter-wave applications. The discrepancies between experiment and simulation (or calculation) are mainly attributed to fabrication tolerances in the waveguide geometry and surface roughness of the material. Compared with our previous work [Reference Renau, Gyawali, Cranny, Logette, Géas, Baudin, Charif, Burgnies, Szriftgiser and Ducournau9], the current study provides a more comprehensive characterization of the attenuation constant across the entire W-band, enabled by refined fabrication and new measurement data.
Effective refractive index and effective dielectric constant
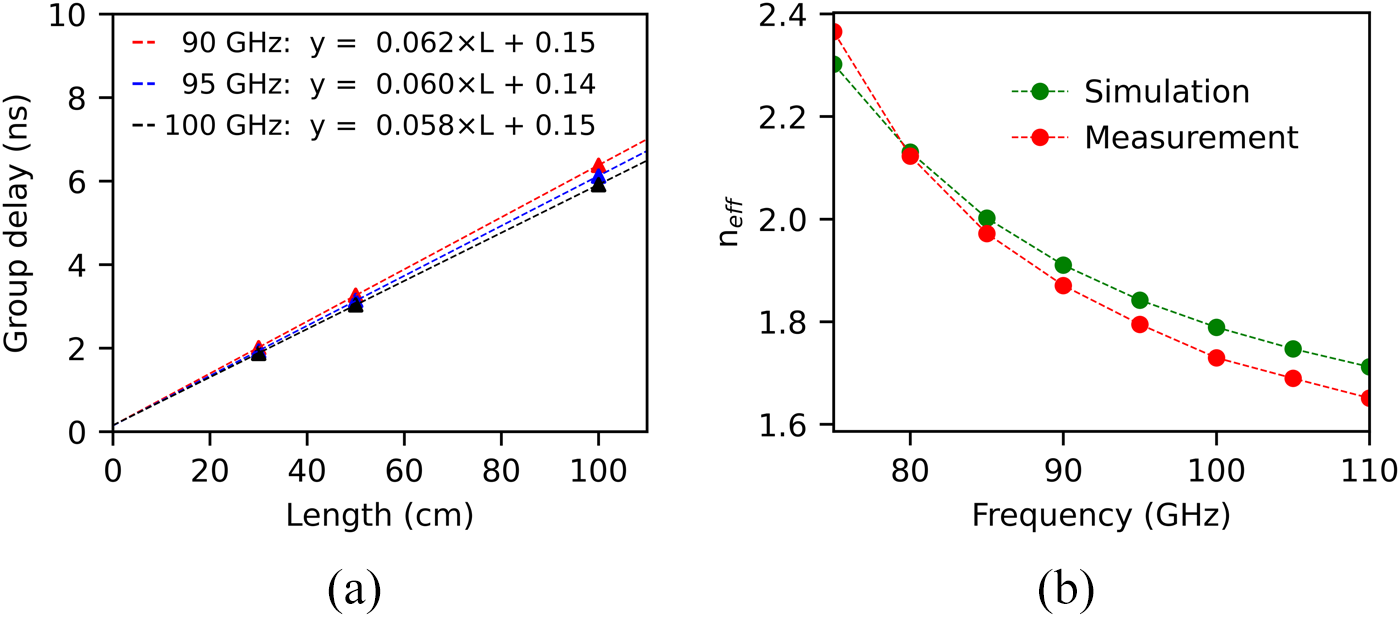
Similar to the waveguide loss, the effective refractive index (n eff) was also measured and compared with simulation. The raw group delay data were first smoothed using a 3 GHz wide moving window average technique. The effective refractive index for each selected frequency was determined from the linear trend of the group delay (τg) versus the waveguide length (L) by multiplying the slope and the speed of light. Similar methods were applied for the extraction of neff in both simulation and experiment. While the group delay was considered in experiments, the propagation constant β was the consistent parameter to consider in simulation. For simulation, β was first calculated at each frequency by means of the frequency solver of CST Studio Suite with the waveguide length as a parameter. Then, similarly to the group delay versus length curve obtained from straight measurement plotted in Fig. 7(a) for experiments, n eff was achieved in simulation by a linear regression of the β -length curve plotted at the different frequencies, as shown by circle marks in Fig. 7(b). The effective dielectric constant (ε eff), obtained directly by squaring n eff, is reported in Table 2.
(a) Group delay as a function of the waveguide length, actual data (triangles) and linear regression (dashed lines). (b) Effective refractive index as a function of frequency.

Measured and simulated effective dielectric constant of the flexible waveguide

Table 2 Long description
Effective dielectric constant, labeled epsilon eff, is listed by frequency in gigahertz with measurement, simulation, and relative error in percent. At 90 GHz, measurement is 3.46 and simulation is 3.61, with relative error 4.16 percent. At 95 GHz, measurement is 3.24 and simulation is 3.39, with relative error 4.42 percent. At 100 GHz, measurement is 3.03 and simulation is 3.17, with relative error 4.42 percent. Measurement and simulation values both decrease as frequency increases from 90 to 100 GHz. Relative error is 4.16 percent at 90 GHz and 4.42 percent at both 95 and 100 GHz.
Values in Table 2 represent the measured and simulated effective dielectric constant for the fundamental mode in the FWG. The effective refractive index shown in Fig. 7(b) and the effective dielectric constant values reported in Table 2 exhibit a strong guiding effect and a pronounced frequency dependence. The close agreement between measurement and simulation validates the accuracy of the EM model and confirms proper mode guidance. Minor discrepancies are likely due to practical factors not considered in the simulation, such as surface roughness and fabrication tolerances. The effective refractive index shown in Fig. 7(b) also confirms stronger field confinement within the waveguide. This indicates that the high-quality metallic cladding effectively supports stable single-mode propagation across the band. Using a 3 GHz window for smoothing the raw data while extracting the attenuation constant, the resulting uncertainty remains below 0.6 dB/m for the attenuation constant and 0.002 for n eff.
Millimeter-wave coaxial cables and FWGs
Recent advancements in millimeter-wave transmission have driven the development of high-performance coaxial cables and FWGs. Table 3 summarizes representative commercially available solutions, highlighting the diversity in structural designs and optimized for specific frequency ranges. Coaxial cables from Junkosha [22] and Totoku [23] operate up to 145 GHz, while those from Insulated Wire [24] operate at frequencies up to 150 GHz. Their attenuation exceeds 20 dB/m. This is significantly higher than the losses observed in FWGs. Among FWG designs, Samtec’s [25] E-band waveguide based on low-loss dielectrics and achieves an insertion loss of around 4.5 dB/m at 90 GHz. The Spinner Group [26] developed a polymer-core waveguide with a black polymer protection layer. This design facilitates mechanical manipulation while maintaining a low attenuation of 2.8 dB for a 600 mm-long waveguide. The FWG reported by Keycom [27] demonstrated a low attenuation constant around 2.5 dB/m. However, it is a dielectric waveguide without metallic shielding. Although such an open waveguide can lead to a low attenuation constant, its sensitivity to the environment generally prevents any mechanical handling, and its integration in practical systems is thus difficult. Additionally, Yonezawa [28] demonstrated a dielectric-core FWG design with conductive wire-braid shielding, exhibiting about 10 dB/m attenuation at 100 GHz. Table 3 also compares the performance of the FWG presented in this study against the advancements achieved over our previous work [Reference Renau, Gyawali, Cranny, Logette, Géas, Baudin, Charif, Burgnies, Szriftgiser and Ducournau9].
Some examples of coaxial cables and flexible waveguides currently available on the market

Table 3 Long description
Rows list reference, company or institute, type or materials, frequency band in the single mode region, and waveguide loss or assembly loss. Coaxial entries are Junkosha, Japan, up to 145 GHz with 28.1 dB per meter at 145 GHz; Totoku, Japan, up to 145 GHz with 21 dB per meter at 145 GHz; and Insulated wire, USA, up to 150 GHz with 25.7 dB per meter at 150 GHz. Flexible waveguide entries include Samtec, USA, frequency band 60 to 90 with about 4.5 dB per meter at 90 GHz; Spinner, Germany, 75 to 110 with about 2.8 dB maximum for 600 mm; and Keycom, USA, 75 to 110 GHz with about 2.5 dB per meter at 110 GHz. Yonezawa, Japan, lists two frequency bands, 75 to 110 GHz and 80 to 105 GHz with an asterisk marker, with about 10 dB per meter at 100 GHz. AXON Cable and Univ of Lille, France, appears twice: reference 9 with 45 to 86 GHz and about 10 dB per meter at 86 GHz, and, This work, with 58 to 117 GHz and about 10.9 dB per meter at 100 GHz. Loss values are reported either per meter or as a maximum over a 600 mm length, and the frequency at which the loss is stated varies by row.
a Recommended region.
Wideband signal measurement with the FWG
As detailed in [Reference Renau, Gyawali, Cranny, Logette, Géas, Baudin, Charif, Burgnies, Szriftgiser and Ducournau9], the first FWG prototype is investigated as a wideband signal interconnect in the W-band using a 321 mm long waveguide sample. A fast photodiode, operating up to 100 GHz, was used to generate a modulated signal with an 80 GHz carrier frequency. This signal was produced using a photomixing process, as in [Reference Khelil, Renau, Szriftgiser, Roelens, Kassi, Zaknoune, Zegaoui, Oberhammer and Ducournau29], scaled down to the W-band. The signal employed 64-state quadrature amplitude modulation (QAM-64) with a baud rate of 8 GBd, resulting in an overall data rate of 48 Gbit/s. The spectrum is centered at 80 GHz, where the FWG operates in single-mode operation.
Figure 8 provides an overview of the wideband signal testbed. Initially, the system was configured in a back-to-back (B2B) setup (Fig. 8 inset), where the transmitter (Tx) was directly connected to the receiver (Rx). This configuration corresponds to the reference plane of the measured error vector magnitude (EVM) for B2B. The EVM was measured as a function of the power injected into the E-band receiver and served as a reference. The minimum EVM values were limited by the intrinsic phase noise of the system and the available signal-to-noise ratio. However, this does not affect the relative comparison between the B2B configuration and the FWG configuration.
Photograph of the data transmission testbed.

Figure 8 Long description
An experimental setup on an optical breadboard, illustrating a data transmission testbed. The main setup features a transmitter labeled Tx and a receiver labeled Rx, connected by a 321 millimeter FWG. The FWG is positioned centrally, linking the transmitter and receiver, demonstrating the signal path. An inset on the left highlights a back-to-back configuration labeled B2B, showing direct connection between Tx and Rx. This inset contrasts with the main setup, illustrating different transmission configurations. A grid pattern with blue dots is visible in the center, possibly representing a measurement or calibration area. The components are mounted on a perforated base, with visible cables and connectors linking the system parts. The setup is designed to compare transmission through the FWG versus direct B2B connection, focusing on the physical arrangement and signal flow.
After the B2B test, the FWG was inserted between the Tx and Rx circuits, with a curvature radius of Rc = 25 mm. The performance is shown in Fig. 9. We observe that the EVM after propagation through the bent FWG has a similar behavior compared to the B2B test. However, to reach the same EVM value, a power penalty is observed, as expected from the S 21 measurements, which show a power penalty of about 4.7 dB. It should be noted that so far, the FWG doesn’t have dedicated coupling transitions. Thus, the penalty/loss accounts for both the propagation loss of the FWG and the coupling/insertion losses at the input/output interfaces. This confirms the potential of the FWG as a wideband interconnect operating in W-band. Next steps would be the integration of the transitions to have a full FWG with WR-type flanges.
(a) EVM-power performance curves for B2B (A) and through the bent 321 mm flexible waveguide (B). (b) QAM-64 I/Q maps for both B2B and FWG measurements.

Figure 9 Long description
A showing a scatter plot with two data series and a legend. The y-axis label is, 8 gigabit per second QAM 64 EVM percent, with tick labels 2, 3, 4, 5, 6 and 7. The x-axis label is, Relative power decibel, with tick labels minus 20, minus 16, minus 12, minus 8, minus 4 and 0. The legend lists, Back to back Reference and, FWG, Bent 321 millimeter. A text annotation near the upper left reads, 4.7 decibel. A text line near the bottom reads, 80 gigahertz Carrier, 48 gigabit per second. The Back to back Reference series is plotted as black square markers, decreasing from about 6.6 percent at minus 20 decibel to about 3.4 percent at minus 10 decibel, then staying near about 3.4 percent from minus 10 decibel to about minus 6 decibel. The FWG, Bent 321 millimeter series is plotted as red square markers, decreasing from about 6.6 percent at about minus 16 decibel to about 4.0 percent at 0 decibel. B showing two square in phase quadrature constellation maps stacked vertically. The upper map has the text, B2B EVM 3.32 percent. The lower map has the text, FWG EVM 3.94 percent. Each map shows a grid of many small circular point clusters arranged in rows and columns within a square plotting area.
Conclusion
This work demonstrates a FWG with measured attenuation below 11.7 dB/m over the 75–110 GHz frequency range. The waveguide supports a bending radius of 2 cm while providing EM shielding and a protective FEP coating for mechanical durability and ease of handling. High-speed data transmission at 80 GHz further validates its potential for millimeter-wave communication systems. The fabrication approach is compatible with industrial-grade manufacturing processes, enabling mass production without compromising performance. However, a residual suck-out effect associated with the ribbon deposition process remains a practical limitation that needs to be addressed. Future work will focus on mitigating this effect and developing a seamless WR10 interface to enable reliable integration with millimeter-wave systems.
Acknowledgements
This research was conducted in part with support from the IEMN and the CPMP (CHOP) platform and forms part of the flagship UHD Telecom program. The authors also express their sincere thanks to the University of Lille and CNRS, France, for their invaluable technical support throughout this work.
Funding statement
We gratefully acknowledge BPI France for its financial support of the NOROGOW+ project. This work was also supported by the Contrat de Plan Etat-Region (CPER) WAVETECH. The CPER WAVETECH is supported by the Ministry of Higher Education and Research, the Hauts-de-France Regional council, the Lille European Metropolis (MEL), the Institute of Physics of the French National Centre for Scientific Research (CNRS) and the European Regional Development Fund (ERDF).
Competing interests
The authors declare none.

Prakash Gyawali received the M.Sc. degree in Light-Matter from the University of Lille, France, in 2020, and the Ph.D. degree in Fundamental Optics and Dilute Matter from the Laboratoire de Physique des Lasers, Atomes et Molécules (PhLAM), University of Lille, in 2023. During his doctoral studies, his research focused on the development of Terahertz (THz) sources and their applications in high-resolution spectroscopy. He is currently a Postdoctoral Researcher with the Institut d’Électronique de Microélectronique et de Nanotechnologie (IEMN) at the University of Lille. His current research interests include the EM simulation of high-frequency devices, prototype design, and the experimental characterization. He is actively engaged in designing and developing millimeter-wave flexible waveguides and optimizing connector interfaces to support next-generation 5G/6G telecommunication systems.

Alexandre Renau received the Diplome d’ingénieur degree in electrical engineering from Polytech Lille (Lille University Graduate School of Engineers), Villeneuve d’Ascq, France, in 2022. Since 2022, he has been working toward the Ph.D. degree, covering the topics of design and qualification of flexible waveguides operating in the submillimeter frequency bands, up to 220 GHz. His current research interests include waveguides and their transitions for applications up to 220 GHz. He is a member of the Institute of Electronics, Microelectronics and Nanotechnology (IEMN). He participated in the H2020 EU-Japan ThoR Project, dedicated to the development of km-range super-heterodyne THz transmission systems, especially on the system-level testing of FDD and TDD performance of the final assembly prior to the demos.
Ronan Cranny received a Ph.D. degree in Mathematical analysis of numerical schemes for CEM simulators from the Ecole doctorale mathématiques, informatique et télécomunications, Toulouse ISAE in 2021. He is currently an R&D engineer with Axon’ Cable (Axocom). His current research focuses on the prototype design, EM simulation, and experimental characterization of millimeter-wave flexible waveguides for next-generation telecommunication systems. He designs and validates high-frequency interconnect solutions (cables, connectors, and PCB transitions) for 5G/6G applications, while also ensuring the manufacturing of these products.
Julien Logette, photograph and biography not available at this moment.
Stephanie Geas, photograph and biography not available at this moment.
Antoine Baudin, photograph and biography not available at this moment.
Yanis Charif holds an MSc in Chemical Engineering from the University of Lyon and serves as an R&T Engineer at Axon’ Cable. His work focuses on overseeing production processes for high-frequency cables and flexible waveguides.
Ludovic Burgnies received the Ph.D. degree in electronics from the University of Lille 1, Villeneuve d’Ascq, Lille, France, in 1997. From 1994 to 1997, he focused on transport analysis in electronic quantum devices. Since 1999, he has been an Assistant Professor at the Université du Littoral Côte d’Opale, where his main research began with the design of agile microwave devices based on ferroelectric materials. Since 2010, his research on metamaterials has been carried out with the Institute of Electronics, Microelectronics and Nanotechnology, Villeneuve d’Ascq. His research interests are concerned with metamaterials and include projects targeting the integration of electromagnetic functions in woven or knitted fabrics by using textile metamaterials.

Pascal Szriftgiser received the Ph.D. degree in quantum physics from the Laboratoire Kastler Brossel, University Paris VI (now Sorbonne University), Paris, France, in 1996. In the same year, he joined the Centre National de la Recherche Scientifique (CNRS) as a researcher at the Laboratory PhLAM (Physique des Lasers, Atomes et Molécules). Since 2012, he has been a CNRS Research Director. From 2014 to 2021, he led the Cold Atoms Group and served as Deputy Director of the Laboratory PhLAM from 2019 to 2021. Since 2021, he is the Principal Investigator of the Contrat de Projet État-Région (CPER) WaveTech@HdF, a consortium that brings together six research laboratories in the Hauts-de-France region. He has authored or coauthored more than 150 publications in peer-reviewed international journals and conference proceedings. His research interests include cold atom physics, quantum chaos, topology, nonlinear optics in optical fibers, and high-speed coherent optical communications for terahertz applications.

Guillaume Ducournau is with the Institute of Electronics, Microelectronics and Nanotechnology (IEMN), UMR-CNRS 8520, University of Lille, Villeneuve d’Ascq, France, since 2007. He is the Leader of the THz wireless communications activity with IEMN using optoelectronic THz photomixers, electronic receivers, THz instrumentation, and millimeter-wave (mm-wave) characterization. He worked on several European projects: STREP ROOTHz 2010-2013, THOR H2020, and now on GRAPH-X, as well as in TIMES (6G SNS) and the Marie-Curie TERAOPTICS network. At the national level, he was the Coordinator of the COM’TONIQ Project from 2014 to 2017, funded by ANR (INFRA 2013) dedicated to THz communications in the 300-GHz band, the ANR/DFG TERASONIC Project for the use of THz photonics technologies and electrical solid-state technologies for THz communications; and SPATIOTERA for spatially-distributed photomixers. He received the 2020 ISAP BEST PAPER award. He is involved in national France 2030 programs gathering several French laboratories under the “PEPR” programs supported by the ANR (Agence Nationale de la Recherche). In this framework, the FUNTERA project (6 partners) is investigating THz converters, while the SYSTERA project (12 partners) is dedicated to beyond 90 GHz building blocks and sub-systems for xG/future networks. He also participates to the ST-IEMN common laboratory, and more specifically involved in the mm-wave technologies characterization part. He has authored or co-authored more than 250 publications in peer-reviewed international journals or peer-reviewed conferences proceedings and holds 1 patent.