I. INTRODUCTION
Nowadays a trend in radio transceiver development is toward multi-standard designs where more and more of the functionalities are implemented with digital signal processing (DSP). Therefore, the number of separate transmitter and receiver chains can be reduced and manufacturing costs are decreased [Reference Mak, U and Martins1]. From the receiver point of view, this means using a simple architecture, e.g., low-IF or direct conversion receiver where a single mixing stage is employed. Only coarse filtering is performed in analog domain, so the received signal has high bandwidth throughout the receiver analog signal processing chain and thus requires special considerations, e.g., about linearity issues, when designing components for the receiver [Reference Mak, U and Martins1–Reference Yang, Brodersen and Tse3]. This is particularly true if the incoming signal has high dynamic range, e.g., due to several independent radio signals on different frequency bands.
These aspects are ultimately culminated under the so-called cognitive radio concepts, in which the given radio hardware is to be utilized and reconfigured to access any available radio system and also to carry out the communication at any available sub-parts or chunks of the overall radio spectrum, the overall processed bandwidths being in the several hundreds of MHz range [Reference Yang, Brodersen and Tse3–Reference Vun and Premkumar5]. In such scenarios, the performance requirements for the sampling and A/D conversion stage become extremely stringent.
Aforementioned receiver considerations imply that the A/D converter is likely to become the limiting component for the performance of the receiver due to strict requirements regarding to dynamic range, resolution, and sampling speed [Reference Araujo and Dinis2–Reference Vun and Premkumar5]. The inherent trade-off between the last two has been discussed in detail in the existing literature [Reference Maloberti6–Reference Le, Rondeau, Reed and Bostian9]. In the mobile terminal side, also power dissipation constraints limit the possible analog-to-digital (A/D) converter choices. Other important issues in radio receiver context are signal distortion caused by sampling jitter and A/D converter nonlinearities [Reference Araujo and Dinis2–Reference Le, Rondeau, Reed and Bostian9].
This article focuses on the A/D converter nonlinearity aspects from the modeling and DSP-based mitigation points of view. This issue has increasing interest due to the emerging wireless systems, such as IMT-Advanced [10], in which the spectrum allocation of individual terminals can be strongly scattered over a wide range of frequencies. Hence, the dynamic range of the signal to be digitized can be in the order of tens of dBs (even 50–60 dB). In such scenarios, any nonlinearities in the A/D converter can cause severe intermodulation distortion (IMD). This is because the incoming signal contains strong signal bands which can, without doubt, block weaker desired signal bands if the IMD is falling on top of the weak bands [Reference Araujo and Dinis2–Reference Vun and Premkumar5]. In practice, considerable sources of nonlinearities in A/D converters are, e.g., differential and integral nonlinearity (DNL and INL) [Reference Maloberti6] as well as clipping. The DNL and INL are originating from unintentional deviations of the quantization levels, whereas clipping is stemming from improper input signal conditioning, i.e., exceeding the full scale (FS) voltage range of the A/D converter. The clipping phenomenon is deeply analyzed in this article by proposing a mathematical model based on Fourier-type analysis with time-variant coefficients.
Mitigation of A/D converter nonidealities has gained growing interest in recent years and, in general, it has been covered rather extensively in the literature, e.g., [Reference Rusu, Rodriguez de Llera Gonzalez and Ismail4, Reference Maloberti6, Reference Arpaia, Daponte and Rapuano11, Reference Björsell and Händel12] and the references therein. Typically, the proposed mitigation solutions are based on digital post-processing exploiting look-up tables or black-box modeling with identification stage(s). These kinds of approaches usually require accurate off-line calibration and are therefore mainly suitable for very stable operation environment, such as measurement and instrumentation applications. The situation is quite different in wireless radio systems, especially in mobile terminals, where operating conditions of the electronic components can vary considerably. In addition, the received waveform characteristics are likely to be heavily time varying, e.g., due to channel conditions, mobile terminal movement, and user allocations. Therefore, off-line calibration based or static compensation approaches are not directly applicable. This article discusses proper techniques for modeling A/D converter nonlinearities and then presents an on-line digital post-processing method based on adaptive filtering for reducing nonlinear distortion in wideband A/D converters. Adaptive interference cancelation (AIC) method is shown to noticeably reduce the effects of INL and clipping at weak signal bands in the presence of strong blocking signals. AIC is very dynamic approach being able to adapt its characteristics on a received packet-by-packet basis and thus it can concentrate its whole potential for removing the distortion from the most sensitive signal bands. In the emerging cognitive radio-type applications [Reference Yang, Brodersen and Tse3], this kind of ability to adapt is especially critical. Notice also that similar interference cancelation techniques have been proposed and demonstrated for reducing nonlinear distortion of mixers and low noise amplifiers in wideband receiver context in [Reference Valkama, Shahed, Anttila and Renfors13] and [Reference Keehr and Hajimiri14]. Furthermore, to the best of our knowledge, the only prior-art contribution in the field of clipping mitigation in radio receivers is the one by Tomioka et al. [Reference Tomioka, Sakata, Horiguchi, Tomizawa and Inoue15]. This will be used as a reference technique in the performance evaluations.
The rest of the article is organized as follows. Section II describes typical nonlinearities that are limiting the performance of wideband A/D converters. After that, a Fourier-analysis-based model for zero-symmetric clipping is proposed in Section III. The model gives a basic description of the clipping behavior and it is then used as grounds for the AIC method proposed in Section IV. Then in Section V, concrete performance examples are given for the proposed post-processing method. Finally, Section VI concludes the article.
II. TYPICAL NONLINEARITIES IN A/D CONVERTERS
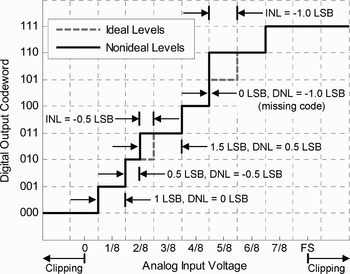
In ideal quantization, the overall FS input voltage range of the converter is uniformly divided into quantization levels according to the number of bits B. This is illustrated in Fig. 1 for an unipolar quantizer. In addition to ordinary uniform quantization noise, one reason for nonlinear distortion is unintentional deviations of the quantization levels from the ideal ones [Reference Maloberti6, Reference Arpaia, Daponte and Rapuano11, 16]. This phenomenon can be described by means of DNL and INL. DNL refers to the relative difference between the actual code width Q(k) and the ideal code width Q ideal. INL, for one, defines the difference between the actual and ideal code transition threshold, i.e., T(k) and T ideal(k), respectively. Mathematically, these are given by [Reference Maloberti6, 16]
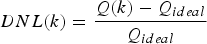
and

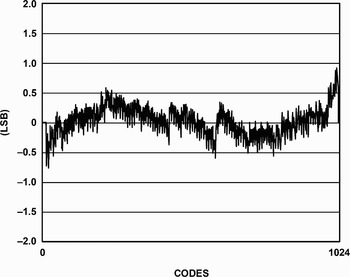
where k denotes the output code index having values between 0 and 2B−1. Another interpretation for INL is thinking it as integral of the DNL. Although DNL behavior from output code to another is typically fairly random, the INL behavior can have more deterministic shape [Reference Maloberti6, Reference Arpaia, Daponte and Rapuano11]. A real-life example of typical INL error as a function of converter output code is shown in Fig. 2. As proposed in [Reference Björsell and Händel12], INL can be further divided to three separate parts for modeling purposes so that

where INL HCF(T(k)), INL LCF(T(k)), and INL Noise(T(k)) refer to a high code frequency (HCF), a low code frequency, and a noise component, respectively. The LCF part describes slow fluctuation which is evident, e.g., in Fig. 2. Additionally, the HCF component depicts rapid architecture-dependent variations, usually modeled as piecewise linear, on top of the LCF. Finally, the noise is part of the INL which is not described by LCF or HCF.
Principal illustration of quantization levels for ideal and nonideal unipolar quantizer with B = 3 bits. Both differential and integral nonlinearities (DNL, INL) as well as clipping are shown.

Measured typical INL error curve of 10-bit A/D converter AD9218 [18] as a function of output code k.

Another potential source of severe nonlinear distortion is clipping due to the improper input conditioning of the incoming signal. It is probable that automatic gain control of the receiver cannot react fast enough all the time if the incoming signal has large peak-to-average power ratio (PAPR). In an A/D converter any input dynamics exceeding the FS voltage range will essentially be limited by the quantizer, i.e.,

where x IN denotes the converter input voltage and an FS voltage range of 0…x FS is assumed. The clipping behavior of quantizer is also illustrated through a transfer function in Fig. 1.
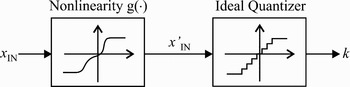
Both DNL and INL as well as clipping will cause IMD in radio receivers, which can be especially harmful in wideband cases [Reference Araujo and Dinis2, Reference Maloberti6, Reference Wepman7, Reference Dardari17]. Significant part of the spurious components due to IMD are originating from the LCF component of INL and especially from clipping (if taking place). For interference cancelation purposes, described in Section IV, both of these can be modeled with polynomial equation

followed by an ideal quantizer (in cascade) as illustrated in Fig. 3. It is shown also in [Reference Björsell and Händel12] that LCF component of INL can be represented with a polynomial as in (5). Additionally, it is shown in the literature that the polynomial model is applicable for many nonlinearity-related issues [Reference Maloberti6, Reference Arpaia, Daponte and Rapuano11, Reference Dardari17, Reference Michaeli, Michalko and Saliga19]. For the clipping modeling it is proposed in [Reference Cruz, Carvalho and Remley20]. When considering INL, the low order, such as second, third, and fourth, distortion components are usually the most dominant ones, but the exact impact of the orders varies between A/D converter structures [Reference Maloberti6, Reference Björsell and Händel12]. In case of symmetric clipping, only odd order distortion is generated. This is mathematically shown in the next section.
A cascade structure consisting of a memoryless polynomial and an ideal quantizer for modeling A/D nonlinearities such as INL and clipping.

III. MATHEMATICAL MODEL FOR CLIPPING
In this section, a mathematical model for zero-symmetricFootnote 1 hard clipping is derived through Fourier analysis. It allows, e.g., analyzing the impact of different distortion orders separately from the amplitude and phase point of view. Altogether the target of the analysis is to understand and model the impact of A/D converter clipping in cases where the overall waveform dynamics of the incoming signal is dominated by a strong noninteresting blocking carrier or carriers. More specifically, a model that reveals the induced IMD at weak signal bands is derived, which to the best of our knowledge cannot be found from the existing literature of the field. Then the derived intermodulation model is also used in Section IV to develop digital post-processing-based interference cancelation techniques for reducing the signal distortion induced by clipping at weak signal bands.
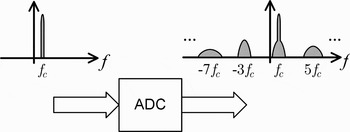
For simplicity of presentation, it is assumed that only a single analytic bandpass signal, being located at intermediate-frequency (IF) f c after initial downconversion, is entering the converter. This is illustrated in Fig. 4. The time-domain waveform is first written in the general I/Q bandpass signal notation as

where A(t) is the envelope of the signal and θc(t) consists of angular frequency ωc and phase ϕ(t) so that θc(t) = ωct + ϕ(t). Due to the instantaneous nature of clipping, its effects have to be considered sample-by-sample basis. At time instances when the signal envelope A(t) does not exceed clipping level V 0, the output signal v OUT(t) equals to v IN(t). Otherwise v IN(t) gets clipped. Hence, the output signal is defined first as

where v CL(t) describes the clipped parts of the signal. Now, let us first consider only the I branch of v CL(t), denoted with v CL,I(t), to simplify the notation. According to the definition of symmetric hard clipping, v CL,I(t) can be written as

at time instances when |A(t)| ≥ V 0.
Principal illustration of the clipping distortion due to improper input signal conditioning in the analog-to-digital converter (ADC). An analytic bandpass signal at center frequency of f c causes odd order nonlinear distortion due to zero-symmetric clipping.

Fourier series can be deployed to model the behavior of v CL,I(t). The whole model is heavily time dependent due to variations in the signal envelope A(t). Therefore, Fourier coefficients a n,I(t) have to be also time varying as a function of A(t). From the definition of Fourier series it can be derived that

where

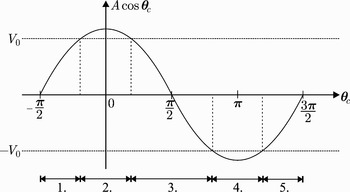
For a single time instant the function θc(t) has one specific value. All the possible values of θc(t) are within the period of 2π as formulated in (10). Note that it is not required that θc(t) nor v IN(t) is periodic in time. The periodicity exploited in (10) is stemming from the fact that v CL,I(t) can be seen as a periodic function of θc when time is held fixed. This is illustrated in Fig. 5 with an example choice of integration intervals that can be used in further derivation of the Fourier coefficients. By taking advantage of the condition Acos(θc) = V 0 and the definition in (8), the equation of Fourier coefficients can be written as
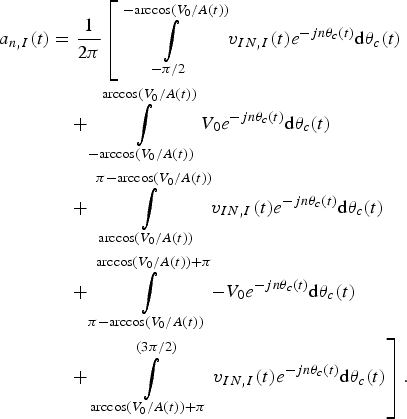
After rather straightforward derivations, the final form of equation for the Fourier coefficients is defined in three parts where auxiliary variable r I(t) = arccos (v 0/A(t)) is used. The Fourier coefficients are given by

for n = ±1,
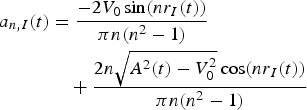
for n = ±3, ±5, ±7,… and

for n = 0, ±2, ±4, … .
A real bandpass signal v CL,I(t) drawn as a function of θc consisting of angular frequency and phase when time t is held fixed so that the signal envelope A(t) can be considered to be constant. In addition, one possible choice of integration intervals 1–5 for deriving the Fourier coefficients is illustrated based on clipping level V 0.

It is justified to assume same clipping level V 0 also for the Q branch, because voltage ranges of two A/D converters can be matched relatively well in practice. This is especially true when dual A/D converter architecture is used. Based on this assumption and exploiting the symmetry of Fourier series for I/Q signal, the model for complex v CL(t) can be written as
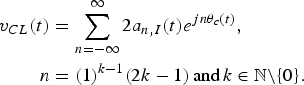
This final form of the model shows that symmetric hard clipping creates only odd order distortion and for an I/Q signal every second odd distortion order is negative.
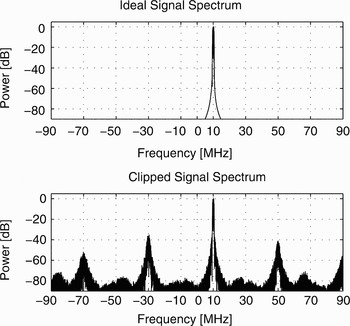
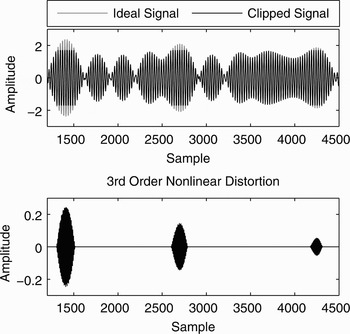
As an illustrative example, Fig. 6 shows spectra of an arbitrary complex bandpass signal at center frequency of 10 MHz before and after zero-symmetric clipping. The distortion of odd orders is clearly identifiable at frequencies around −30, 50, −70 MHz etc. A short block of time domain behavior of the signal (I branch) is illustrated in Fig. 7. Furthermore, the third order distortion (n = −3) of the clipped signal is plotted according to (15) which corresponds to the distortion around −30 MHz in Fig. 6. It is clearly visible that nonlinear distortion appears only at time instances when the envelope of the original waveform is clipped. It can be also seen that the third-order distortion waveform has (three times) higher center frequency than the original signal.
Upper spectrum illustrates an arbitrary communications signal at the center frequency of 10 MHz. After zero-symmetric clipping of the signal (lower spectrum) the distortion of odd orders is clearly visible.

Upper part: a block of time domain waveform of the communications signal (shown in Fig. 6) before and after zero-symmetric clipping. Lower part: third-order distortion due to the clipping.

In general, the model in (15) gives an analytical closed-form description for the intermodulation components caused by clipping around different integer multiples of the center frequency of the incoming blocking carrier. In the next section, this modeling is used as the basis to develop DSP techniques to reduce this intermodulation energy from the weak signal bands. For computation simplicity, the mapping between the complex envelopes of the original blocking signal band (after clipping, n = 1) and the different IMD products (n = −3, 5, −7, 9, …) is approximated using polynomials. This will be described in more details below.
IV. ADAPTIVE INTERFERENCE CANCELATION
This section describes a digital post-processing method based on AIC for reducing IMD caused by A/D converter nonlinearities. The main principle of AIC is stemming from the earlier studies related to receiver mixer and low noise amplifier nonlinearities in [Reference Valkama, Shahed, Anttila and Renfors13, Reference Keehr and Hajimiri14] and more A/D converter related considerations described initially in [Reference Allén, Marttila and Valkama21].
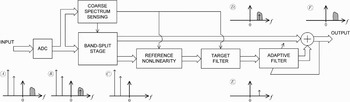
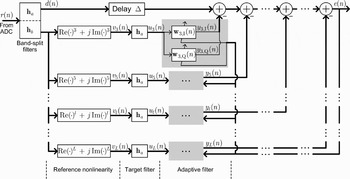
A conceptual block diagram is presented in Fig. 8 including simplified spectrum figures. Due to nonlinearities in A/D converter the digitized signal contains IMD which is illustrated in spectrum B of Fig. 8 with two blocker signals and a weak signal band (see spectrum A). First step is to apply band-split filtering to a block of samples in order to separate the weakest, i.e., the most sensitive signal band(s) from the rest of the sampled spectrum which includes strong blocking signals. The separation is illustrated with spectrums C and D in Fig. 8. Target is to regenerate the IMD components at the weak signal band by using the separated signal containing the strong blocking signals. This is done with polynomial signal processing which models the nonlinearity according to (5). Then target filter is used to pass only the distortion at the weak signal band. The outcome is illustrated in spectrum E of Fig. 8. The characteristics of the nonlinearity modeling block depend directly on the order of the IMD components being canceled and thus varies between different situations and applications.
AIC method for reducing A/D converter nonlinear distortion at a weak signal band originating from considerably stronger blocking signals. The lower branch regenerates the distortion caused by the strong signals and subtracts it from the weak signal band. In the simplified spectrum figures above, only a single intermodulation component is drawn on top of the weak signal for illustration purposes.

The last step of AIC is to use an adaptive filter for the regenerated distortion signal before subtracting it from the weak signal band of the original band-split filtered signal. The adaptive filter coefficient(s) are defined in such a manner that the interference power at the weak signal band is minimized. The ideal situation is visualized in spectrum F of Fig. 8. The filter coefficient adaptation can be implemented using, e.g., the well-known least-mean-square (LMS) algorithm which is simple enough to be used in actual real-time systems [Reference Haykin22]. From the practical point of view, each order of IMD has its own adaptive filter coefficient(s) and the overall processing can be carried out either in parallel or serial manner. This choice obviously has effect on processing speed and the amount of required computational resources. In addition, an outer-loop control mechanism can be used to manage the overall system on a received packet-by-packet basis. It controls the overall coefficient adaptation, degrees of IMD to be canceled, and the design of the band-split filtering stage. This can be achieved using, e.g., FFT in order to make coarse measurements of the spectrum density of the received packet after A/D conversion. Then according to these measurements, the band-split filter properties are tuned to isolate the most sensitive signal bands. Furthermore, the basis for choosing the IMD orders being canceled is obtained by sensing the locations of the strongest signal energy levels with respect to the weak bands.
The exact implementation of the proposed AIC method for clipping mitigation is illustrated in Fig. 9 starting from the digitized signal denoted with r(n). The index n refers to samples inside one packet. In general, the mathematical notation is so that the real and the imaginary parts of the vector x are marked with xI and xQ, respectively. The lengths of filters ha, hb, and wl are M a, M b, and M w, respectively. In the band-split filtering stage the weak signal band is separated using pre-designed filter ha, which is tuned according to parameters given by the coarse spectrum sensing block. Therefore, the signal containing the weak signal band is defined as

where ra(n) = [r(n), r(n − 1), … , r(n − M a)]T. The filter hb is used to form a signal containing all the spectral content outside the weak signal band and it is then used to generate L different reference signals for removing distortion of different orders. For example, the lth order distortion is described with

where rb(n) = [r(n), r(n − 1), … , r(n − M b)]T. Because only the distortion at the weak signal band is of interest, the signal is filtered with the target filter ha and the outcome is

where the lth-order distortion signal vector is vl(n) = [v l(n), v l(n − 1), … , v l(n − M a)]T. After that, adaptive filters wl,I and wl,Q are applied separately for the real and the imaginary parts of the distortion signal u l(n). The overall output of the adaptive filter stage is defined as

where ul,I(n) = [u l,I(n), u l,I(n − 1), … , u l,I(n − M w)]T and ul,Q(n) = [u l,Q(n), u l,Q(n − 1), … , u l,Q(n − M w)]T.
Mathematical notation for the proposed AIC method in case of clipping compensation. The input r(n) is a digitized signal from the A/D converter and the enhanced output signal is denoted with e(n).

When using LMS for finding the filter coefficients for the adaptive filters, the algorithm goes as follows. Here, only the I branch of the lth-order distortion filter adaptation is described. Algorithm for the Q branch and all the other distortion orders are implemented in a similar manner. In the beginning, all the coefficients are set to zero, i.e.,

All reference branches are using the overall output e(n) for the adaptation. For the I branch it is defined as

where Δ is a delay required for the reference signal processing. The actual coefficient update for the I branch of the lth-order distortion filter is then

where μl is the LMS step-size parameter for the lth-order distortion branch.
V. PERFORMANCE EXAMPLES OF THE DIGITAL POST-PROCESSING METHOD
This section is devoted to demonstrate the applicability of the AIC concept for removing A/D converter nonlinearities. Both INL and clipping effects are considered in separate examples. The performance studies are based on commercially available A/D converters.
A) INL reduction experiment
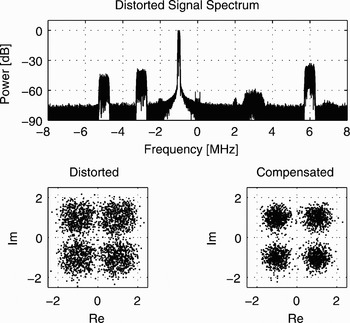
In this performance example, a commercial 10-bit A/D converter [18] is deployed whose INL behavior is shown in Fig. 2. The experiment is conducted as a computer simulation where the chosen A/D converter is simulated using a behavioral model [23] provided by the component vendor. The test signal used in this example consists of five separate frequency channels with different channel bandwidths and power levels as illustrated in Fig. 10. The overall dynamic range of the test signal is approximately 60 dB and PAPR is 5 dB. Sampling frequency of 32 MHz is used in the A/D conversion for both I and Q branch. The target signal in the detection, and therefore in the interference cancelation, is the weak signal at 3 MHz (downconverted) center frequency which is a QPSK modulated waveform with roughly 1 MHz bandwidth. The other signals shown in the spectrum simply act as sources of interference.
INL reduction experiment. Upper part: spectrum of the test signal with five frequency channels after the 10-bit A/D converter. Lower part: demodulated signal constelations of the weak QPSK signal at 3 MHz without and with AIC.

Due to the INL in the A/D converter, third-order IMD of the strongest signal located at center frequency of −1 MHz is falling on top of the weak signal with center frequency of 3 MHz. In the lower part of Fig. 10 signal constellations of the demodulated weak QPSK signal is shown without and with AIC processing. In the implementation of the AIC, only third order is used to model the nonlinearity independently for I and Q branches. Additionally, in the adaptive filter stage, single-tap filters are used to scale the regenerated IMD before being subtracted from the weak frequency channel. The filter coefficient adaptation is implemented using the LMS algorithm with an adaptation block length of 5000 samples.
It is evident from the provided constellations in Fig. 10 that the AIC method is able to reduce the IMD considerably. In this example, the signal-to-noise-and-distortion ratio (SNDR) in the weak signal band is enhanced from 6.4 to 10 dB by using the AIC. The SNDR is here calculated as a ratio of the useful signal power to the combined power of noise and distortion components at the band of interest. However, the performance is limited due to quantization noise and also since AIC is only able to remove the LCF part of INL. Different kind of approach would be required in order to remove the HCF part of INL [Reference Björsell and Händel12].
B) Clipping mitigation experiment
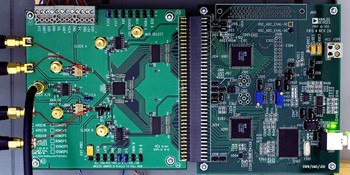
This experiment demonstrates signal clipping caused by improper A/D converter input conditioning. Real laboratory measurements are used in order to verify the clipping behavior in practice. A commercial 14-bit A/D converter [24] with evaluation board (illustrated in Fig. 11) is used among necessary laboratory equipment. Spectrum of the test signal for this experiment is shown in upper part of Fig. 12 and it consists of, as in the previous case, five frequency channels with different bandwidths and power levels, the overall dynamic range being 50 dB. PAPR for the test signal is 7 dB and used sampling frequency is 64 MHz for I and Q branches. State-of-the-art laboratory signal generators are used for generating composite measurement waveform. Power of the waveform in the A/D converter input is adjusted so that the signal is clipped 5 dB above the average power level of the test signal. After A/D conversion, blocks of the digitized I and Q signals are transferred from the memory of evaluation board to PC for post-processing purposes. Again the target signal in the detection is the weak QPSK waveform at 3 MHz IF-frequency.
A commercial 14-bit A/D converter [24] with its evaluation board employed in the clipping mitigation experiment.

Clipping experiment using laboratory measurements. Upper part: spectrum of the test signal prior to A/D conversion. Lower part: the signal spectrum after 14-bit A/D converter when clipping level is 5 dB above the average power level.

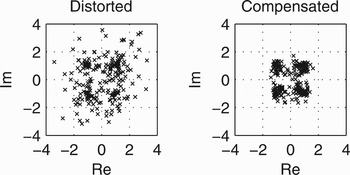
In this example, especially third-order IMD of the strong signal located at −1 MHz is falling on top of the weak signal located at 3 MHz due to clipping of the waveform. This is shown in the lower spectrum plot in Fig. 12. AIC is applied to remove the IMD, and the constellations of the detected weak signal are presented in Fig. 13 without compensation (left side) and with compensation (right side). To take into account the nature of clipping, third-, fifth-, and seventh-order operators are used in AIC method for regenerating the distortion. Then single-tap adaptive filters are used for proper weighting and, again, the LMS algorithm is deployed for the filter coefficient adaptation. After adaptive filtering the regenerated IMD is subtracted from the weak signal band.
Corresponding demodulated signal constllations of the weak QPSK signal at center frequency of 3 MHz without and with AIC in the clipping experiment.

It is clearly visible also in this experiment that AIC can significantly reduce IMD on the weak signal band. SNDR of the weak signal band is improved from 0.3 to 8.8 dB when AIC is used in this example. One limitation for the post-processing performance is the quality of the distortion regeneration. That is because the strong signals are also distorted to some extent due to clipping and thus they are not the same as the originals where the IMD to the weak signal band is originating from.
C) Further performance considerations
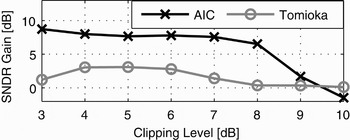
The amount of nonlinear distortion in the clipping case depends on how much the signal is clipped, i.e., strong clipping reduces the inband SNDR significantly. However, the proposed AIC method is able to provide considerable gain by removing distortion. Fig. 14 illustrates that gain as a function of clipping level in the example case described in the previous subsection. Here the clipping level is defined as a number of dBs above the average power level of the test signal. The results in Fig. 14 are averaged over 20 random realizations of the test signal to obtain reliable performance statistics. The performance of the AIC is rather steady in case of strong or medium clipping, but the gain decreases when there is only very mild clipping. This is stemming from the fact that there is not so much distortion to remove in the first place. The 10-dB clipping level in Fig. 14 represents a situation where clipping happens very rarely. Then it is better to bypass the whole AIC stage to decrease the power consumption of the receiver. For concrete comparison to other techniques, Fig. 14 also shows the performance of a state-of-the-art clipping mitigation technique based on interpolation by Tomioka et al. [Reference Tomioka, Sakata, Horiguchi, Tomizawa and Inoue15]. When using real laboratory equipment instead of computer simulations, as is the case here, the proposed AIC method is clearly performing better.
SNDR gain provided by the proposed AIC method in the clipping mitigation experiment. Clipping level is defined as a number of dBs above the average power level of the test signal. Performance of a state-of-the-art technique based on interpolation by Tomioka et al. [15] has been used as a reference.

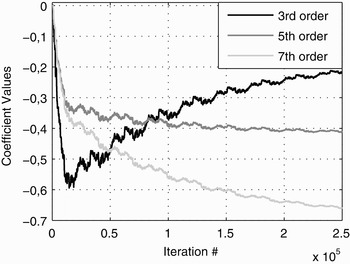
In highly time-varying conditions, such as cognitive radio receivers, one of the key issues is the adaptation speed of the post-processing. Fig. 15 illustrates how the adaptive filter coefficients behave when LMS algorithm is used in the clipping mitigation experiment described in the previous subsection. Because the overall output e(n) is used for the adaptation, an overall balance among the different order filter coefficients can be found. The sudden change in the adaptation direction of the third-order filter coefficient in Fig. 15 is stemming from the dependence between different distortion orders. In other words, the fifth- and seventh-order reference signals contain partially same frequencies as the third-order reference signal. It should be noted that Fig. 15 is not trying to illustrate the optimal performance of the AIC method, but acts more as a proof of concept. It is a well known fact that, e.g., recursive-least-squares (RLS) algorithm can provide significantly better adaptation speed [Reference Haykin22, Reference Sayed25]. All adaptive filtering algorithms provide a certain trade-off between adaptation speed and accuracy. For example, normalized LMS [Reference Haykin22], Gauss–Newton RLS [Reference Sayed25], and fast approximate RLS [Reference Chansarkar and Desai26] are proposed in the literature.
LMS adaptation of the adaptive filter coefficients for I branch in the clipping mitigation experiment.

VI. CONCLUSION
This article focused on the A/D converter nonlinearities from the wideband radio receiver point of view where the signal to be digitized may have very large dynamics. Mathematical model for zero-symmetric clipping due to improper input signal conditioning was proposed based on Fourier series with time-variant coefficients. Furthermore, DSP-based AIC method was presented for reducing nonlinear distortion, originating from strong blocker signals, at weak signal bands. It was demonstrated through both computer simulations and laboratory measurements using commercially available A/D converters that the presented method is able to significantly reduce IMD stemming from input signal clipping and A/D converter INL.
ACKNOWLEDGEMENTS
This work was supported by the Academy of Finland, the Finnish Funding Agency for Technology and Innovation (Tekes), and the Technology Industries of Finland Centennial Foundation.
 Markus Allén was born in Ypäjä, Finland, on October 28, 1985. He received the B.Sc. degree in communications electronics from Tampere University of Technology (TUT), Finland, in 2008 and is now heading towards the M.Sc. degree in signal processing and communications engineering at TUT. He is currently working at Department of Communications Engineering at TUT as a Research Assistant. His general research interests include analog-to-digital converters (ADC) in software defined radios, non-idealities of ADCs, and their mitigation algorithms.
 Jaakko Marttila was born in Tampere, Finland, on March 30, 1982. He is heading toward M.Sc. degree in signal processing and communications engineering, in Tampere University of Technology (TUT), Tampere, Finland. He is currently working at TUT, Department of Communications Engineering as a Research Assistant. At present, his main research topic is quadrature sigma-delta analog-to-digital (AD) converters. Generally, his research interests include AD techniques, such as sigma-delta variants and related interference mitigation algorithms.
 Mikko Valkama was born in Pirkkala, Finland, on November 27, 1975. He received the M.Sc. and Ph.D. degrees (both with honors) in electrical engineering (EE) from Tampere University of Technology (TUT), Finland, in 2000 and 2001, respectively. In 2002 he received the Best Ph.D. Thesis – award by the Finnish Academy of Science and Letters for his dissertation entitled “Advanced I/Q signal processing for wideband receivers: models and algorithms.” In 2003, he was working as a visiting researcher with the Communications Systems and Signal Processing Institute at SDSU, San Diego, CA. Currently, he is a Full Professor at the Department of Communications Engineering at TUT, Finland. He has been involved in organizing conferences, like the IEEE SPAWC'07 (Publications Chair) held in Helsinki, Finland. His general research interests include communications signal processing, estimation and detection techniques, signal processing algorithms for software defined flexible radios, digital transmission techniques such as different variants of multicarrier modulation methods and OFDM, and radio resource management for ad hoc and mobile networks.