

1. Introduction
Political knowledge plays a vital role in democratic politics, shaping citizens’ ability to participate in elections, choose preferred policies or parties, and evaluate government performance. Voters with greater political knowledge are more likely to participate and to make judgements that advance their own interests (Verba et al., Reference Verba, Schlozman and Brady1995; Delli Carpini and Keeter, Reference Delli Carpini and Keeter1996; Althaus, Reference Althaus2003; Bartels, Reference Bartels2008).
The acquisition and accumulation of political knowledge are shaped by individuals’ abilities, opportunities, and motivations (Delli Carpini and Keeter, Reference Delli Carpini and Keeter1996), all of which are closely tied to socioeconomic characteristics. Among these characteristics, gender plays a particularly important role.
A large body of research documents a persistent gender gap in political knowledge, with women showing less familiarity with political institutions, actors, and current affairs (Fortin-Rittberger, Reference Fortin-Rittberger2016; Fraile and Gomez, Reference Fraile and Gomez2017; Dassonneville and McAllister, Reference Dassonneville and McAllister2018). Drawing primarily on evidence from the United States and European democracies, Dow (Reference Dow2009: 117) observes that ‘one of the most robust findings in the study of political behavior is that men score higher than women on measures of political knowledge’.
Despite this extensive literature, much of our empirical understanding of gender gaps in political knowledge is derived from Western democracies, where both political institutions and gender regimes differ substantially from those in Asia. Comparative research shows that gender gaps in political engagement are highly context-dependent and do not travel straightforwardly across regions (Kittilson and Schwindt-Bayer, Reference Kittilson and Schwindt-Bayer2012; Dassonneville and Kostelka, Reference Dassonneville and Kostelka2021). This raises the possibility that gender gaps in political knowledge may be context-dependent rather than universal (Fortin-Rittberger, Reference Fortin-Rittberger2016). Indeed, previous research shows that female representation operates as an important contextual determinant of gender gaps in political knowledge (Dassonneville and McAllister, Reference Dassonneville and McAllister2018; Pereira, Reference Pereira2019; Venturini, Reference Venturini2025).
In the Japanese context, two considerations lead us to expect a comparatively large gender gap in political knowledge. Japan continues to exhibit among the lowest levels of female political representation and some of the most persistent gendered social norms among advanced democracies. First, women remain underrepresented in the national legislature and in party leadership positions. Descriptive underrepresentation of this kind has been theorized to weaken the cues that signal politics as an inclusive domain, thereby depressing women’s political interest, engagement, and willingness to express knowledge (Verba et al., Reference Verba, Burns and Schlozman1997; Campbell and Wolbrecht, Reference Campbell and Wolbrecht2006; Fox and Lawless, Reference Fox and Lawless2014). Second, gendered labour-market structures and family norms continue to assign primary caregiving responsibilities to women and to frame politics as a male-typed sphere (Maeda, Reference Maeda2005; Kage et al., Reference Kage, Rosenbluth and Tanaka2019). Such norms produce gendered career trajectories and time constraints that reduce women’s exposure to politically relevant information and discussion (Burns et al., Reference Burns, Schlozman and Verba2001), and they dampen women’s political confidence (Fraile and Gomez, Reference Fraile and Gomez2017; Wolak, Reference Wolak2020). Taken together, from the perspective of ability, opportunity, and motivation, these conditions generate an expectation that the gender gap in political knowledge in Japan could be larger than that observed in many Western democracies.
Yet, it is not self-evident that structural disadvantage translates directly into exceptionally large knowledge gaps. Japan also features high levels of basic education, dense media coverage of politics, and a stable party system, all of which may mitigate gender disparities in access to political information. Moreover, if women are more engaged with policy domains closely tied to everyday life (Patterson and Nishikawa, Reference Patterson and Nishikawa2002; Steel, Reference Steel2004), conventional knowledge batteries centered on elite institutions and political actors may not fully capture the domains in which women are relatively knowledgeable.
Despite these theoretical expectations, systematic evidence on the gender gap in political knowledge in Japan remains limited. While some studies document gender differences in political knowledge in specific surveys (e.g., Collet and Kato, Reference Collet and Kato2014), existing research does not provide a comprehensive assessment of the magnitude, persistence, and comparative standing of the gap across time and survey modes. In addition, despite the findings that the gender gap in political knowledge narrows significantly when a don’t know (hereafter DK) option is removed or discouraged (Mondak and Anderson, Reference Mondak and Anderson2004; Lizotte and Sidman, Reference Lizotte and Sidman2009; Ferrin et al., Reference Ferrin, Fraile and García-Albacete2018; Miller, Reference Miller2019; Kraft and Dolan, Reference Kraft and Dolan2023) and when women-related items are included (Stolle and Gidengil, Reference Stolle and Gidengil2010; Barabas et al., Reference Barabas, Jerit, Pollock and Rainey2014; Kraft and Dolan, Reference Kraft and Dolan2023), no prior work has systematically examined how these measurement choices shape observed gender differences in the Japanese context. As a result, it remains unclear whether Japan represents an especially pronounced case, a typical case, or a measurement-sensitive case of gendered inequality in political knowledge.
This study addresses three related questions. First, how large is the gender gap in political knowledge in Japan? Second, is it indeed larger than that observed elsewhere? Third, to what extent does the observed magnitude of the gap depend on measurement choices, particularly the substantive content of knowledge items and the availability of a DK response option?
Our first analysis provides the most comprehensive descriptive evidence on the size of the gender gap in political knowledge between Japanese women and men, drawing on two large-scale online surveys fielded after the 2024 Lower House and 2025 Upper House elections, as well as 15 probability-sample surveys conducted between 2000 and 2018. Next, we locate the gender gap in Japan in a comparative perspective using data from the Comparative Study of Electoral Systems (CSES) Modules 2–4. Our final analysis examines how measurement affects the observed gender gap by assessing the roles of knowledge domain and the availability of a DK option through a survey experiment. Our findings demonstrate that while the gender gap in political knowledge in Japan is sizable, it is highly contingent on both what is measured and how it is measured.
This paper proceeds as follows. Section 2 reviews conventional definitions of political knowledge. Section 3 discusses major explanations for the emergence of the gender gap. Section 4 examines the magnitude of the gender gap in Japan using multiple datasets. Section 5 places the Japanese case in comparative perspective. Section 6 assesses the role of measurement in shaping the observed gender gap. Section 7 discusses whether the gender gap shrinks when measured differently. The final section concludes.
2. What is political knowledge?
In this study, we follow the traditional definition of political knowledge as ‘factual information about politics stored in long-term memory’ (Delli Carpini and Keeter Reference Delli Carpini and Keeter1996, 10). This definition excludes information that is not recognized, as well as information that enters short-term memory but is quickly discarded, from the domain of political knowledge. By focusing on long-term memory, the definition centres on the knowledge that individuals use to interpret politics.
A further defining feature of political knowledge is that it consists of factual information. For example, if individuals are asked, ‘What is poverty?’, it is impossible for them to provide an objectively factual answer. By contrast, the government’s definition of the poverty line and the share of the population living below that line can be answered on the basis of objective facts. Thus, political knowledge is understood as information grounded in verifiable empirical facts.
Following this definition, political knowledge has typically been measured using quiz-type items that assess factual information. Delli Carpini and Keeter (Reference Delli Carpini and Keeter1996: 65) argue that, in order for democracy to function, citizens should understand ‘the rules of the game’, ‘the substance of politics’, and ‘people and parties’. To measure knowledge in these three domains, they recommend using items such as: (1) the majority party in the House of Representatives, (2) the proportion of votes required to override a presidential veto, (3) the relative ideological positions of political parties, (4) the institution that determines the constitutionality of laws, and (5) the identification of the vice president. As these items were designed to measure the knowledge of American citizens, researchers applying this framework to other countries must develop alternative items that correspond to the same three domains.
3. Why does the gender gap in knowledge emerge?
Differences in political knowledge among citizens can be explained by variation in three factors related to knowledge acquisition: ability, opportunity, and motivation. The gender gap in political knowledge documented in previous studies has been widely interpreted as the result of interactions among these three factors (Delli Carpini and Keeter, Reference Delli Carpini and Keeter1996; Verba et al., Reference Verba, Burns and Schlozman1997).
The first factor, ability, encompasses a wide range of elements from physical and cognitive information-processing capacities to acquired skills such as literacy. Educational opportunities are particularly important for developing such abilities. Because women have historically faced more restricted access to education, they have often been placed at a disadvantage in acquiring political knowledge.
The second factor, opportunity, refers to the contexts in which individuals acquire knowledge, such as schools or workplaces. Women have historically exhibited lower labour force participation rates than men, and even when employed, they are more likely to hold positions with lower status or restricted roles that do not involve decision-making. As a result, women tend to have fewer opportunities to acquire political knowledge through work-related responsibilities or interactions with colleagues. Constraints on educational opportunities further contribute to disparities in learning opportunities.
The third factor, motivation, stems from psychological elements such as interest in politics, political efficacy, and a sense of civic duty. In Japan, the cultural framing of politics as a male domain (LeBlanc, Reference LeBlanc1999) can depress women’s political interest and sense of efficacy. Moreover, women’s interests are often found to orient towards issues closer to private life (Stolle and Gidengil, Reference Stolle and Gidengil2010; Barabas et al., Reference Barabas, Jerit, Pollock and Rainey2014; Kraft and Dolan, Reference Kraft and Dolan2023), leading to gender differences in both the motivation to acquire political knowledge and the types of information sought.
Taken together, constraints in educational and employment opportunities, differences in the development of relevant abilities, and, on average, weaker political motivation have cumulatively contributed to the tendency for women to possess lower levels of political knowledge compared to men (Verba et al., Reference Verba, Burns and Schlozman1997).
4. How large is the knowledge gap between Japanese women and men?
The first goal of this study is to examine the magnitude of the gender gap in political knowledge in Japan. To this end, we rely on two sets of survey data. The first set captures the gap in the most recent years, while the second spans a longer time period.
The first set of data was collected before and after the Lower House election in October 2024 (hereafter, the 2024 data) and before and after the Upper House election in July 2025 (hereafter, the 2025 data). Respondents in both surveys were drawn from the registered online panel of Cross Marketing, Inc. The samples were weighted to match the population distribution in the 2020 Population Census with respect to age, gender, and region. After excluding approximately 10% of respondents who failed the attention check, the final samples consist of 19,294 respondents in the 2024 post-election survey and 22,330 respondents in the 2025 post-election survey that included the political knowledge battery. Although the surveys also contain extensive questions on electoral behaviour and political attitudes, our analysis focuses exclusively on the knowledge battery and basic demographic variables.
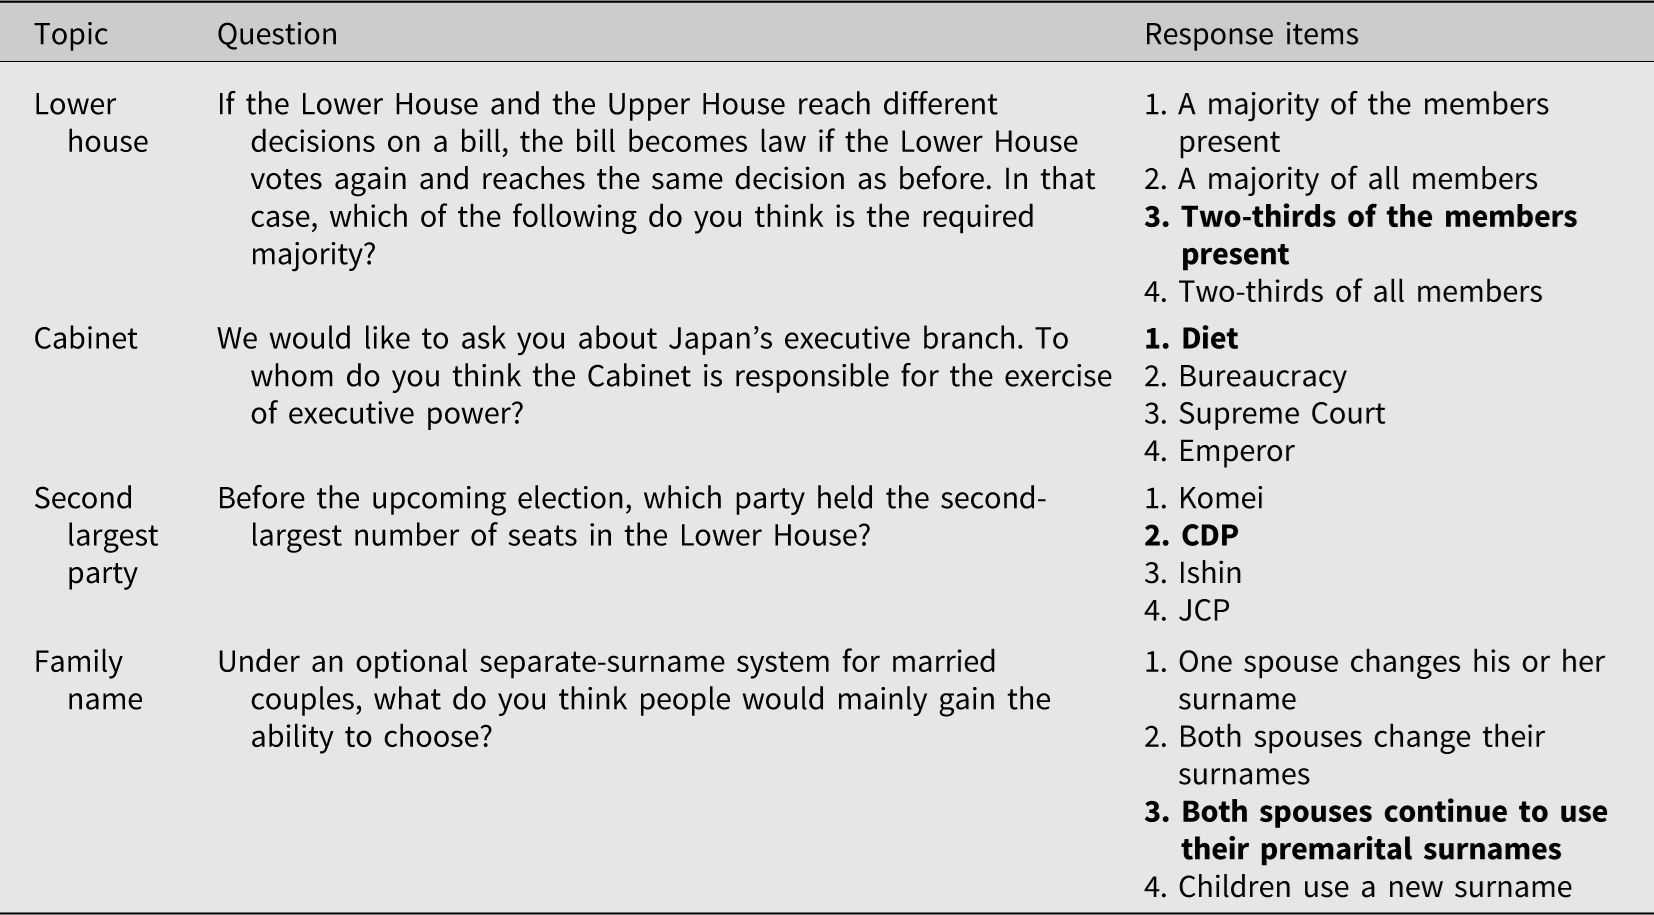
Table 1 summarizes the wording of the four knowledge items and their response options. The items include two questions on political institutions (the preferential powers of the Lower House and the body to which the Cabinet is accountable), one question on political actors (the second-largest party in the Lower House), and one question on a salient policy issue (the optional married-couple separate surname system) (Barabas et al., Reference Barabas, Jerit, Pollock and Rainey2014). Together, these items cover the three domains of political knowledge proposed by Delli Carpini and Keeter (Reference Delli Carpini and Keeter1996). Although each question offers a DK response option, this option is omitted from the table for brevity.
Knowledge items in the 2024 and 2025 surveys

Table 1. Long description
The table presents four knowledge items and their response options. It includes questions on political institutions, political actors, and a salient policy issue. The table has four rows and three columns. The columns are labeled Topic, Question, and Response items. The rows are as follows: Row 1: Topic: Lower house, Question: If the Lower House and the Upper House reach different decisions on a bill, the bill becomes law if the Lower House votes again and reaches the same decision as before. In that case, which of the following do you think is the required majority?, Response items: 1. A majority of the members present, 2. A majority of all members, 3. Two-thirds of the members present, 4. Two-thirds of all members. Row 2: Topic: Cabinet, Question: We would like to ask you about Japanʼs executive branch. To whom do you think the Cabinet is responsible for the exercise of executive power?, Response items: 1. Diet, 2. Bureaucracy, 3. Supreme Court, 4. Emperor. Row 3: Topic: Second largest party, Question: Before the upcoming election, which party held the second-largest number of seats in the Lower House?, Response items: 1. Komei, 2. CDP, 3. Ishin, 4. JCP. Row 4: Topic: Family name, Question: Under an optional separate-surname system for married couples, what do you think people would mainly gain the ability to choose?, Response items: 1. One spouse changes his or her surname, 2. Both spouses change their surnames, 3. Both spouses continue to use their premarital surnames, 4. Children use a new surname.
Note: Although each question offers a DK option, this option is omitted from the table for brevity. The correct answer is shown in bold. The original questionnaire in Japanese is provided in Table A1 in the Appendix.
To estimate the gender gap, we regress a binary indicator for a correct response (=1) on a female indicator (=1) for each knowledge item. The outcome variable is coded as zero when respondents provide an incorrect answer or select ‘don’t know’. A negative coefficient on the female indicator indicates that women are less likely than men to answer the question correctly.Footnote 1
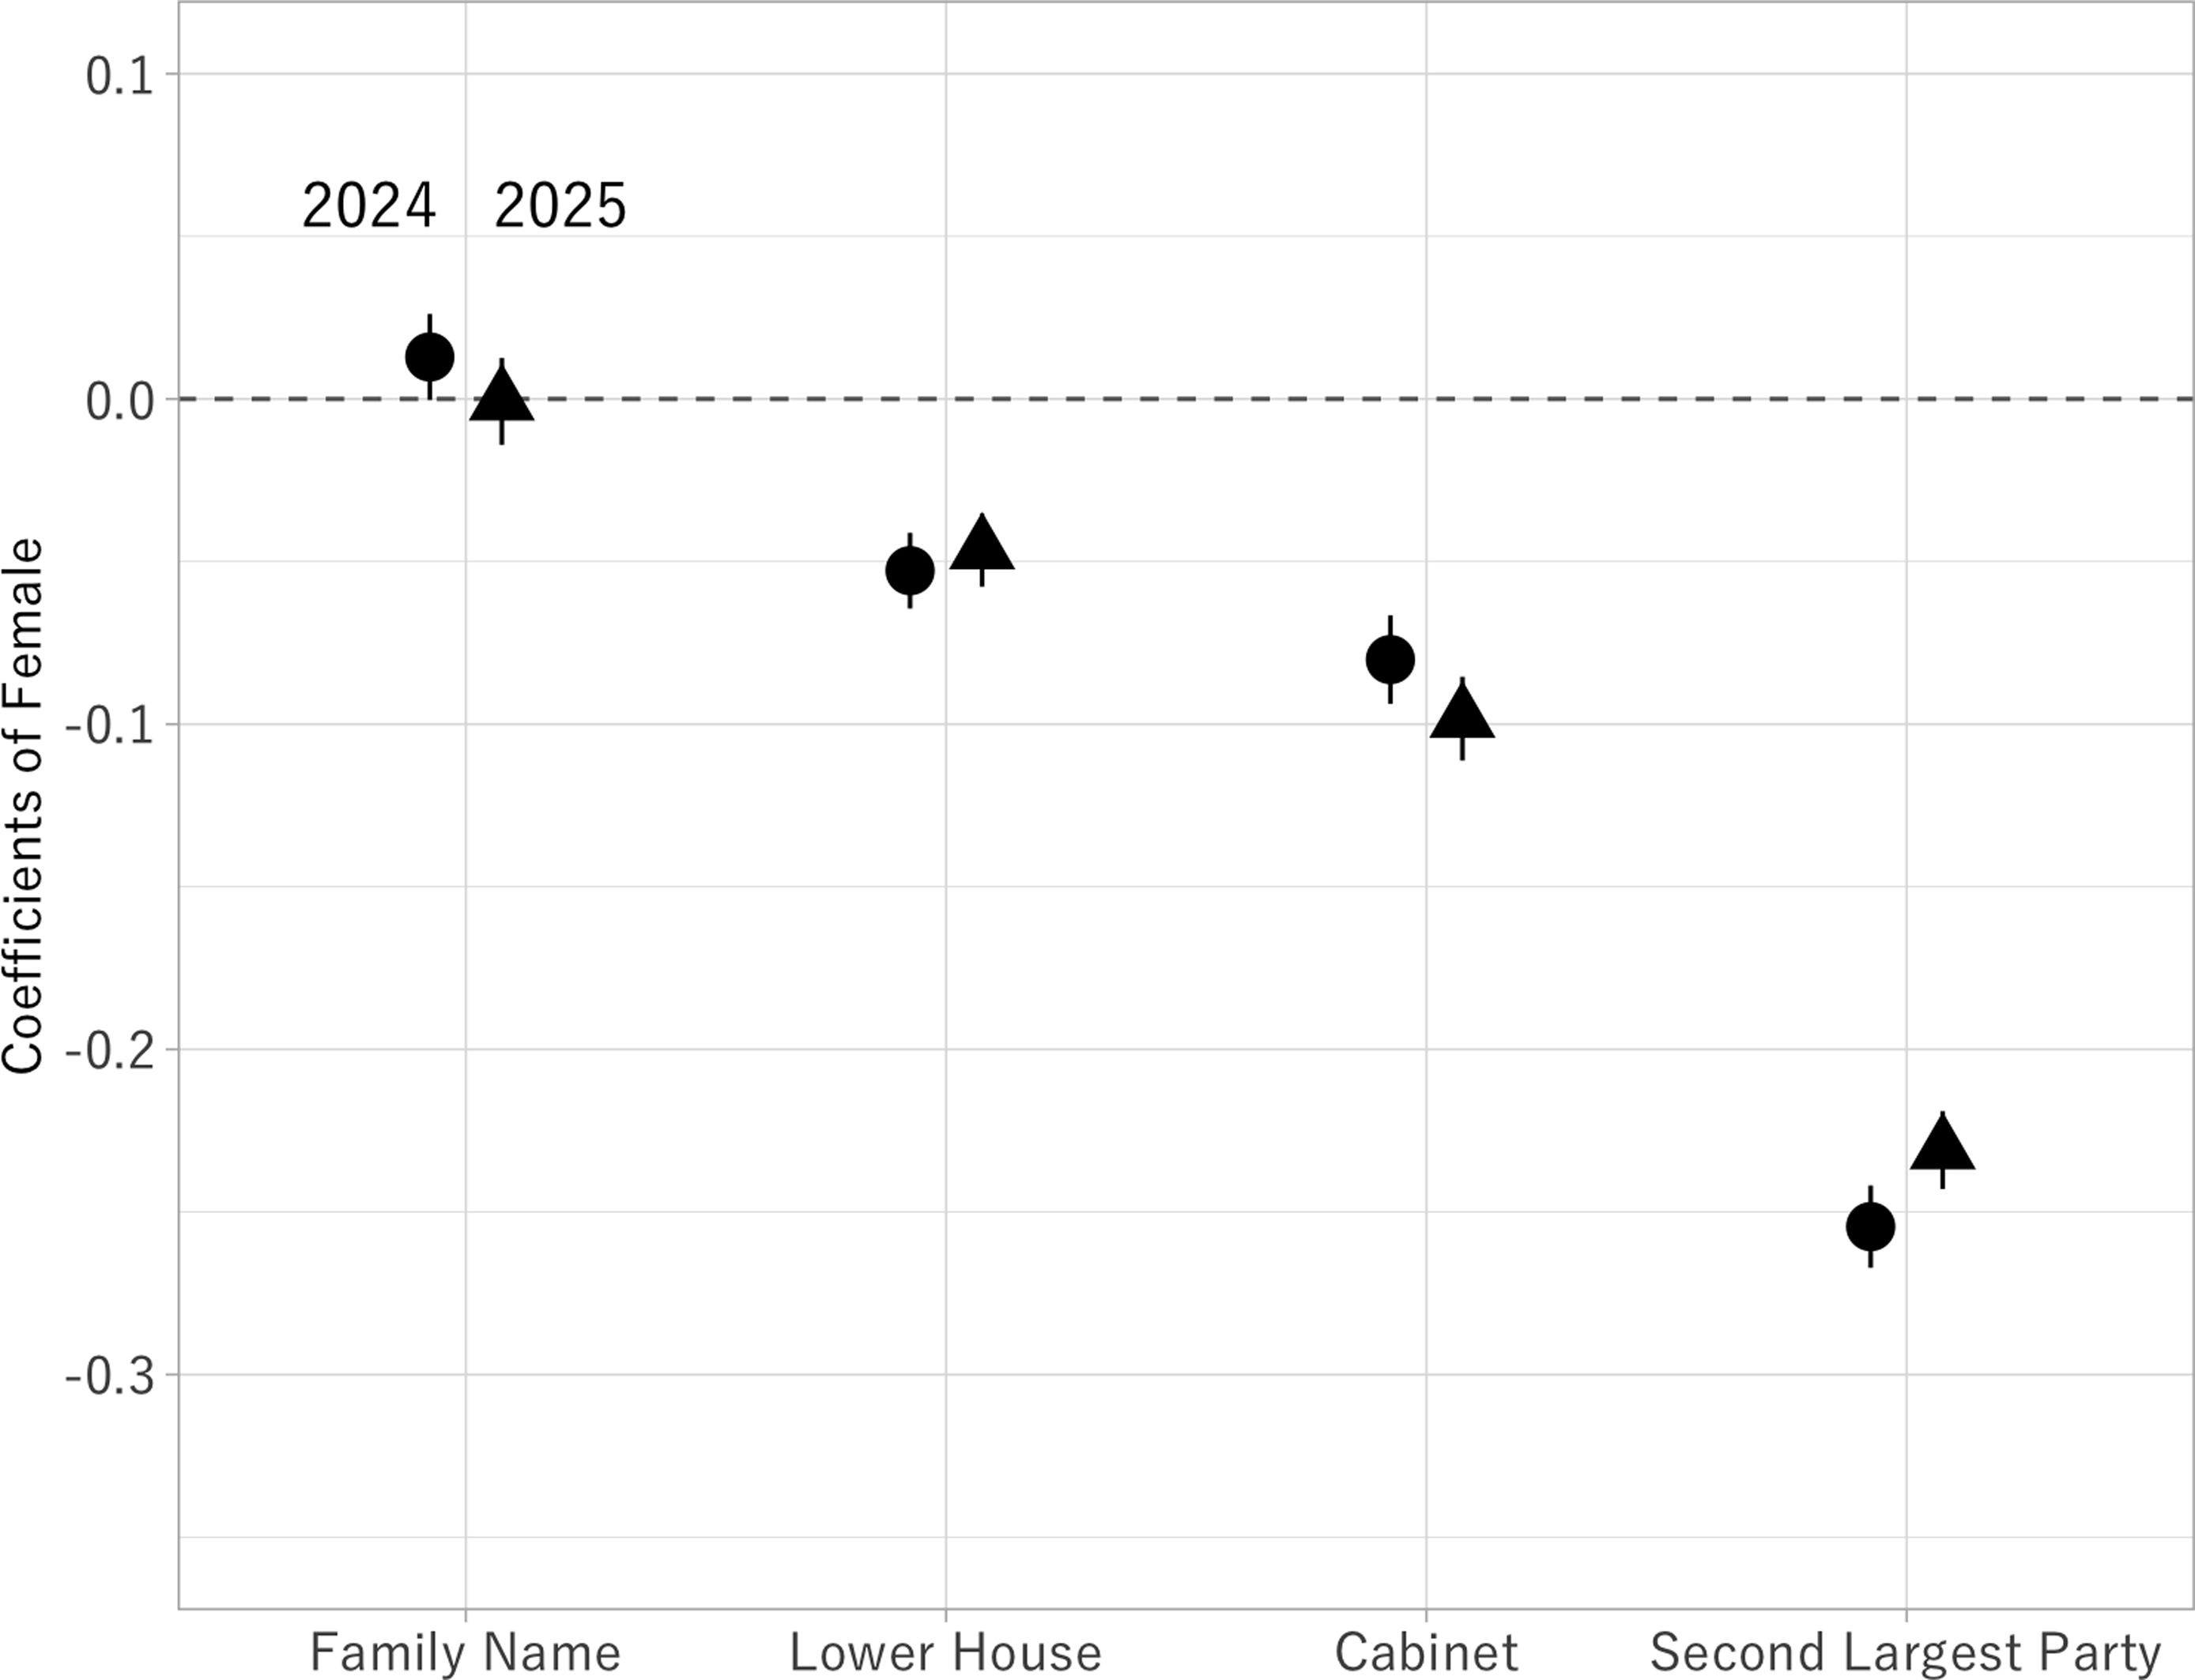
Figure 1 displays the estimated coefficients for the female indicator along with 95% confidence intervals, represented by circles and triangles.Footnote 2 The dashed horizontal line marks zero, indicating no gender difference in accuracy. For three of the four knowledge items, the coefficients are negative in both 2024 and 2025, suggesting that women are less likely than men to select the correct answer. On average, the probability of a correct response is approximately 12 percentage points lower for women on these items. Notably, however, the gender gap disappears for the question concerning the optional married-couple separate surname system. This issue has been debated for many years in Japan and is particularly salient for women, who overwhelmingly change their surname upon marriage. This pattern suggests that women tend to be more knowledgeable about political issues that are closely tied to their lived experiences, a point we discuss in greater detail later.
Gender gap in political knowledge in 2024 and 2025.
Note: The gender gap is estimated by regressing the outcome variable for accurate responses (=1) on the female indicator (=1) for each knowledge item. The circles and triangles represent the coefficient sizes for the female indicator, with 95% confidence intervals. The data were obtained from the 2024 and 2025 online surveys.

While the results in Figure 1 indicate a substantial gender gap in political knowledge in Japan, the magnitude of this gap may be overestimated or underestimated due to the characteristics of online panel samples, the possibility of respondents looking up answers online, or the specific choice of knowledge items. Moreover, it remains unclear whether these findings generalize across time.
To assess the robustness of the observed gap, we therefore turn to data from 15 probability-based public opinion surveys conducted between 2000 and 2018. These surveys include a wide variety of political knowledge items and rely primarily on face-to-face interviews, with a smaller number using computer-assisted survey modes. Sample sizes vary across surveys. Table A3 in the Online Appendix summarizes the key features of each survey. For panel surveys, each wave is treated as a separate survey.
Across these surveys, we identify 58 political knowledge items. Following Delli Carpini and Keeter (Reference Delli Carpini and Keeter1996), we classify each item into one of three categories: the rules of the game, substance of politics, and people and parties. The exact wording of each item, the response options, and the assigned category are reported in Table A4 in the Appendix.
Questions concerning the rules of the game are the most frequent, accounting for 35 items. These include questions about Cabinet responsibility (e.g., ‘To whom do you think the Cabinet is accountable for its administration?’), the electoral system (e.g., ‘What is the name of the electoral system used for the Lower House?’), and constitutional provisions (e.g., ‘Which article of the Constitution of Japan contains the war-renunciation clause?’).
The second most common category consists of questions on people and parties (17 items). These questions typically ask respondents to identify the public office held by a named individual or to identify the officeholder corresponding to a given title. A small number of items also concern political parties, such as the identity of the second-largest party in the House of Representatives.
The remaining six items fall into the category of the substance of politics and include questions on topics such as the unemployment rate, the pension system, and international affairs.
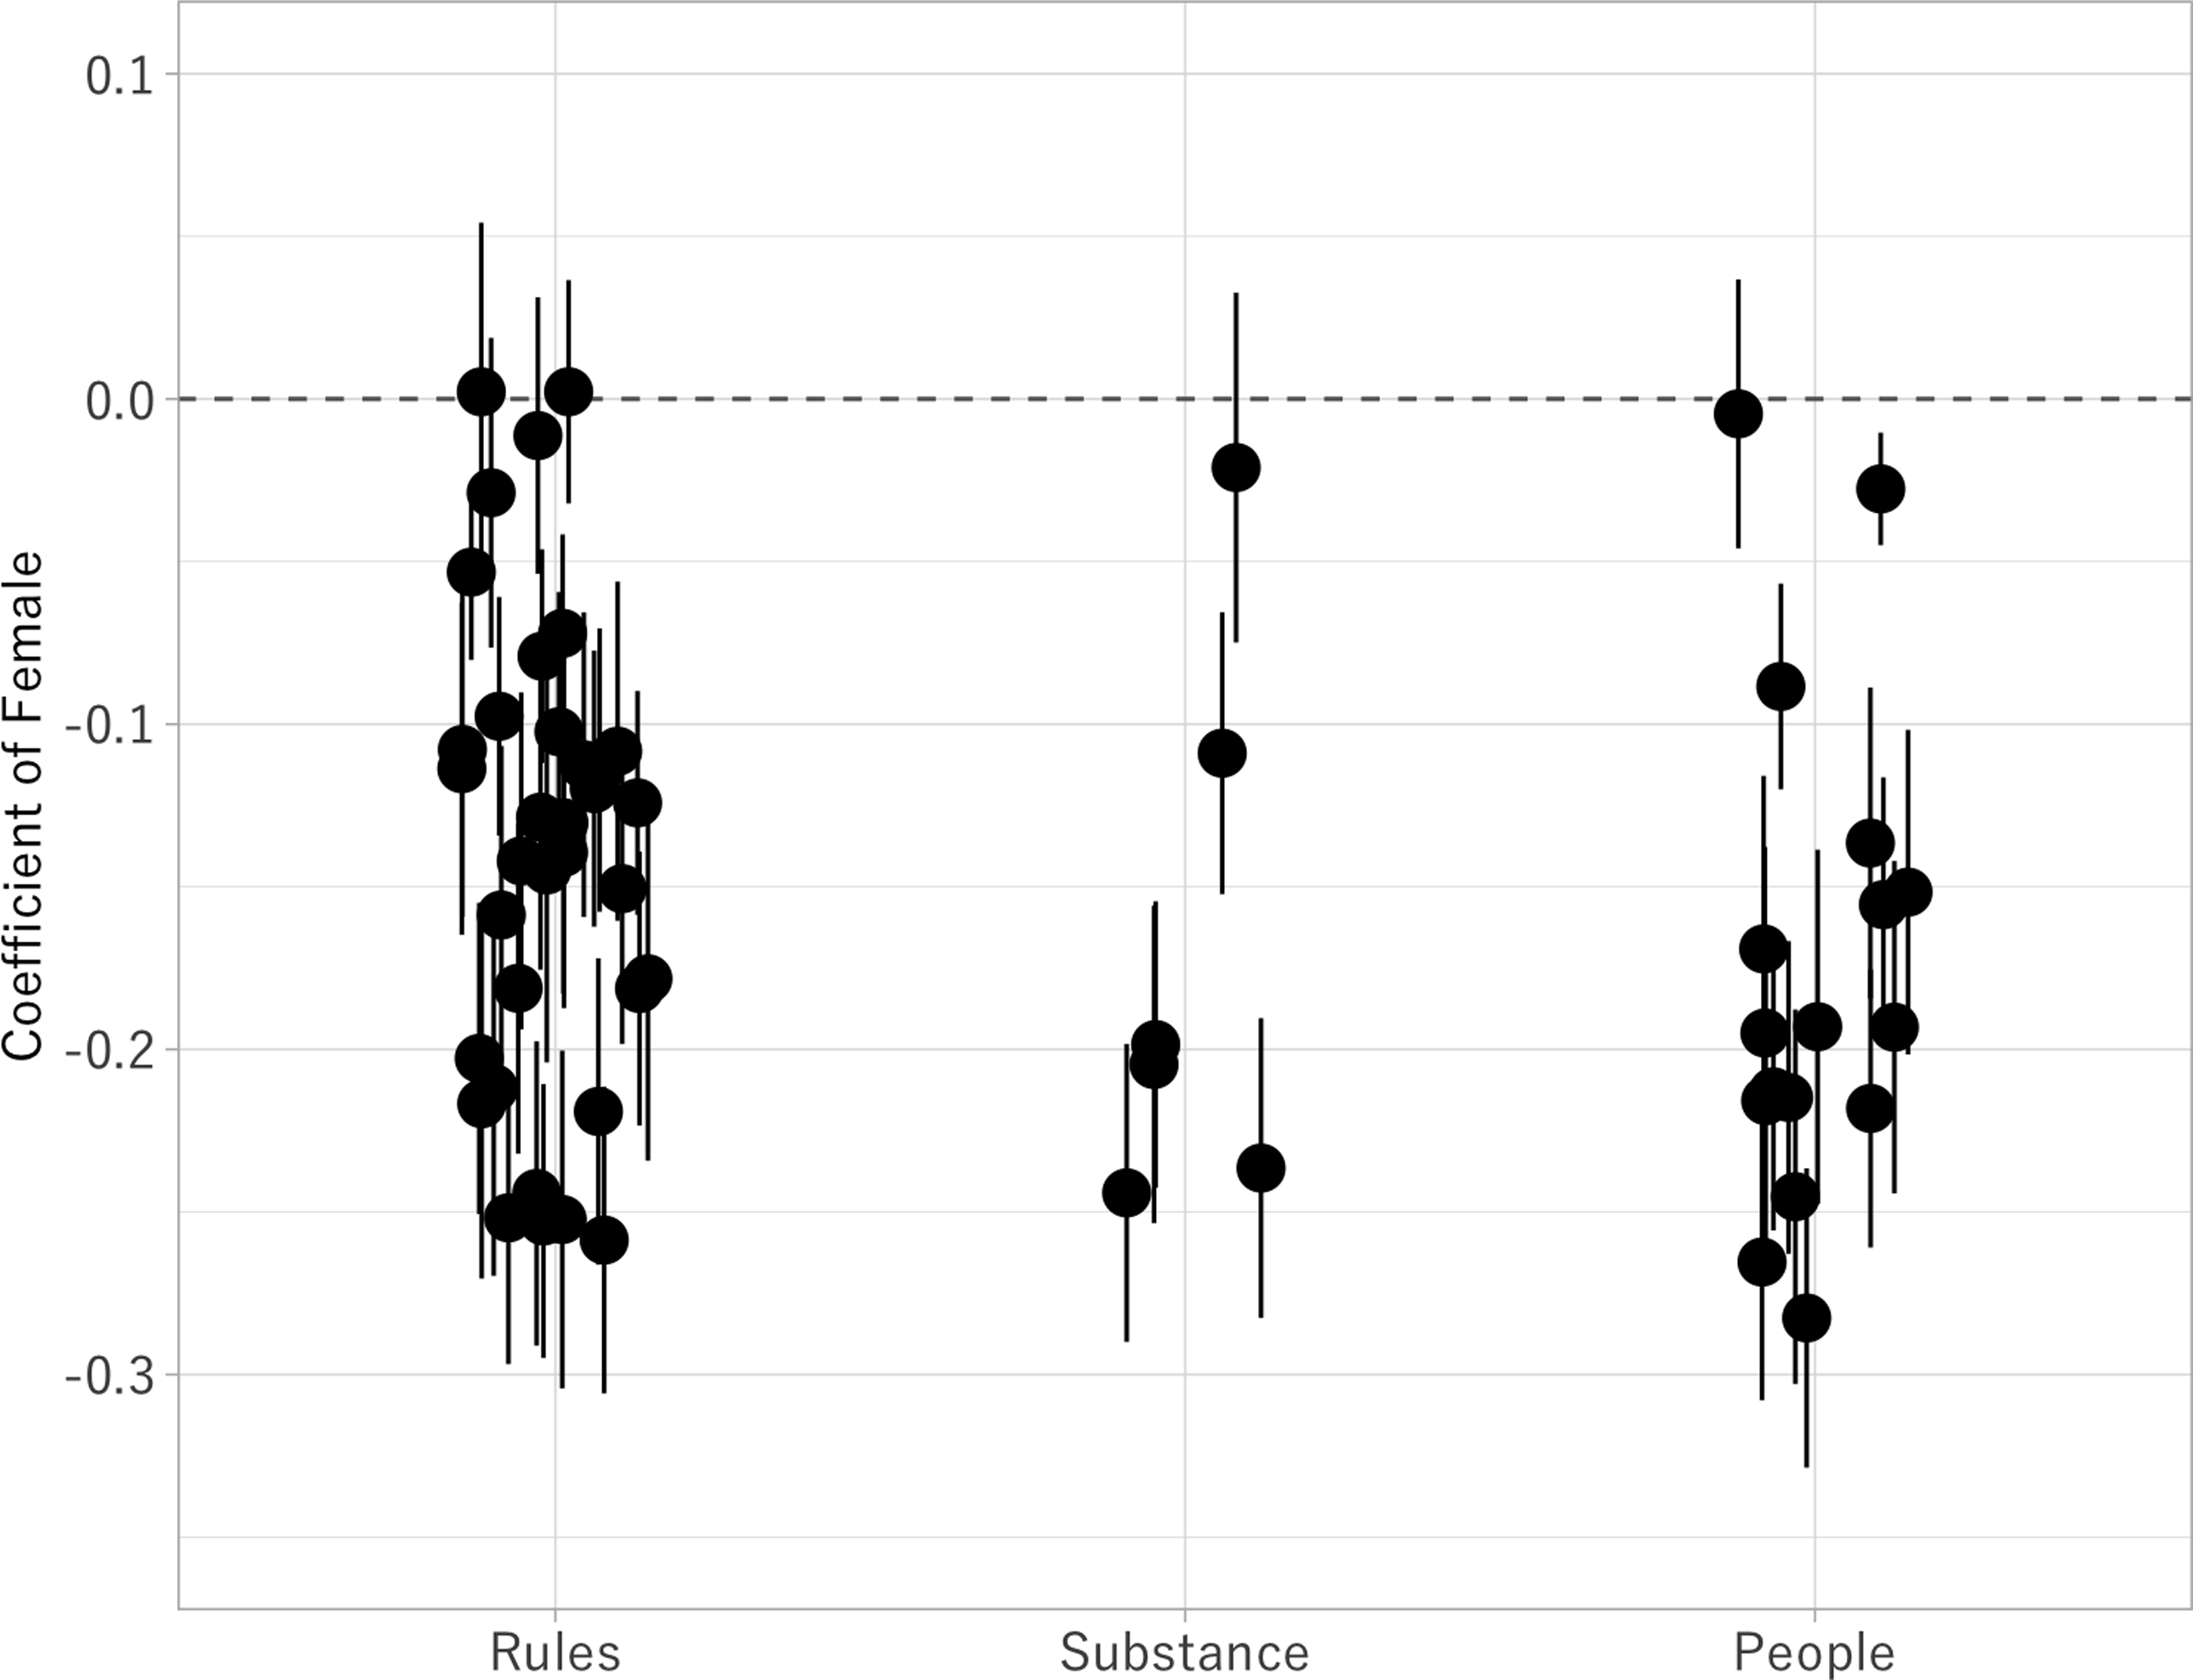
Figure 2 presents the estimated gender gap for each knowledge category.Footnote 3 Using the same estimation strategy as in Figure 1, we regress the binary indicator for a correct response on the female indicator. Across all three categories, the vast majority of coefficients are negative. On average, the gender gap amounts to 14 percentage points for rules of the game, 17 percentage points for substance of politics, and 19 percentage points for people and parties. These results indicate that women consistently answer political knowledge questions less accurately than men. Importantly, the similarity of the estimated gaps across categories suggests that the findings are not highly sensitive to survey characteristics such as survey mode or year.
Gender gap in political knowledge between 2000 and 2018.
Note: The gender gap is estimated by regressing the outcome variable for accurate responses (=1) on the female indicator (=1) for each knowledge item. The circles represent the coefficient sizes for the female indicator, with 95% confidence intervals. The data were obtained from 15 surveys between 2000 and 2018.

Taken together, these analyses demonstrate that the gender gap in political knowledge in Japan is both substantial and remarkably persistent across survey modes, time periods, and types of knowledge items. Even when relying on probability samples and a broad range of political knowledge domains, women consistently score lower than men, indicating that the observed gap cannot be attributed to specific survey designs or particular question formats.
5. How large is Japan’s gender gap in international comparison?
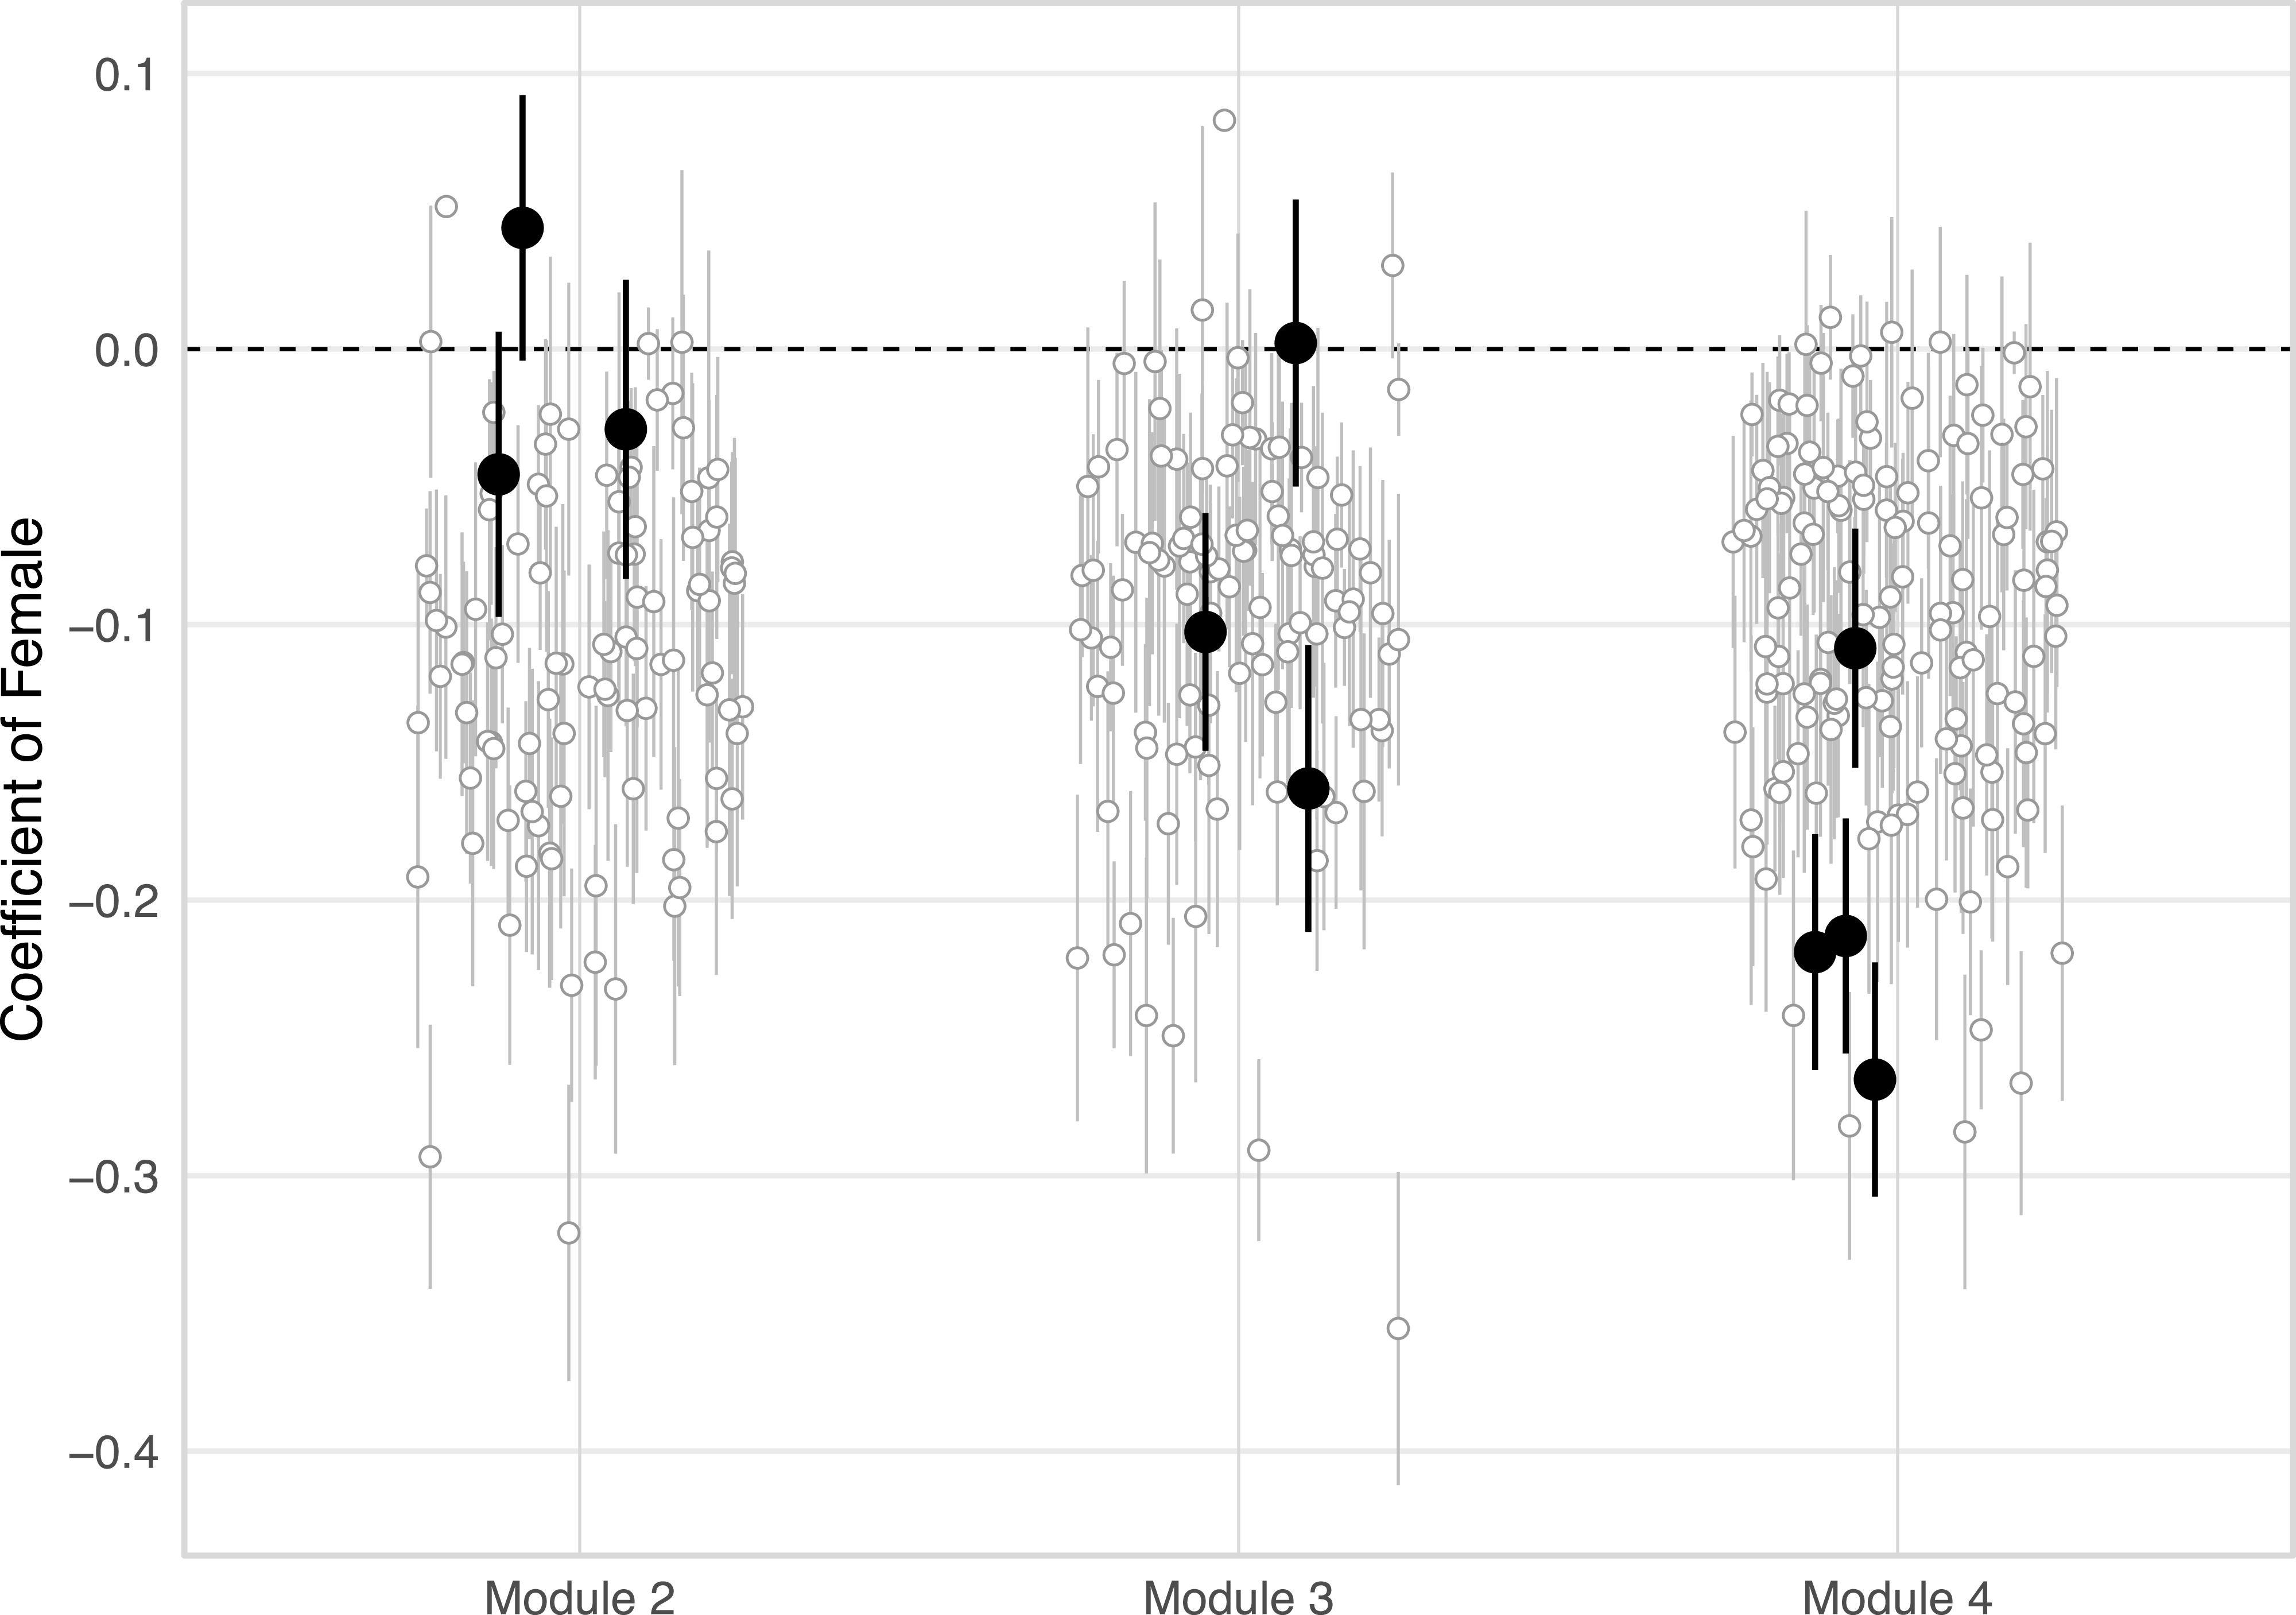
The second goal of this study is to situate Japan’s gender gap in political knowledge within an international comparative perspective. Figure 3 presents gender gaps in political knowledge across countries and survey modules using data from the CSES, a large-scale cross-national survey that employs harmonized questionnaires across a wide range of countries. Our analysis draws on CSES Modules 2 through 4, each of which includes political knowledge items for approximately 40 participating countries on average, thereby providing a broad comparative context. Although the specific content of political knowledge items varies across modules and countries, each module is designed to capture core aspects of political knowledge in a manner that is broadly comparable across national settings.
Cross-national comparison of the gender gap.
Note: The gender gap is estimated by regressing an indicator for accurate responses (=1) on a female indicator (=1), separately for each knowledge item, country, and module. Circles represent the estimated coefficients for the female indicator, and vertical lines indicate 95% confidence intervals. The data were obtained from CSES Module 2 to 4. Black circles denote Japan, while grey circles represent other countries.

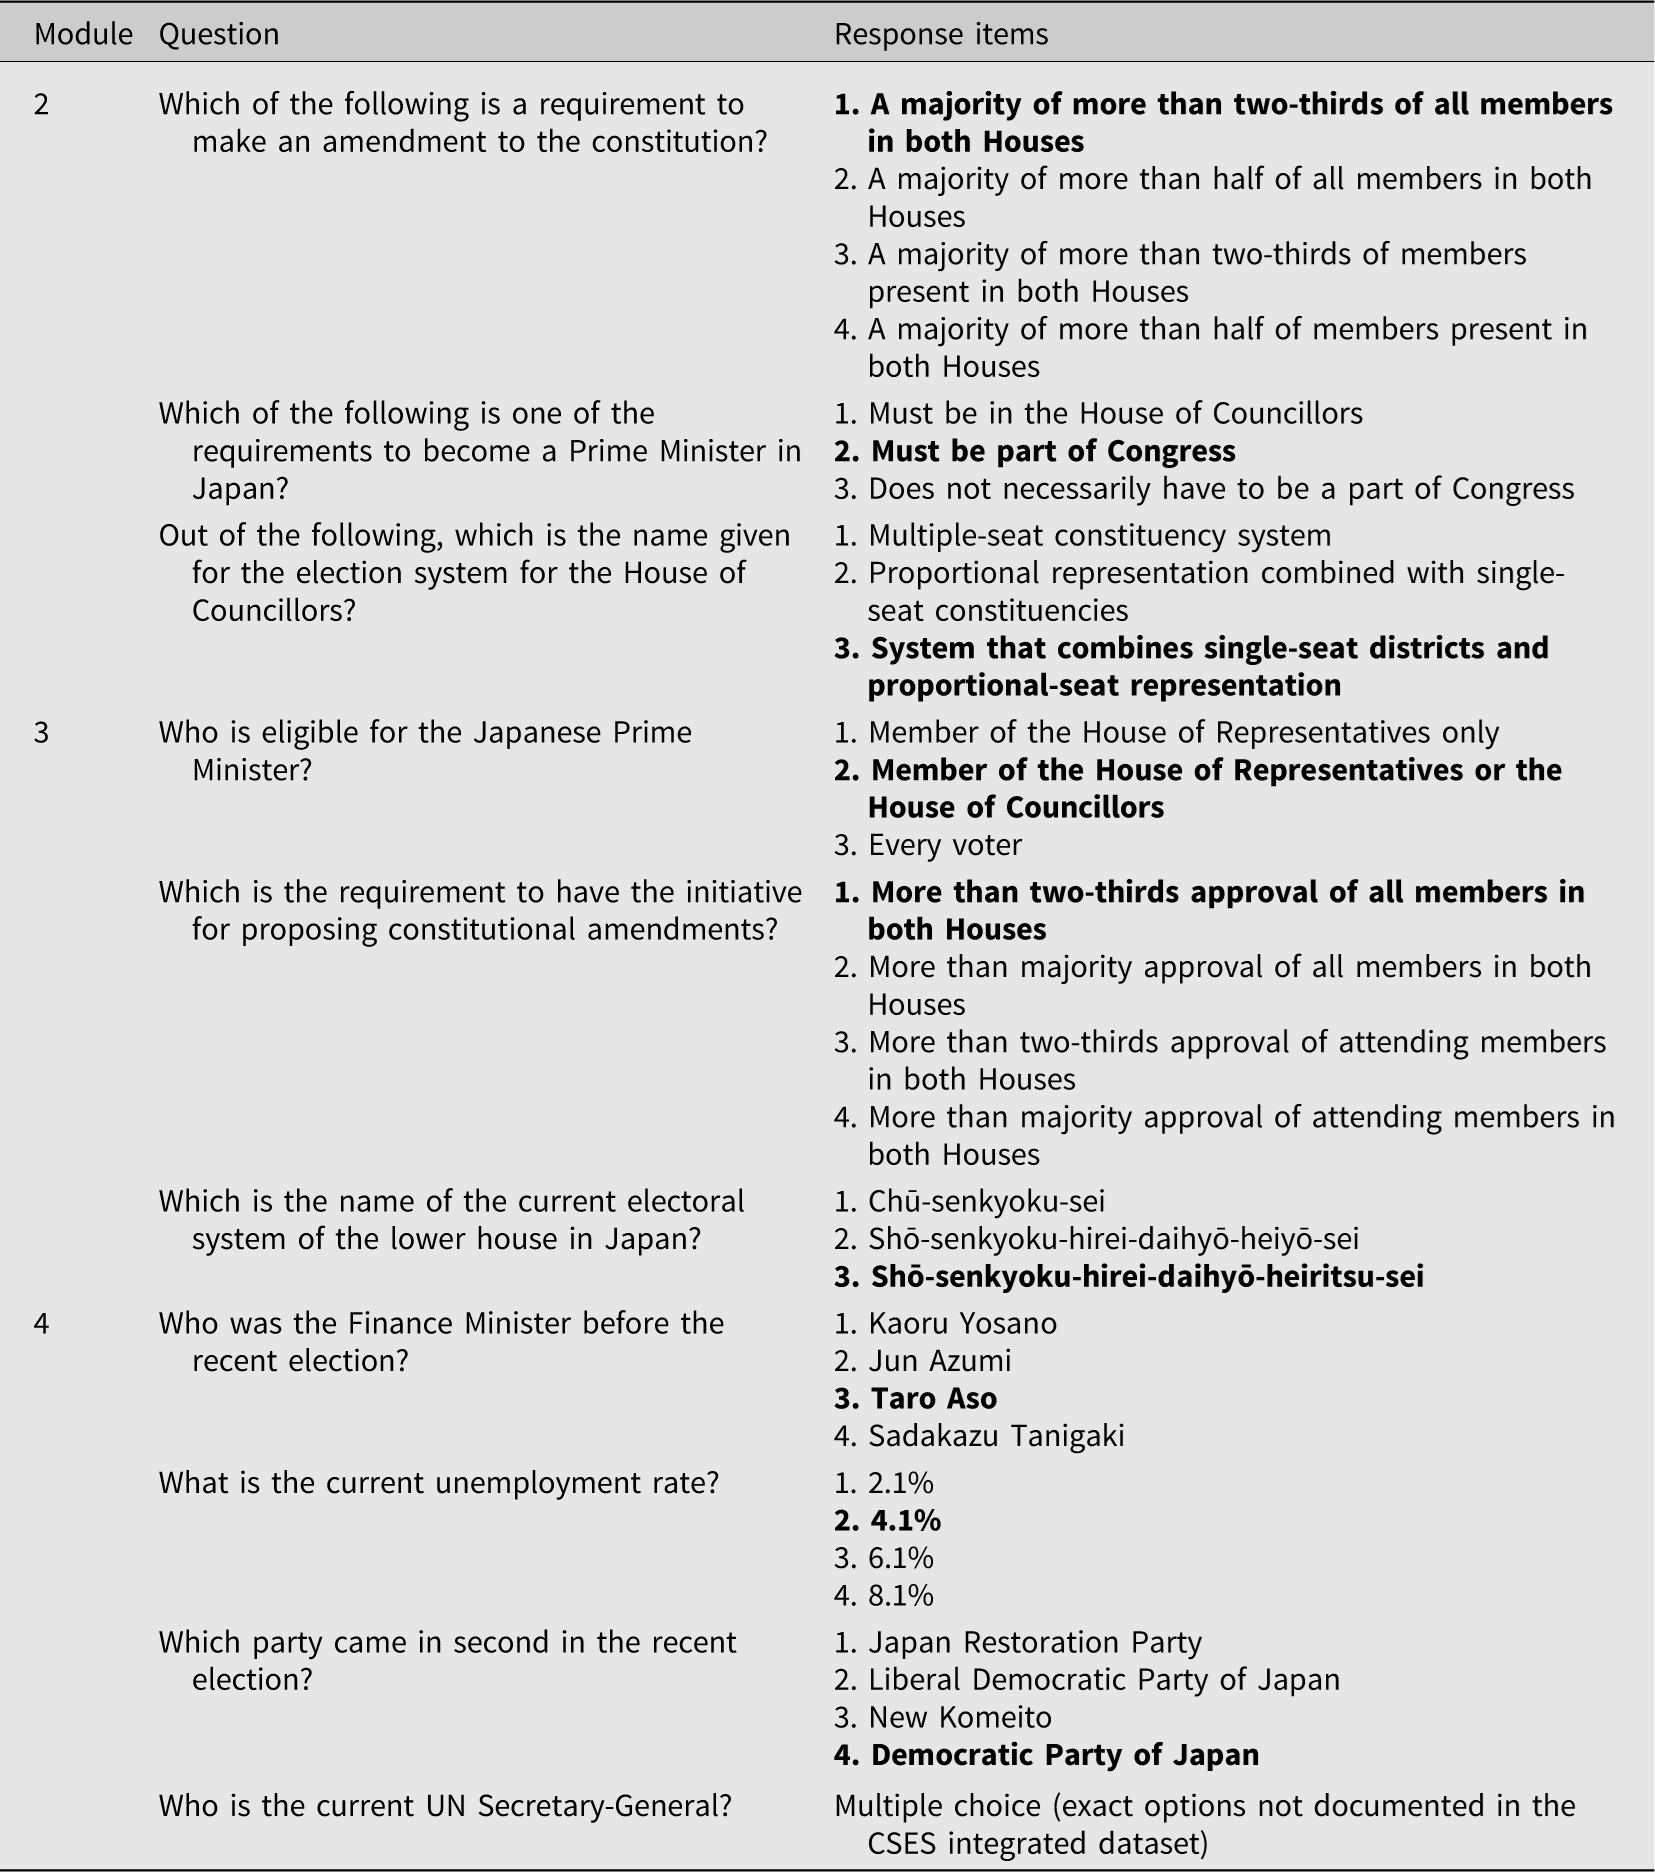
Table 2 reports the question wording and response options for all political knowledge items used for Japan in CSES Modules 2–4. While the cross-national analyses do not rely on identical questions across countries, these Japanese items illustrate the types of institutional, electoral, and factual knowledge assessed in each module.Footnote 4 The number of knowledge items in each module is three in most country-modules. Note that several country-surveys did not include a DK response option.Footnote 5
Knowledge items in the CSES data

Table 2. Long description
The table presents political knowledge items for Japan across CSES Modules 2-4. It has four columns: Module, Question, and Response items. Module 2 includes questions about constitutional amendments, requirements to become Prime Minister, and the election system for the House of Councillors. Module 3 covers eligibility for the Japanese Prime Minister, requirements for proposing constitutional amendments, and the current electoral system of the lower house. Module 4 addresses the former Finance Minister, current unemployment rate, and the party that came in second in the recent election. Each module lists specific questions and corresponding response items, detailing the political and electoral knowledge assessed.
Note: Political knowledge questions in the CSES are country-specific by design. Table 2 therefore reports the question wording and answer options for Japan only. In the 2013 Japanese survey (Module 4), the item on the UN Secretary-General was mistranslated, which may have increased response difficulty. Although each question offers a DK response option in Modules 3 and 4, this option is omitted from the table for brevity. The correct answer is shown in bold.
For each knowledge item in each country-module, we regress a binary indicator for a correct response (= 1) on a female indicator (= 1). Points in Figure 3 represent coefficient estimates, and vertical bars indicate 95 percent confidence intervals. The estimates obtained from Japan are highlighted in black, while estimates for other countries are shown in grey. The horizontal reference line at zero denotes the absence of a gender gap.
As Figure 3 shows, a clear and broadly shared pattern emerges across countries. In most cases, the estimated coefficients are negative, indicating that women tend to answer political knowledge questions less accurately than men. This pattern appears consistently across modules and countries, suggesting that gender gaps in political knowledge are a common feature of contemporary democracies rather than a phenomenon unique to any single national context.
Within this international distribution, Japan does not emerge as an outlier. The coefficients in Modules 3 and 4 are clearly negative. Importantly, however, the coefficient in Module 2 is close to zero, potentially because the Japanese questionnaire did not include a DK option, which may explain the absence of a gender gap in knowledge. We examine the role of the DK option in more detail below. Overall, Japan’s estimates in Modules 3 and 4 fall well within the range observed in other countries, indicating that the magnitude of the gender gap in Japan is broadly comparable to that found elsewhere rather than uniquely large.
6. Does measurement influence the observed gap?
Importantly, the knowledge gap documented in the previous sections may be overstated because the motivations underlying both the acquisition and the expression of political knowledge depend on what is measured and how responses are elicited. It is therefore essential to distinguish between conventional political knowledge items and what we term women-related items: political facts embedded in policy domains characterized by asymmetric experiential exposure, in which women, by virtue of their social roles and life-course experiences, are more likely than men to encounter and engage with relevant information. In addition, observed gender gaps may be shaped by response formats, particularly the availability of a DK option, which can differentially affect whether respondents express partial or uncertain knowledge rather than underlying knowledge itself.
First, the magnitude of the gender gap may depend on the substantive content of the knowledge being measured (Jerit and Barabas, Reference Jerit and Barabas2017). Following the framework of Delli Carpini and Keeter (Reference Delli Carpini and Keeter1996), many surveys worldwide – including those conducted in Japan – focus on political knowledge items drawn from the three conventional categories discussed above. While gender gaps are frequently observed for such items, prior research shows that these gaps narrow – or, in some cases, even reverse – in policy domains in which women tend to exhibit greater interest. For example, gender gaps are evident for questions about party seat shares or ideology, but are substantially smaller for questions related to women’s rights, health, or women’s representation in Congress and the Supreme Court (Stolle and Gidengil, Reference Stolle and Gidengil2010; Dolan and Hansen, Reference Dolan and Hansen2020; Kraft and Dolan, Reference Kraft and Dolan2023). Similarly, Japanese women have been shown to display a more substantial interest in social and policy issues closely connected to everyday life (Steel, Reference Steel2004).
Second, the response options used to measure political knowledge may themselves generate gender differences. Gendered patterns of response behaviour are closely linked to the measurement decision of whether to include a DK option. When answering political knowledge questions, men tend to guess more readily, whereas women are more likely to refrain from guessing and instead select ‘don’t know’ (Lizotte and Sidman, Reference Lizotte and Sidman2009; Fraile, Reference Fraile2014). Several mechanisms may account for this pattern, including women’s lower confidence in their political knowledge – particularly in a domain widely perceived as male-typed (Wolak, Reference Wolak2020); a greater reluctance to guess in situations of uncertainty to avoid incorrect answers (Lizotte and Sidman, Reference Lizotte and Sidman2009); or an aversion to appearing overly assertive or ‘showing off’ knowledge. These tendencies can lead to an overestimation of gender gaps in political knowledge. Indeed, when surveys do not offer a DK option, women’s rates of correct responses increase, resulting in smaller observed gender differences (Ferrin et al., Reference Ferrin, Fraile and García-Albacete2018; Miller, Reference Miller2019).
Taken together, these arguments suggest that gender gaps in political knowledge are likely to be larger in domains in which women exhibit relatively weak interest and smaller in domains in which their interest is stronger. Moreover, women’s greater propensity to select DK responses may inflate observed gender differences. When the DK option is removed, the gender gap is therefore expected to shrink.
These considerations are particularly relevant in the Japanese context, where conventional indicators of political knowledge may be especially misaligned with women’s political experiences and modes of engagement. As a result, it is not clear whether the measurement effects documented in other countries operate similarly in Japan. Examining how measurement choices shape observed gender gaps is thus not merely a matter of replication, but a necessary step for interpreting what these gaps substantively represent in this context. By reassessing how political knowledge is measured, this study seeks to disentangle differences in underlying knowledge from differences arising from context-dependent response behaviour and item relevance.
7. Does the gender gap in knowledge shrink when measured differently?
The final goal of this study is to test whether the gender gap in political knowledge narrows in the Japanese context when women-related knowledge items are used and when the DK response option is discouraged or removed. We begin by examining whether women are more likely than men to select the DK option.
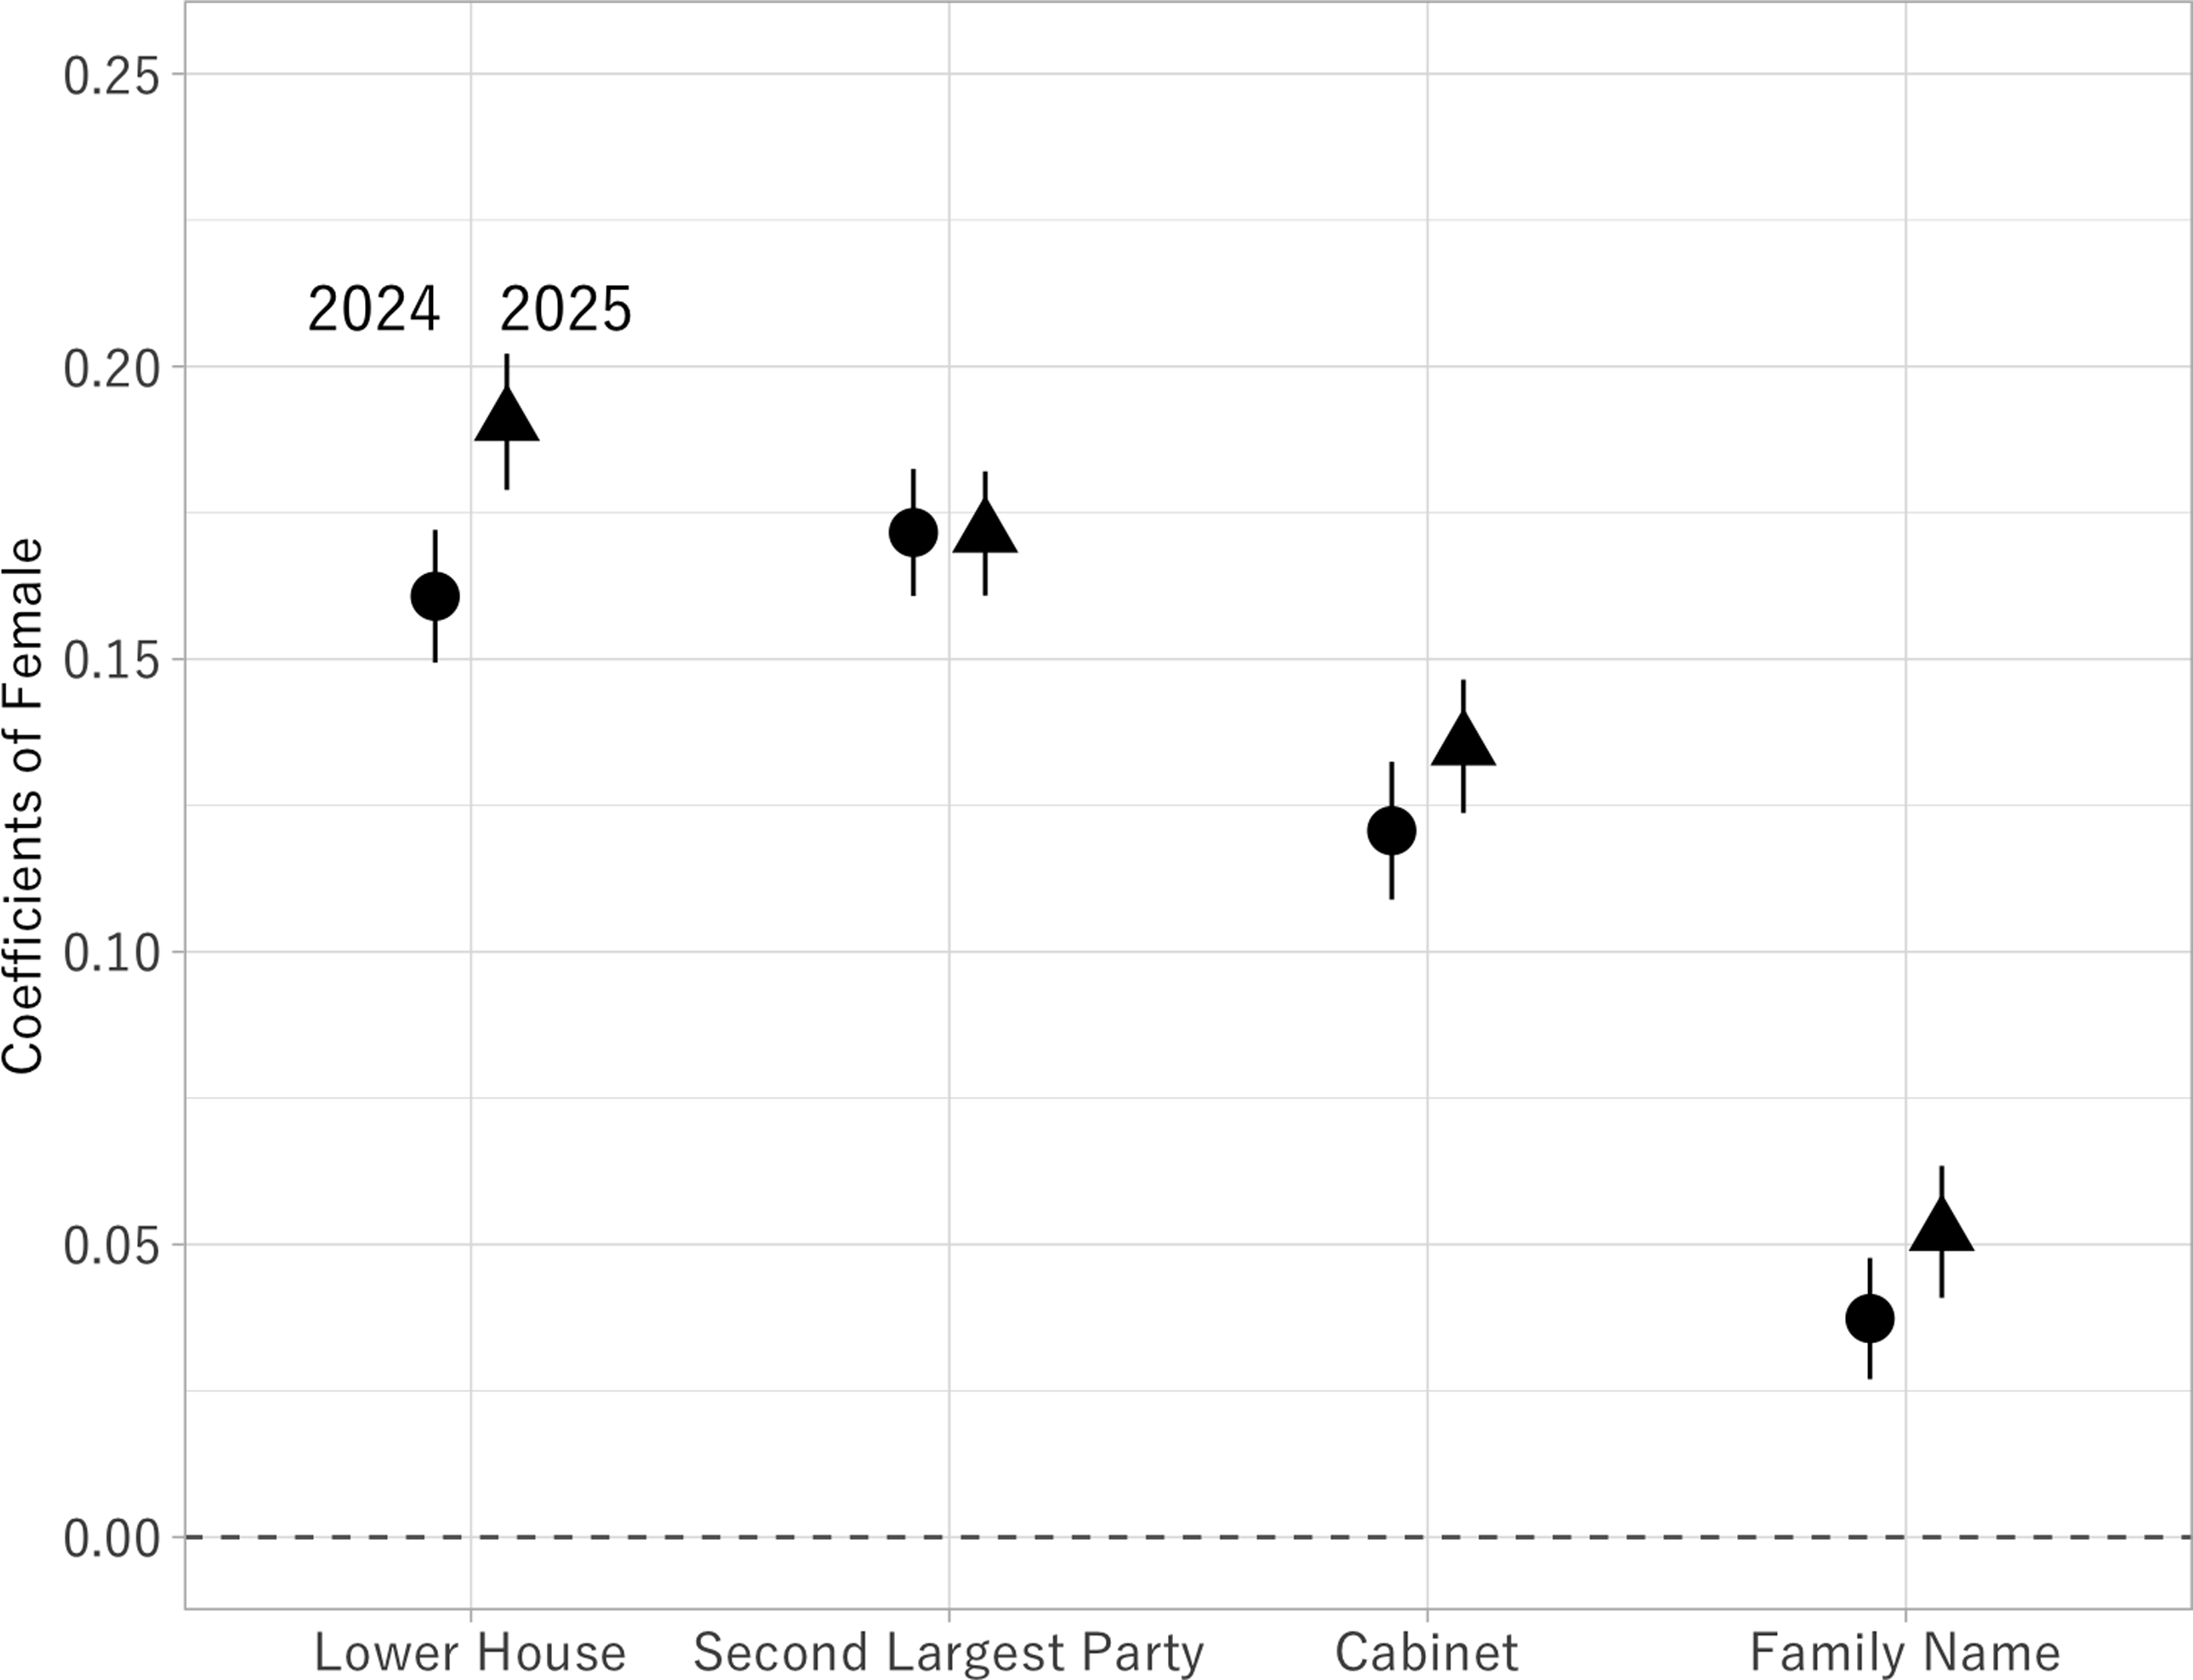
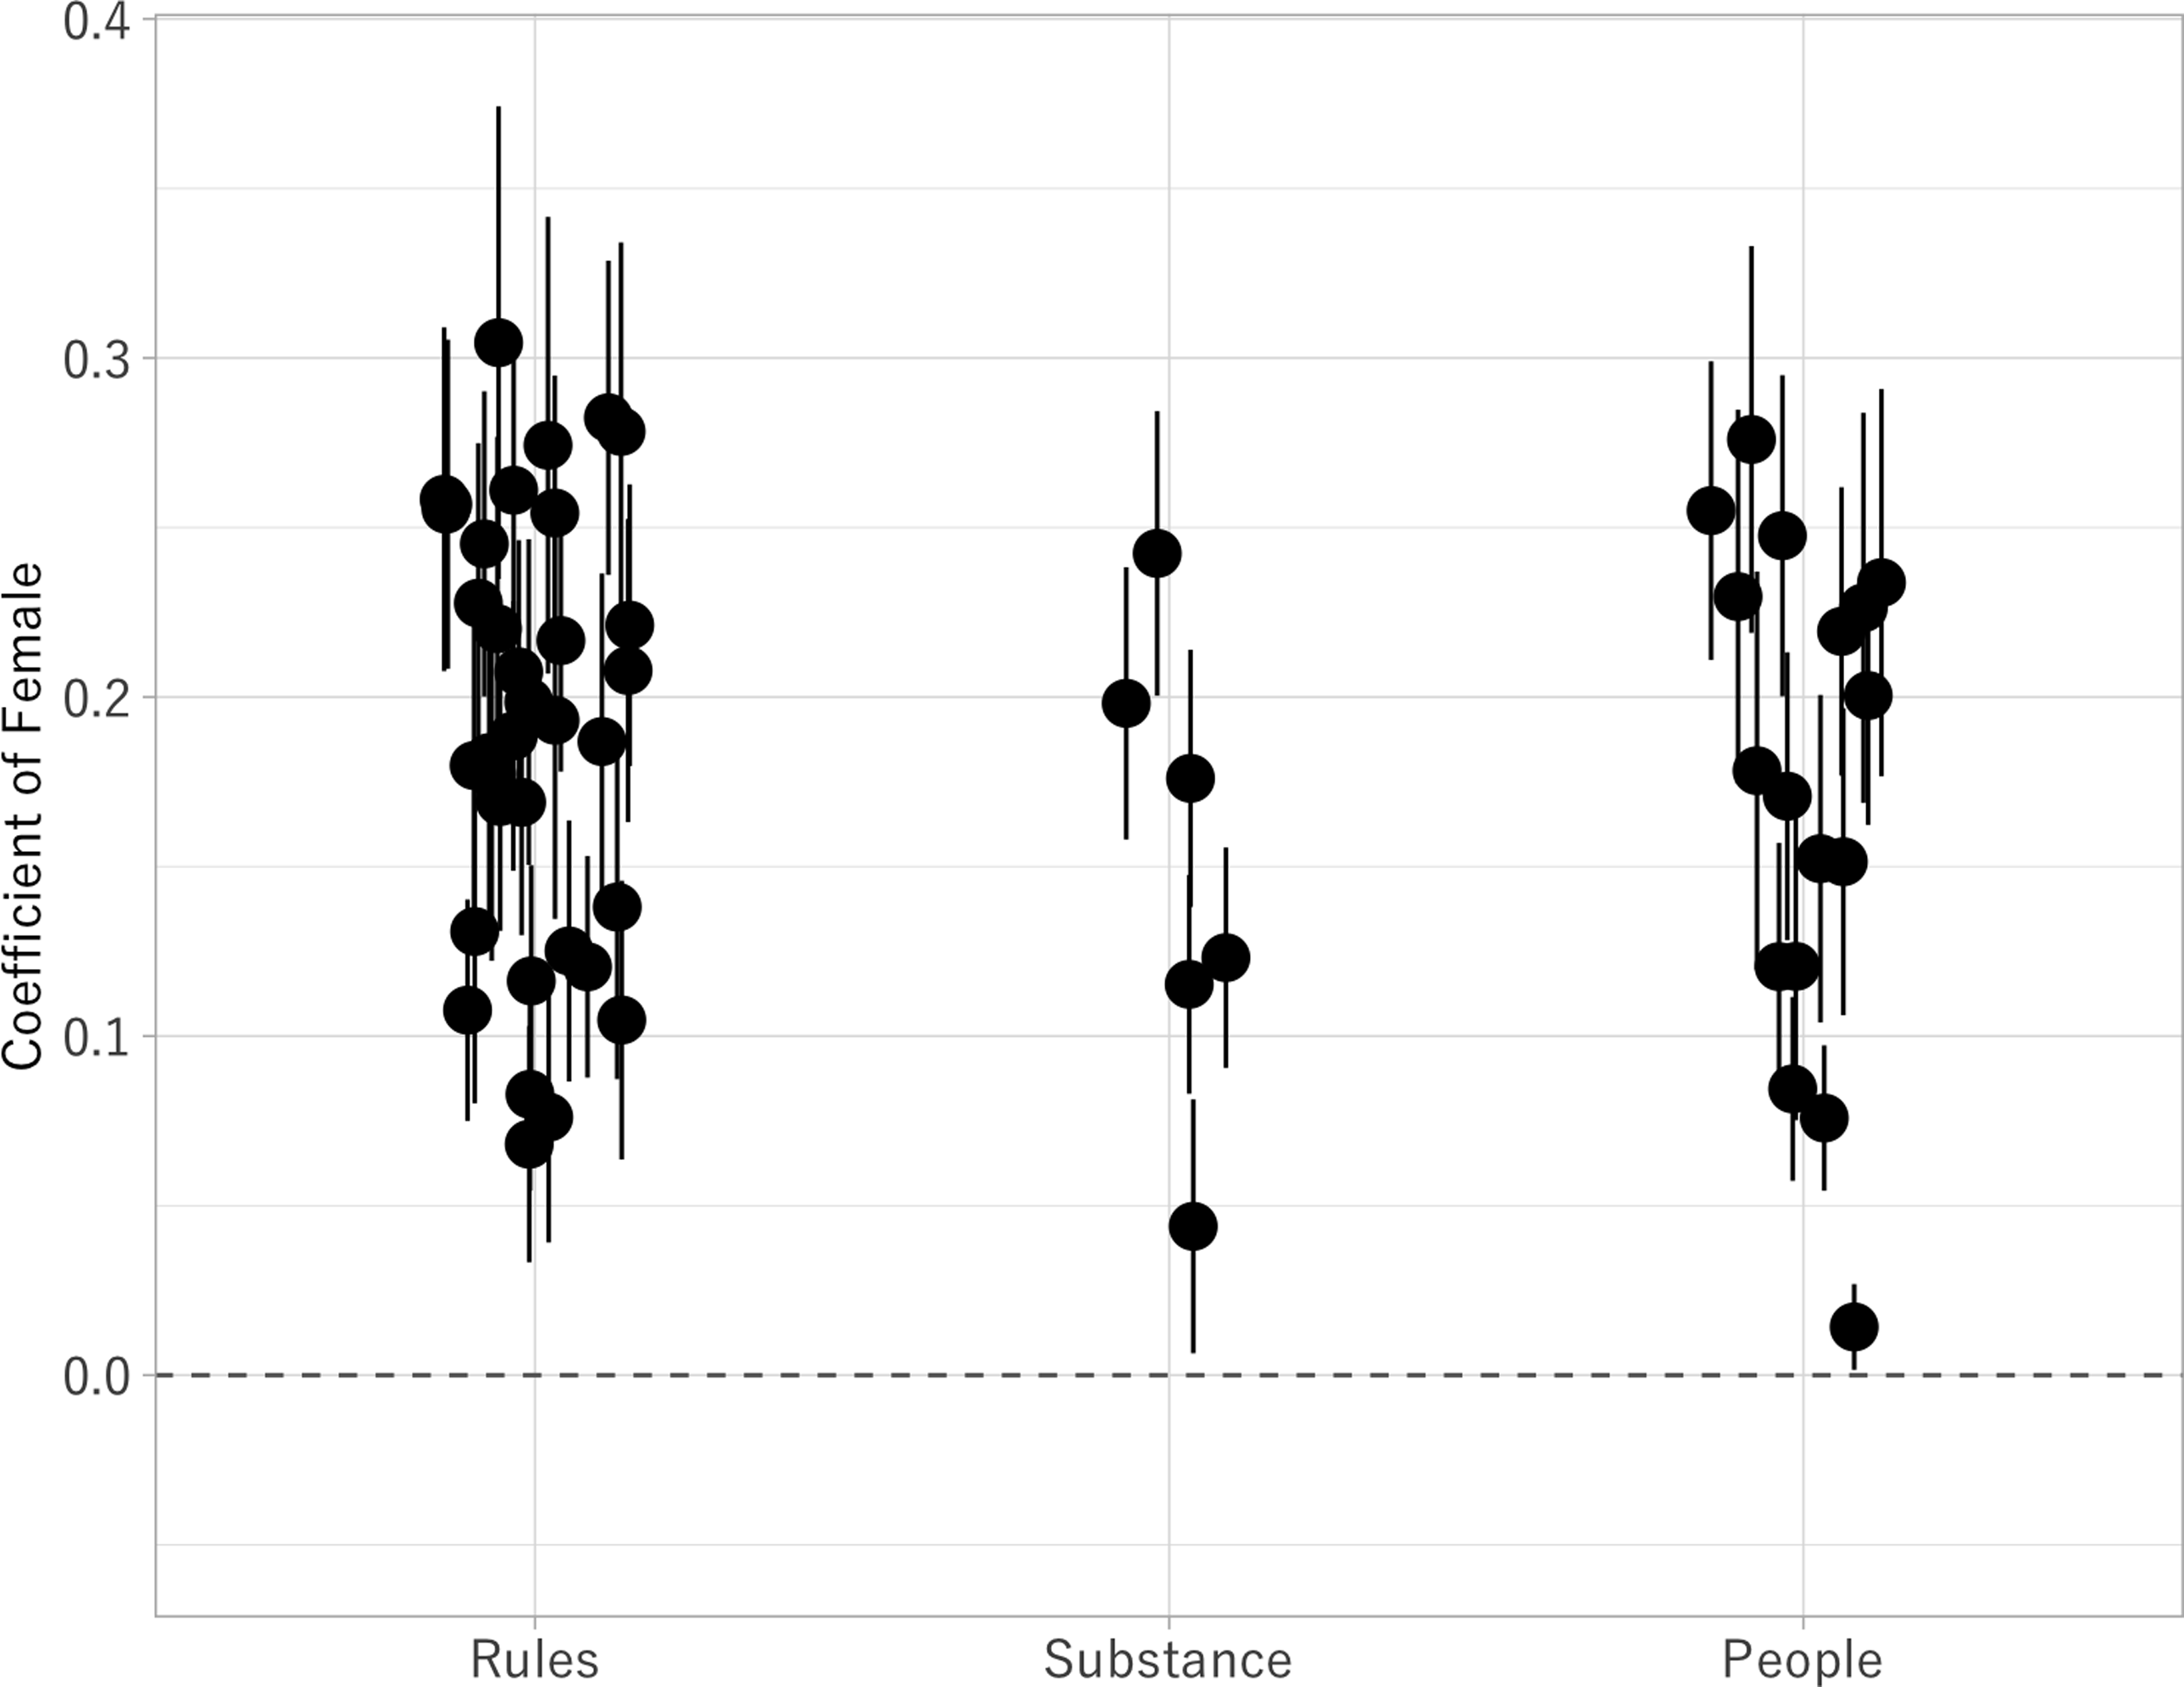
Figures 4 and 5 focus on gender differences in the propensity to choose DK, rather than on differences in correct responses. Using the same regression framework as in the previous analyses, these figures plot the estimated coefficient for a female indicator from models in which the outcome variable equals one if a respondent selected DK. Figure 4 presents results from the 2024 and 2025 online surveys (black circles for 2024 and black triangles for 2025), while Figure 5 reports parallel estimates from probability-sample surveys conducted between 2000 and 2018. Across nearly all knowledge items and survey waves, women are significantly more likely than men to select DK, and this pattern is remarkably stable over time, across survey modes, and across types of knowledge items.Footnote 6
Gender gap in selecting ‘Don’t Know’ in 2024 and 2025.
Note: The gender gap is estimated by regressing the outcome variable for DK responses (=1) on the female indicator (=1) for each knowledge item. The circles represent the coefficient sizes for the female indicator, with 95% confidence intervals. The data were obtained from the 2024 and 2025 surveys.

Gender gap in selecting ‘Don’t Know’ between 2000 and 2018.
Note: The gender gap is estimated by regressing the outcome variable for DK responses (=1) on the female indicator (=1) for each knowledge item. The circles represent the coefficient sizes for the female indicator, with 95% confidence intervals. The data were obtained from 15 surveys between 2000 and 2018.

Next, we examine how the use of women-related knowledge items and the removal of the DK option jointly shape observed gender gaps. To do so, we rely on an original online survey administered in March 2025. Respondents were drawn from the registered panel of Rakuten Insight, Inc., with quotas applied so that the distribution of age, gender, and region matches the 2020 Population Census. The survey included eight political knowledge items, demographic questions, and an attention check. Nearly 90 percent of respondents passed the attention check. After excluding those who failed the check and those who remained on the questionnaire for more than 30 minutes, the final analytic sample consists of 1,970 respondents.
The eight knowledge items are divided into two categories. The first category consists of conventional political knowledge items covering the rules of the game, the substance of politics, and people and parties. The second category consists of women-related items, including questions on women’s suffrage, maternity leave, female politicians, and health policy (Delli Carpini and Keeter Reference Delli Carpini and Keeter1996; Dolan, Reference Dolan2011; Kraft and Dolan, Reference Kraft and Dolan2023).
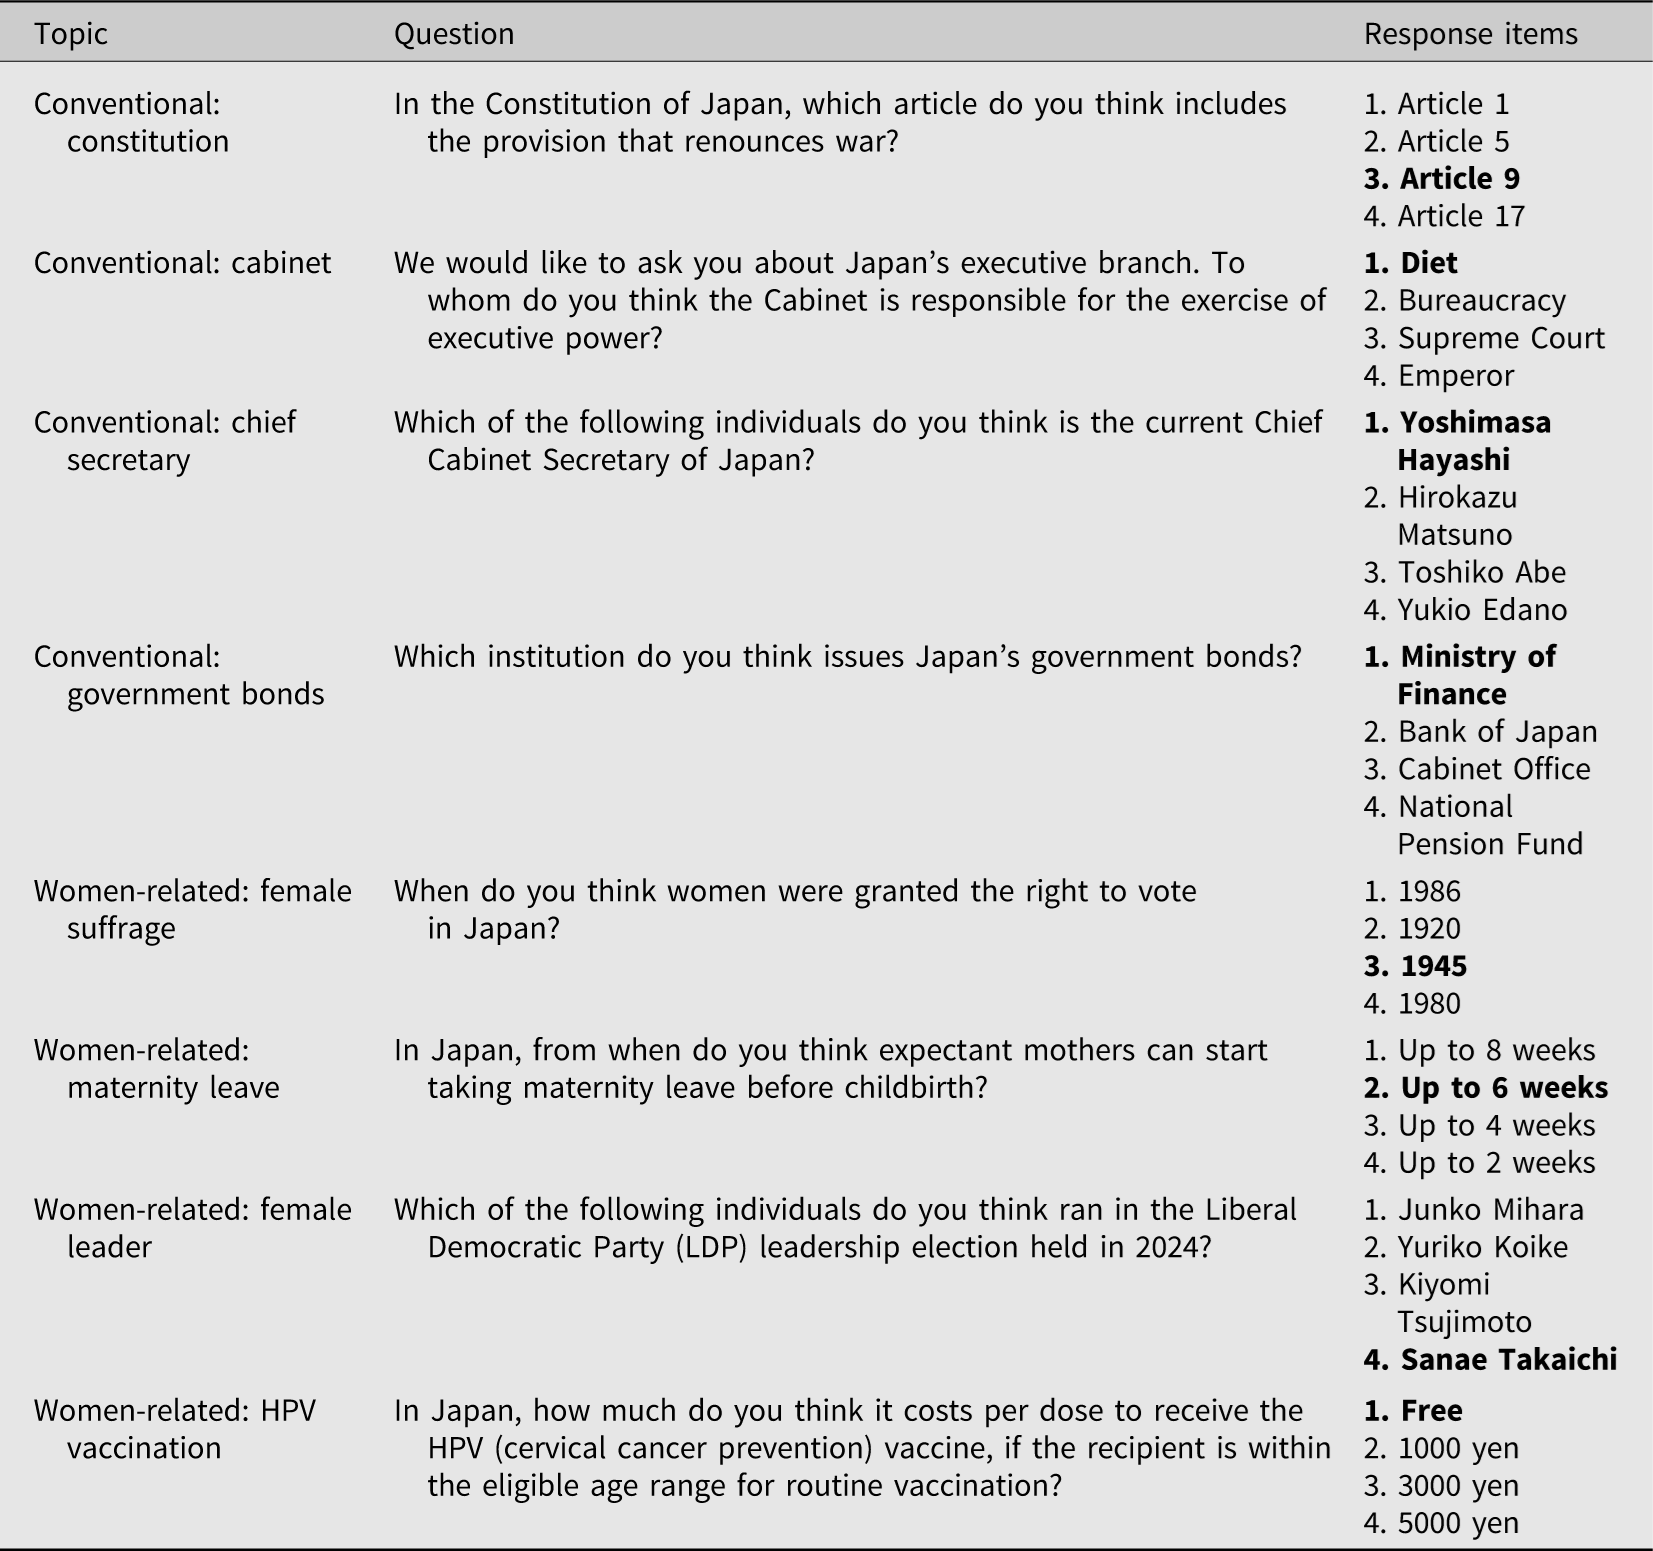
The exact wording of the questions and response options is reported in Table 3. Following Barabas et al. (Reference Barabas, Jerit, Pollock and Rainey2014), we selected four items in each category so as to cover static–general, surveillance–general, static–policy, and surveillance–policy facts. The order of the questions was randomized.
Knowledge items in the survey experiment

Table 3. Long description
A table with three columns: Topic, Question, and Response items. The table has 8 rows, each representing a different survey question. The first column lists the topic categories, including Conventional: constitution, cabinet, chief secretary, government bonds, and Women-related: female suffrage, maternity leave, female leader, HPV vaccination. The second column contains specific questions related to these topics. The third column lists the response items for each question. For example, the first row asks about the article in the Constitution of Japan that renounces war, with response items including Article 1, Article 53, Article 9, and Article 17. The table provides a structured overview of the survey questions and possible answers.
Note: Although DK response option was offered in the DK-included and DK-discouraged groups, this option is omitted from the table for brevity. The correct answer is shown in bold.
We experimentally varied the response options by creating three versions of the questionnaire, which were randomly assigned to respondents (Miller and Orr, Reference Miller and Orr2008). In all versions, respondents were asked to select the correct answer from four substantive options. However, the availability of the DK option differed across conditions. In the first condition, the DK option was included for all knowledge questions (‘DK-included’). In the second condition, the DK option was included, but respondents were shown the message, ‘Even if you are not certain, please avoid choosing ‘don’t know’ and give your best guess’, after each question (‘DK-discouraged’). In the third condition, the DK option was not provided (‘DK-excluded’). All other aspects of the questionnaire were identical across conditions. To reduce the likelihood of online lookups (Clifford and Jerit, Reference Clifford and Jerit2016; Höhne et al., Reference Höhne, Cornesse, Schlosser, Couper and Blom2021; Munzert et al., Reference Munzert, Ramirez-Ruiz, Barberá, Guess and Yang2024), respondents were shown a message at the beginning of the survey instructing them to answer based on what they currently knew without consulting external sources (Style and Jerit, Reference Style and Jerit2021; DeBell, Reference DeBell2022; Graham, Reference Graham2024).
Using these data, we estimate linear probability models for each knowledge item, where the outcome variable indicates whether the respondent answered correctly. Each model includes indicators for gender, the DK condition, and their interaction, as well as controls for age and education. Rather than focusing on individual coefficients, we compute predicted gender gaps – defined as the difference between women’s and men’s predicted probabilities of answering correctly – under each experimental condition. These quantities are estimated as average marginal comparisons (Arel-Bundock et al., Reference Arel-Bundock, Greifer and Heiss2024) and are reported with 95 percent confidence intervals. The full regression results are reported in Table A6 in the Appendix.
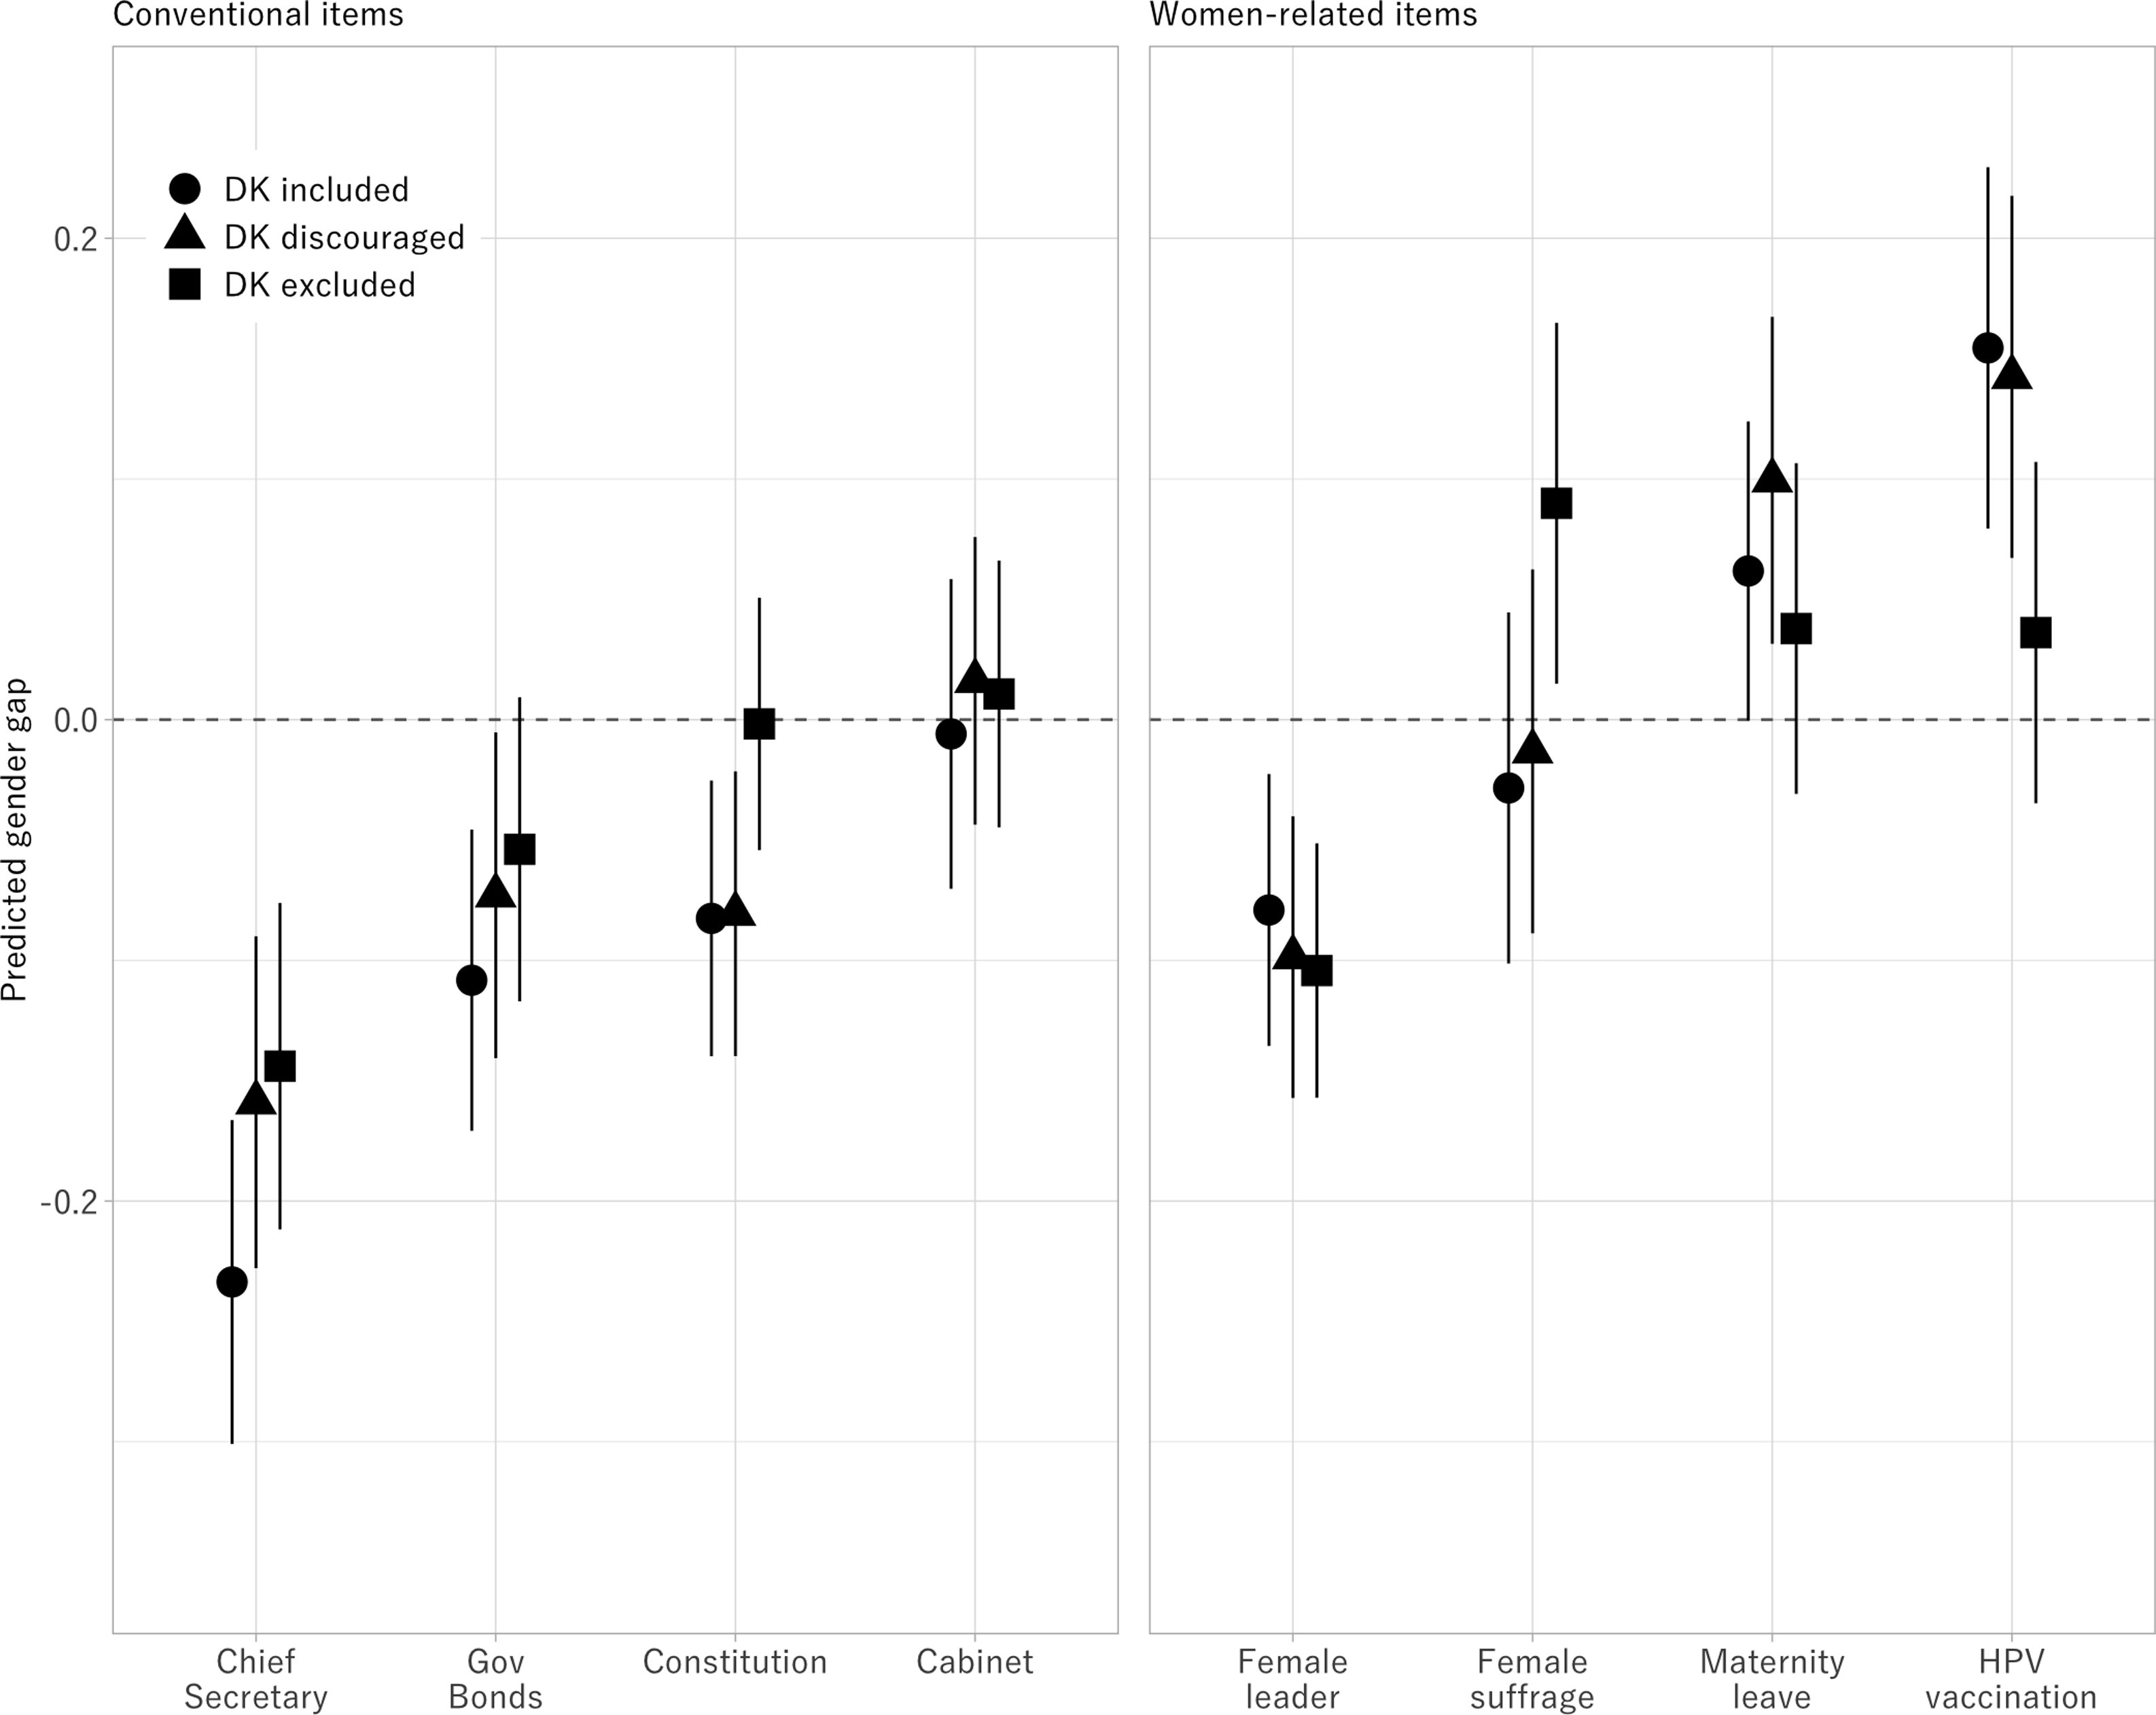
Figure 6 displays the predicted gender gaps for conventional items (left panel) and women-related items (right panel) across the three DK conditions. The vertical axis represents the difference in predicted probabilities of a correct response between women and men, with negative values indicating a male advantage and positive values indicating a female advantage. The horizontal reference line at zero denotes the absence of a gender gap. Black circles, triangles, and squares represent the predicted gaps under the DK-included, DK-discouraged, and DK-excluded conditions, respectively.
Gender gap in knowledge in conventional and women-related domains with and without the DK option.
Note: The figure reports predicted gender gaps in political knowledge – the difference between women’s and men’s predicted probabilities of answering correctly – estimated from linear probability models that include gender, experimental conditions regarding the availability of a DK option, and their interactions, with controls for age and education. Negative values indicate a male advantage, while positive values indicate a female advantage. The left panel presents results for conventional political knowledge items, and the right panel presents results for women-related items. Black circles, triangles, and squares represent predicted gaps under the DK-included, DK-discouraged, and DK-excluded conditions, respectively. Vertical bars denote 95% confidence intervals, and the horizontal reference line at zero indicates the absence of a gender gap.

For conventional items, shown in the left panel, a clear male advantage emerges when the DK option is explicitly included. Across all conventional items, women’s predicted probabilities of answering correctly are substantially lower than those of men, closely mirroring the gender gaps documented in prior research using standard political knowledge measures.
However, the magnitude of these gaps decreases noticeably as the response format changes.Footnote 7 Under the DK-discouraged condition, and even more so under the DK-excluded condition, the gender gaps shrink across most conventional items. In several cases, the confidence intervals overlap with zero, indicating that the gap is no longer statistically distinguishable from zero. This pattern suggests that a nontrivial portion of the gender gap observed for conventional political knowledge items reflects gendered differences in response behaviour, particularly women’s greater propensity to select DK under uncertainty, rather than differences in underlying knowledge alone.
A more differentiated pattern emerges for women-related items, shown in the right panel. Importantly, not all items in this category behave similarly. The item concerning the female candidate in the LDP leadership election continues to display a noticeable gender gap across DK conditions. Although this question involves a female political figure, it closely resembles conventional knowledge items centered on elite competition and party leadership. The persistence of a gender gap in this domain suggests that simply asking about women in elite politics does not automatically eliminate gender differences in knowledge.
In contrast, gender gaps are substantially smaller for items related to social institutions and policy domains more directly connected to women’s lived experiences, such as maternity leave and HPV vaccination. These findings indicate that what matters is not merely whether a question concerns women, but whether it taps into elite-centered political knowledge or into policy domains embedded in everyday social roles. Gender gaps remain more pronounced in the former and are attenuated in the latter. These results clearly demonstrate heterogeneity across women-related items.
Turning to the role of measurement, the magnitude of gender differences in women-related domains is not entirely invariant across DK conditions.Footnote 8 For maternity leave and HPV vaccination, discouraging or excluding the DK option slightly reduces the female advantage. This suggests that measurement effects are not absent in these domains. One possible interpretation is that when the DK option is removed, some men provide informed guesses rather than purely random responses, leading to modest increases in their correct response rates. Even so, the overall pattern remains distinct from that observed for conventional items, where DK inclusion systematically amplifies male advantage.
A key concern when interpreting the gap reduction under the DK-excluded condition is whether the increase in women’s correct response rates reflects the expression of genuine partial knowledge or is simply a structural consequence of forced guessing. In Japan’s information-rich environment, characterized by high levels of basic education and dense media coverage of politics, respondents who ordinarily select DK are unlikely to have had no exposure to political information. They are more plausibly holders of partial knowledge who are reluctant to commit to an answer under uncertainty. Tsai and Lin (Reference Tsai and Lin2017) formalize this distinction by decomposing correct responses into a knowledge component and an ability-dependent guessing component: even respondents who do not fully know the correct answer may guess it correctly at rates that increase with their underlying knowledge level. A key question, therefore, is whether women’s forced responses under the DK-excluded condition reflect informed guessing grounded in partial knowledge, or blind guessing that merely raises correct-response rates by chance. If the former, the gap reduction indicates that women possess political knowledge they are otherwise reluctant to express under the DK-included condition; if the latter, the reduction is an artifact of forced choice rather than evidence of suppressed knowledge. Distinguishing these two explanations is therefore essential to the validity of our interpretation that the DK manipulation captures differences in the expression of knowledge.
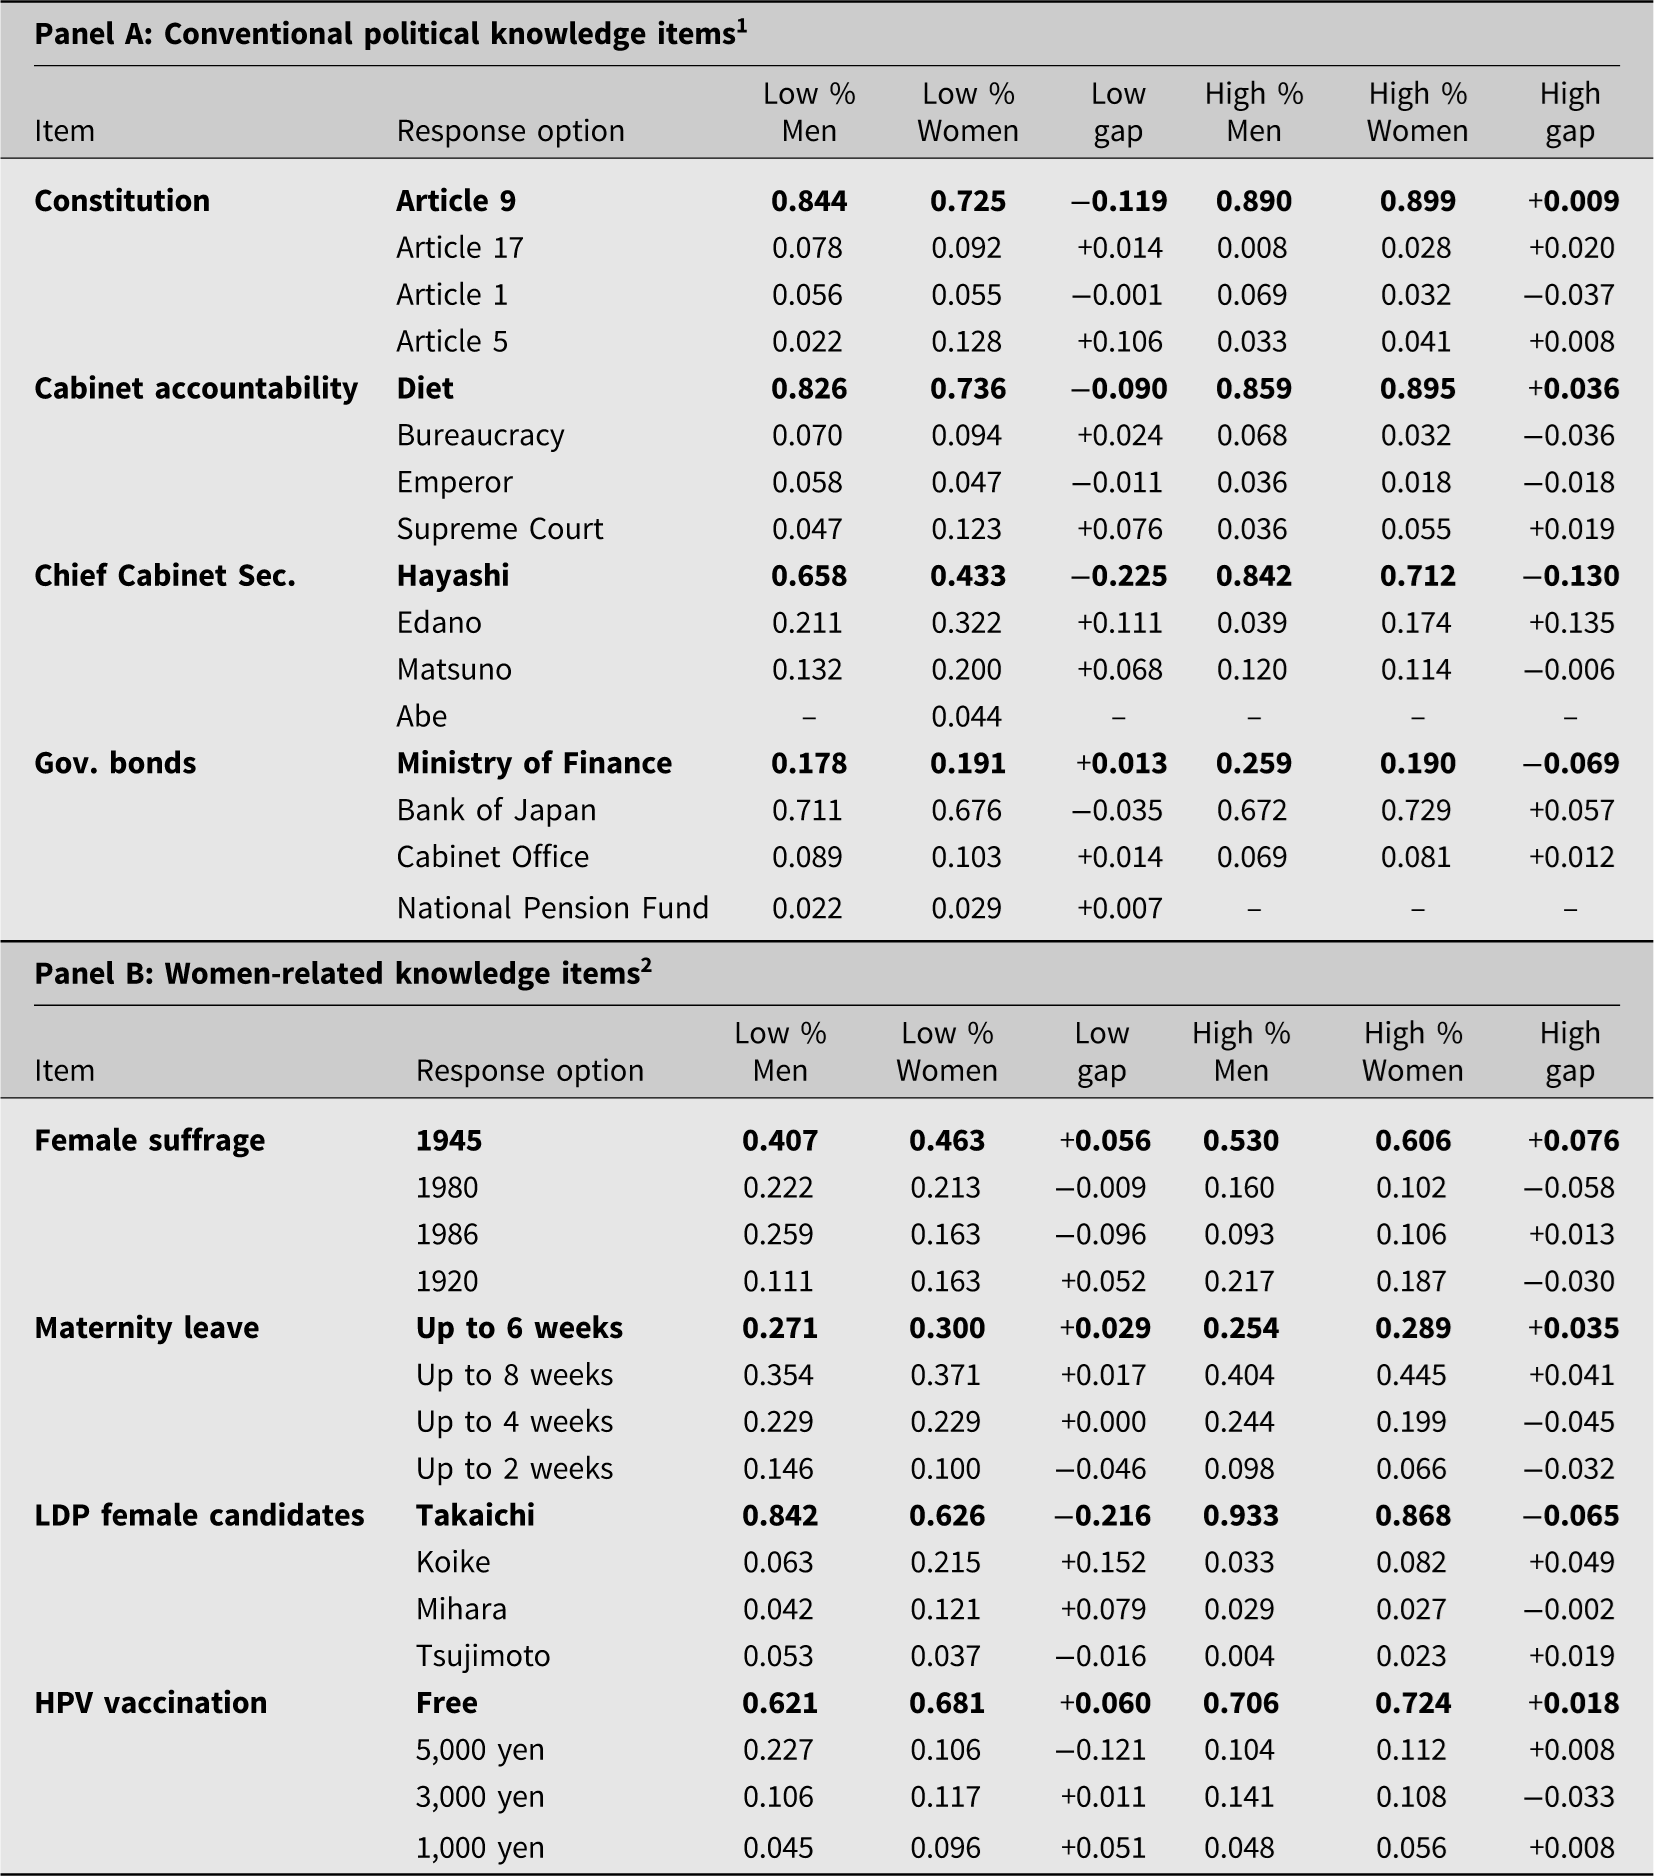
To address this concern, we examine the distribution of response options chosen by gender and knowledge level under the DK-excluded condition (Table 4). For each item, we classify respondents into Low (0–3) and High (4–7) knowledge groups using a leave-one-out score – the sum of correct responses on the remaining seven items – to avoid endogeneity between the item in question and the knowledge measure. Within each item-by-knowledge-group cell, we report the share of male and female respondents choosing each response option, including both the correct answer and each distractor.
Response option distribution by gender and knowledge level

Table 4. Long description
A table comparing political and women-related knowledge items by gender and knowledge level. The table is divided into two panels: Panel A and Panel B. Panel A focuses on conventional political knowledge items, while Panel B focuses on women-related knowledge items. Each panel lists items, response options, and the percentage of men and women who chose each response option, categorized into low and high knowledge groups. Panel A includes items such as Constitution, Cabinet accountability, Chief Cabinet Secretary, and Government bonds. Panel B includes items such as Female suffrage, Maternity leave, LDP female candidates, and HPV vaccination. Each row provides the percentage of men and women who selected each response option, along with the gap between these percentages.
1 Note: DK-excluded condition only. Correct-answer rows are in bold. Low = respondents with 0–3 correct on the remaining 7 items (leave-one-out score); High = 4–7 correct. % Men / % Women: share of male/female respondents choosing each option. Gap = % Women − % Men (positive = female advantage). Sample sizes (N Men/N Women) – Constitution (art.): Low M/F = 90/109, High M/F = 245/217; Cabinet accountability: Low M/F = 86/106, High M/F = 249/220; Chief Cabinet Sec.: Low M/F = 76/90, High M/F = 259/236; Gov. bonds (ministry): Low M/F = 45/68, High M/F = 290/258.
2 Note: DK-excluded condition only. Correct-answer rows are in bold. Low = respondents with 0–3 correct on the remaining 7 items (leave-one-out score); High = 4–7 correct. % Men/% Women: share of male/female respondents choosing each option. Gap = % Women − % Men (positive = female advantage). Female suffrage (year): Low M/F = 54/80, High M/F = 281/246; Maternity leave (wks): Low M/F = 48/70, High M/F = 287/256; LDP female candidates: Low M/F = 95/107, High M/F = 240/219; HPV vaccination (cost): Low M/F = 66/94, High M/F = 269/232.
Table 4 reports three major findings. First, for most conventional items, men and women who answer incorrectly converge on the same modal wrong option at broadly similar rates: on the government-bonds item, 71% of men and 68% of women in the Low knowledge group selected Bank of Japan (far above the 33% expected under uniform random guessing across three wrong options), and the same pattern holds in the High group (67% vs. 73%); on the Chief Cabinet Secretary item, Edano was the most common wrong choice for both men and women in both knowledge groups. This convergence on the same plausible distractor at rates well above chance and at similar levels across genders indicates that men and women are drawing on similar partial knowledge when forced to answer, rather than guessing randomly or from entirely different information sets.
Second, once knowledge level is conditioned on, the gender gap in correct-response rates largely disappears for most conventional items: for the Constitution item the gap narrows from −12 percentage points in the Low group to + 1 pp in the High group; for Cabinet accountability, from −9 pp to +4 pp. If the gap reduction were driven by forced random guessing, we would expect no such attenuation – random guessing yields no systematic gender difference conditional on knowledge level. The convergence of incorrect responses and the attenuation of the correct-response gap jointly support the interpretation that women in the DK-excluded condition are expressing partial knowledge they already hold.
Third, where gender gaps in correct responses persist after conditioning – Chief Cabinet Secretary (−23 pp in Low, −13 pp in High) and the LDP female-candidate item (−22 pp in Low, −7 pp in High) – the pattern of incorrect responses diverges by gender in a theoretically meaningful way: women are substantially more likely to select the names of salient female politicians (Koike on the LDP item), while men are more likely to select other elite figures. Rather than undermining the knowledge-expression interpretation, this divergence reflects gender-differentiated retrieval cues; both genders are engaging in informed guessing, but drawing on different political associations. This pattern aligns with Tsai and Lin’s (Reference Tsai and Lin2017) framework and further supports the conclusion that DK respondents possess and mobilize partial knowledge rather than guessing blindly. A formal model-based test using a Bayesian 2PL-G IRT model corroborates these descriptive findings: after controlling for the guessing component, the gender gap in latent political knowledge still narrows under DK-excluded conditions (Δgap = +0.116 scale units, P(gap shrinks) = 0.775). Full details are reported in Table A7 and Figures A2 and A3 in the Appendix.Footnote 9
8. Conclusions
This study examined gender gaps in political knowledge in Japan using multiple survey datasets that span different time periods, survey modes, and measurement strategies. Across a wide range of conventional items, Japanese women answered correctly at rates approximately 10 percentage points lower than men – a magnitude comparable to those observed in other democracies and persistent over time, and one that does not make Japan an outlier in comparative perspective. Yet the magnitude, and in some cases the direction, of the observed gap depends critically on how political knowledge is measured. The gap narrows considerably, and occasionally reverses, for items in domains in which women exhibit strong interest or experiential familiarity, and it also shrinks substantially for conventional items when the DK option is discouraged or excluded. Taken together, a nontrivial portion of the gap reflects gendered patterns in the expression of knowledge rather than differences in underlying knowledge acquisition alone.
These results contribute to the literature on female representation and political knowledge by highlighting the role of issue salience. Prior work suggests that higher levels of female representation can narrow the gender gap either by shaping political socialization during formative years (Dassonneville and McAllister, Reference Dassonneville and McAllister2018) or by increasing women’s willingness to provide answers (Pereira, Reference Pereira2019). These findings would lead us to expect smaller gender gaps on items concerning female politicians. However, as shown in Figure 6, gender gaps persist for items such as the female candidate in the 2024 LDP leadership election, even when the DK option is excluded or discouraged, while no gap is observed for items in policy domains closely tied to women’s lived experiences, such as maternity leave and HPV vaccination. These results suggest that female representation itself may not be sufficient to reduce gender gaps unless it translates into domains that are salient in women’s everyday lives. From this perspective, the emergence of Sanae Takaichi as Japan’s first female prime minister does not necessarily imply a reduction in the gap: to the extent that such representation remains situated within elite political domains and does not substantially raise the salience of issues connected to women’s lives, its impact on gender gaps in political knowledge is likely to remain limited.
Our analysis also contributes to a growing literature on the gendered consequences of survey design. Prior research has shown that women are more likely than men to select a DK option when one is offered, and that removing or discouraging this option narrows the observed gender gap. Our survey experiment provides the first systematic evidence that this pattern holds in Japan, where the media environment, educational system, and gendered norms of political communication differ from those in the Western democracies in which prior work has been conducted. These results carry a concrete implication for the measurement of political knowledge: conventional batteries that combine elite-centered items with a DK option are likely to understate women’s political knowledge in Japan. We therefore encourage researchers who study political knowledge in Japan to include gender-balanced item batteries and consider carefully the inclusion of a DK option. Doing so would help disentangle gender differences in the expression of political knowledge from differences in its acquisition and produce estimates that are more faithful to what citizens actually know.
Beyond these theoretical and methodological implications, our findings take on their full significance in light of the democratic stakes outlined at the outset of the paper. Voters with greater political knowledge are more likely to participate in elections and to form judgements consistent with their own interests. A gender gap in political knowledge is therefore not merely a descriptive curiosity but an equity concern: to the extent that women are less likely to express political knowledge, their voices are correspondingly less likely to be registered in electoral participation and policy preferences. At the same time, our results carry a more hopeful implication. Because a substantial share of the gap in Japan reflects the expression rather than the acquisition of knowledge, and because the gap nearly disappears for policy domains tied to women’s lived experiences, the conditions for narrowing gendered inequalities in political voice are more favorable than conventional batteries would suggest.
Several limitations point to directions for future research. First, although this study draws on unusually rich data, it relies primarily on factual, quiz-style measures of political knowledge. Future research should explore alternative measurement formats, such as open-ended questions or qualitative assessments, and examine how gender differences manifest across a broader range of policy domains (Ferrin et al., Reference Ferrin, Fraile and García-Albacete2018; Kraft, Reference Kraft2024). Extending similar measurement-sensitive analyses to other East Asian democracies would further clarify whether the patterns observed in Japan generalize to comparable political and social contexts. Second, part of the analysis relies on online surveys, which may influence the absolute magnitude of estimated gender gaps due to panel composition or response behaviour. While the direction and nature of the measurement effects identified in this study are unlikely to be driven solely by survey mode, future work should continue to examine these effects using alternative survey designs and data sources, including probability-based online panels and mixed-mode surveys. Such efforts are essential for developing more inclusive and accurate assessments of political knowledge and, ultimately, for advancing our understanding of gendered political inequality.
Supplementary material
The supplementary material for this article can be found at https://doi.org/10.1017/S1468109926100401.
Data availability statement
All data used in this study are shared at Harvard Dataverse (https://dataverse.harvard.edu/dataset.xhtml?persistentId=doi%3A10.7910%2FDVN%2FAFYKUZ).
Acknowledgements
This research was supported by JSPS KAKENHI Grant Number 23H05426. We would like to express our sincere gratitude to Ikuma Ogura and three anonymous reviewers for their valuable comments for this paper.
Competing interests
There is no competing interest to declare.


 Open access

